Article

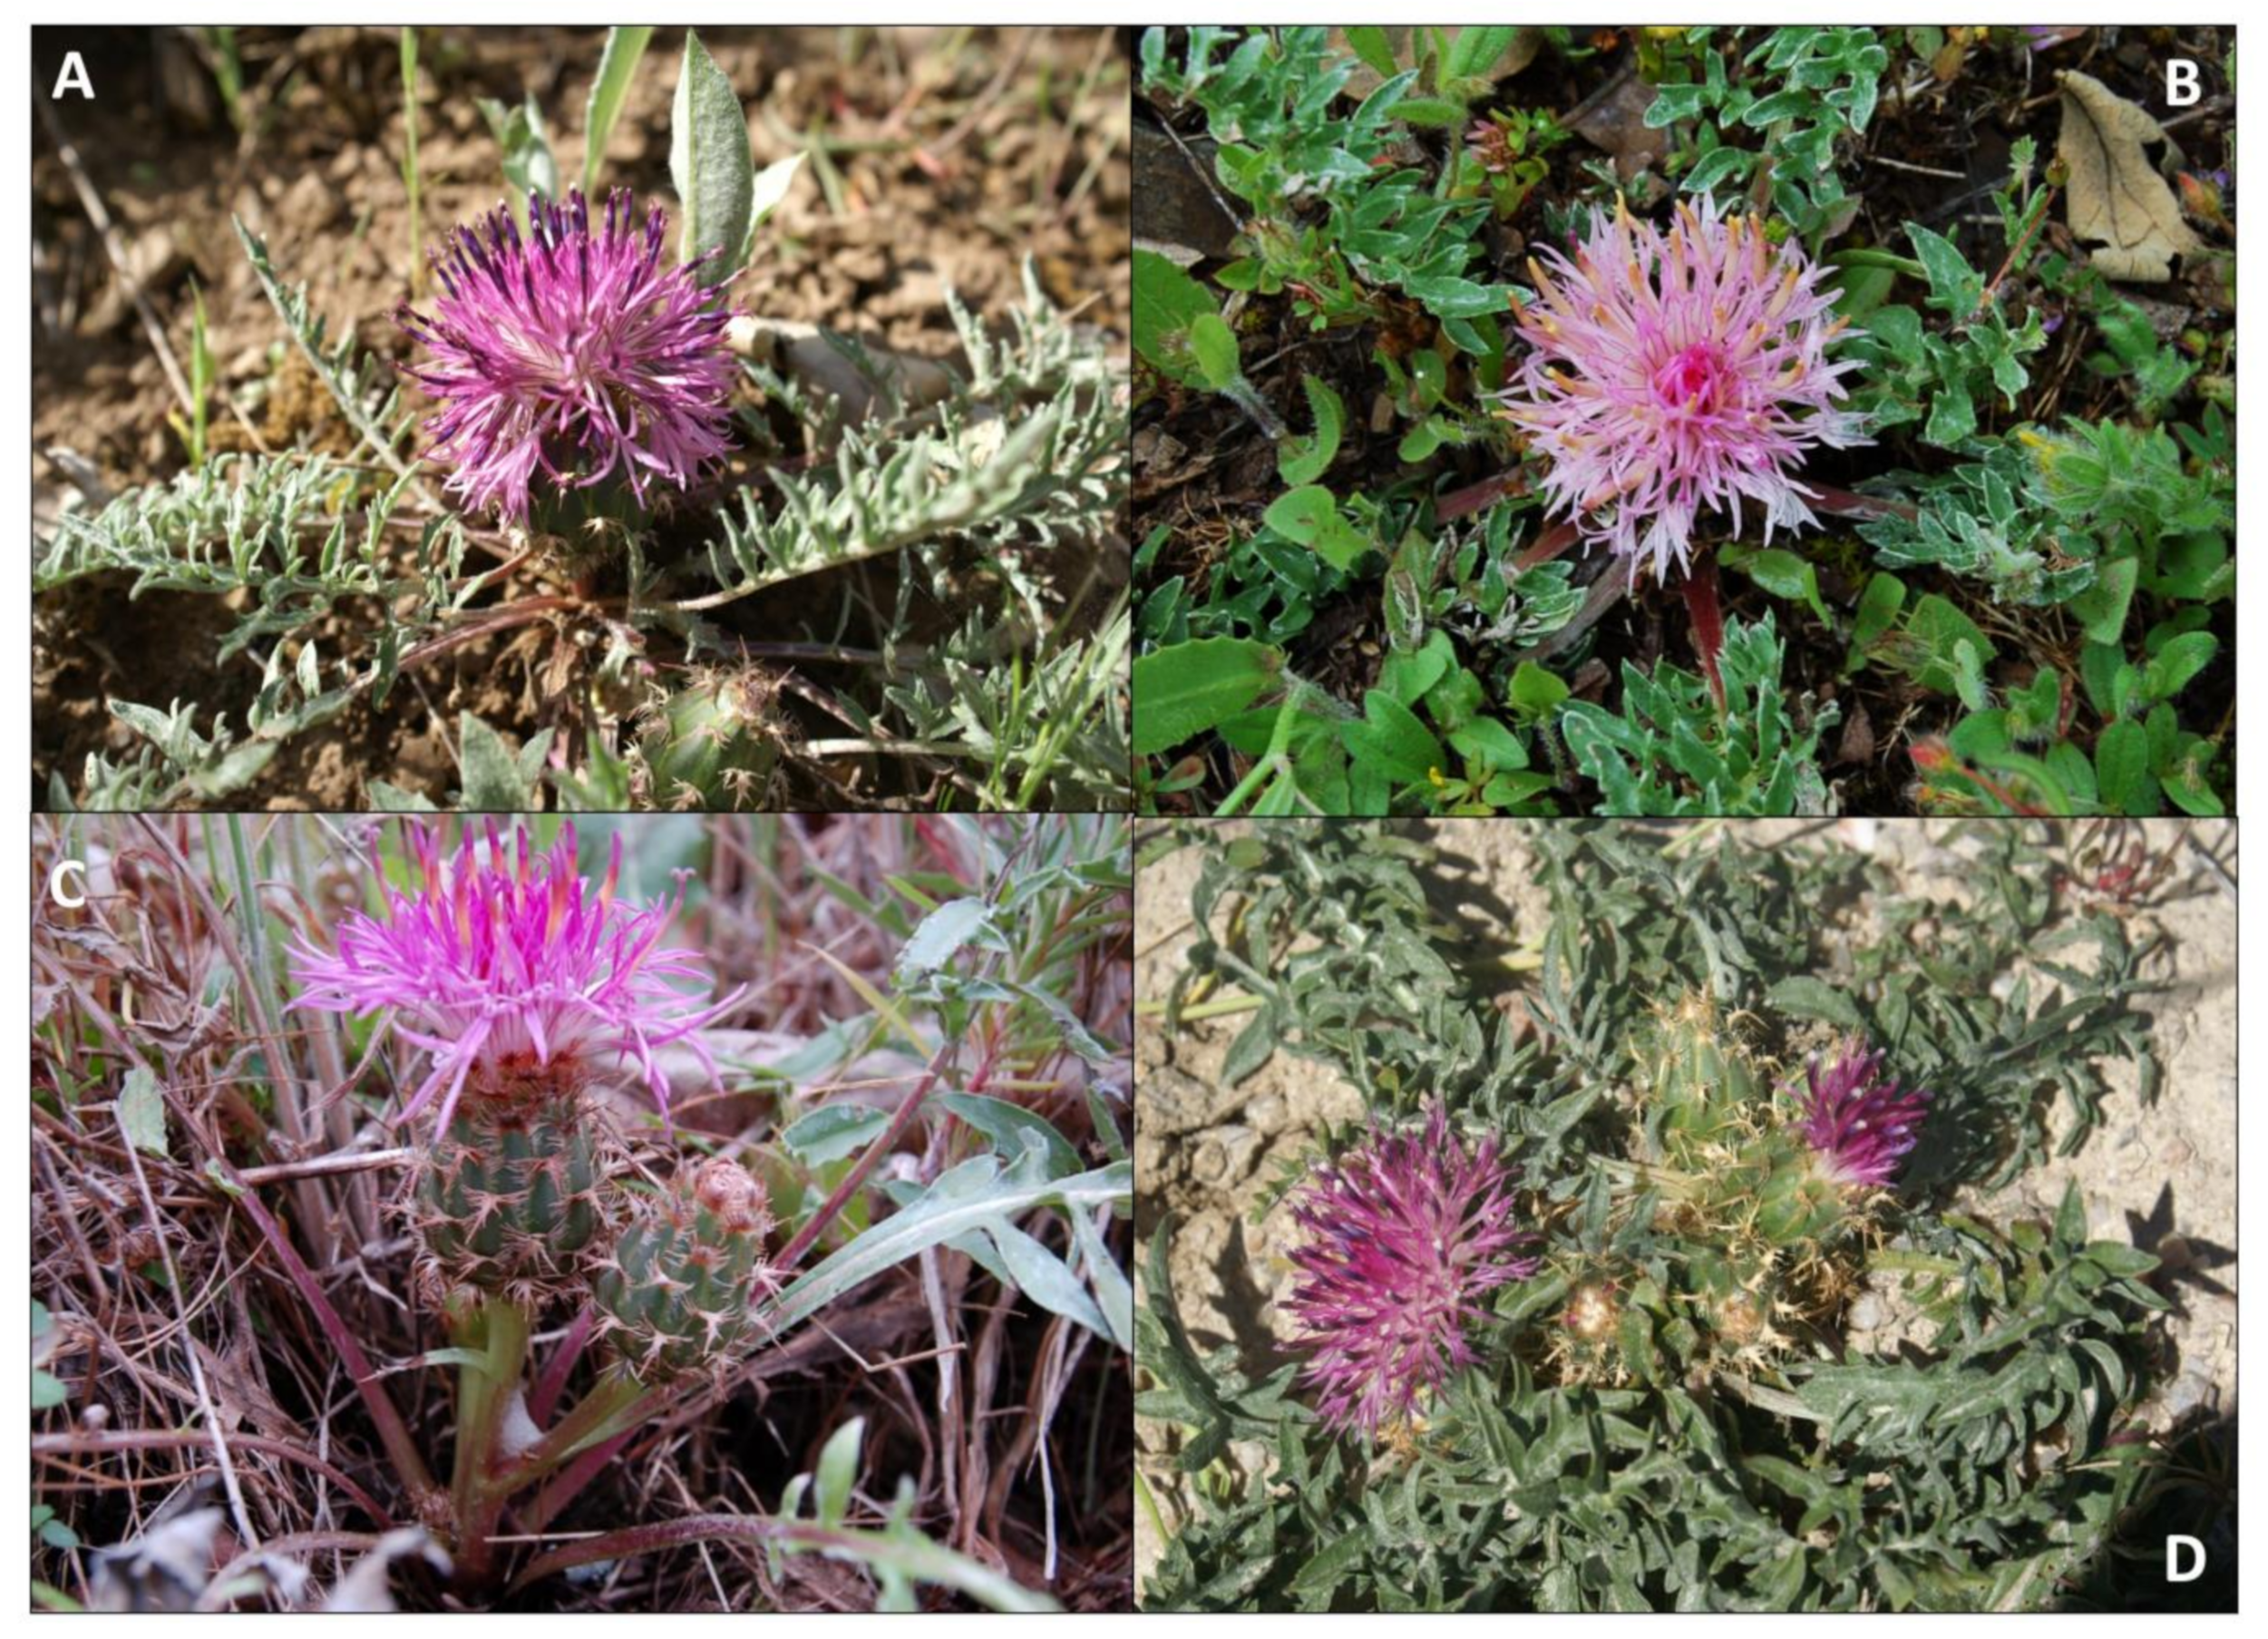
Genesis, Evolution, and Genetic Diversity of the Hexaploid, Narrow Endemic Centaurea tentudaica

by
Lucía D. Moreyra
1,
Francisco Márquez
2,
Alfonso Susanna
1,
Núria Garcia-Jacas
1,
Francisco María Vázquez
2 and
Jordi López-Pujol
1,*
1
Botanic Institute of Barcelona (IBB, CSIC-Ajuntament de Barcelona), Pg. del Migdia, s. n., 08038 Barcelona, Spain
2
Department of Forest Production and Vegetal Biodiversity, Institute of Agricultural Research “Finca La Orden Valdesequera” (Cicytex), A5 km 372, 06187 Guadajira, Spain
*
Author to whom correspondence should be addressed.
Submission received: 21 December 2020 / Revised: 4 February 2021 / Accepted: 5 February 2021 / Published: 9 February 2021
(This article belongs to the Special Issue Conservation Genetics and Biogeography of Seed Plant Species)

Abstract

:
Within the genus Centaurea L., polyploidy is very common, and it is believed that, as to all angiosperms, it was key in the history of its diversification and evolution. Centaurea tentudaica is a hexaploid from subsect. Chamaecyanus of unknown origin. In this study, we examined the possible autopolyploid or allopolyploid origin using allozymes and sequences of three molecular markers: nuclear-ribosomic region ETS, and low-copy genes AGT1 and PgiC. We also included three species geographically and morphologically close to C. tentudaica: C. amblensis, C. galianoi, and C. ornata. Neighbor-Net and Bayesian analyses show a close relationship between C. amblensis and C. tentudaica and no relationship to any of the other species, which suggest that C. tentudaica is an autopolyploid of C. amblensis. Allozyme banding pattern also supports the autopolyploidy hypothesis and shows high levels of genetic diversity in the polyploid, which could suggest multiple origins by recurrent crosses of tetraploid and diploid cytotypes of C. amblensis. Environmental niche modeling was used to analyze the distribution of the possible parental species during the present, Last Glacial Maximum (LGM), Last Interglacial Period (LIG), and Penultimate Glacial Maximum (PGM) environmental conditions. Supporting the molecular suggestions that C. tentudaica originated from C. amblensis, environmental niche modeling confirms that past distribution of C. amblensis overlapped with the distribution of C. tentudaica.

1. Introduction

The role of polyploidy and hybrid speciation in the origin of new species has been frequently studied and well documented in the last decades, particularly in angiosperms [1,2,3,4]. The occurrence of polyploidy has played a very important role in the appearance and diversification of regulatory genes, emphasizing its role in plant evolution. Recent studies suggest that all angiosperms descend from a paleopolyploidization event that gave place to key innovations, securing its ancient high rate of diversification [2,4]. Besides, after whole-genome duplication, genomes undergo several changes in genome size, genome structure, and epigenetic control, allowing them to have a very rapid evolution [4,5].
Two main mechanisms can cause polyploidy. The first one is known as autopolyploidy and occurs within a single species, although it can involve a cross between genetically differentiated populations. The origin of a new species from a whole-genome duplication event is a simple mechanism, because polyploidy acts as a reproductive barrier. When polyploids arise and mate with diploids, a prezygotic barrier usually develops, creating sterile aneuploid gametes. For this reason, polyploids are reproductively isolated from their parents [1], and they constitute new species, according to the biological [6] and evolutionary [7] concepts of species. The second mechanism that leads to a whole-genome duplication event is known as allopolyploidy and occurs by interspecific hybridization of two different species [3,5]. It has been suggested that whole-genome duplication solves the incompatibility problems after interspecific hybridization that are observed in homoploid hybrids ([5,8,9], and references therein).
Morphology often gives some hints on the hybrid origin of a species. However, molecular analyses are much more efficient: Besides detecting hybridization, they also can identify the parental species even when they have similar traits, and morphology alone does not determine the hybrid origin. Moreover, molecular data may reveal old hybridization events that are not evident from morphology, and they have detected some species as hybridogenic [10]. For this reason, specific molecular analyses focused on polyploidy have been developed in recent years, using especially nuclear-ribosomal regions like ITS and ETS, because there are very easy to amplify and show good resolution [11,12,13]. Low-copy genes are also used in phylogenetic and biogeographical studies because they have a higher rate of evolution compared to organellar genomes, are usually present in multiple independent loci, and show biparental inheritance. These genes are present in the genome with one to four copies and usually show great resolution, because they are not subject to concerted evolution [14]. Thus, they are ideal candidates for identifying the parental species of suspected hybrids [14,15]. Finally, codominant genetic markers, including allozymes and microsatellites, have been proved as very efficient in discriminating between the different types of polyploid hybrid speciation (i.e., auto- vs. allopolyploidy), mainly through the careful observation of banding patterns, e.g., References [16,17]. Besides, allozymes may be useful in determining genetic diversity [18].
When analyzing the hybrid origin of a species, both homoploid or polyploid, the historical distribution of parental taxa should be taken into account, because environmental conditions were different in the past (particularly during extreme climate events, such as the Last Glacial Maximum, LGM) and current distribution may not reflect their ancient distribution ([19], and references therein). As in other latitudes, some studies have suggested that climatic conditions of the LGM (ca. 20,000 years BP), and probably at other glacial maxima, could lead to a different distribution of plant species in the Iberian Peninsula compared to the present, shifting their area to lower latitudes [20]. The environmental conditions during glacial and interglacial periods could lead to cyclic changes of the distribution, in which some species expanded and contracted their ranges depending on their specifics requirements ([19], and references therein). For this reason, the southern peninsulas of Europe became important refugia for species that later colonized the north during the postglacial warming [21]. Ancient distribution of the possible parental species during glacial and interglacial periods would help us in explaining the current distribution of the hybrid species; for example, contact areas where parental species met could be far from their current range [21,22,23,24]. Tools as Ecological Niche Modeling (ENM) are very useful to detect the possible contact areas between the distributions of the suspected parental taxa in the past ([19], and references therein).
Within the genus Centaurea, there are several cases of homoploid hybridization, allopolyploidy and autopolyploidy. This is especially well documented in sect. Acrocentron (Cass) DC., including subsections Acrocentron and Chamaecyanus N. Garcia, Hilpold, Susanna, and Vilatersana [12,13,25,26,27,28]. For example, Centaurea ornata Willd. shows three ploidy levels: Diploids, tetraploids, and hexaploids (as C. saxicola Lag.); and Centaurea kunkelii N. Garcia is an endecaploid of allopolyploid origin [26]. In subsect. Chamaecyanus, Centaurea toletana Boiss. and Reut. shows diploid and tetraploid cytotypes by autopolyploidy, and a hexaploid cytotype of allopolyploid origin that is currently considered a different species, Centaurea argecillensis Gredilla [10].
An intriguing case of polyploidy is that constituted by Centaurea tentudaica (Rivas Goday) Rivas Goday and Rivas Mart. It is a hexaploid taxon with 2n = 6x = 60 [29] from subsect. Chamaecyanus, described for the first time by Rivas Goday (1964) [30] as a subspecies of Centaurea toletana. It was assigned the species rank by Rivas Martínez (1980) [31] and soon after Fernández-Casas and Susanna (1982) [32] considered it a variety of Centaurea amblensis Graells. Finally, Rivas Martínez (1988) [33] gave it the subspecies rank, Centaurea amblensis Graells subsp. tentudaica (Rivas Goday) Rivas Mart. Nowadays, there is some consensus in considering that it should be considered an independent species because it is hexaploid [29,34], while C. amblensis is tetraploid with 2n = 4x = 40 [35], and some morphological differences do exist [36]. Centaurea tentudaica has a very narrow distribution, as it only occurs in Sierra of Tudia, Badajoz, Spain [34,35]. The species has been evaluated as ‘Critically Endangered’ [CR; 29] because of its small range: The area of occupancy and extent of occurrence is below 1 and 2 km2, respectively. It shows acaulescent or subacaulescent habit with pinnatisect or pinnatifid leaves; appendages of the involucral bracts long, recurved, and pinnatifid; and pink florets [35]. All of these characters strongly suggest that C. tentudaica is closely related to C. amblensis. Thereafter, any research on the polyploidy taxon should include C. amblensis as one of the potential parental species.
Our main objectives in this work using cloned sequences of nuclear-ribosomal DNA spacers ETS, as well as low-copy genes AGT1 and PgiC, and allozymes are multifaceted: (1) To evaluate whether Centaurea tentudaica is an auto- or an allopolyploid; (2) given the threatened status and the conservation interest of C. tentudaica, to survey the levels of genetic diversity within and among (sub)populations; and (3) to develop an ENM to infer the potential distribution of Centaurea amblensis, the only putative parental identified on morphological basis, at present, LGM, LIG (Last Interglacial Period, ca. 120,000 years BP) and PGM (Penultimate Glacial Maximum, ca. 140,000 years BP) conditions.

2. Materials and Methods

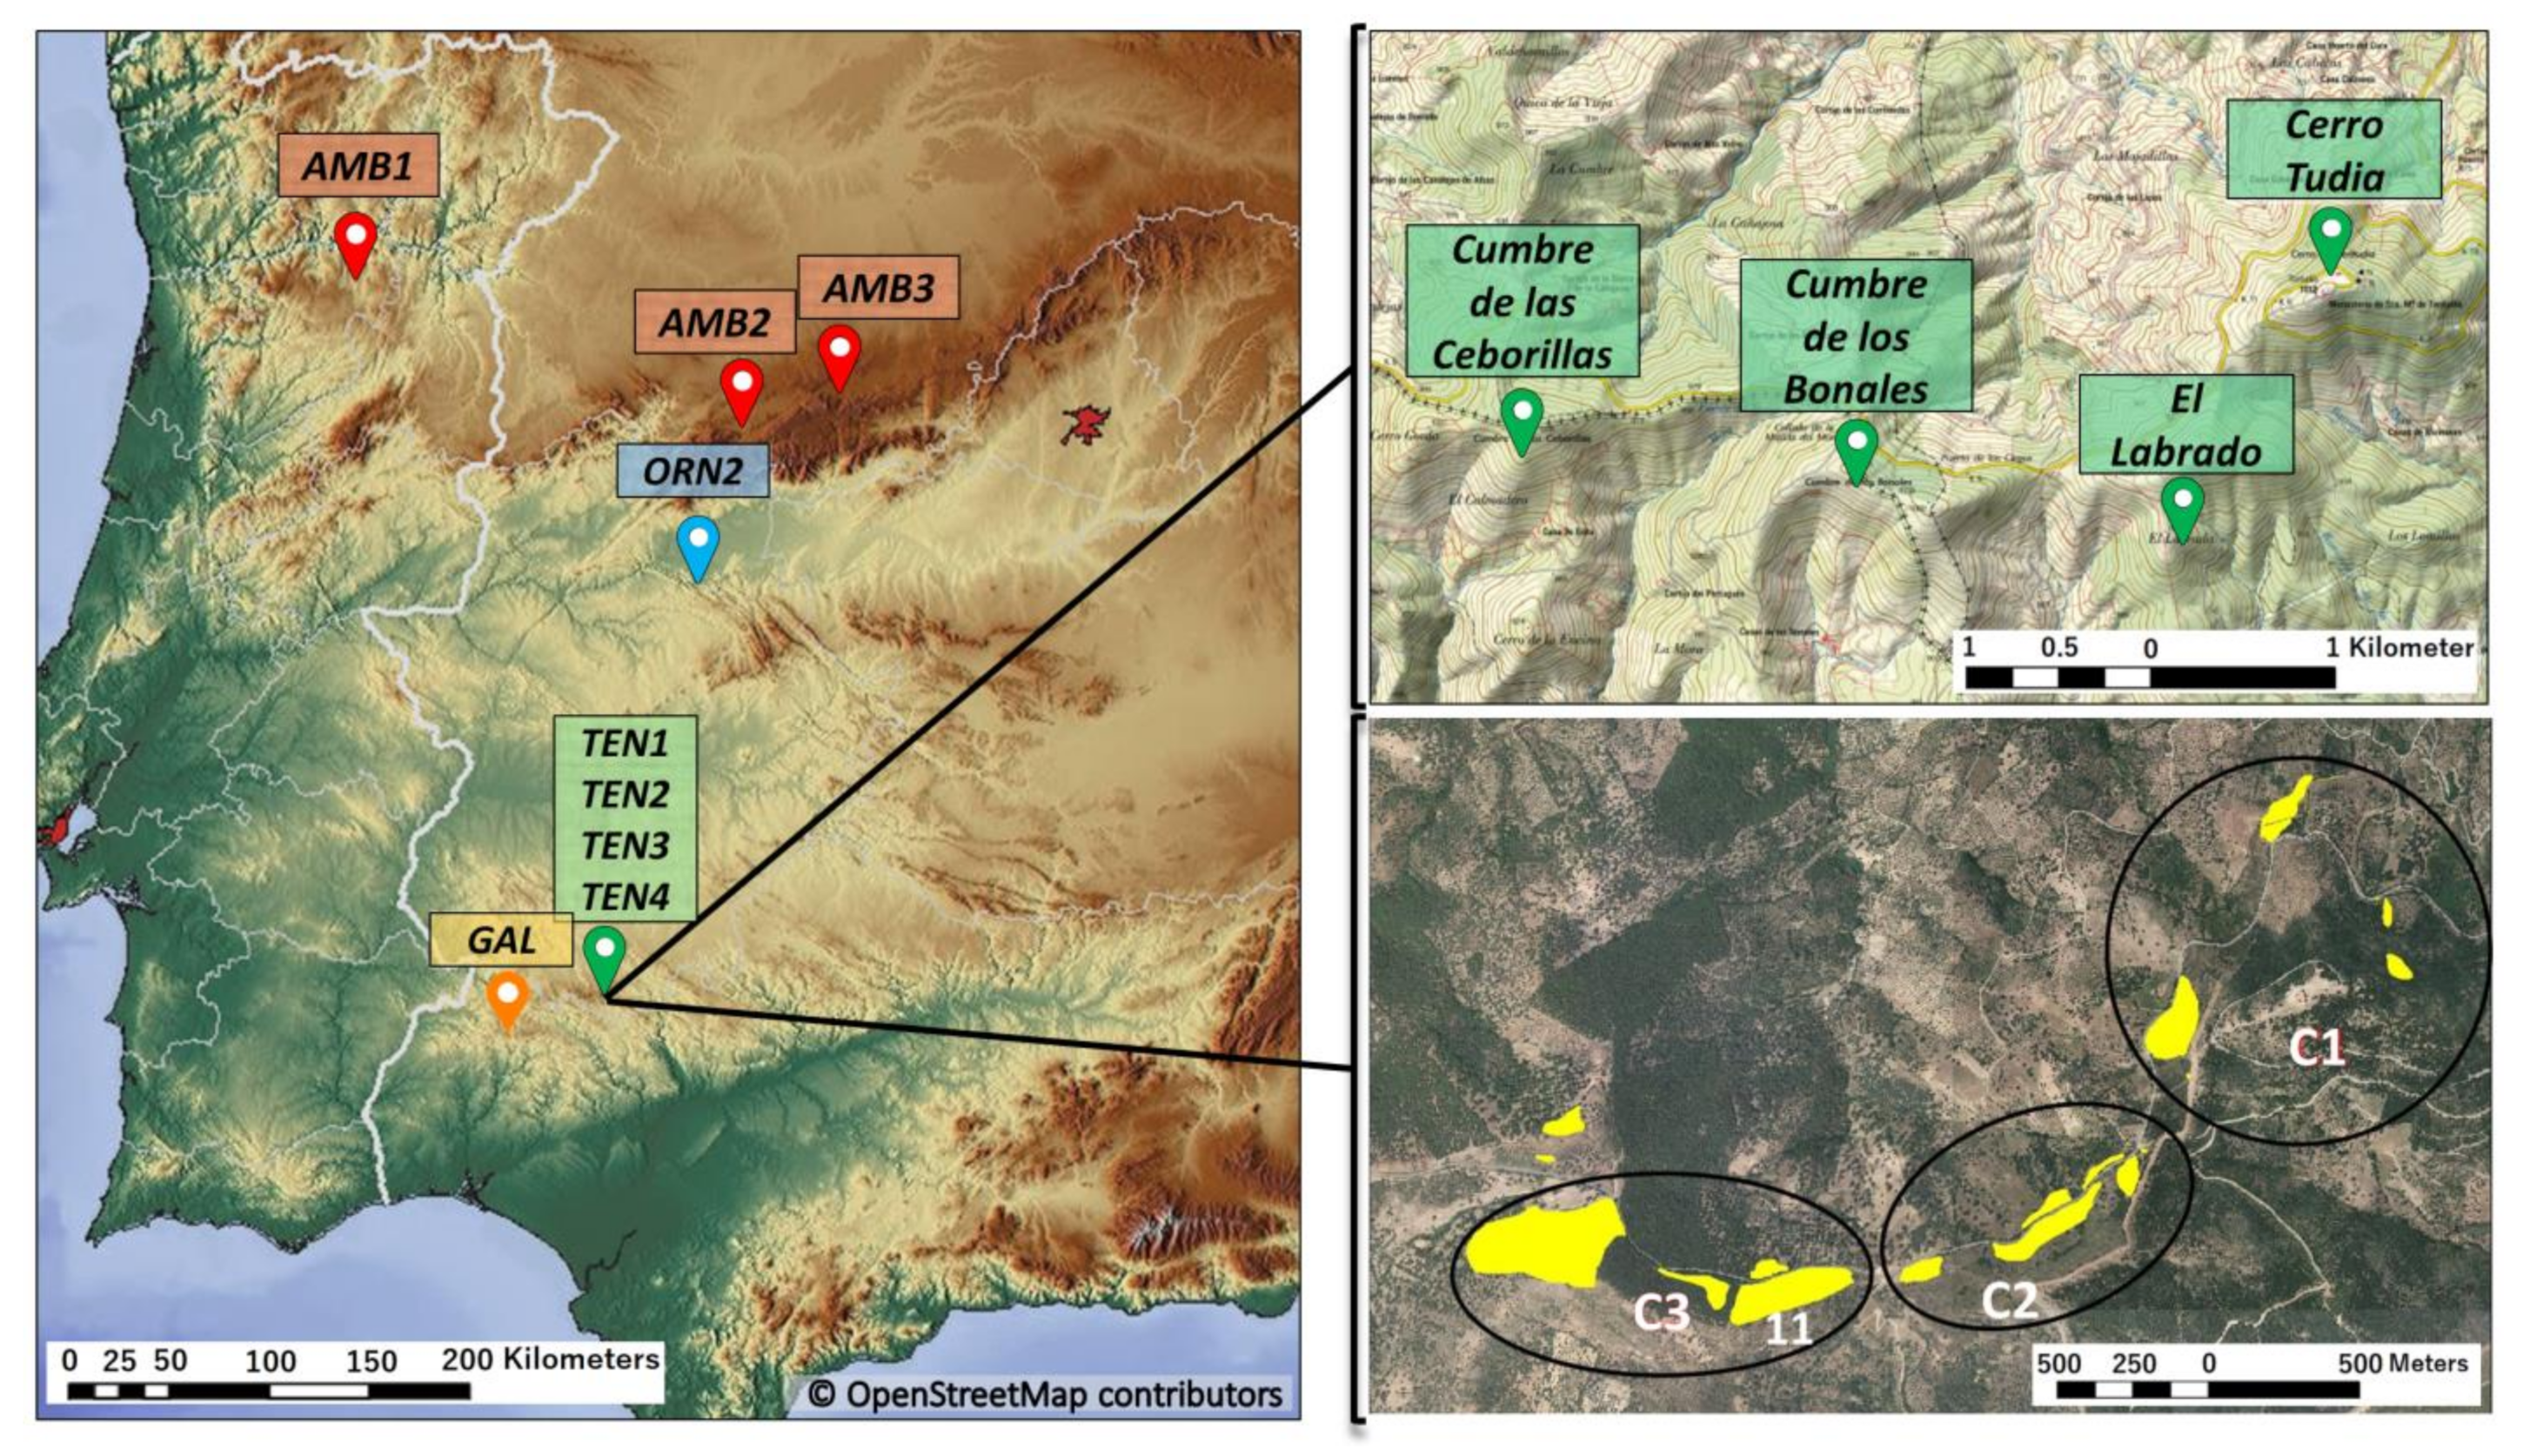
2.1. Sampling Strategy and Markers

For DNA sequencing, fresh leaves from adult plants in wild populations were collected and preserved in silica-gel. The studied species, vouchers, chromosome numbers, and complementary data are listed in Table S1. The geographic origin of the sampled populations is illustrated in Figure 1. For our study, we selected the nuclear ribosomal ETS because concerted evolution is usually incomplete in sect. Acrocentron [10,13], and different copies can persist in cases of introgression. These copies can be detected by cloning, and they are generally useful for identifying reticulation. We also selected two low-copy genes: AGT1, which was useful for determining gene flow and hybridization in Centaurea [37]; and PgiC, which will be used for the first time in this section.
For the ETS region and low-copy genes, we selected seven individuals of C. tentudaica from four subpopulations (Figure 1): (1) One from the north side of El Labrado hill with pale pink florets and pectinate bracts; (2) two from the northwest side of El Labrado, one with pale pink and the other with dark pink florets; (3) two from Cumbre de las Ceborillas hill, one with large capitula and the other with small capitula (both with dark pink florets); (4) two from Cumbre de los Bonales hill, one with dark pink florets and pinnatifid leaves (all other individuals selected of C. tentudaica had pinnatisect leaves) and the other one with pale pink florets and acaulescent habit (all the other individuals of C. tentudaica were subacaulescent). Details of the locations are shown in Table S1. Besides, to verify the origin of C. tentudaica, we selected five individuals (from five populations) of three additional species: C. amblensis (three populations one individual each, all of them with dark pink florets), a tetraploid species [cf. 35] that was chosen because of its morphological resemblance to C. tentudaica; and C. ornata (one population, one individual) and its close relative Centaurea galianoi Fern. Casas and Susanna (one population, one individual), both with yellow florets, because of their geographical proximity to C. tentudaica. As outgroups, C. toletana was chosen for the ETS analysis; C. cephalariifolia Willk. and C. scabiosa L., for the AGT1 analysis; and C. polypodiifolia Boiss. and C. behen L., for the PgiC region.
For allozymes, we sampled a total of 85 individuals along a linear transect covering all the distribution range of C. tentudaica; sampled individuals were spaced by several meters to avoid the hypothetical collection of ramets. We tried to do a comparable sampling between the three main subpopulations in which most individuals of C. tentudaica are arranged, and that correspond to three hills of slightly over 1000 m a.s.l.: Cerro Tudia, El Labrado, and Cumbre de los Bonales (Figure 1 and Table 1). Fresh leaf samples consisted of small leaves, which were deposited in paper bags and stored at 4 °C until protein extraction one or two days later.

2.2. DNA Amplification, Cloning, and Sequencing

DNA was extracted following the CTAB method described by Doyle and Dickson (1987) as modified by Cullings (1992) and Tel-Zur (1999) [38,39,40]. The ETS region was amplified using ETS1F as a forward primer [11], and 18SETS as a reverse primer [41]. The profile for amplification followed Susanna et al. (2011) [42]. The AGT1 gene was amplified with three sets of primers: (1) AGT1F-podos [37] as a forward primer and AGT1R as reverse [43]; (2) AGT1F as a forward primer and AGT1R as a reverse primer [43]; (3) a specific pair of primers designed for this work: AGT1tenF (5′-TGTGGACGTSRCCTTAACSG-3′) as a forward primer and AGT1tenR (5′-ATGCTTCCACAGCCAGCCTG-3′) as reverse. The profile for amplification followed López-Pujol et al. (2012) [37]. Finally, PgiC was amplified using AA11F [15] as a forward primer and AA15R-GL (5′ GGAGCAAGCTTCTCAAGAG 3′) designed by A. Galian (Botanic Institute of Barcelona, pers. comm.) as a reverse primer. PCR amplifications between the exon 11 to 15 were performed with the following parameters: Three minutes at 95 °C, followed by 35 cycles of 94 °C for 30 s, 54 °C for 30 s and 72 °C for 2 min, with 10 additional min at 72 °C.
PCR reactions were carried out using a total volume of 25 µL for each sample, containing 2.5 µL of dNTPs (2 mM), 2.5 µL of 10× PCR Buffer II (10 mM), 2.5 µL of MgCl2 solution 25 mM, 1 µL of each primer at 5mM for ETS and 10 mM for AGT1 and PgiC amplification, 0.2 µL of AmpliTaq® DNA Polymerase (Applied Biosystems, Foster City, CA, USA), 11.3–11.8 µL of distilled water, 0.5 µL of DMSO (dimethyl sulfoxide; Sigma-Aldrich, Schnelldorf, Germany) for ETS and 1 µL of BSA 0.4 mg/mL (bovine serum albumin; New England Biolabs, Ipswich, MA, USA) for AGT1 and PgiC, and 3 µL of diluted DNA (proportions of water and DNA depends on the total DNA obtained during extraction).
The PCR products of the three regions were cloned using the TOPO TA Cloning kit (Invitrogen, Carlsbad, CA, USA) following the manufacturer’s instructions. From each reaction, 8–16 colonies were amplified using T7 and M13 universal primers under the conditions described in Vilatersana et al. (2007) [44]. After examination in 1.2% agarose gels, six to eight of the 16 PCR products with the correct size were selected for sequencing using the same primers. Before sequencing, all the PCR products were purified with the QIAquick PCR Purification Kit (Qiagen Inc., Valencia, CA, USA). Sequencing was performed on an ABI 3730XL Analyser (Applied Biosystems) following the manufacturer’s protocol at Macrogen Inc., Korea.

2.3. Sequence Alignment and Phylogenetic Analyses

Sequences were aligned manually using BioEdit v7.0.5.3 [45]. Unique substitutions in clones from a single accession were excluded. This reduced the size of the matrices, as well as the impact of PCR artifacts (chimeric sequences and Taq errors [46,47]). To verify the presence of possible recombinant sequences, datasets were checked using RDP v4.97β [48].
Network analyses (Neighbor-Net) were carried out for each marker using Splits Tree4 v4.14.8 software [49] with the criterion set to uncorrected pairwise (p) distances, excluding gap sites. For the Bayesian analyses, the datasets were processed using jModeltest v2.1.10 [50] in order to find the best evolutionary model that described the data properly. These models were used to carry out the Bayesian analyses using Mr Bayes v3.2.7 [51]. The Marginal Likelihood Estimators for the two models (non-clock and strict clock) were obtained using Stepping Stone Sampling following the Mr Bayes manual. Two independent MCMC analyses were run, each for 20 million generations and two chains, starting with random initial trees and sampling every 1000 generations. The convergence of the parameters was checked using TRACER v1.7.1 [52], discarding the first 25% of the generations as burn-in.

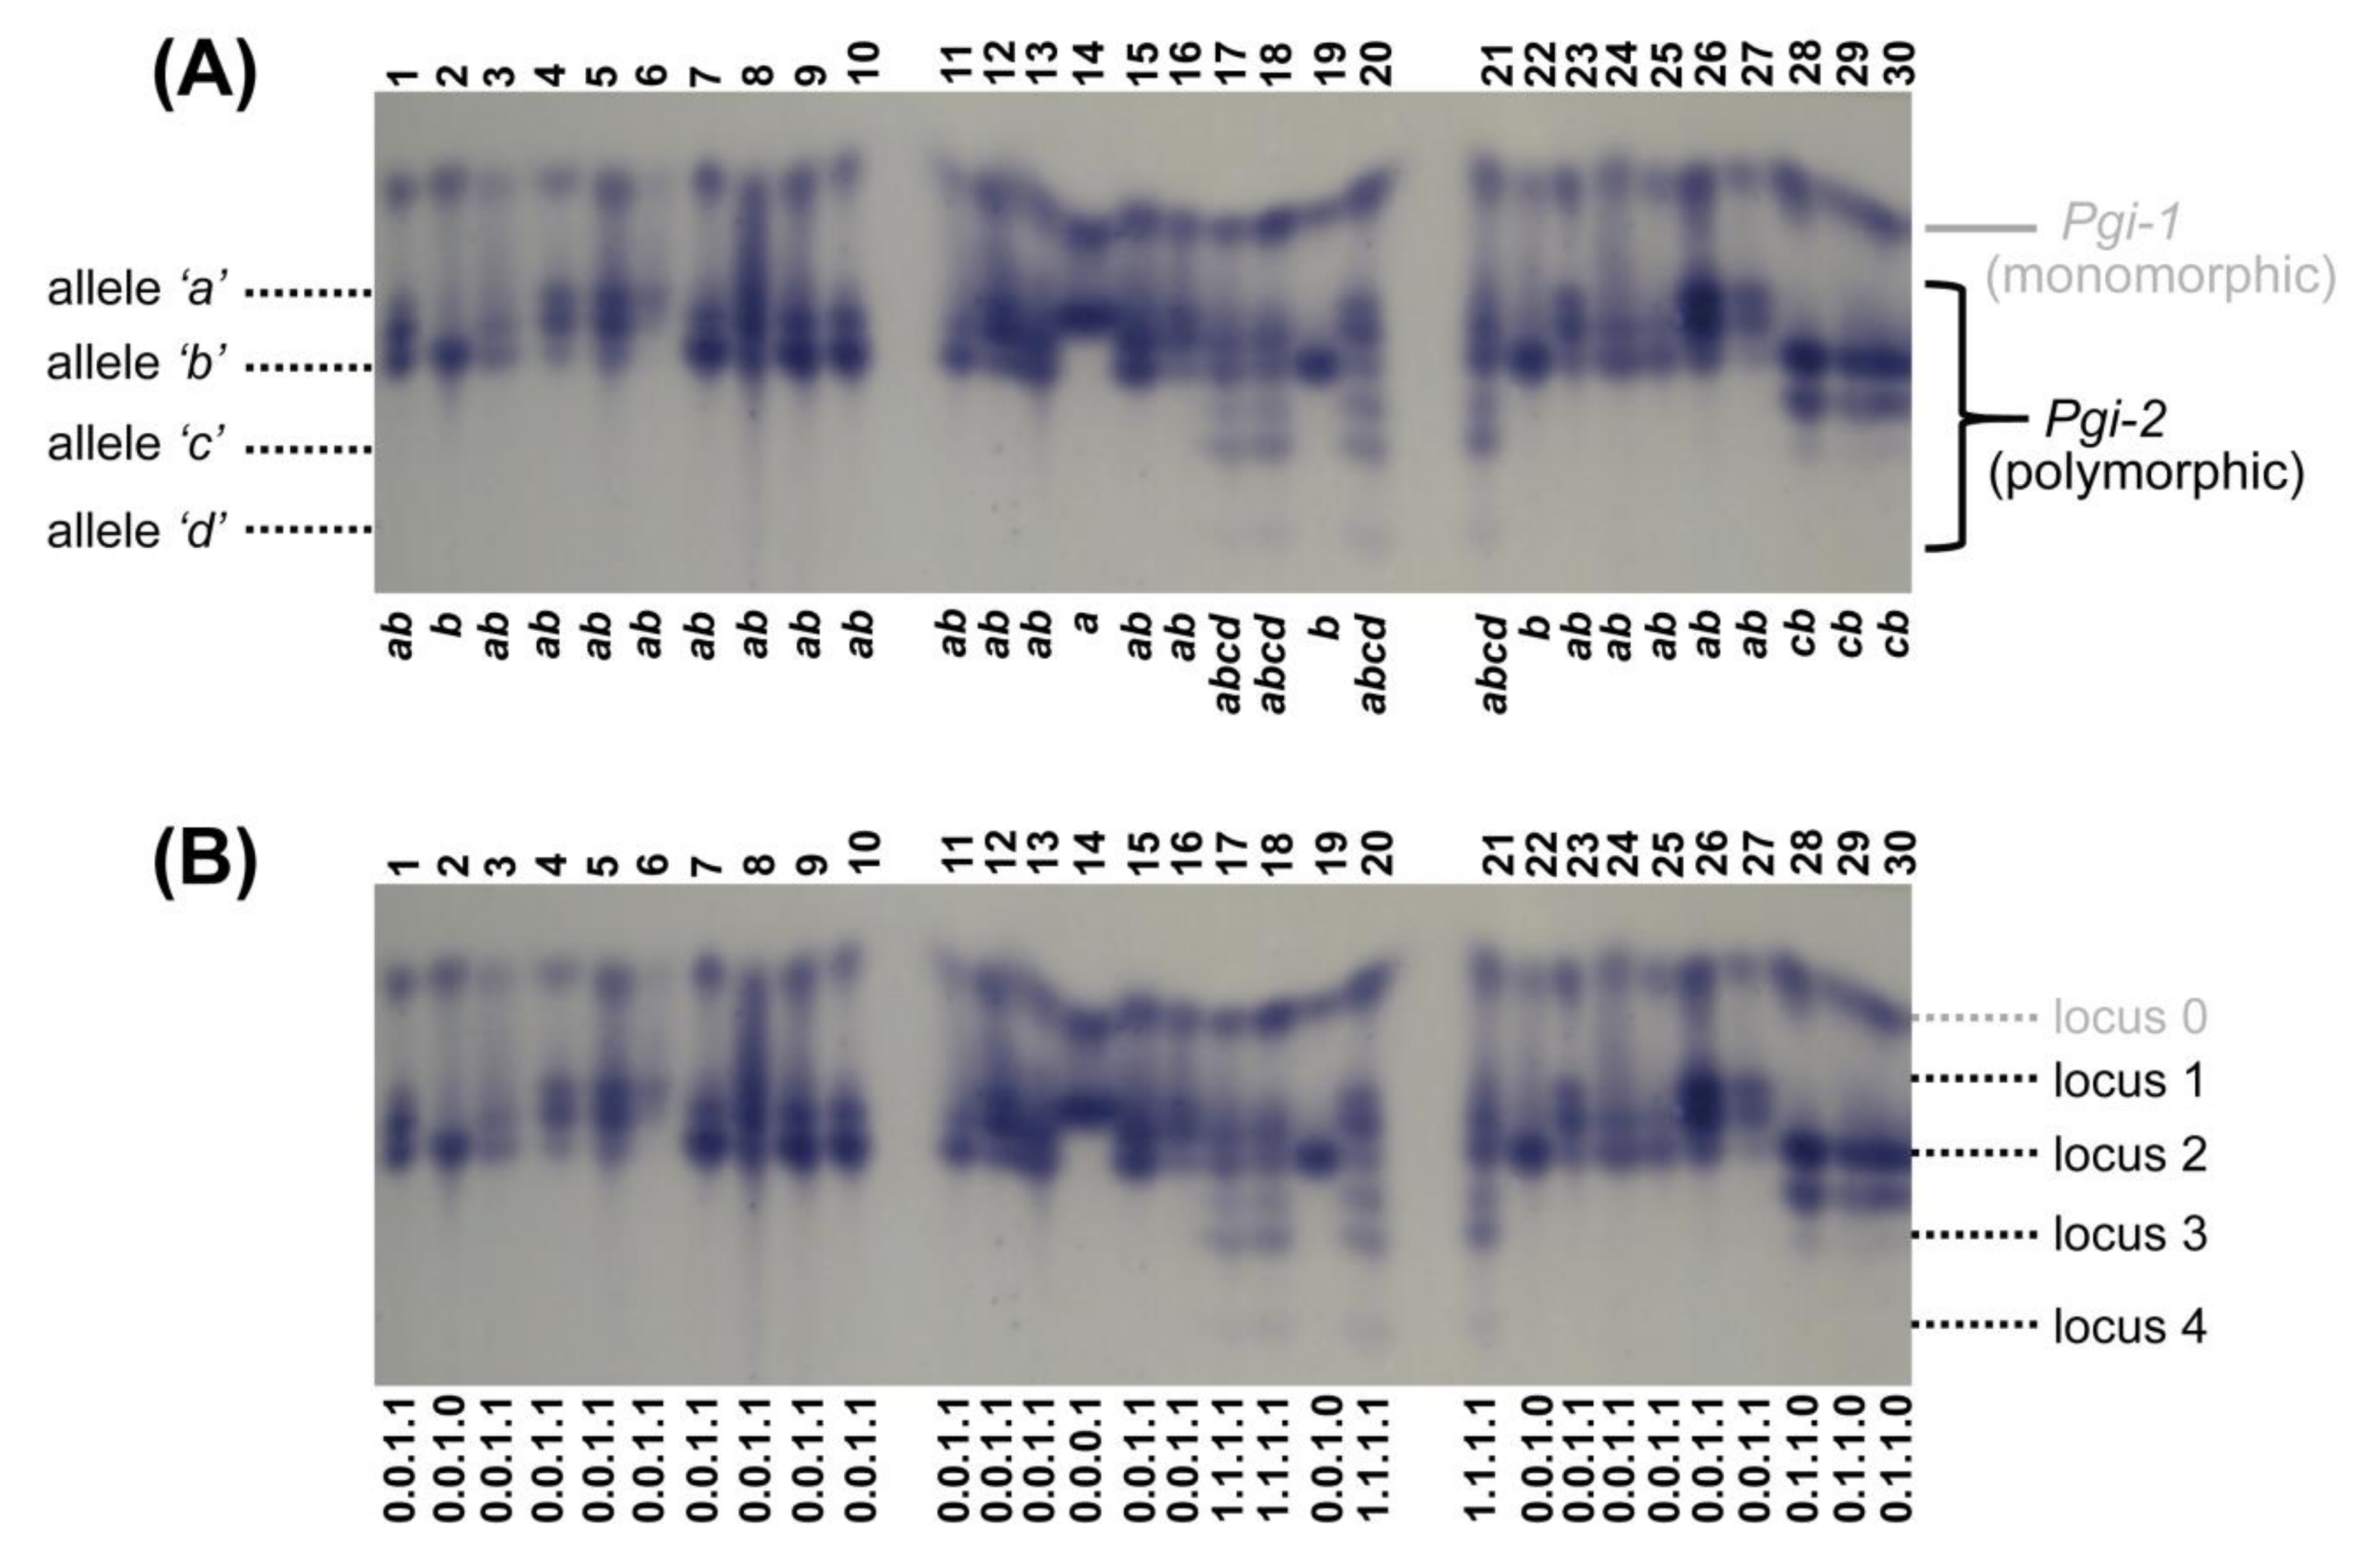
2.4. Allozyme Extraction and Analyses

Leaf fragments of C. tentudaica were homogenized on refrigerated porcelain plates using a cold extraction buffer consisting of 0.05 M tris-citric acid, 0.1% (m/v) cysteine-HCl, 0.1% (m/v) ascorbic acid, 8% PVP-40, and 0.06% (v/v) 2-mercaptoethanol. Extracts were absorbed onto 3 MM Whatman filter paper and analyzed immediately or stored at −80 °C until analysis. A total of 11 enzymes were assayed on 11% starch gels, obtaining 11 ‘interpretable’ loci (see details on the difficulties on interpreting loci below): Aco-2, Aco-3, Aco-4, Dia-1, Idh-2, Mdh, 6Pgd-1, 6Pgd-2, Pgi-1, Pgi-2, and Pgm-1. Aconitate hydratase (ACO, EC 4.2.1.3), isocitrate dehydrogenase (IDH, EC 1.1.1.42), malate dehydrogenase (MDH, EC 1.1.1.37), phosphogluconate dehydrogenase (6PGD, EC 1.1.1.44), phosphoglucoisomerase (PGI, EC 5.3.1.9), and phosphoglucomutase (PGM, EC 5.4.2.2) were resolved in a morpholine buffer pH 6.1; only diaphorase (DIA, EC 1.6.99.-) was resolved in a different buffer (tris-citrate/lithium-borate buffer pH 8.2). Staining procedures for all enzymes followed the method described by Wendel and Weeden (1989) [53], with slight modifications.
As expected for a hexaploid species, banding patterns were particularly complex. Even for the ‘interpretable’ loci (those that showed rather clear banding patterns, with strongly stained and well-defined bands), determining the allelic dosages was not possible in most cases; co-migration of bands, the faintness of some alleles, and the occurrence of multiple heterodimeric bands frustrated our efforts to assign 6-letter genotypes (e.g., abbccc) to each individual for each locus. In order to run the conventional software for estimating the common genetic diversity parameters, we followed two approaches that have been used in similar situations. For the first approximation, we selected only the loci for which we were able to confidently identify the alleles present at each individual (what we called above as the ‘interpretable’ loci, 11 in total). This way enables treating loci as codominant, but only simplified phenotypes can be obtained; for example, the phenotype ‘ab’ could correspond to up to five different genotypes (abbbbb, aabbbb, aaabbb, aaaabb, and aaaaab) (Figure 2). This method, despite representing a big simplification of the actual genotypic richness, estimates the allele frequencies at the population level. On the basis of allele frequencies, we can calculate some of the main within-population genetic diversity parameters, including P (percentage of polymorphic loci), A (mean number of alleles per locus), and He (expected heterozygosity), but not Ho (observed heterozygosity). Examples using this approach include the hexaploid Sequoia sempervirens [54] and the Chinese Smilax polyploid series [55]. For the second approximation, we treated the allozyme data as dominant markers. Each identified allele of the 11 interpretable loci was regarded as a separate ‘locus’ and coded as 1 (allele present) vs. 0 (allele absent) (Figure 2). As a result, we obtained a binary presence/absence matrix of 23 ‘loci’. This second approximation may imply some bias because we are not dealing with actual loci. However, it has the advantage that we can obtain accurate individual genotypes, and thus, we are able to calculate among-population genetic diversity parameters (e.g., the fixation index, FST), as well as surveying the population structure. This approximation has been used, for example, in polyploid Achillea [56]. However, there are works even combining the two approaches (as in Cardamine; [57]), as we are doing in the present research.
With the phenotypes obtained through the first approximation and by using the program BIOSYS-1 [58], we computed P95 (percentage of polymorphic loci when the most common allele had a frequency of <0.95), A, and He. Instead of Ho, we calculated ‘individual heterozygosity’ (Hi) by hand, measured as the percentage of the 11 interpretable loci for which the sampled individuals were heterozygous. The genotypes obtained through the second approximation were used to calculate FST with the help of AFLP-SURV v1.0 [59], but also to run a Principal Coordinate Analysis (PCoA)—conducted using GenAlEx v6.5 [60] based on genotypic distances.

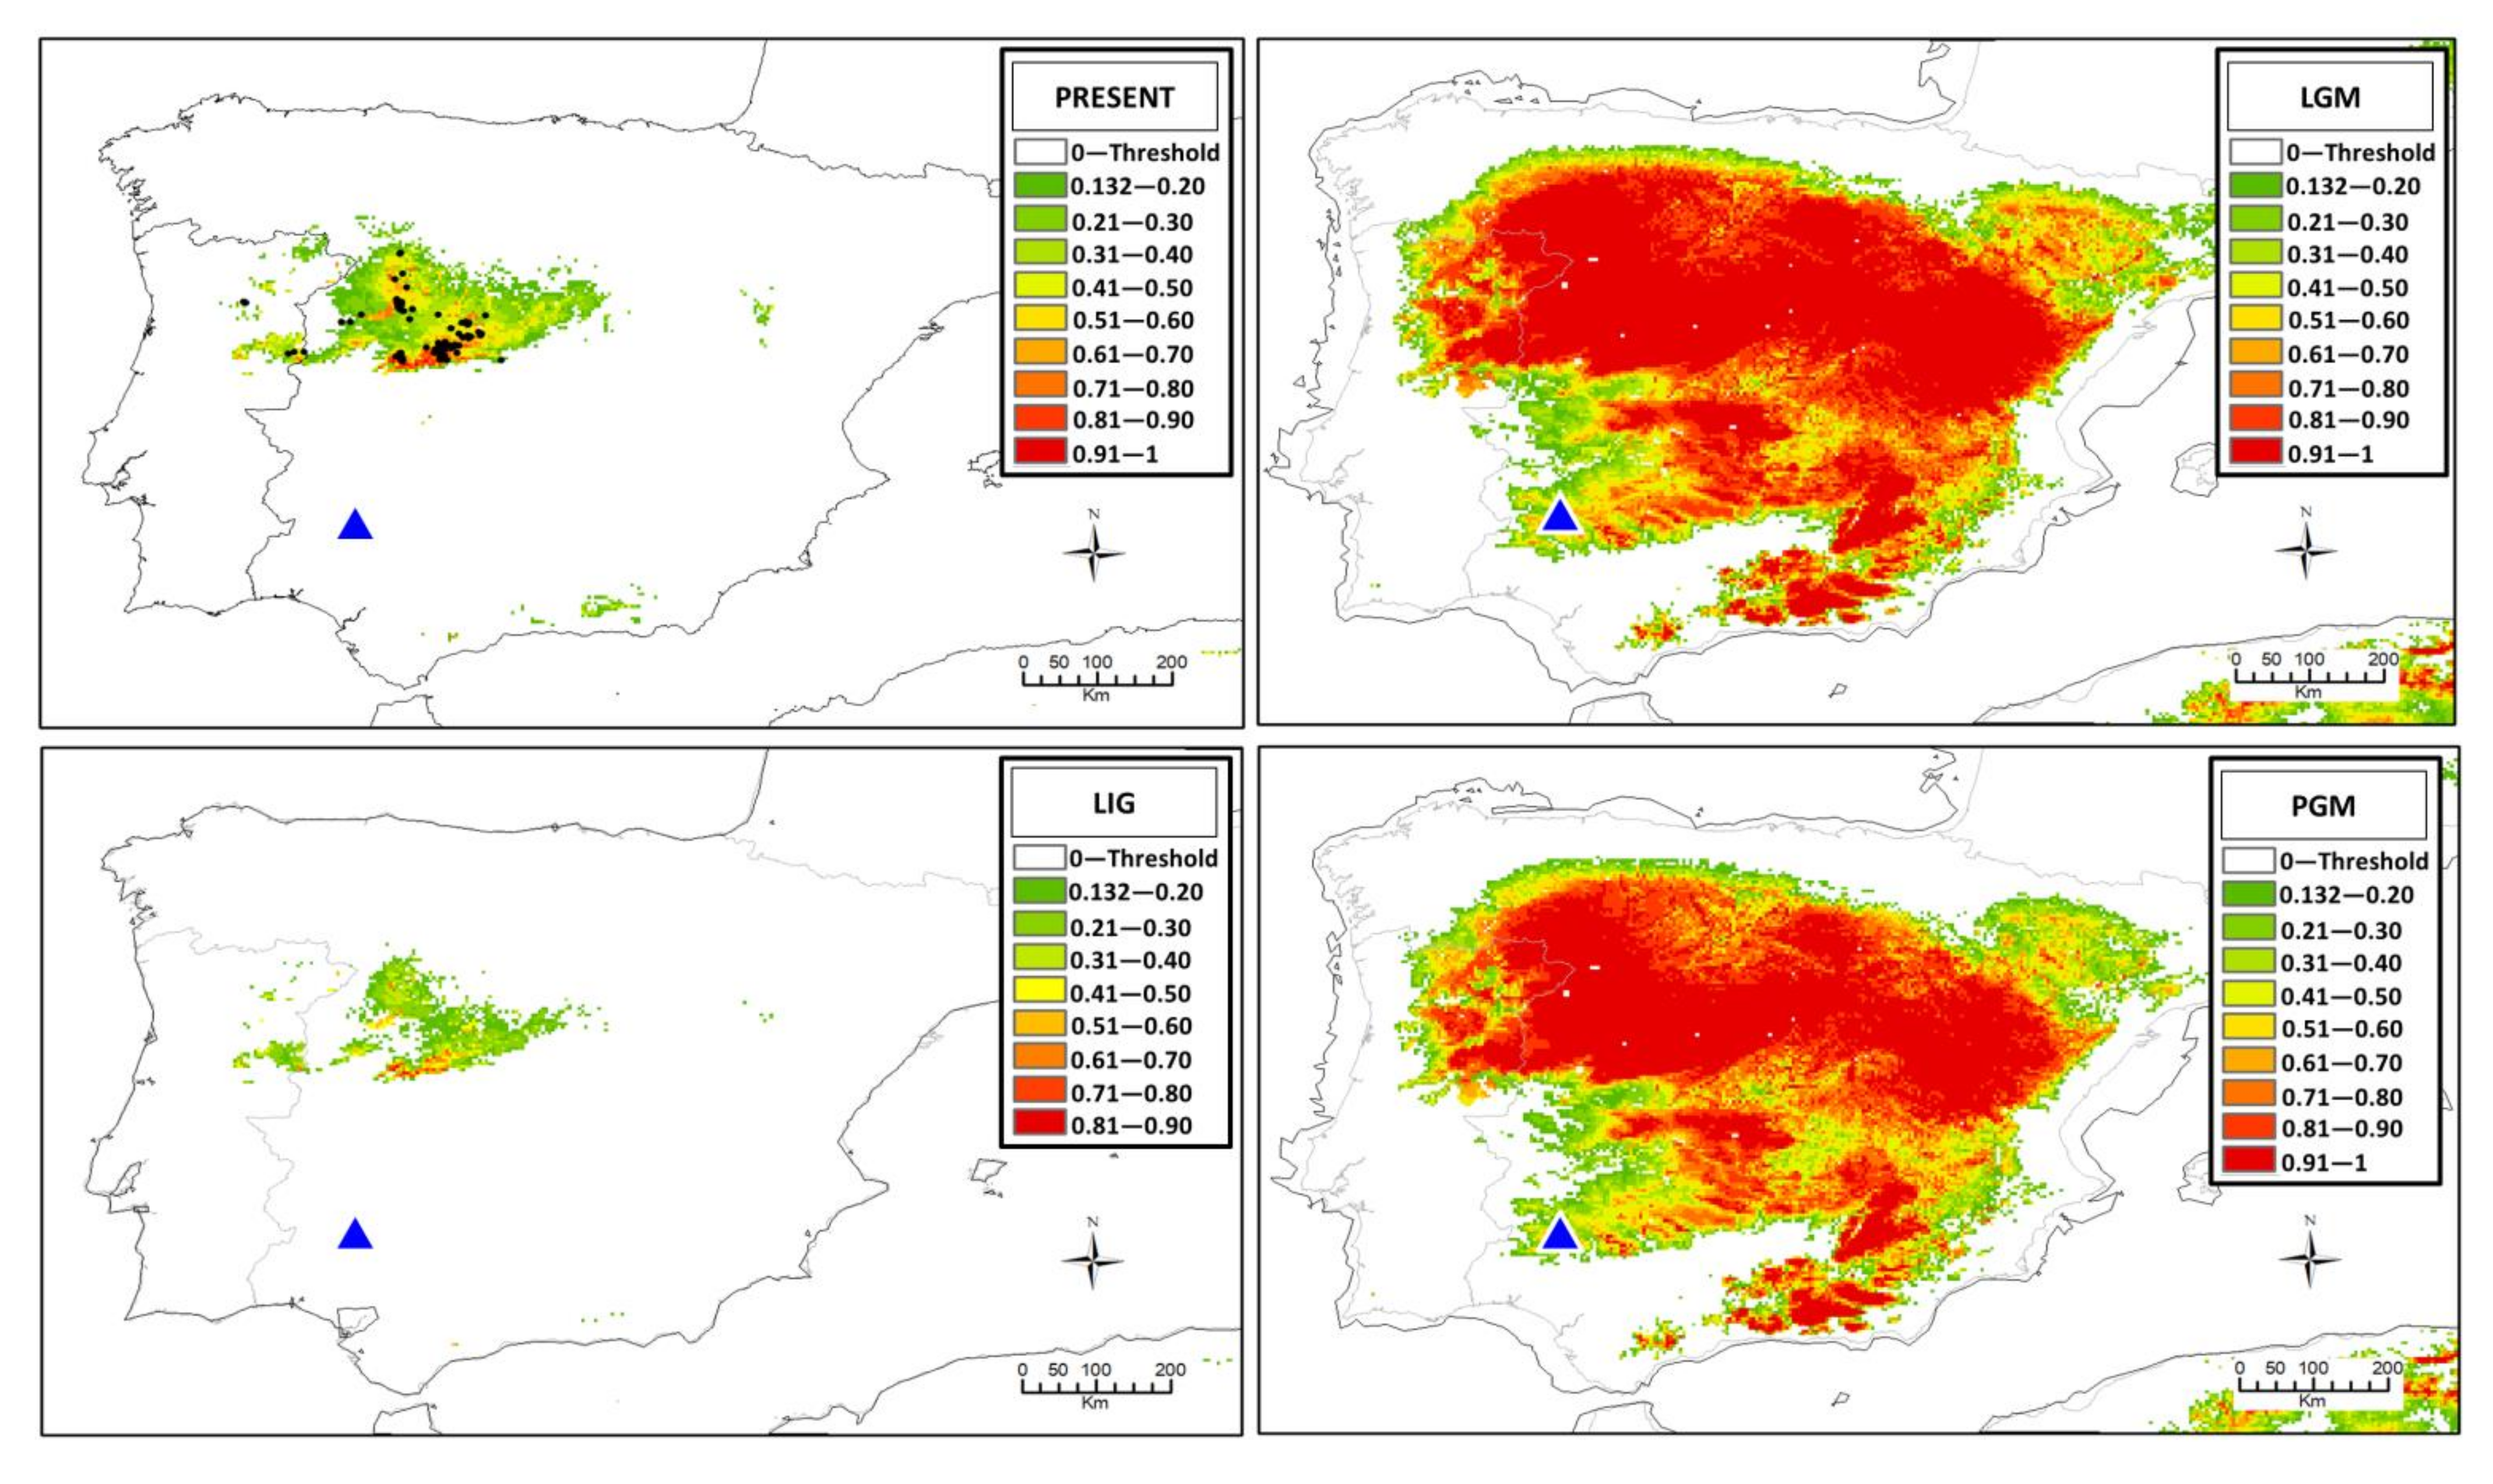
2.5. Ecological Niche Modeling

Ecological niche modeling was performed to evaluate the potential distribution of C. amblensis for the present time, LGM, LIG, and PGM (~140 ka) environmental conditions. Building models for C. tentudaica was discarded because at the study resolution (2.5 arc-min) the number of wild occurrences (2) was not enough to get reliable results (≥ 5) [61]; unfortunately, climatic data for the LGM and older time periods are not available at finer resolutions than 2.5 arc-min (https://www.worldclim.org/data/v1.4/paleo1.4.html; http://www.paleoclim.org/; https://datadryad.org/stash/dataset/doi:10.5061/dryad.27f8s90; 10 January 2021). We used the maximum entropy algorithm implemented in MaxEnt v3.3.3k [62]. Occurrence data of C. amblensis were obtained from Fernández Casas and Susanna (1985) [35] and the Global Biodiversity Information Facility (https://www.gbif.org/; 15 October 2020). All the occurrences were verified manually, since at least one of the authors of this work was involved in collecting some of the occurrences. The rest were backed by herbarium specimens, except for five locations that were confirmed through photographs. A total of 74 validated locations were included for C. amblensis. The selected background for this study was the Iberian Peninsula, since C. amblensis is restricted to this area [29,34,35]. We used a set of 19 environmental variables at 2.5 arc-min resolution obtained from the WorldClim database (http://worldclim.org; 25 October 2020). We also included layers for soil type (from the Harmonized World Soil Database, HWSD; www.fao.org/nr/land/soils/harmonized-world-soil-database/en; 23 September 2018), soil pH (from ISRIC, World Soil Information; http://isric.org; 18 November 2017), and altitude (from DEMSRE3; http://worldgrids.org/doku.php/wiki:demsre3; 10 December 2021) at 30 arc-sec resolution [which were further rescaled to 2.5 arc-min with ArcGIS v10.5 (ESRI, Redlands, CA, USA)]. Of all occurrence records, 75% were randomly selected to construct the niche model under current conditions in MaxEnt. The remaining 25% was used to test the prediction of the model using the area under the curve (AUC), which is the probability that a random site will be ranked above a random absence site. A random ranking has on average an AUC of 0.5, and a perfect ranking has the best possible AUC of 1.0 [63]. Jackknife tests, percent of contribution, and response curves of the variables were implemented in MaxEnt to define the influence of each one. Finally, we selected eight relatively uncorrelated variables (r ≤ |0.85|) (Table S2). The correlation analysis was run using SDMtoolbox v2.4 [64] implemented in ArcGIS. The niche model under current conditions was projected to the LGM, LIG, and PGM using paleoclimatic layers from Oscillayers (https://0-doi-org.brum.beds.ac.uk/10.5061/dryad.27f8s90; 15 January 2021). The altitude layer of the three past environmental conditions was constructed from the present layer by adding 120 m to each pixel to simulate the LGM altitude conditions [65,66], by subtracting 2.15 m to each pixel to the LIG conditions [67], and by adding 90 m to the PGM conditions [68]. Soil and pH layers were assumed to be the same as in present conditions. We run 100 replicates in MaxEnt using the subsample method (75%/25% of occurrences for training and testing the model, respectively), and applying the maximum sensitivity plus specificity logistic threshold to obtain a map of probability of the presence of C. amblensis in ArcGIS. Afterwards, the final model was evaluated by the AUC, obtained from Maxent, and by calculating the True Skill Statistic (TSS) [69] using RGui v4.0.3 [70]. Values with a TSS higher than 0.5 are considered as optimal results in terms of power prediction [69].

3. Results

We sequenced 195 clones, from which only 90 were retained after eliminating recombinant sequences and those containing unique single-nucleotide polymorphisms. Total alignments were 666 bp long for ETS, 1030 bp for AGT1, and 726 bp for PgiC. The number of gaps, polymorphic sites, total mutations, and informative sites are shown in Table 2.
The best model for the different regions was HKY + G for all the cases, based on Akaike information criteria (AIC). We selected the strict clock uniform using the Bayes Factor (BF) values for all the regions (Table S3).

3.1. ETS Region

The Bayesian analysis of the ETS region revealed a partially resolved tree (Figure S1). This analysis showed a moderately-supported (PP = 0.92) clade, including C. tentudaica and C. amblensis (Figure S1). The tree also showed a copy shared by C. tentudaica and C. ornata, but without support (Figure S1, clade B), and a well-supported copy shared by C. tentudaica and C. galianoi (Figure S1, clade C). The Neighbor-Net (Figure 3) showed one copy shared by C. amblensis and C. tentudaica, and a second one by C. ornata, C. tentudaica, and C. galianoi, with three copies corresponding to clades B, C, and D in the Bayesian analysis (Figure S1).

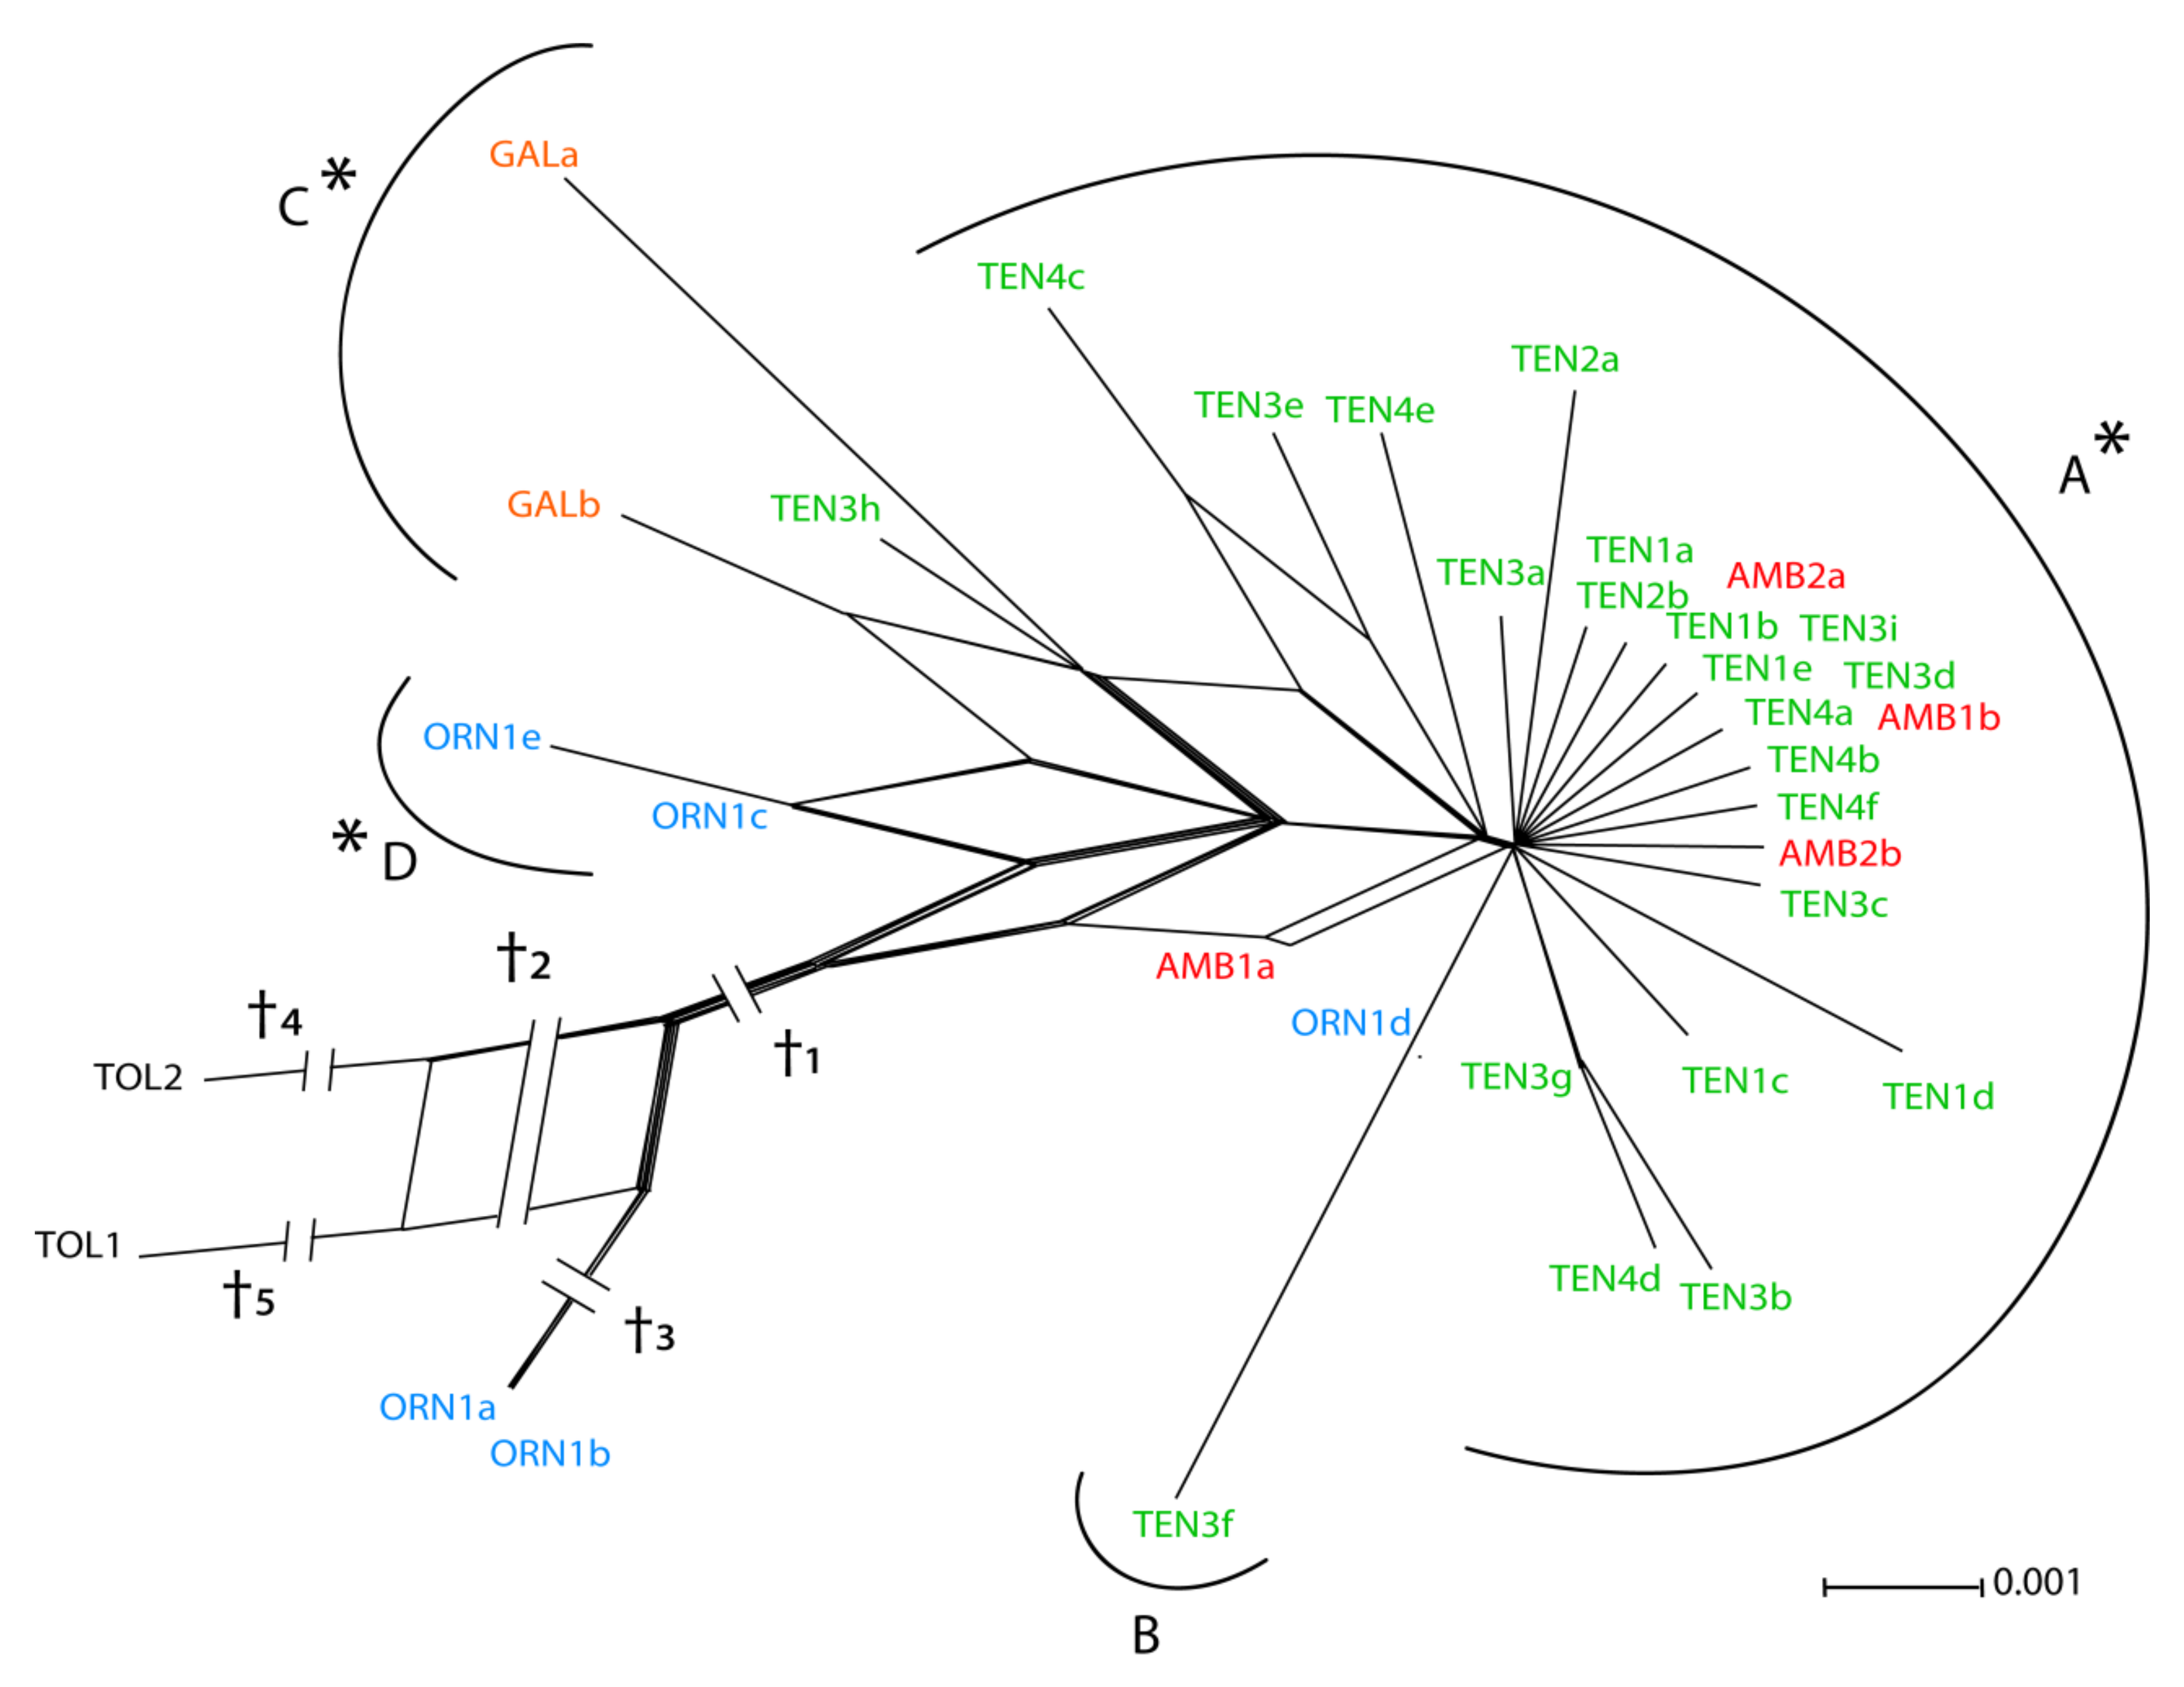
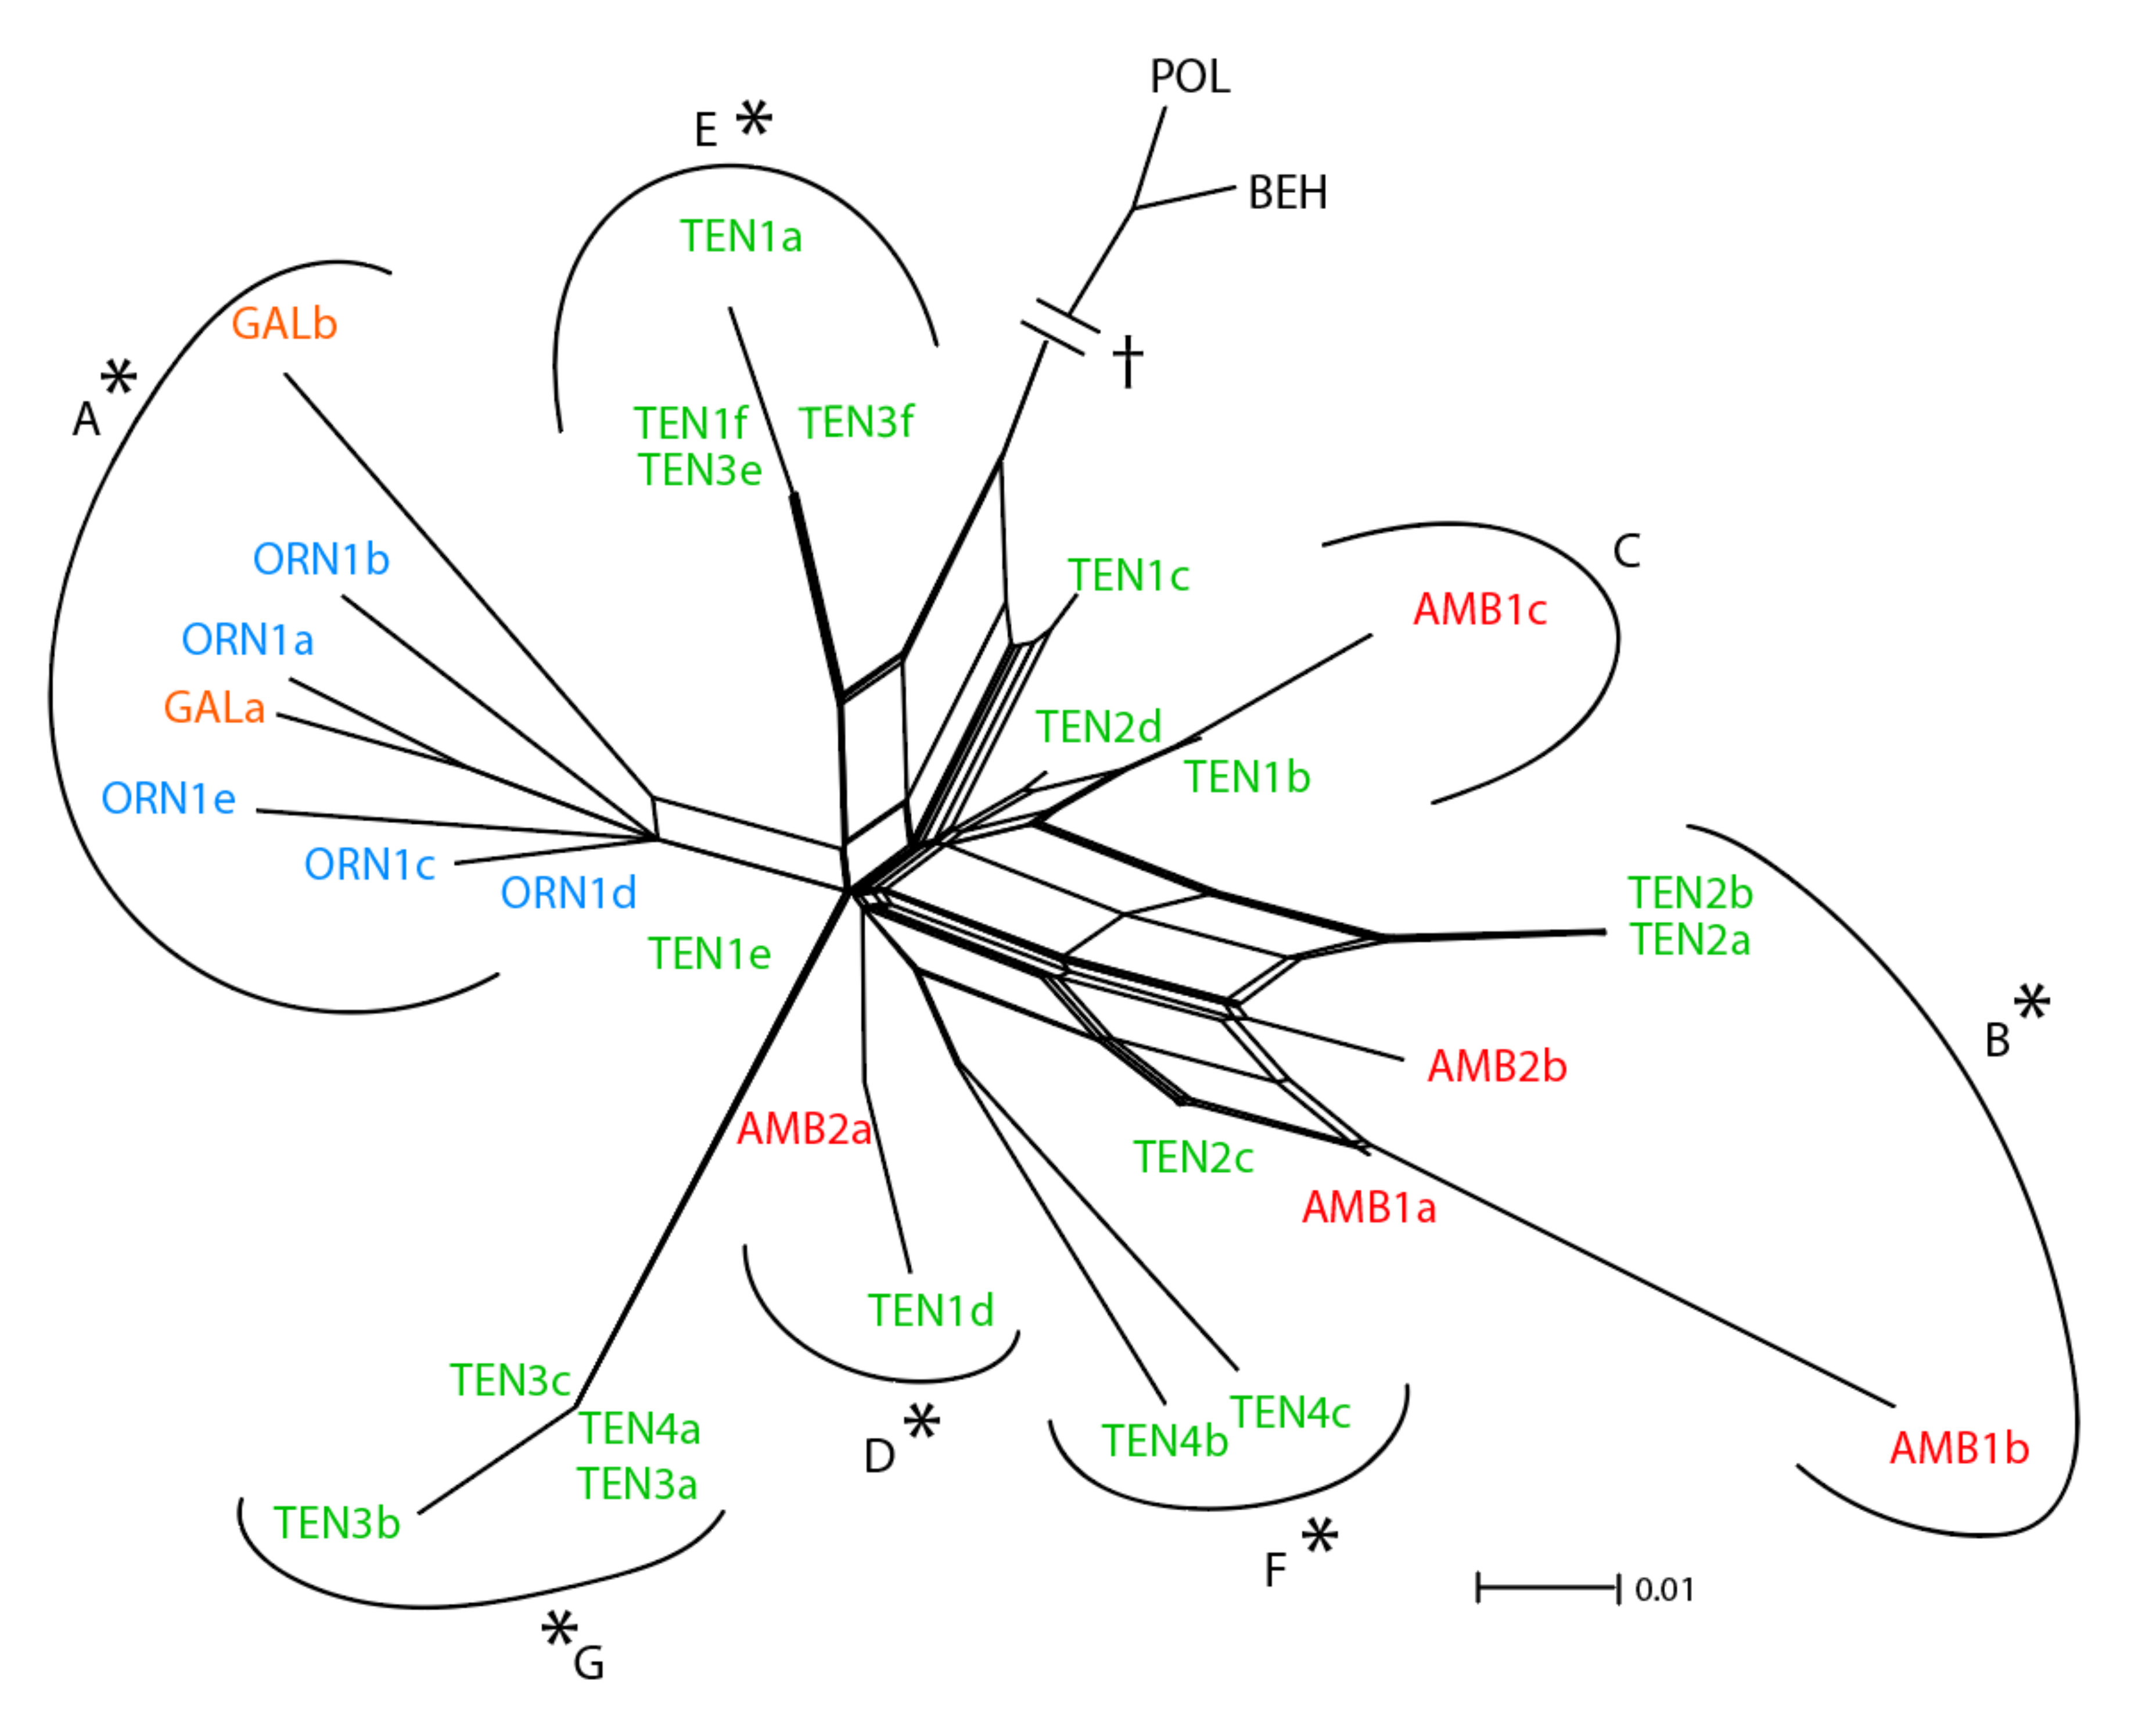
3.2. Low-copy Genes AGT1 and PgiC

AGT1 analysis showed a partially resolved tree (Figure S2), with a large clade, including all species analyzed, but with only two well-supported subgroups: The first one (Figure S2, clade C) included a clone of C. amblensis and a clone of C. tentudaica, and the second (Figure S2, clade D) comprised only C. tentudaica. The Neighbor-Net analysis did not show well-differentiated copies (Figure 4).
The Bayesian analysis for PgiC showed seven different clades (Figure S3). The first one had high support and corresponded to clade A, which included all clones of C. ornata and C. galianoi. Clades B, C, and D corresponded to subcopies shared by C. tentudaica and C. amblensis, the first and the last one with very high support. All the other subcopies were found only in C. tentudaica with high support. The Neighbor-Net showed the same well-differentiated copies that clearly separate C. tentudaica and C. amblensis from C. galianoi and C. ornata (Figure 5).

3.3. Allozymes

Of the 11 interpretable loci for C. tentudaica, four were monomorphic with a single allele, namely, Idh-2, Mdh, 6Pgd-1, and Pgi-1. In the seven remaining polymorphic loci, no evidence of fixed heterozygosity was found; rather, all of them showed both putatively balanced (having an equal number of copies of each allele) and unbalanced (having a different number of copies of each allele) heterozygotes (Figure 2). The number of alleles per polymorphic loci ranged from 1 to 4, with a mean at an individual level of 1.55. Only one locus (Pgi-2) provided phenotypes of four alleles (abcd; Figure 2). Regarding the levels of genetic diversity, they were very similar among subpopulations of C. tentudaica, averaging 60.61%, 2.03, and 0.287 for P95, A, and He, respectively (Table 1). The value of FST was very low (0.023), indicating almost no genetic divergence among the three subpopulations. The graphical representation of PCoA (Figure S4) agreed with the FST estimation, as individuals belonging to the tree subpopulations are randomly distributed across the two dimensions.

3.4. Ecological Niche Modeling

The predictive power of the model was very high, obtaining an average AUC of 0.975 ± 0.014 and a TSS of 0.848 ± 0.069 after 100 runs. According to MaxEnt, the variables that contribute the most were altitude (28.8%), soil type (23%), precipitation of driest month (WorldClim code: bio14, 21.1%), and annual temperature range (WorldClim code: bio7, 9.6%), which explained almost 80.5% of the potential distribution. The mean temperature of the coldest quarter (WorldClim code: bio11) showed a very low contribution (5%), but scored the highest permutation importance with 55%, followed by precipitation of the driest month (bio14), with a 37.9% of permutation importance. The jackknife test showed that the variable with the highest gain, when used in isolation, was soil type. On the contrary, the variable that decreased most the gain when omitted was precipitation of driest month (bio14), indicating that it carries information not present in other variables.
The LGM and PGM models showed a high probability of a larger distribution of C. amblensis compared to the present, with proper environmental conditions that would have included large areas towards the south, reaching Sierra of Tudia and surroundings (Figure 6). The LIG model showed a probability of distribution restricted to the center-west of the Iberian Peninsula, a result very similar to the present model (Figure 6).

4. Discussion

4.1. Relative Utility of ETS, AGT1, and PgiC in Disentangling the Origin of Centaurea tentudaica

The ETS shows multiple copies within a single species, suggesting incomplete concerted evolution at this region, as previously reported in several studies [10,11,13,37]. Low-copy genes show different levels of resolution in the present study, being the PgiC more informative than AGT1. The PgiC region is used here for the first time in section Acrocentron of genus Centaurea and shows great resolution, as found in previous phylogenetic studies on Compositae [15] and Onagraceae [71,72]. The lack of resolution obtained herein with the AGT1 was already observed in other studies, including those of Li et al. (2019) [73] in Orobanchaceae, but in opposition to studies carried out in Centaurea of Compositae [37] and in a large number of families within angiosperms [43], where it proved to be particularly useful.
The lack of resolution of AGT1 in the present study makes it unsuitable for exploring the origin of the polyploidy in C. tentudaica. Despite the high number of polymorphic sites and mutations (Table 2), this region shows the lowest number of parsimony informative sites. This implies that most of the polymorphisms are not shared with any other sequence, resulting in the lack of resolution observed both in the Bayesian analyses and the networks. On the contrary, the ETS shows at least two copies and offers better resolution. The presence of more than one ribotype in one species might be (1) the result of incomplete lineage sorting, or (2) acquisition of different copies through hybridization ([15,44], and references therein). In our case, we have observed that copies are usually shared between nearby populations. For this reason, we think that hybridization is the main cause of the high number of ribotypes observed in a single species. The PgiC region shows high resolution, which is surprising because it has the lowest number of polymorphic sites (Table 2). However, in comparison with the AGT1 region, it has a higher number of parsimony informative sites, which explains its higher resolution. The PgiC region, thus, has been very useful to explore the origin of C. tentudaica, showing more than one copy shared with full support between C. tentudaica and C. amblensis. In summary, the resolution of the three regions was different, and when combined, provided good insights into the genesis of this hexaploid narrow endemic species.

4.2. The Origin of Centaurea tentudaica

The results show that C. tentudaica is closely related to C. amblensis, sharing at least one copy for the three regions analyzed. The most plausible hypothesis is, thereafter, autopolyploidy. Copies of C. tentudaica shared with C. galianoi should be interpreted as a sign of introgression that occurred after the genesis of the polyploid: If C. galianoi was implied in the genesis of C. tentudaica, all the individuals from all populations would show some signs of introgression in the sequences. However, the presence of copies from C. galianoi is limited only to some subpopulations of C. tentudaica (Figure 4). Significantly, subpopulations of C. tentudaica on the southern face of Sierra de Tudia, which are geographically closer to C. galianoi populations, have individuals with orange anther tubes (Figure 7B), while most of the remaining subpopulations have only purple anther tubes like C. amblensis (Figure 7A). Changes in the color of anther tubes in Acrocentron are usually the result of hybridization [37]. Therefore, we should discard on a morphological basis the role of C. galianoi as one of the putative parentals of C. tentudaica because the presence of yellow anthers is only occasional. Centaurea tentudaica also has its own genome, as we can see in the results of AGT1 and PgiC regions. Exclusive copies are probably the result of its geographic isolation, given that we find copies shared between subpopulations and copies exclusive of a single subpopulation. Other examples in Centaurea sect. Acrocentron shows that introgression is very frequent in this group. The polyploid series of C. toletana is a timely case: Tetraploid C. toletana is, by all evidence, an autopolyploid [35], but all the studied populations show evidence of introgression by sharing multiple copies of the nuclear ETS [10].
The allozyme banding patterns are also indicative of autopolyploidy in C. tentudaica because there is no evidence of fixed heterozygosity (as expected for allopolyploids, due to the combination of two divergent parental genomes), and the polymorphic loci show both balanced and unbalanced heterozygotes (e.g., Figure 2). Once accepted that C. tentudaica is probably an autopolyploid of C. amblensis, we should explore geographical evidence. The present distribution of C. amblensis is restricted to altitudes of 800–1500 m on siliceous soils (exceptionally on clay soils) about 300 kilometers north from Sierra de Tudia, the range where C. tentudaica is distributed [35,74]. A plausible explanation is that the ancient distribution of C. amblensis included these hills. The Iberian Peninsula acted as a plant refugium during the Pleistocene, and intense climatic fluctuations led to a series of latitudinal and altitudinal migrations [10,29,75,76,77]. During glacial periods, the conditions that are found at 800 m for the present time would be available at lower altitudes like 400–600 m [20], which are roughly the altitudes found in the plateau connecting directly south-west Spain (Sierra de Tudia) to central Spain (Sierra de Gredos; Figure 2 and Figure 6). As a result, a pathway would have existed between Sierra de Tudia to the area where C. amblensis occurs in central Spain. In support of this hypothetical corridor, the ENM (Figure 6) suggests that the potential area of C. amblensis during the LGM and PGM included the current area of C. tentudaica. These results, thus, strongly support the hypothesis that C. amblensis gave origin to the hexaploid, which colonized and adapted to higher lands during the postglacial warming.
All extant populations of C. amblensis are tetraploid ([35], and references therein), and C. tentudaica is hexaploid [29]. An autopolyploid origin of the hexaploid from the tetraploid could be the result of a cross between an unreduced gamete (4x) and a normally reduced one (2x). Alternately, hexaploid C. tentudaica could be the result of the cross of tetraploid C. amblensis and an individual from the extinct diploid C. amblensis that surely existed at some point. Because triploids are usually sterile ([78,79,80], and references therein), whole-genome duplication might occur to overcome sterility, which would explain the hexaploid level of the species. Our current knowledge of the genetic evolution of the species does not allow us a decision between both hypotheses. However, the allozyme banding patterns of C. tentudaica might give support to the second hypothesis, as some loci (such as Pgi-2; Figure 2) are extremely rich in genotypes (or, more precisely, allele phenotypes). Such a pattern of high allele richness seems very unlikely for a polyploid originated by a cross between an unreduced gamete (4x) and a reduced one (2x), as this probably would have occurred on a scenario of a single origin. Rather, the quite unexpected high levels of genetic diversity detected (P95 = 60.61%, A = 2.03, He = 0.287, and Hi = 0.292) for a species with a narrow range (<2 km2)—despite its polysomic inheritance, points to multiple geographic (and, perhaps, temporal) origins. For example, the levels of allozyme genetic diversity of C. tentudaica are higher than those for other endemic and range-restricted hexaploid species: Coreopsis grandiflora var. longipes (restricted to southeastern Texas; P95 = 38.67%, Hi = 0.287; [81]), Glyceria nubigena (endemic to the Great Smoky Mountains of the southeastern USA; P95 = 0.00%, A = 1.00, He = 0.000; [82]), or several species of Bidens endemic to Hawaii (P95 = 23.8–52.4%, A = 1.24–2.19, He = 0.044–0.158; [83]). In addition, genetic variation in C. tentudaica is much higher than in other polyploid species of sect. Acrocentron (in the autotetraploid C. podospermifolia; P95 = 25.6%; A = 1.41; and He = 0.087; [37]), which suggests that the high polymorphism in C. tentudaica is not the result of phylogenetic inertia. Indeed, multiple origins in polyploids seem to be the rule and not the exception, perhaps because it may increase the genetic variation of a polyploid species, thus facilitating its survival chances [84,85,86,87]. Regarding the conservation status of C. tentudaica, its high genetic diversity should be interpreted as a sign of genetic health, a situation that would be maintained at least in the short-term: the population size is of nearly 16,000 individuals, and there are no signs of genetic fragmentation (FST = 0.023; see also Figure 3). The only threats are grazing by sheep and the exploitation of new plantations of pine (Pinus pinea L.).

5. Conclusions

Once again, molecular markers, such as ETS and low-copy genes, have demonstrated their usefulness for phylogenetic analyses in highly hybridized groups when there are used in conjunction. Our results provide solid evidence of C. tentudaica being an autopolyploid of C. amblensis, which, despite being highly range-restricted, shows high levels of genetic diversity.

Supplementary Materials

The following are available online at https://0-www-mdpi-com.brum.beds.ac.uk/1424-2818/13/2/72/s1, Table S1: Species, origin of the material, herbaria and chromosome number, Table S2: Environmental variables for ENM, Table S3: Marginal Likelihood Estimators for the two models (strict clock and non-clock) obtained using Stepping Stone method, Figure S1: Consensus tree resulting from the analysis of the ETS region of Centaurea tentudaica, Figure S2: Consensus tree resulting from the analysis of the AGT1 region of Centaurea tentudaica, Figure S3: Consensus tree resulting from the analysis of the PgiC region of Centaurea tentudaica, Figure S4: Principal Coordinate Analysis (PCoA) of the three subpopulations of Centaurea tentudaica, based on (allozyme) genotypic distances.

Author Contributions

Conceptualization, N.G.-J., A.S., F.M.; methodology, N.G.-J., J.L.-P., L.D.M.; formal analysis, L.D.M., J.L.-P., N.G.-J.; resources, F.M., F.M.V.; data curation, N.G.-J., L.D.M.; writing—original draft preparation, L.D.M.; writing—review and editing, N.G.-J., J.L.-P., F.M., F.M.V., A.S.; visualization, J.L.-P., L.D.M.; funding acquisition, N.G.-J., J.L.-P., A.S. All authors have read and agreed to the published version of the manuscript.

Funding

This research was funded by the Catalan government (“Ajuts a grups consolidats” 2017-SGR1116).

Institutional Review Board Statement

The study was approved by the Institutional Review Board of the Botanic Institute of Barcelona (CSIC) on 15/10/2020.

Informed Consent Statement

Not applicable.

Data Availability Statement

Data other than DNA sequences are available from the authors by direct request.

Conflicts of Interest

The authors declare no conflict of interest.

References

  1. Mallet, J. Hybrid speciation. Nature 2007, 446, 279–283. [Google Scholar] [CrossRef] [PubMed]
  2. Jiao, Y.; Wickett, N.J.; Ayyampalayam, S.; Chanderbali, A.S.; Landherr, L.; Ralph, P.E.; Tomsho, L.P.; Hu, Y.; Liang, H.; Soltis, P.S.; et al. Ancestral polyploidy in seed plants and angiosperms. Nature 2011, 473, 97–100. [Google Scholar] [CrossRef]
  3. Soltis, P.S.; Marchant, D.B.; Van de Peer, Y.; Soltis, D.E. Polyploidy and genome evolution in plants. Curr. Opin. Genet. Dev. 2015, 35, 119–125. [Google Scholar] [CrossRef] [Green Version]
  4. Landis, J.B.; Soltis, D.E.; Li, Z.; Marx, H.E.; Barker, M.S.; Tank, D.C.; Soltis, P.S. Impact of whole-genome duplication events on diversification rates in angiosperms. Am. J. Bot. 2018, 105, 348–363. [Google Scholar] [CrossRef] [Green Version]
  5. Soltis, P.S.; Soltis, D.E. The role of hybridization in plant speciation. Annu. Rev. Plant Biol. 2009, 60, 561–588. [Google Scholar] [CrossRef] [PubMed] [Green Version]
  6. Mayr, E. Systematics and the Origin of Species; Columbia University Press: New York, NY, USA, 1942. [Google Scholar]
  7. De Queiroz, K. Species concepts and species delimitation. Syst. Biol. 2007, 56, 879–886. [Google Scholar] [CrossRef] [Green Version]
  8. Brennan, A.C.; Barker, D.; Hiscock, S.J.; Abbott, R.J. Molecular genetic and quantitative trait divergence associated with recent homoploid hybrid speciation: A study of Senecio squalidus (Asteraceae). Heredity 2012, 108, 87–95. [Google Scholar] [CrossRef] [Green Version]
  9. Mameli, G.; López-Alvarado, J.; Farris, E.; Susanna, A.; Filigheddu, R.; Garcia-Jacas, N. The role of parental and hybrid species in multiple introgression events: Evidence of homoploid hybrid speciation in Centaurea (Cardueae, Asteraceae). Bot. J. Linn. Soc. 2014, 175, 453–467. [Google Scholar] [CrossRef] [Green Version]
  10. Garcia-Jacas, N.; Soltis, P.S.; Font, M.; Soltis, D.E.; Vilatersana, R.; Susanna, A. The polyploid series of Centaurea toletana: Glacial migrations and introgression revealed by nrDNA and cpDNA sequence analyzes. Mol. Phylogenet. Evol. 2009, 52, 377–394. [Google Scholar] [CrossRef] [PubMed]
  11. Linder, C.R.; Goertzen, L.R.; Heuvel, B.V.; Francisco-Ortega, J.; Jansen, R.K. The complete external transcribed spacer of 18S-26S rDNA: Amplification and phylogenetic utility at low taxonomic levels in Asteraceae and closely allied families. Mol. Phylogenet. Evol. 2000, 14, 285–303. [Google Scholar] [CrossRef]
  12. Font, M.; Vallès, J.; Susanna, A.; Garcia-Jacas, N. Auto- and allopolyploidy in Centaurea sect. Acrocentron s. l. (Asteraceae, Cardueae): Karyotype and fluorochrome banding pattern analyses. Collect. Bot. 2008, 27, 7–18. [Google Scholar]
  13. Font, M.; Garcia-Jacas, N.; Vilatersana, R.; Roquet, C.; Susanna, A. Evolution and biogeography of Centaurea section Acrocentron inferred from nuclear and plastid DNA sequence analyses. Ann. Bot. 2009, 103, 985–997. [Google Scholar] [CrossRef]
  14. Small, R.L.; Cronn, R.C.; Wendel, J.F. Use of nuclear genes for phylogeny reconstruction in plants. Aust. Syst. Bot. 2004, 17, 145–170. [Google Scholar] [CrossRef]
  15. Ford, V.S.; Lee, J.; Baldwin, B.G.; Gottlieb, L.D. Species divergence and relationships in Stephanomeria (Compositae): PgiC phylogeny compared to prior biosystematic studies. Am. J. Bot. 2006, 93, 480–490. [Google Scholar] [CrossRef]
  16. López-Pujol, J.; Bosch, M.; Simon, J.; Blanché, C. Allozyme diversity in the tetraploid endemic Thymus loscosii (Lamiaceae). Ann. Bot. 2004, 93, 323–332. [Google Scholar] [CrossRef]
  17. Palop-Esteban, M.; Segarra-Moragues, J.G.; González-Candelas, F. Polyploid origin, genetic diversity and population structure in the tetraploid sea lavender Limonium narbonense Miller (Plumbaginaceae) from eastern Spain. Genetica 2011, 139, 1309–1322. [Google Scholar] [CrossRef] [PubMed]
  18. Hamrick, J.L.; Godt, M.J.W. Allozyme diversity in plant species. In Plant Population Genetics, Breeding, and Genetic Resources; Brown, A.H.D., Clegg, M.T., Kahler, A.L., Weir, B.S., Eds.; Sinauer Associates: Sunderland, MA, USA, 1990; pp. 43–63. [Google Scholar]
  19. Hewitt, G.M. Mediterranean peninsulas: The evolution of hotspots. In Biodiversity Hotspots; Zachos, F.E., Habel, J.C., Eds.; Springer: Berlin/Heidelberg, Germany, 2011; pp. 123–147. [Google Scholar]
  20. Peñalba, M.C.; Arnold, M.; Guiot, J.; Duplessy, J.C.; de Beaulieu, J.L. Termination of the last glaciation in the Iberian Peninsula inferred from the pollen sequence of Quintanar de la Sierra. Quat. Res. 1997, 48, 205–214. [Google Scholar] [CrossRef]
  21. Hewitt, G.M. Quaternary phylogeography: The roots of hybrid zones. Genetica 2011, 139, 617–638. [Google Scholar] [CrossRef] [PubMed]
  22. López-Alvarez, D.; Manzaneda, A.J.; Rey, P.J.; Giraldo, P.; Benavente, E.; Allainguillaume, J.; Mur, L.; Caicedo, A.L.; Hazen, S.P.; Breiman, A.; et al. Environmental niche variation and evolutionary diversification of the Brachypodium distachyon grass complex species in their native circum-Mediterranean range. Am. J. Bot. 2015, 102, 1073–1088. [Google Scholar] [CrossRef] [PubMed] [Green Version]
  23. Marques, I.; Draper, D.; López-Herranz, M.L.; Garnatje, T.; Segarra-Moragues, J.G.; Catalán, P. Past climate changes facilitated homoploid speciation in three mountain spiny fescues (Festuca, Poaceae). Sci. Rep. 2016, 6, 36283. [Google Scholar] [CrossRef] [PubMed] [Green Version]
  24. de Luis, M.; Álvarez-Jiménez, J.; Rejos, F.J.; Bartolomé, C. Using species distribution models to locate the potential cradles of the allopolyploid Gypsophila bermejoi G. López (Caryophyllaceae). PLoS ONE 2020, 15, e0232736. [Google Scholar] [CrossRef] [PubMed]
  25. Garcia-Jacas, N.; Susanna, A. Centaurea prolongi and C. crocata in Portugal: An old confusion. Nord. J. Bot. 1994, 14, 31–38. [Google Scholar] [CrossRef]
  26. Garcia-Jacas, N. Centaurea kunkelii (Asteraceae, Cardueae), a new hybridogenic endecaploid species of sect. Acrocentron from Spain. Ann. Bot. Fenn. 1998, 35, 159–167. [Google Scholar]
  27. Font, M.; Garnatje, T.; Garcia-Jacas, N.; Susanna, A. Delineation and phylogeny of Centaurea sect. Acrocentron based on DNA sequences: A restoration of the genus Crocodylium and indirect evidence of introgression. Plant Syst. Evol. 2002, 234, 15–26. [Google Scholar] [CrossRef]
  28. Hilpold, A.; Garcia-Jacas, N.; Vilatersana, R.; Susanna, A. Taxonomical and nomenclatural notes on Centaurea: A proposal of classification, a description of new sections and subsections, and a species list of the redefined section Centaurea. Collect. Bot. 2014, 33, e001. [Google Scholar] [CrossRef] [Green Version]
  29. Márquez, F. Centaurea de Tentudía: Estudios Para su Conservación. Ph.D. Thesis, University of Extremadura, Badajoz, Spain, 2015. [Google Scholar]
  30. Rivas Goday, S. Vegetación y Flórula de la Cuenca Extremeña del Guadiana (Vegetación y Flórula de la Provincia de Badajoz); Publicaciones de la Excma. Diputación Provincial de Badajoz: Madrid, Spain, 1964. [Google Scholar]
  31. Rivas Martínez, S. De nomenclatura notulae, I. Lazaroa 1980, 2, 327–328. [Google Scholar]
  32. Fernández Casas, F.J.; Susanna, A. De Centaureis occidentalibus notulae sparsae III. Fontqueria 1982, 1, 1–8. [Google Scholar]
  33. Rivas Martínez, S. Bioclimatología, biogeografía y series de vegetación de Andalucía Occidental. Lagascalia 1988, 15, 91–119. [Google Scholar]
  34. Márquez, F.; Alonso, D.G.; Vázquez, F.M. Estudio de distribución y caracterización del hábitat del taxon amenazado Centaurea amblensis subsp. tentudaica (Rivas Goday) Rivas-Martínez. Folia Bot. Extremad. 2011, 5, 37–43. [Google Scholar]
  35. Fernández Casas, F.J.; Susanna, A. Monografía de la sección Chamaecyanus Willk. del género Centaurea L. Treb. Inst. Bot. Barc. 1985, 10, 1–174. [Google Scholar]
  36. Soltis, D.E.; Soltis, P.S.; Schemske, D.W.; Hancock, J.F.; Thompson, J.N.; Husband, B.C.; Judd, W.S. 2007. Autopolyploidy in angiosperms: Have we grossly underestimated the number of species? Taxon 2007, 56, 13–30. [Google Scholar]
  37. López-Pujol, J.; Garcia-Jacas, N.; Susanna, A.; Vilatersana, R. Should we conserve pure species or hybrid species? Delimiting hybridization and introgression in the Iberian endemic Centaurea podospermifolia. Biol. Conserv. 2012, 152, 271–279. [Google Scholar] [CrossRef]
  38. Doyle, J.J.; Dickson, E.E. Preservation of plant samples for DNA restriction endonuclease analysis. Taxon 1987, 36, 715–722. [Google Scholar] [CrossRef]
  39. Cullings, K.W. Design and testing of a plant-specific PCR primer for ecological and evolutionary studies. Mol. Ecol. 1992, 1, 233–240. [Google Scholar] [CrossRef]
  40. Tel-Zur, N.; Abbo, S.; Mysladbodksi, D.; Mizrahi, Y. Modified CTAB procedure for DNA isolation from epiphytic cacti of genera Hylocereus and Selenicereus (Cactaceae). Plant Mol. Biol. Rep. 1999, 17, 249–254. [Google Scholar] [CrossRef]
  41. Baldwin, B.G.; Markos, S. Phylogenetic utility of the External Transcribed Spacer (ETS) of 18S–26S rDNA: Congruence of ETS and ITS trees of Calycadenia (Compositae). Mol. Phylogenet. Evol. 1998, 10, 449–463. [Google Scholar] [CrossRef]
  42. Susanna, A.; Galbany-Casals, M.; Romaschenko, K.; Barres, L.; Martín, J.; Garcia-Jacas, N. Lessons from Plectocephalus (Compositae, Cardueae-Centaureinae): ITS disorientation in annuals and Beringian dispersal revealed by molecular analyses. Ann. Bot. 2011, 108, 263–277. [Google Scholar] [CrossRef]
  43. Li, M.; Wunder, J.; Bissoli, G.; Scarponi, E.; Gazzani, S.; Barbaro, E.; Saedler, H.; Varotto, C. Development of COS genes as universally amplifiable markers for phylogenetic reconstructions of closely related plant species. Cladistics 2008, 24, 727–745. [Google Scholar] [CrossRef] [Green Version]
  44. Vilatersana, R.; Brysting, A.K.; Brochmann, C. Molecular evidence for hybrid origins of the invasive polyploids Carthamus creticus and C. turkestanicus (Cardueae, Asteraceae). Mol. Phylogenet. Evol. 2007, 44, 610–621. [Google Scholar] [CrossRef] [PubMed]
  45. Hall, T.A. BioEdit: A user-friendly biological sequence alignment editor and analysis program for Windows 95/98/NT. Nucleic Acids Symp. Ser. 1999, 41, 95–98. [Google Scholar]
  46. Cline, J.; Braman, J.C.; Hogrefe, H.H. PCR fidelity of Pfu DNA polymerase and other thermostable DNA polymerases. Nucleic Acids Res. 1996, 24, 3546–3551. [Google Scholar] [CrossRef] [Green Version]
  47. Popp, M.; Oxelman, B. Inferring the history of the polyploid Silene aegaea (Caryophyllaceae) using plastid and homoeologous nuclear DNA sequences. Mol. Phylogenet. Evol. 2001, 20, 474–481. [Google Scholar] [CrossRef]
  48. Martin, D.P.; Murrell, B.; Golden, M.; Khoosal, A.; Muhire, B. RDP4: Detection and analysis of recombination patterns in virus genomes. Virus Evol. 2015, 1, vev003. [Google Scholar] [CrossRef] [PubMed] [Green Version]
  49. Huson, D.H.; Bryant, D. Application of phylogenetic networks in evolutionary studies. Mol. Biol. Evol. 2006, 23, 254–267. [Google Scholar] [CrossRef] [PubMed]
  50. Darriba, D.; Taboada, G.L.; Doallo, R.; Posada, D. jModelTest 2: More models, new heuristics and parallel computing. Nat. Methods 2012, 9, 772. [Google Scholar] [CrossRef] [Green Version]
  51. Ronquist, F.; Teslenko, M.; Van der Mark, P.; Ayres, D.L.; Darling, A.; Höhna, S.; Larget, B.; Liu, L.; Suchard, M.A.; Huelsenbeck, J.P. MrBayes 3.2: Efficient Bayesian phylogenetic inference and model choice across a large model space. Syst. Biol. 2012, 61, 539–542. [Google Scholar] [CrossRef] [PubMed] [Green Version]
  52. Rambaut, A.; Drummond, A.J.; Xie, D.; Baele, G.; Suchard, M.A. Posterior summarization in Bayesian phylogenetics using Tracer 1.7. Syst. Biol. 2018, 67, 901–904. [Google Scholar] [CrossRef] [Green Version]
  53. Wendel, F.; Weeden, N.F. Visualization and interpretation of plant isozymes. In Isozymes in Plant Biology; Soltis, D.E., Soltis, P.S., Eds.; Springer: Dordrecht, The Netherlands, 1989; pp. 5–45. [Google Scholar]
  54. Rogers, D.L. Genotypic diversity and clone size in old-growth populations of coast redwood (Sequoia sempervirens). Can. J. Bot. 2000, 78, 1408–1419. [Google Scholar]
  55. Wang, A.; Chen, Y.; Chen, G.; Lee, J.; Fu, C. Relationships and hybridization among Smilax china and its affinities: Evidence from allozyme data. Biochem. Genet. 2008, 46, 281–292. [Google Scholar] [CrossRef]
  56. López-Vinyallonga, S.; Soriano, I.; Susanna, A.; Montserrat, J.M.; Roquet, C.; Garcia-Jacas, N. The polyploid series of the Achillea millefolium aggregate in the Iberian Peninsula investigated using microsatellites. PLoS ONE 2015, 10, e0129861. [Google Scholar]
  57. Zozomová-Lihová, J.; Krak, K.; Mandákova, T.; Shimizu, K.K.; Španiel, S.; Vít, P.; Lysak, M.A. Multiple hybridization events in Cardamine (Brassicaceae) during the last 150 years: Revisiting a textbook example of neoallopolyploidy. Ann. Bot. 2014, 113, 817–830. [Google Scholar] [CrossRef] [Green Version]
  58. Swofford, D.L.; Selander, R.B. Biosys-1: Release 1.7. A Computer Program for the Analysis of Allelic Variation in Genetics. User’s Manual; Department of Genetics and Development, University of Illinois: Urbana-Champaign, IL, USA, 1989. [Google Scholar]
  59. Vekemans, X. AFLP-SURV Ver. 1.0 A Program for Genetic Diversity Analysis with AFLP (and RAPD) Population Data; Distributed by the author; Laboratoire de Génétique et Ecologie Végétale, Université Libre de Bruxelles: Brussels, Belgium, 2002. [Google Scholar]
  60. Peakall, R.; Smouse, P.E. GenAlEx 6: Genetic analysis in Excel. Population genetic software for teaching and research. Mol. Ecol. Notes 2006, 6, 288–295. [Google Scholar] [CrossRef]
  61. Pearson, R.G.; Raxworthy, C.J.; Nakamura, M.; Peterson, A.T. Predicting species distributions from small numbers of occurrence records: A test case using cryptic geckos in Madagascar. J. Biogeogr. 2007, 34, 102–117. [Google Scholar] [CrossRef]
  62. Phillips, S.J.; Anderson, R.P.; Schapire, R.E. Maximum entropy modeling of species geographic distributions. Ecol. Model. 2006, 190, 231–259. [Google Scholar] [CrossRef] [Green Version]
  63. Phillips, S.J.; Dudík, M. Modeling of species distributions with MaxEnt: New extensions and a comprehensive evaluation. Ecography 2008, 31, 161–175. [Google Scholar] [CrossRef]
  64. Brown, J.L.; Bennett, J.R.; French, C.M. SDMtoolbox 2.0: The next generation Python-based GIS toolkit for landscape genetic, biogeographic and species distribution model analyses. PeerJ 2017, 5, e4095. [Google Scholar] [CrossRef] [Green Version]
  65. Yokoyama, Y.; Lambeck, K.; Deckker, P.D.; Johnston, P.; Fifield, L.K. Timing of the Last Glacial Maximum from observed sea-level minima. Nature 2000, 406, 713–716. [Google Scholar] [CrossRef]
  66. Huybrechts, P. Sea-level changes at the LGM from ice-dynamic reconstructions of the Greenland and Antarctic ice sheets during the glacial cycles. Quat. Sci. Rev. 2002, 21, 203–231. [Google Scholar] [CrossRef] [Green Version]
  67. Polyak, V.J.; Onac, B.P.; Fornós, J.J.; Hay, C.; Asmerom, Y.; Dorale, J.A.; Ginés, J.; Tuccimei, P.; Ginés, A. A highly resolved record of relative sea level in the western Mediterranean Sea during the last interglacial period. Nat. Geosci. 2018, 11, 860–864. [Google Scholar] [CrossRef]
  68. Menviel, L.; Capron, E.; Govin, A.; Dutton, A.; Tarasov, L.; Abe-Ouchi, A.; Drysdale, R.N.; Gibbard, P.L.; Gregoire, L.; He, F.; et al. The penultimate deglaciation: Protocol for Paleoclimate Modelling Intercomparison Project (PMIP) phase 4 transient numerical simulations between 140 and 127 ka, version 1.0. Geosci. Model Dev. 2019, 12, 3649–3685. [Google Scholar] [CrossRef] [Green Version]
  69. Allouche, O.; Tsoar, A.; Kadmon, R. Assessing the accuracy of species distribution models: Prevalence, kappa and the true skill statistic (TSS). J. Appl. Ecol. 2006, 43, 1223–1232. [Google Scholar] [CrossRef]
  70. R Core Team. R: A Language and Environment for Statistical Computing; R Foundation for Statistical Computing: Vienna, Austria; Available online: https://www.R-project.org/ (accessed on 20 January 2021).
  71. Gottlieb, L.D.; Ford, V.S. Phylogenetic relationships among the sections of Clarkia (Onagraceae) inferred from the nucleotide sequences of PgiC. Syst. Bot. 1996, 21, 45–62. [Google Scholar] [CrossRef]
  72. Ford, V.S.; Gottlieb, L.D. Tribal relationships within Onagraceae inferred from PgiC sequences. Syst. Bot. 2007, 32, 348–356. [Google Scholar] [CrossRef]
  73. Li, X.; Feng, T.; Randle, C.; Schneeweiss, G.M. Phylogenetic relationships in Orobanchaceae inferred from low-copy nuclear genes: Consolidation of major clades and identification of a novel position of the non-photosynthetic Orobanche clade sister to all other parasitic Orobanchaceae. Front. Plant Sci. 2019, 10, 902. [Google Scholar] [CrossRef] [Green Version]
  74. López, E.; Devesa, J.A. Estudio taxonómico de Centaurea sect. Acrocentron (Cass.) DC. (Asteraceae) en la Península Ibérica y Baleares. Lagascalia 2013, 33, 75–173. [Google Scholar]
  75. Gutiérrez Larena, B.; Fuertes Aguilar, J.; Nieto Feliner, G. Glacial-induced altitudinal migrations in Armeria (Plumbaginaceae) inferred from patterns of chloroplast DNA haplotype sharing. Mol. Ecol. 2002, 11, 1965–1974. [Google Scholar] [CrossRef] [PubMed] [Green Version]
  76. Carrión, J.S.; Fernández, S.; González-Sampériz, P.; Gil-Romera, G.; Badal, E.; Carrión-Marco, Y.; López-Merino, L.; López-Sáez, J.A.; Fierro, E.; Burjachs, F. Expected trends and surprises in the Lateglacial and Holocene vegetation history of the Iberian Peninsula and Balearic Islands. Rev. Palaeobot. Palynol. 2010, 162, 458–475. [Google Scholar] [CrossRef] [Green Version]
  77. Ben-Menni Schuler, S.; López-Pujol, J.; Blanca, G.; Vilatersana, R.; Garcia-Jacas, N.; Suárez-Santiago, V.N. Influence of the Quaternary glacial cycles and the mountains on the reticulations in the subsection Willkommia of the genus Centaurea. Front. Plant Sci. 2019, 10, 303. [Google Scholar] [CrossRef]
  78. Vilatersana, R.; Susanna, A.; Garcia-Jacas, N.; Garnatje, T. Karyology, generic delineation and dysploidy in the genera Carduncellus, Carthamus and Phonus (Asteraceae). Bot. J. Linn. Soc. 2000, 134, 425–438. [Google Scholar] [CrossRef]
  79. Garnatje, T.; Garcia-Jacas, N.; Vilatersana, R. Natural triploidy in Centaurea and Cheirolophus (Asteraceae). Bot. Helv. 2001, 111, 25–29. [Google Scholar]
  80. Ferriol, M.; Garmendia, A.; Ruiz, J.J.; Merle, H.; Boira, H. Morphological and molecular analysis of natural hybrids between the diploid Centaurea aspera L. and the tetraploid C. seridis L. (Compositae). Plant Biosyst. 2012, 146, 86–100. [Google Scholar] [CrossRef]
  81. Crawford, D.J.; Smith, E.B. Allozyme divergence and intraspecific variation in Coreopsis grandiflora (Compositae). Syst. Bot. 1984, 9, 219–225. [Google Scholar] [CrossRef]
  82. Godt, M.J.W.; Hamrick, J.L. Allozyme variation in two Great Smoky mountain endemics: Glyceria nubigena and Rugelia nudicaulis. J. Hered. 1995, 86, 194–198. [Google Scholar] [CrossRef]
  83. Helenurm, K.; Ganders, F.R. Adaptive radiation and genetic differentiation in Hawaiian Bidens. Evolution 1985, 39, 753–765. [Google Scholar] [CrossRef]
  84. Ellstrand, N.C.; Roose, M.L. Patterns of genotypic diversity in clonal plant species. Am. J. Bot. 1987, 74, 123–131. [Google Scholar] [CrossRef]
  85. Segraves, K.A.; Thompson, J.N.; Soltis, P.S.; Soltis, D.E. Multiple origins of polyploidy and the geographic structure of Heuchera grossulariifolia. Mol. Ecol. 1999, 8, 253–262. [Google Scholar] [CrossRef] [Green Version]
  86. Soltis, D.E.; Soltis, P.S. Polyploidy: Recurrent formation and genome evolution. Trends Ecol. Evol. 1999, 14, 348–352. [Google Scholar] [CrossRef]
  87. Soltis, P.S.; Soltis, D.E. The role of genetic and genomic attributes in the success of polyploids. Proc. Natl. Acad. Sci. USA 2000, 97, 7051–7057. [Google Scholar] [CrossRef] [PubMed] [Green Version]
Figure 1. Map of south-western Iberian Peninsula (left) with the sampling points. The maps on the right shows, on top, the locations sampled on Sierra de Tudia; green location symbol, sampled individuals for DNA sequencing; at the bottom, the yellow shadow represents the sampled area for allozymes (which approximately corresponds to the species range), with the three subpopulations indicated; C1: Cerro Tudia, C2: El Labrado and C3: Los Bonales. Data of the population codes are shown in Table S1. Maps were obtained from www.maps-for-free.com, www.geamap.com (15 November 2020), and the National Geographic Institute (15 November 2020).
Diversity 13 00072 g001
Figure 2. Zymogram of the PGI (phosphoglucoisomerase) enzyme in 30 individuals (mostly collected from El Labrado subpopulation) of Centaurea tentudaica, where two allozyme loci are identified (the faster-migrating Pgi-1, monomorphic, and the slower-migrating Pgi-2, polymorphic). The two approximations that are explained in Section 2 to interpret the banding patterns are outlined here ((A) treating the data as codominant; (B) treating the data as dominant). Through the first approach, up to four alleles can be identified for the Pgi-2 (‘a’, ‘b’, ‘c’, and ‘d’). As we were not able to estimate the allele dosage (that is, the number of copies of each allele) in all the individuals, we assigned ‘allele phenotypes’ (indicated at the bottom of the zymogram) instead of true genotypes. Please note that individuals 3–13 are all codified as ‘ab’, but they might actually correspond to different genotypes: Individuals 7, 9, and 10 could be ‘aabbbb’ or ‘abbbbb’ but, instead, individuals 4, 5, and 12 are probably ‘aaabbb’ or even ‘aaaabb’. Through the second approach, each of the four alleles that can be identified in the Pgi-2 is treated as a dominant locus, so if present, it is codified as ‘1′, if absent, as ‘0′. Hence, an individual that in the upper part of the graph is codified as ‘ab’, in the lower part of the graph is codified as ‘0.0.1.1′, while an individual with an allele phenotype ‘abcd’ would be ‘1.1.1.1′.
Diversity 13 00072 g002
Figure 3. Neighbor-Net for the ETS region of Centaurea tentudaica. Letters correspond with the clades, shown in Figure S1. * indicates the statistically supported clades in the Bayesian analysis with a posterior probability above 0.90. †1 = 0.025; †2 = 0.004; †3 = 0.031; †4 = 0.004; †5 = 0.031.
Diversity 13 00072 g003
Figure 4. Neighbor-Net for the AGT1 region of Centaurea tentudaica. Letters correspond with the clades, shown in Figure S2. * indicates the statistically supported clades in the Bayesian analysis with a posterior probability above 0.90. † = 0.029.
Diversity 13 00072 g004
Figure 5. Neighbor-Net for the PgiC region of Centaurea tentudaica. Letters correspond with the clades, shown in Figure S3. * indicates the statistically supported clades in the Bayesian analysis with a posterior probability above 0.90. † = 0.071.
Diversity 13 00072 g005
Figure 6. Potential distribution of Centaurea amblensis at present, Last Glacial Maximum (LGM), Last Interglacial Period (LIG), and Penultimate Glacial Maximum (PGM) conditions. Shaded areas indicate the probability of presence according to the scale of color shown in the figure. Black dots represent the locations used to construct the model. The solid black line indicates the coastline of the Iberian Peninsula at the two glacial maxima (LGM and PGM). The blue triangle represents the actual population of Centaurea tentudaica.
Diversity 13 00072 g006
Figure 7. (A) Centaurea tentudaica with dark pink florets and acaulescent habit and purple anther tubes; (B) Centaurea tentudaica with pale pink florets and orange anther tubes; (C) Centaurea tentudaica with leaves similar to C. cephalariifolia and caulescent habit; (D) Centaurea amblensis. Photos: (AC) Alfonso Susanna; (D) Francisco Márquez.
Diversity 13 00072 g007
Table 1. Levels of genetic diversity of the three studied subpopulations of Centaurea tentudaica. N, sample size; P95, percentage of polymorphic loci (0.95 criterion); A, mean number of alleles per locus; He, unbiased expected heterozygosity; Hi, individual heterozygosity.
SubpopulationNP95AHeHi
Cerro Tudia2654.55%1.910.2630.263
El Labrado2863.64%2.090.3110.330
Cumbre de los Bonales3163.64%2.090.2860.283
Average60.61%2.030.2870.292
Table 2. Polymorphic site data of the ETS, AGT1, and PgiC regions.
SpeciesRegionNumber of GapsPolymorphic SitesTotal MutationsParsimony Informative Sites
C. tentudaicaETS127737548
AGT127851517
PgiC2353714
Publisher’s Note: MDPI stays neutral with regard to jurisdictional claims in published maps and institutional affiliations.

