Article

Inventory and Assemblage Classification of the Freshwater Mussels (Mollusca: Unionidae) of the Strawberry River, Arkansas, USA, with Implications for Conservation Planning

1
Biology Department, Clarkson University, Potsdam, NY 13676, USA
2
Biology Department, University of Massachusetts Boston, Boston, MA 02125, USA
3
Biology Department, Ohio State University, Columbus, OH 43210, USA
4
Department of Biological Sciences, Arkansas State University, State University, AR 71752, USA
*
Author to whom correspondence should be addressed.
Submission received: 21 January 2021 / Revised: 15 February 2021 / Accepted: 16 February 2021 / Published: 18 February 2021
(This article belongs to the Special Issue Freshwater Mollusk Conservation)

Abstract

:
Spatial hierarchical approaches to classify freshwater systems can add to our understanding of biogeographical patterns and can be used for biodiversity conservation planning. The Strawberry River is located primarily in the Ozark Highlands Central Plateau of north central Arkansas, USA, with a small downstream portion in the Mississippi Alluvial Plain and has been designated an Extraordinary Resource Water, an Ecologically Sensitive Water Body, and a Natural Scenic Waterway. The goals of this study were to document Strawberry River, Arkansas freshwater mussels to aid in conservation planning. Our first objective was to inventory freshwater mussel species in the Strawberry River. Our second objective was to use this stream-wide dataset to classify the freshwater mussel assemblages. We used unpublished survey data of 59 sites distributed from the headwaters to the mouth to inventory species occurrence and abundance, classified mussel assemblages using non-metric multi-dimensional scaling (NMS), and conducted indicator species analysis on resulting assemblages. We observed 39 taxa across the 59 survey sites including two S1, five S2, 16 S3, 11 S4, four S5, and one state non-ranked conservation rank species. Furthermore, our assemblage NMS revealed two distinct freshwater mussel assemblages roughly organized by an upstream (Sites 1–31) to downstream (Sites 32–59) gradient. There were five upstream indicator species and 13 downstream indicator species. This study provides a case study on using existing datasets with NMS and indicator species analyses to classify mussel assemblages and adds to our understanding of freshwater mussel fauna classification at smaller spatial scales. Both NMS and indicator species outcomes can aid in conservation planning for freshwater mussels.

1. Introduction

Spatial hierarchical approaches to classify freshwater systems can be used for biodiversity conservation planning, and one such approach is a four-level zoogeographic classification which includes an aquatic zoogeographic unit (AZU; 10,000–100,000 km2), ecological drainage units (EDU; 1000–10,000 km2) within AZU, aquatic ecological systems (AES; 100–1000 km2) within EDU, and macrohabitats (i.e., valley segments; 1–10 km length) within AES [1]. North American freshwater mussels have been classified into four major faunal regions and 17 smaller faunal provinces [2]. When comparing the two classification approaches, the freshwater mussel faunal regions represent AZU, while freshwater mussel provinces represent EDU with regional biodiversity distinctions within AZU [1,2]. While larger hierarchical freshwater mussel classification patterns are useful for conservation planning, additional case studies at the AES and macrohabitat scales are needed that (1) illustrate techniques to classify freshwater mussels at these scales and (2) aid conservation efforts by identifying spatial units characterizing aquatic ecosystem diversity. Accordingly, opportunities exist to classify mussel assemblages at smaller spatial scales of AES and macrohabitats based on evidence that mussels are distributed by small-, mid-, and large-sized stream guilds and to a lesser extent macrohabitat [3].
The Strawberry River is located primarily in the Ozark Highlands Central Plateau of northeast Arkansas, USA, with a small downstream portion in the Mississippi Alluvial Plain [4], and it has been designated an Extraordinary Resource Water, an Ecologically Sensitive Water Body, and a Natural Scenic Waterway [5]. However, recent water quality assessments have indicated decreasing water quality due to reach and sub-watershed scale habitat degradation [6,7]. The Strawberry River is known to support diverse aquatic macroinvertebrate [8] and fish [9,10] communities, and it has been considered a hotspot for at-risk fish and mussel species and a critical watershed for conservation of these species [11]. Furthermore, the Strawberry River was ranked among the top five hydrologic units in the Ozark and Ouachita highlands based on species richness, species density, and habitat availability for rare species used to calculate a relative importance index value [12]. While there have been freshwater mussels reported from a few sampling sites in the Strawberry River [8], no stream-wide surveys have been conducted exclusively for freshwater mussels that could aid in conservation planning.
The goal of this study was to document Strawberry River mussels to aid in conservation planning by identifying spatial units that characterize mussel diversity. Our first objective was to use available surveys to inventory freshwater mussel species inhabiting the Strawberry River. Our second objective was to use this stream-wide dataset to classify the freshwater mussel assemblages at finer scale than the Mississippian faunal region and Interior Highlands faunal province hierarchical classification. Based on previous studies on stream size guilds [3], we expect the Strawberry River mussel assemblages to classify into distinct groups along the stream-size gradient, especially small- and mid-size stream guilds, and to have identifiable dominant (>10% relative abundance at >3% site occurrences) species indicators. Further, our results may be useful in considering conservation planning for freshwater mussels [13].

2. Materials and Methods
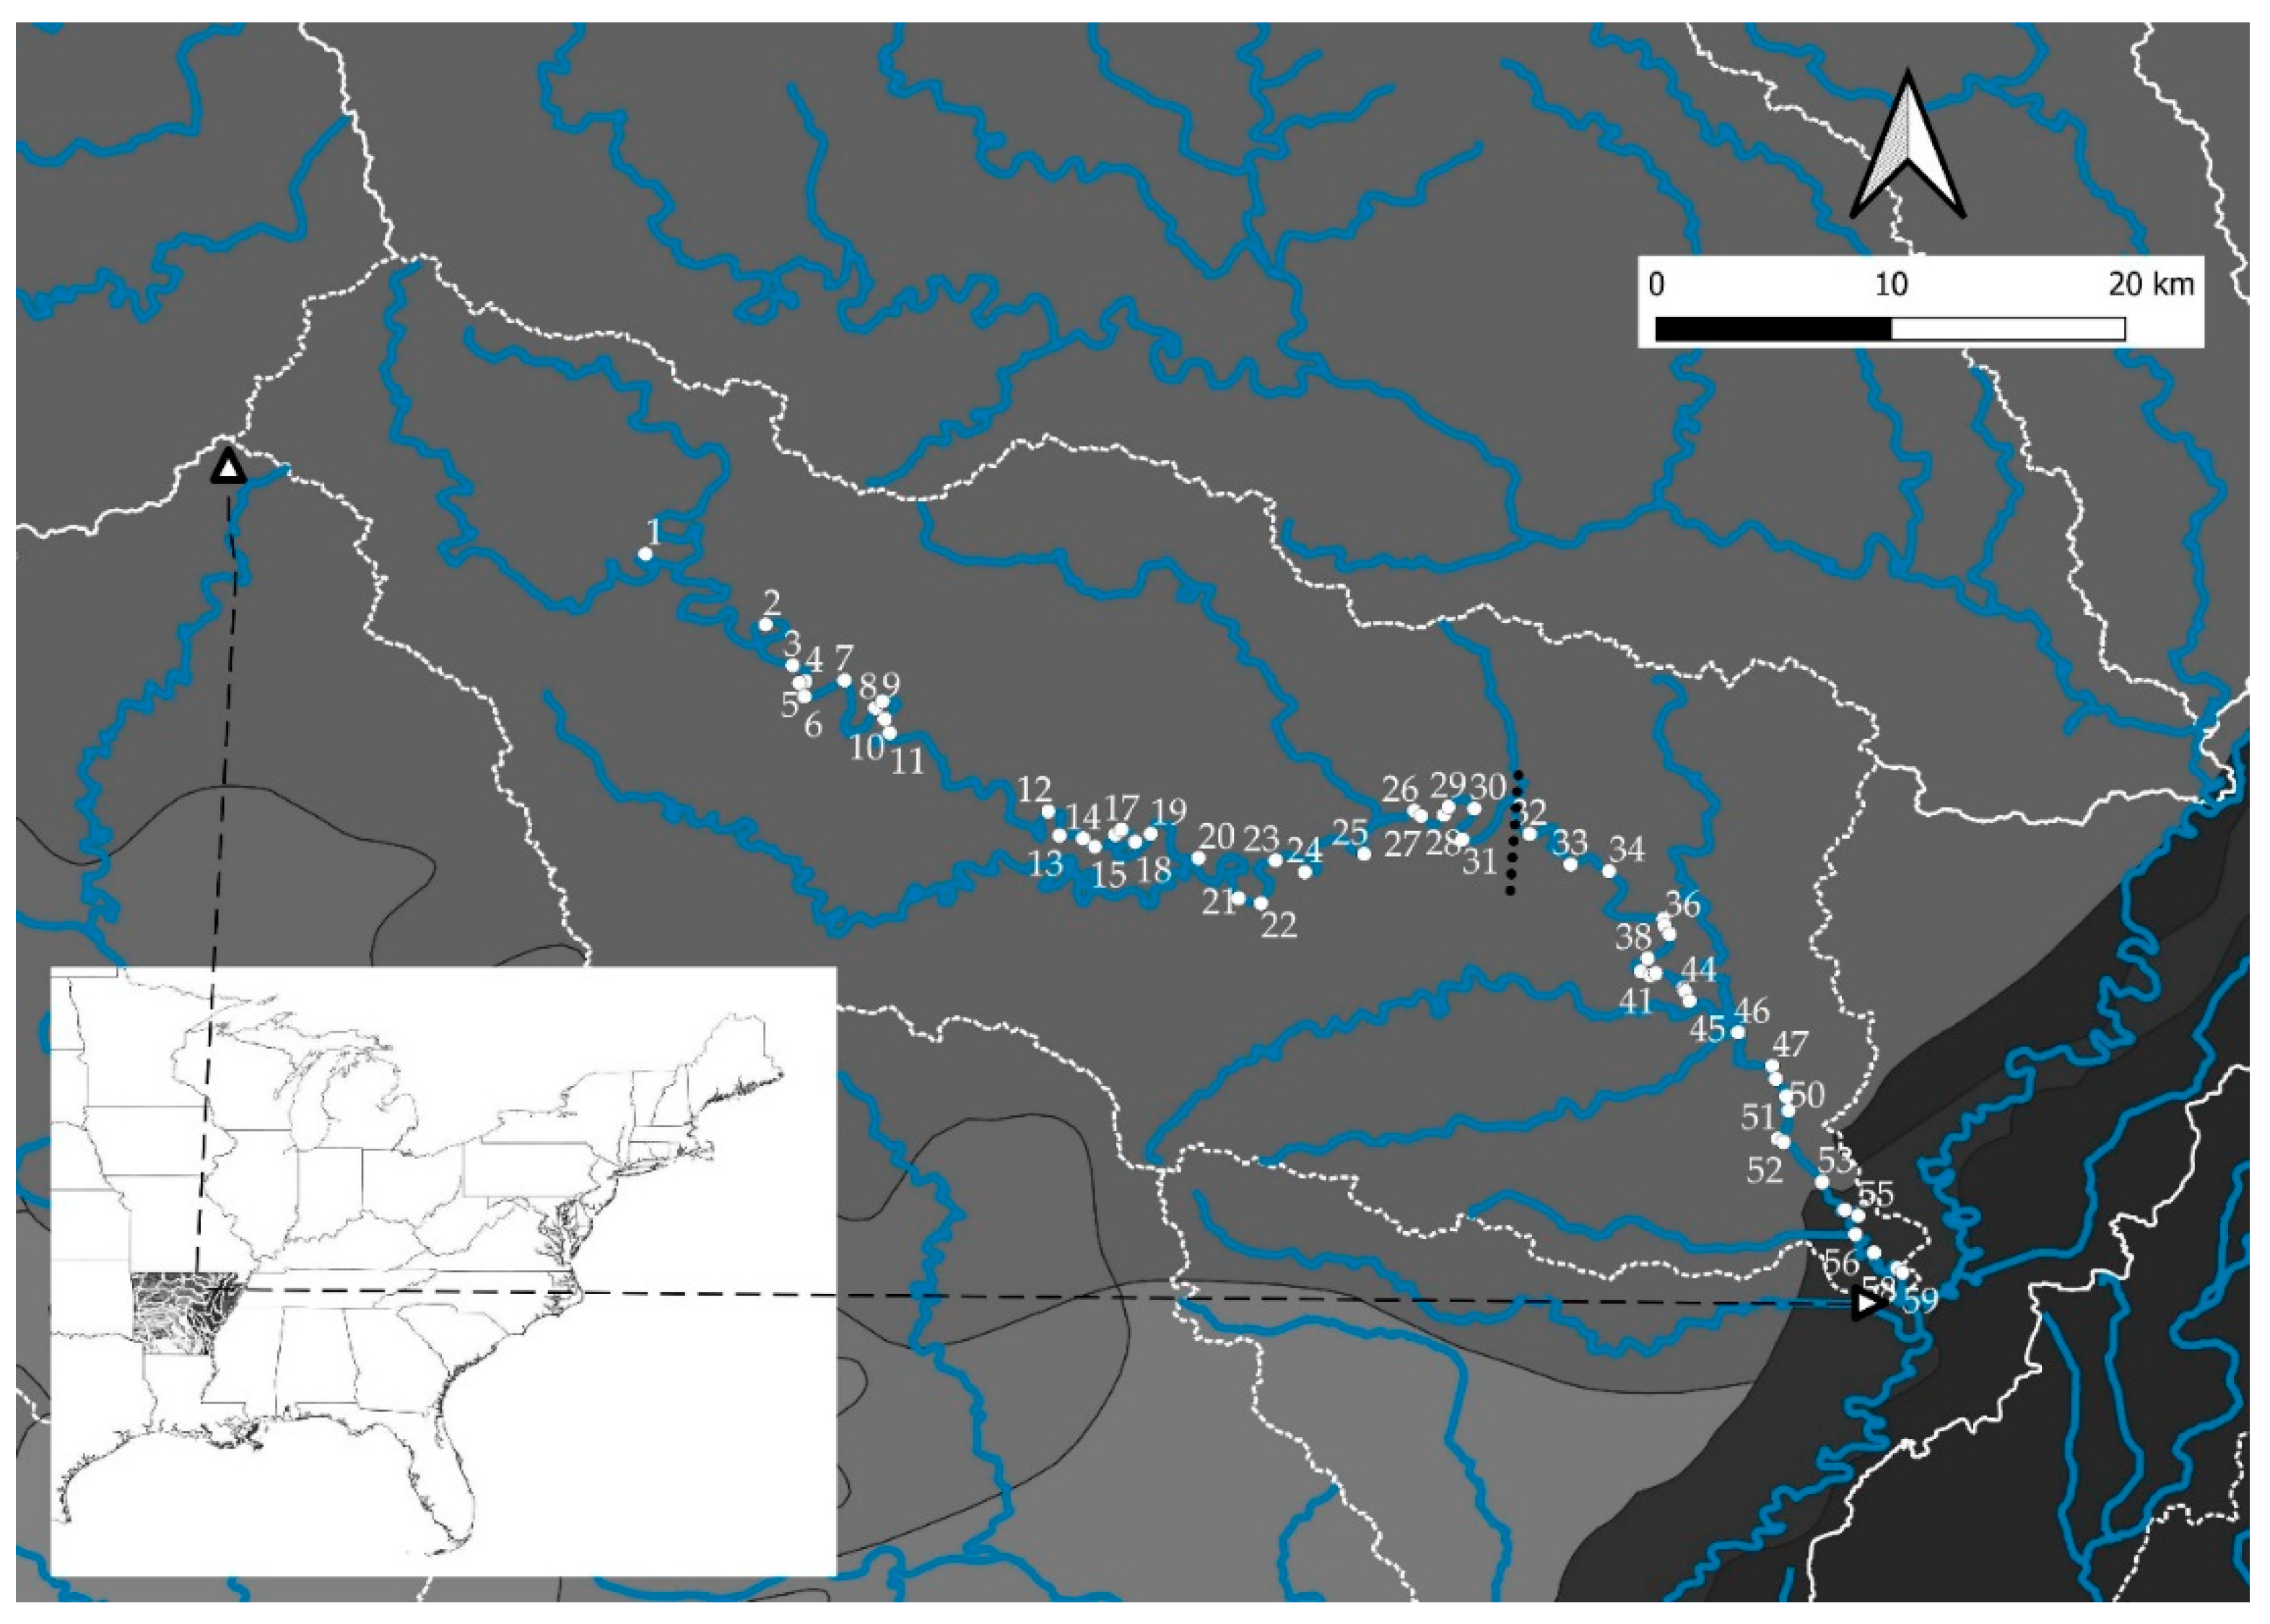
2.1. Study Area

The Strawberry River in north central Arkansas, USA, is a tributary of the Black River within the White River basin (Figure 1) and has a 1970 km2 watershed. The free-flowing Strawberry River winds approximately 185 km through the Ozark Central Plateau Ecoregion, before joining the Black River at the western edge of the Mississippi Alluvial Plain northeast of Swifton, Arkansas [4]. The Strawberry River is predominantly a spring-fed, clear stream consisting of wide, shallow pools separated by riffles [8]. The Strawberry River watershed is dominated by dolomite (50.6%) and sandstone (43.3%), has 1.3% Quaternary alluvial deposits, and has a land cover of 41% deciduous forest, 29.2% pasture area, 5.5% urban development, and 4.4% open land [14].

2.2. Sampling Methods

In order to ensure geographical coverage, we used a total of 59 headwater-to-mouth sites that were sampled between 1983 and 2016 (Figure 1) with seven sites from the 1980s (3, 8, 14, 26, 44, 48, and 54 ), 32 sites from the 1990s (4–7, 9–13, 15–20, 27–42, 52), 18 sites from the 2000s (1–2, 21–25, 45–48, 49–51, 53, 55–57, and 59), and two sites from the 2010s (43 and 58). A total of 57 sites were collected using qualitative methods and two sites (51 and 52) were collected using semi-quantitative methods. Qualitative methods consisted of searching the stream, based on walk-in or canoe access, from bank to bank in a zig-zag pattern by two or more surveyors in which mussels were visually located and collected by hand through a recorded amount of time. The two semi-quantitative survey sites results were obtained through 1 m2 quadrat sampling in highest density areas within a sampling reach [15,16]. All live and fresh dead individuals were identified in the field, enumerated, and most returned to the sampling area from where they were collected. Live and dead collected voucher specimens for most species are being curated into the Arkansas State University Museum of Zoology.

2.3. Data Analysis

For data analysis, species names followed Williams et al. [17]. Species conservation ranks were assigned as global G1 to G5 (G1 = critically imperiled globally, G2 = imperiled globally because of rarity, G3 = very rare or found locally, G4 = apparently secure globally, G5 = demonstrably secure globally) and state S1 to S5 and SNR (S1 = extremely rare, S2 = very rare, S3 = rare to uncommon, S4 = common, apparently secure, and S5 = common and secure, SNR = not ranked) [18]. Where there was a split designation (e.g., S3/S4), we used the lowest “S” score (e.g., S3) in our reporting.
We assessed patterns in mussel assemblage data with non-metric multi-dimensional scaling (NMS) based on Bray–Curtis dissimilarity using the vegan package [19] in Program R [20]. To correct for differences in sampling methods and effort, we transformed assemblage data to relative abundance by dividing the number of individuals of each species collected at a site by total number of individuals (all species) collected at each site. Based on visual inspection of initial NMS plots, two clusters were assigned as an a posteriori hypothesis of geographic grouping, representing upstream and downstream assemblage groups. Significance was evaluated by determining if between group variation, measured as the distance between geographic assemblage group centroids, was significantly greater than within group variation, based on a simulated distribution drawn from resampled data (analysis of similarity, ANOSIM). NMS clusters are displayed with 95% confidence interval ellipses for group centroid location, using the vegan package in Program R [18,19].
We used indicator species analysis to identify species that were uniquely characteristic of the identified geographic groups [21]. We conducted this analysis using the Indicspecies package in Program R [20,22]. This analysis assigns an indicator value to each species in each group from 0 to 1, where 0 indicates that a species was not observed at any site in the group, and 1 indicates a species was observed at every site in the group and never outside of the group. Indicator species were identified as those having indicator values that were significant at p ≤ 0.05 based on a permutation test.
We calculated the percentage of sites each species was observed for the a posteriori upstream and downstream grouping sites discussed above. We also calculated mean relative abundance for each species for all study sites and the two a posteriori upstream and downstream assemblage grouping sites by averaging the site relative abundances overall and within each grouping for each species.

3. Results

3.1. Species Inventory

A total of 39 species were observed across the 59 survey sites resulting in two S1, five S2, 16 S3, 11 S4, four S5, and one SNR conservation rank species (Table 1 and Table 2). Study-wide species occurrence ranged from a low of ≤0.2% (Leptodea leptodon, Potamilus ohiensis, Plectomerus dombeyanus, and Pyganodon grandis) to a high of 77.9% (Lampsilis cardium) at the 59 sites (Table 2). The overall relative abundance across all 59 survey sites ranged from a low of 0.03% (Obovaria arkansasensis and Leptodea leptodon) to a high of 13.97% (Amblema plicata) (Table 2).

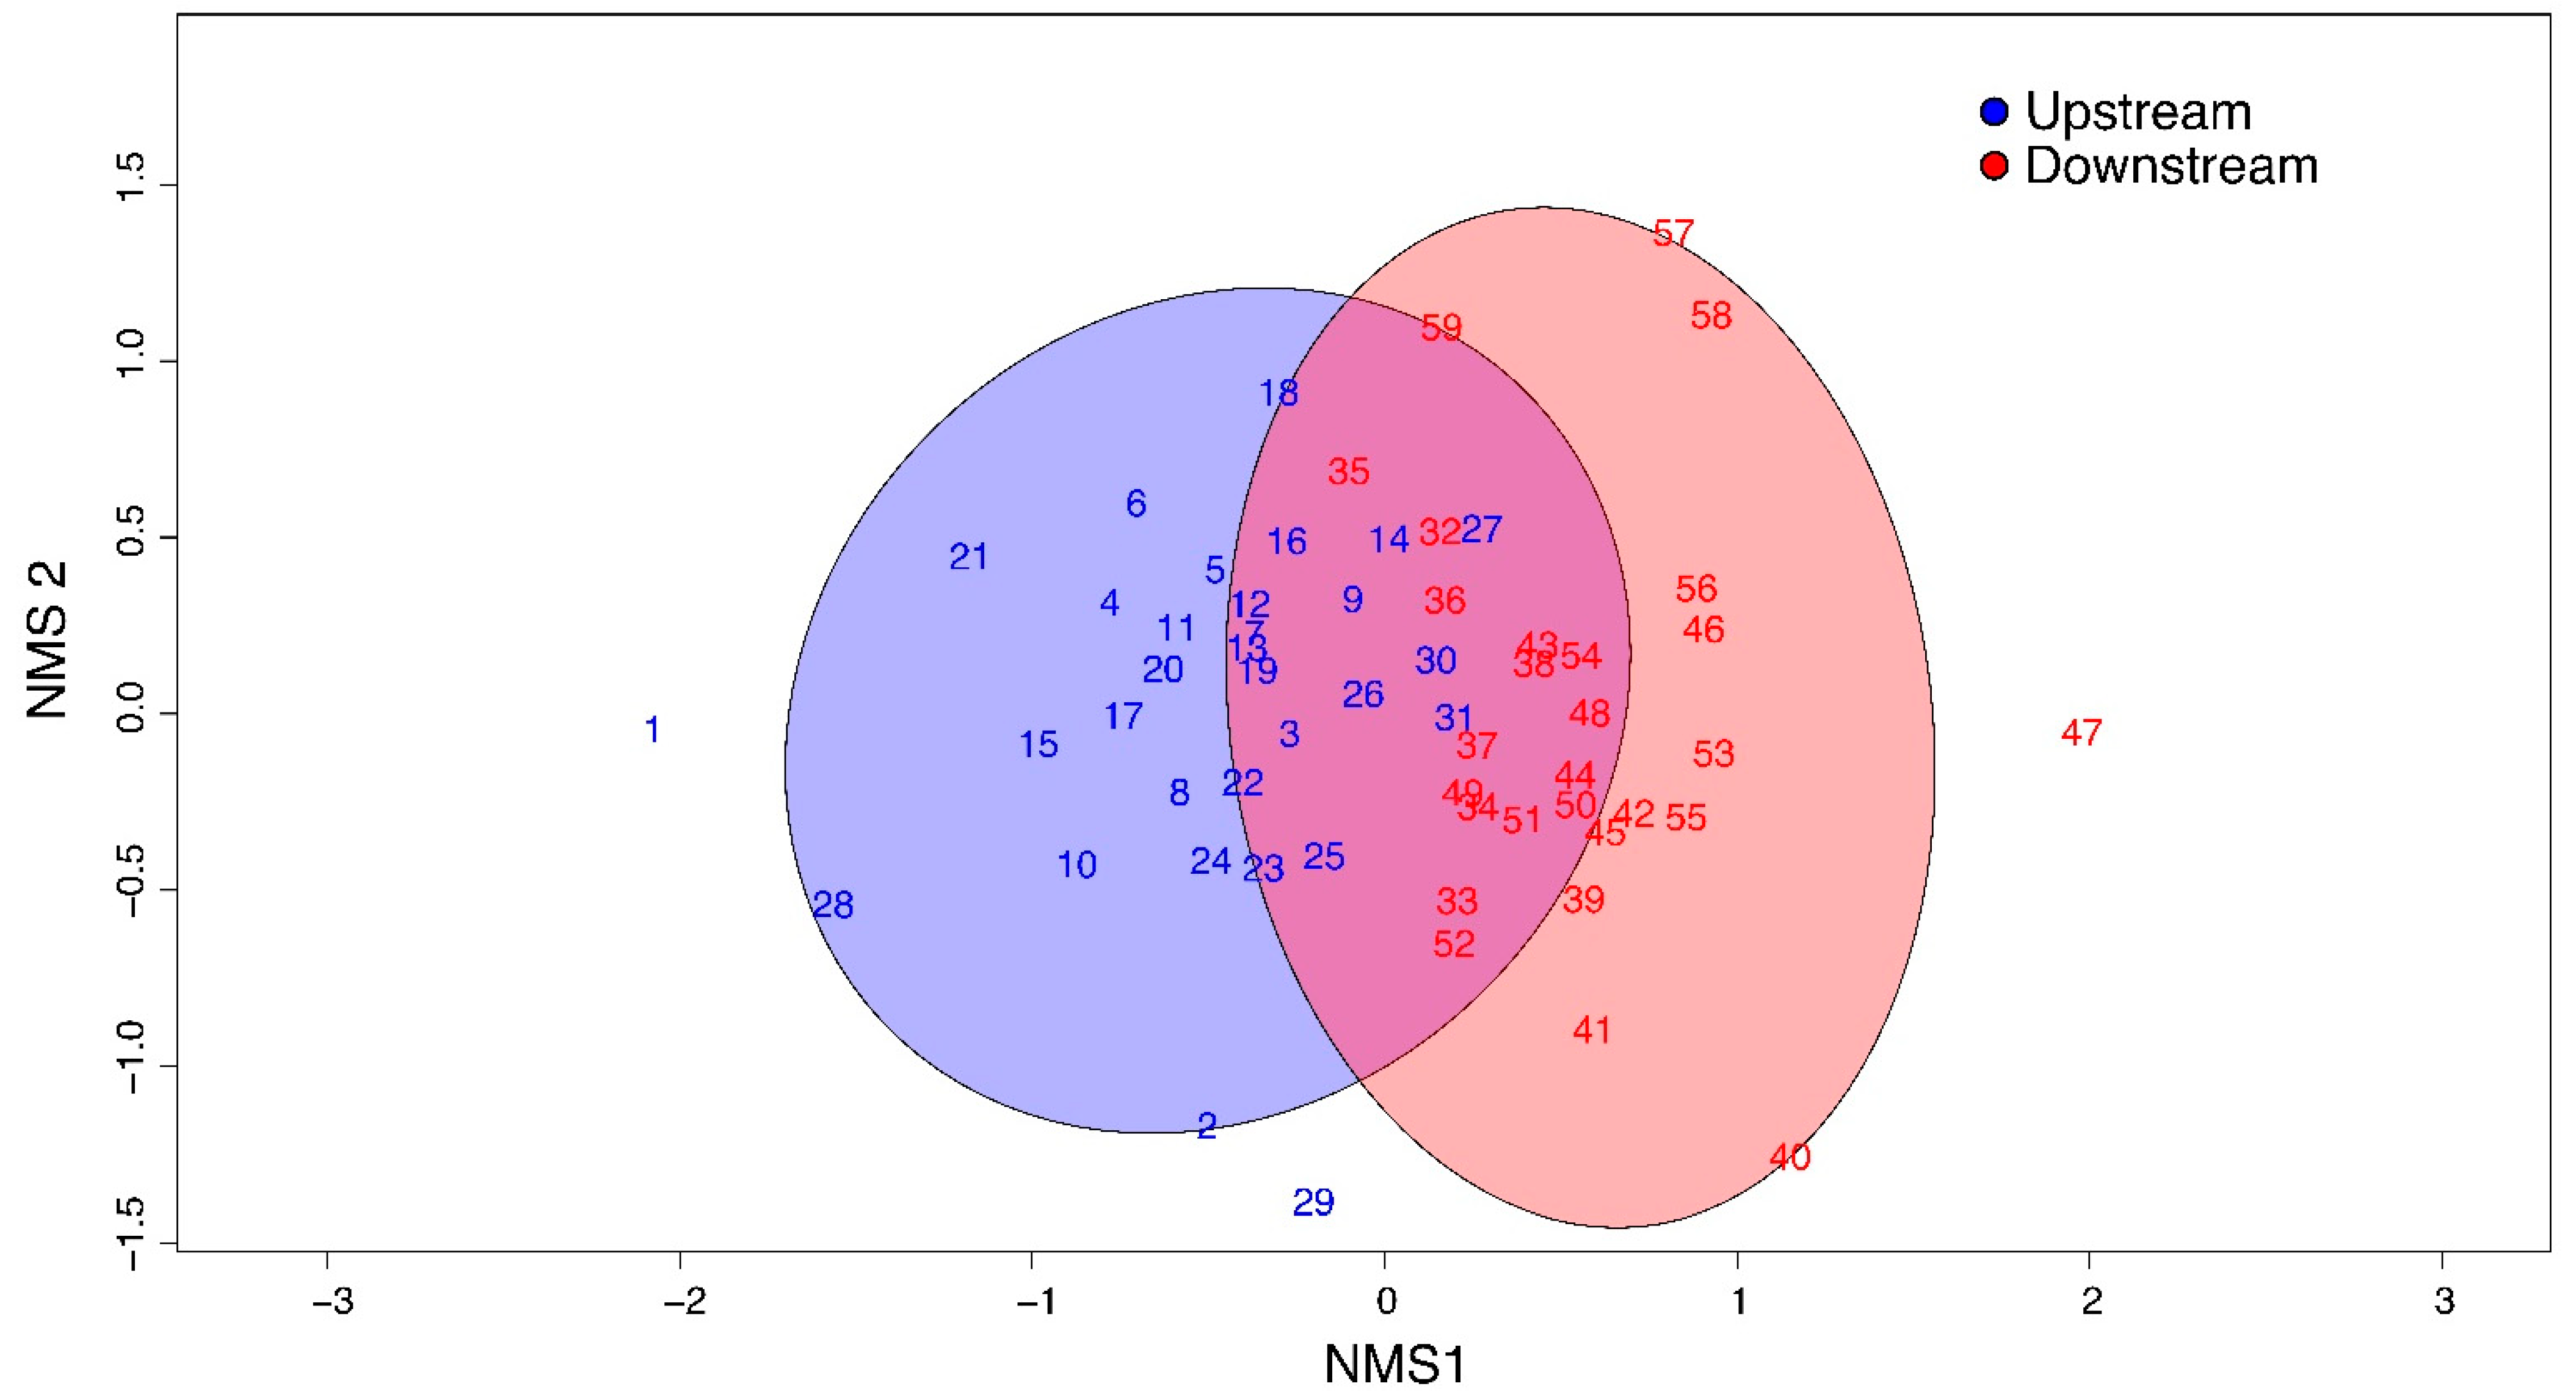
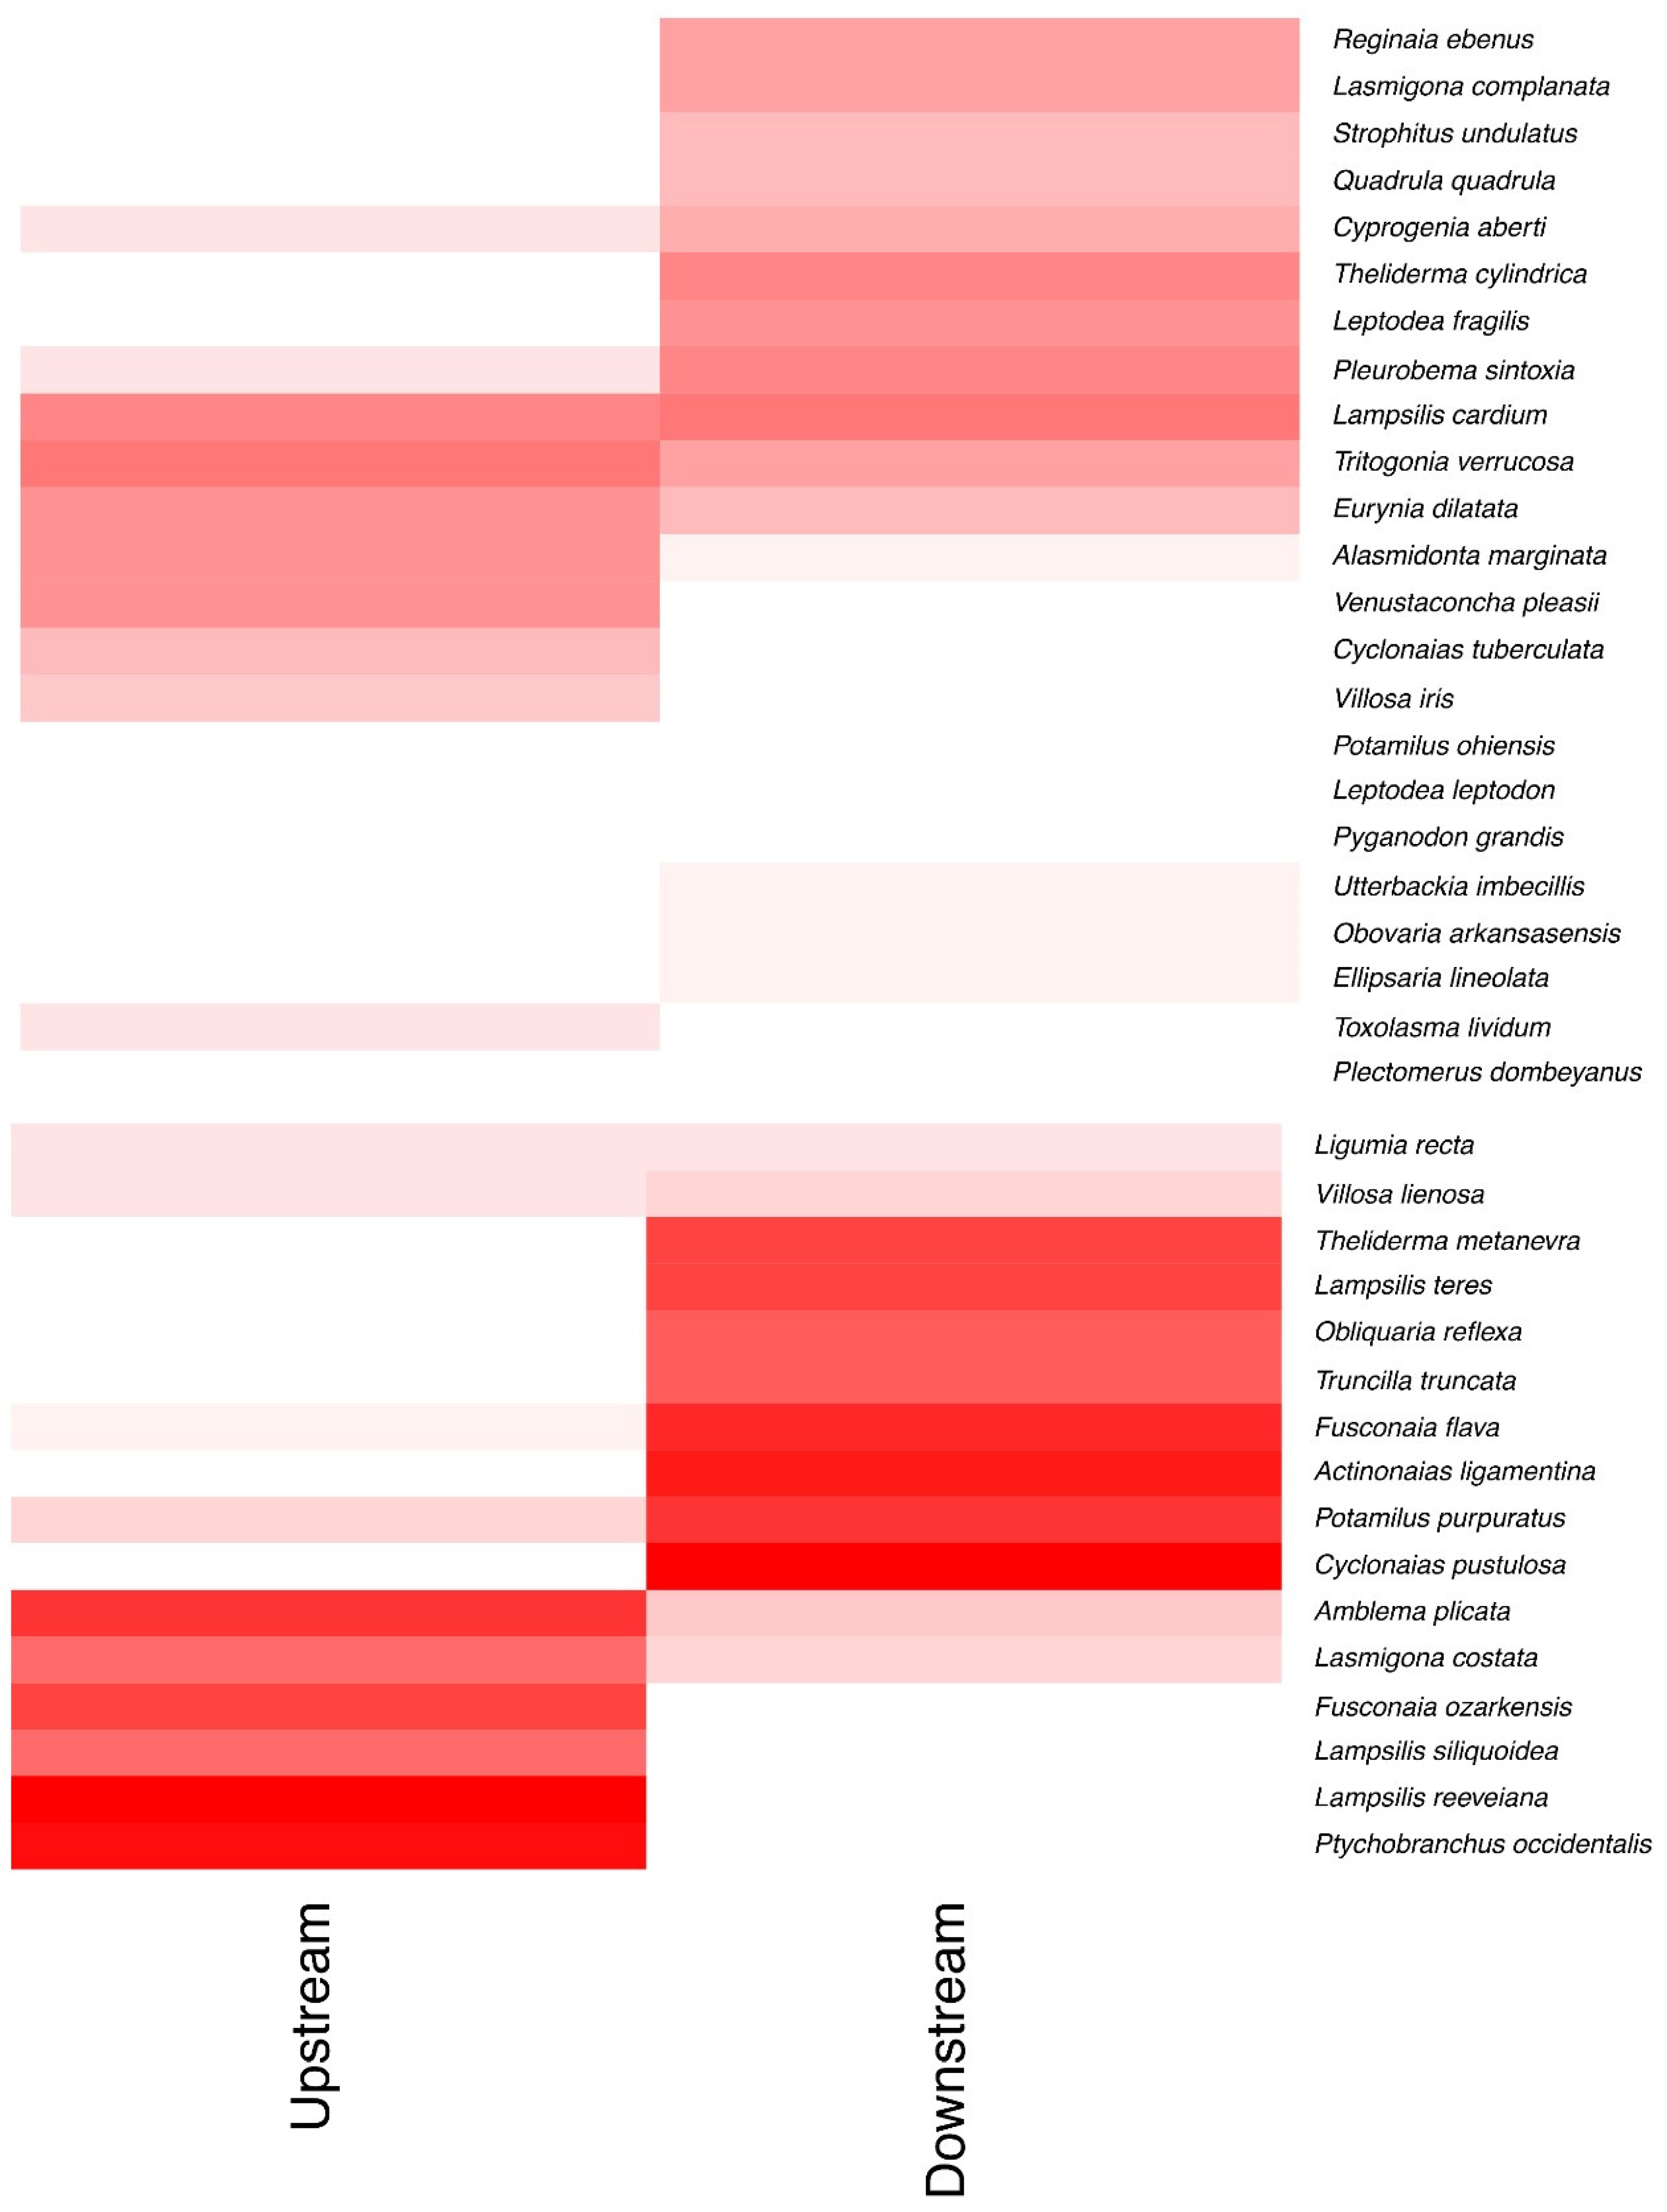
3.2. Assemblage Classification

The NMS analysis revealed a geographic pattern of two clusters representing an upstream assemblage group from sites 1–31 and a downstream assemblage group from sites 32–59 (Figure 2). The two groupings were significantly different based on the standard deviation of sites to their geographic group centroids (ANOSIM, R = 0.3931, p < 0.001). We created 95% confidence interval ellipses for each group centroid based on standard deviation (Figure 2). There are three sites (1, 29, and 47) which fall outside of their group’s 95% CI.
Indicator species analysis identified 18 characteristic species across both geographic groups (Figure 3). The upstream assemblage group had 5 significant indicator species that were, in order of highest correlation, Lampsilis reeveiana (0.880; p = 0.001), Ptychobranchus occidentalis (0.837; p = 0.001), Fusconaia ozarkensis (0.741; p = 0.001), Lampsilis siliquoidea (0.678; p = 0.001), and Venustacocha pleasii (0.568; p = 0.002). These taxa are indicative of small- or small- and mid-sized streams guild species and composed 2.99 to 9.22% of mean relative abundance of upstream assemblage group sites (Table 1 and Table 2). The downstream assemblage group had 13 species that were significant indicators, with the significant correlations being Cyclonaias pustulosa (0.881; p = 001), Actinonaias ligamentina (0.817; p = 0.001), Fusconaia flava (0.806; p = 0.001), Potamilus purpuratus (0.778; p = 0.005), Lampsilis teres (0.756; p = 0.001), Theliderma metanevra (0.756; p = 0.001), Obliquaria reflexa (0.709; p = 0.001), Truncilla truncata (0.689; p = 0.001), Theliderma cylindrica (0.598; p = 0.004), Leptodea fragilis (0.584; p = 0.003), Lasmigona complanata (0.535; p = 0.002), Reginaia ebenus (0.535; p = 0.002), and Quadrula quadrula (0.463; p = 0.009). The downstream indicator taxa are indicative of mid-and large-sized streams, with the notable exception of Lampsilis teres and Lasmigona complanata (both small- and mid-sized stream guild species) and composed 0.49 to 14.59% of mean relative abundance for downstream assemblage group sites (Table 1 and Table 2).

4. Discussion

Our results revealed two major findings. First, the Strawberry River has relatively high species richness (39) and a large percentage (n = 23) of these species are of high state-level conservation concern (S1–S3). Second, our assemblage classification revealed two distinct freshwater mussel assemblage groupings generally organized by an upstream to downstream gradient.

4.1. Species Inventory

The results of our study indicated that the Strawberry River has just over 50% of the 75 taxa currently considered native to Arkansas [23] and nearly 60% of these 39 taxa are vulnerable (S3) to critically imperiled (S1) in Arkansas [18]. Additionally, two species found during this study are federally protected and included Leptodea leptodon (endangered) and Theliderma cylindrica (threatened). It is noteworthy from our upstream and downstream grouping species site occurrence and abundance results that S1-S3 taxa were observed at multiple sites in our study and typically were represented by more than one individual at a site (Table 2). Other taxonomic group studies also have reported high aquatic species richness in the Strawberry River watershed such as 100+ fish species from 18 families [9,10] and 313 aquatic macroinvertebrate species including 23 freshwater mussel taxa from seven sites [8]. All 23 of these freshwater mussel taxa were found in our study.

4.2. Assemblage Classification

Our NMS classification revealed two distinct freshwater mussel groupings organized as upstream and downstream assemblages. Combined with the species indicator analysis, these results were mostly consistent with the expectations for small, mid, and large stream size guilds [3]. Upstream assemblage relative abundance was dominated by Amblema plicata (19.76%) and Lampsilis cardium (11.52%); however, Ptychobranchus occidentalis (9.22%), and Lampsilis reeveiana (9.02%) also were highly abundant. Upstream indicator species were predominantly small- to mid-sized stream guild species and were, in relative abundance order, Ptychobranchus occidentalis, Lampsilis reeveiana, Fusconaia ozarkensis, Lampsilis siliquoidea, and Venustachoncha pleasii [3]. It is noteworthy that Amblema plicata (stream size generalist) and Lampsilis cardium (small- and mid-sized stream species) were dominant in relative abundance upstream but were not upstream assemblage group species indicators. It also is noteworthy that upstream indicator species Lampsilis reeveiana, Fusconaia ozarkensis, and Venustaconcha pleasii were exclusively found at upstream assemblage grouping sites.
The downstream assemblage group relative abundance was dominated by Potamilus purpuratus (14.59%), Cyclonaias pustulosa (13.97%), and Actinonaias ligamentina (13.03%). The downstream indicator species were dominated (relative abundance >10%) by mid- to large-sized stream species and were, in relative abundance order, Potamilus purpuratus, Cyclonaias pustulosa, and Actinonaias ligamentina [3]. Four downstream indicator species were observed only within the downstream assemblage sites and included Lampsilis teres, Lasmigona complanata, Quadrula quadrula, and Reginaia ebenus. Furthermore, five non-indicator species, in relative abundance order, Amblema plicata, Lampsilis cardium, Tritogonia verrucosa, Eurynia dilatata, and Pleurobema sintoxia were abundant at both upstream and downstream sites, indicating they are widespread generalists.
While we observed two distinct mussel assemblage groups based on NMS, we did not observe the dominant species in each assemblage corresponding exclusively to the expected stream-size guild, namely that upstream sites were expected to be dominated by small-sized stream species while the downstream sites expected to be dominated by mid-sized stream species [3]. Contrary to our stream-size guild expectations, our findings showed that both assemblage groups had a mixture of mid-size stream guild dominant taxa. Many of our sampling sites in the middle portion of the river correspond to sites in the overlap of our 95% confidence ellipses (upstream assemblage sites 22, 23, 25, 26, 27, and 30; downstream assemblage sites 32–38, 43–44, 48–52, and 54) that may represent a lengthy transition zone between the mussel assemblages extending downstream from the confluences of Piney Fork (downstream of Site 20), North Big Creek (downstream of Site 25), and Mill Creek (between sites 31–32) (Figure 1 and Figure 2). We conducted a post hoc stream order classification which determined that the Strawberry River at Site 1 is a 5th order stream, becomes a 6th order stream after the entry of the Little Strawberry River (between Sites 1 and 2), and remains a 6th order stream until its confluence with the Black River [24]. Further investigation revealed that drainage area changes substantially from 588 km2 (29.8% of total watershed) upstream of the Piney Fork confluence (Site 20), to 992 km2 (50.3 % of total watershed) at the North Big Creek confluence (between Sites 25–26), to 1321 km² (67% of total watershed) at the Mill Creek confluence (between Sites 31–32), a drainage area increase of 225% over approximately 30 river km in length [14]. This lack of change in stream order but increase in drainage area results in corresponding changes in mean discharge, water depth, and wetted channel which likely influences the mussel composition along the Strawberry River.
We also observed three sites (1, 29, and 47) which occurred outside of their respective centroid confidence interval ellipses; however, all three of these sites were characterized by low richness and abundance, even though the sampling effort at these sites was similar to our other sites. Site 1 consisted of two species observed, L. reeveiana and V. pleasii, and both taxa are upstream indicator species in our study, found exclusively in the upstream section of the Strawberry River. Site 29, which falls within the upstream assemblage group site distribution, also only had 2 species observed, L. cardium and Ligumia recta. While L. cardium is an upstream assemblage group indicator in our study, it also is abundant in the downstream portion of Strawberry River, and the same was observed for L. recta distribution and abundance. At Site 47, we only observed two individuals of Cyclonaias pustulosa. Cyclonaias pustulosa is a downstream group indicator species in our study, and Site 47 falls within the downstream assemblage group site distribution.

5. Conclusions

Recent water quality and best management practices implementation assessments have indicated decreasing habitat and water quality in the Strawberry River watershed [6,7]. Considering these deteriorating conditions and with the Strawberry River state designated as an Extraordinary Resource Water, an Ecologically Sensitive Water Body, and a Natural Scenic Waterway [5], knowing the inhabiting mussel fauna and associated biodiversity classification can aid in conservation planning. This case study illustrates the utility of NMS as a classification tool and serves as a reference for use of existing survey data to classify freshwater mussels at hierarchical levels smaller than faunal regions and provinces. Using the combination of North American freshwater mussel faunal region and province classification [2] and the four-level zoogeographic classification [1], the freshwater mussels of the Strawberry River can be classified into the Mississippian faunal region-AZU, the Interior Highlands province-EDU, and upstream and downstream Strawberry River AES. This classification, along with the associated inventory, provides an additional case study adding to our understanding of freshwater mussel fauna ecological classification [2,25] that can be used for conservation planning aimed at conserving biodiversity across spatial and biogeographical scales [13]. Resource managers may use the upstream and downstream assemblages to prioritize and enforce habitat and water quality efforts; reduce or establish policies on land use, land cover, and fragmentation; prioritize preservation or restoration activities; or identify stream sections for mitigation activities such as translocating and augmenting populations based on historical distributions and assemblage associations [13]. Where possible, using source populations from the same AES (e.g., Strawberry River upstream or downstream) as proposed conservation efforts could enhance the success of future augmentation, restoration, relocation and/or translocation activities [26,27]. Using source populations from the same assemblage should help minimize negative effects to species unable to acclimate to novel environments [28,29].

Author Contributions

Conceptualization, A.D.C. and J.L.H.; methodology, A.D.C., S.W.A.C., J.L.H.; software, S.T.M.; validation, A.D.C., J.L.H., S.T.M.; formal analysis, S.T.M.; investigation, A.D.C., J.L.H., S.W.A.C.; resources, A.D.C., J.L.H., S.W.A.C.; data curation, J.L.H.; writing—original draft preparation, A.D.C. and S.P.; writing—review and editing, A.D.C., S.T.M., S.P., S.W.A.C., J.L.H.; visualization, A.D.C. and S.T.M.; supervision, J.L.H.; project administration, J.L.H., A.D.C.; funding acquisition, J.L.H. All authors have read and agreed to the published version of the manuscript.

Funding

This research was funded by the Arkansas Game and Fish Commission, Arkansas Natural Heritage Commission, the U.S. Army Corps of Engineers, and the U.S. Fish and Wildlife Service for funding portions of this study.

Institutional Review Board Statement

Freshwater mussels are invertebrate animals, thus are not governed by any of our Institutional Animal Care and Use Committees (IACUC). IACUC ensures the human and appropriate care and use of all live vertebrate animals used or intended for use in research, research training, experimentation, biological testing, or teaching.

Informed Consent Statement

Not applicable.

Data Availability Statement

This data is held with A.D.C. and J.L.H.

Acknowledgments

We thank P. J. Rust, J. H. Seagraves and M. E. Gordon for field work assistance.

Conflicts of Interest

The authors declare no conflict of interest. The funders had no role in the design of the study; in the collection, analyses, or interpretation of data; in the writing of the manuscript, or in the decision to publish the results.

References

  1. Higgins, J.V.; Bryer, M.T.; Khoury, M.L.; Fitzhugh, T.W. A Freshwater Classification Approach for Biodiversity Conservation Planning. Conserv. Biol. 2005, 19, 432–445. [Google Scholar] [CrossRef]
  2. Haag, W.R. A Hierarchical Classification of Freshwater Mussel Diversity in North America. J. Biogeogr. 2010, 37, 12–26. [Google Scholar] [CrossRef]
  3. Haag, W.R. North American Freshwater Mussels: Natural History, Ecology, and Conservation; Cambridge University Press: New York, NY, USA, 2012. [Google Scholar]
  4. Woods, A.J.; Foti, T.L.; Chapman, S.S.; Omernik, J.M.; Wise, J.A.; Murray, E.O.; Prior, W.L.; Pagan, J.B., Jr.; Comstock, J.A.; Radford, M. US Geological Survey (Map Scale 1: 1,000,000); Ecoregions of Arkansas (Color Poster with Map, Descriptive Text, Summary Tables, and Photographs): Reston, VA, USA, 2004. [Google Scholar]
  5. Arkansas Department of Pollution Control and Ecology. Regulation No. 2. Regulation Establishing Water Quality Standards for Surface Water of the State of Arkansas; Arkansas Department of Pollution Control and Ecology: Little Rock, AR, USA, 2010. [Google Scholar]
  6. Brueggen-Boman, T.R.; Bouldin, J.L. Characterization of Temporal and Spatial Variation in Subwatersheds of the Strawberry River, AR, Prior to Implementation of Agricultural Best Management Practices. J. Ark. Acad. Sci. 2012, 66, 41–49. [Google Scholar]
  7. Brueggen-Boman, T.R.; Choi, S.; Bouldin, J.L. Response of Water-Quality Indicators to the Implementation of Best-Management Practices in the Upper Strawberry River Watershed, Arkansas. Southeast. Nat. 2015, 14, 697–713. [Google Scholar] [CrossRef]
  8. Harp, G.L.; Robison, H.W. Aquatic Macroinvertebrates of the Strawberry River System in North-Central Arkansas. J. Ark. Acad. Sci. 2006, 60, 46–61. [Google Scholar]
  9. Robison, H.W.; Beadles, J.K. Fishes of the Strawberry River System of Northcentral Arkansas. Proc. Ark. Acad. Sci. 1974, 28, 65–70. [Google Scholar]
  10. Robison, H.W.; Buchanan, T.M. Fishes of Arkansas; University of Arkansas Press: Fayetteville, AR, USA, 2020. [Google Scholar]
  11. Master, L.L.; Flack, S.R.; Stein, B.A. Rivers of Life: Critical Watersheds for Protecting Freshwater Biodiversity; The Nature Conservancy: Arlington, VA, USA, 1998. [Google Scholar]
  12. U.S. Department of Agriculture: Forest Service. Ozark-Ouachita Highlands Assessment: Aquatic Conditions; Report 3 of 5. General Technical Report SRS-33; U.S. Department of Agriculture, Forest Service, Southern Research Station: Asheville, NC, USA, 1999. [Google Scholar]
  13. Freshwater Mollusk Conservation Society. A National Strategy for the Conservation of Native Freshwater Mollusks. Freshw. Mollusk Biol. Conserv. 2016, 19, 1–21. [Google Scholar] [CrossRef]
  14. United States Geological Survey. StreamStats. Available online: https://streamstats.usgs.gov/ss/ (accessed on 15 January 2021).
  15. Rust, P.J. Analysis of the Commercial Mussel Beds in the Black, Spring, Strawberry and Current Rivers in Arkansas. Master’ Thesis, Arkansas State University, Jonesboro, AK, USA, 1993. [Google Scholar]
  16. Christian, A.D.; Harris, J.L. Development and Assessment of a Sampling Design for Mussel Assemblages in Large Streams. Am. Midl. Nat. 2005, 153, 284–292. [Google Scholar] [CrossRef]
  17. Williams, J.D.; Bogan, A.E.; Butler, R.S.; Cummings, K.S.; Garner, J.T.; Harris, J.L.; Johnson, N.A.; Watters, G.T. A Revised List of the Freshwater Mussels (Mollusca: Bivalvia: Unionida) of the United States and Canada. Freshw. Mollusk Biol. Conserv. 2017, 20, 33–58. [Google Scholar] [CrossRef] [Green Version]
  18. Arkansas Natural Heritage Commission. Rare Species Search Engine: Find Arkansas Species of Conservation Interest. Available online: https://www.arkansasheritage.com/arkansas-natural-heritage/anhc-home (accessed on 30 December 2020).
  19. Oksanen, J.; Kindt, R.; Legendre, P.; O’Hara, B.; Simpson, G.L.; Solymos, P.; Stevens, M.H.H.; Wagner, H. The Vegan Package. Community Ecology Package. Available online: http://r-forge.r-project.org/projects/vegan/ (accessed on 30 December 2020).
  20. R Core Team. R: A Language and Environment for Statistical Computing. Available online: http://www.R-project.org (accessed on 30 December 2020).
  21. Dufrêne, M.; Legendre, P. Species Assemblages and Indicator Species: The Need for a Flexible Asymmetrical Approach. Ecol. Monogr. 1997, 67, 345–366. [Google Scholar] [CrossRef]
  22. Cáceres, M.D.; Legendre, P. Associations between Species and Groups of Sites: Indices and Statistical Inference. Ecology 2009, 90, 3566–3574. [Google Scholar] [CrossRef] [PubMed]
  23. Harris, J.L.; Posey, W.R., II; Davidson, C.L.; Farris, J.L.; Oetker, S.R.; Stoeckel, J.N.; Crump, B.G.; Barnett, M.S.; Martin, H.C.; Matthews, M.W.; et al. Unionoida (Mollusca: Margaritiferidae, Unionidae) in Arkansas, Third Status Review. J. Ark. Acad. Sci. 2009, 63, 50–84. [Google Scholar]
  24. United States Geological Survey. Markup App. Available online: https://edits.nationalmap.gov/markup-app (accessed on 15 January 2021).
  25. Christian, A.D.; McMurray, S.E.; McCanty, S.T.; Dimino, T.; Harris, J.L. Freshwater Mussel Assemblages in the Black River, Missouri and Arkansas. Freshw. Mollusk Biol. Conserv. 2021, 24, 15, in press. [Google Scholar]
  26. Haag, W.R.; Williams, J.D. Biodiversity on the Brink: An Assessment of Conservation Strategies for North American Freshwater Mussels. Hydrobiologia 2014, 735, 45–60. [Google Scholar] [CrossRef]
  27. McMurray, S.E.; Roe, K.J. Perspectives on the Controlled Propagation, Augmentation, and Reintroduction of Freshwater Mussels (Mollusca: Bivalvia: Unionoida). Freshw. Mollusk Biol. Conserv. 2017, 20, 1–12. [Google Scholar] [CrossRef] [Green Version]
  28. Tsakiris, E.T. Conservation and Management of Freshwater Mussels (Bivalvia: Unionidae): Reproduction, Non-Invasive Techniques and Relocation. Ph.D. Thesis, Texas A&M University, College Station, TX, USA, 2016. [Google Scholar]
  29. Hart, M.A.; Fisher, M.; Randklev, C.R. A Cautionary Tale about Translocating Mussels and Implications for Conservation: A Case Study from Two River Basins in Central Texas. Aquat. Conserv. 2021. [Google Scholar] [CrossRef]
Figure 1. Map of the Strawberry River watershed, Arkansas, USA, sampling sites, and ecoregions. The inset map shows the location of the study area in the southcentral U.S.A. The blue lines are streams, the white dashed outline shows the watershed boundary, the shaded backgrounds with solid black lines are ecoregions (Ozark Highlands Central Plateau, gray shade; Mississippi Alluvial Plain, black), and white circles are the Strawberry River mussel sampling sites in numerical order upstream to downstream. Due to cartographic labeling issues, a few sites do not have labels. Black dotted line between sites 31 and 32 represents demarcation between the non-metric multi-dimensional scaling analysis upstream and downstream assemblage groupings.
Diversity 13 00086 g001
Figure 2. Non-metric multi-dimensional scaling (NMS) plot of mussel assemblages at 59 Strawberry River sampling sites. Ellipses represent 95% confidence intervals around group centroids for two geographic groupings representing upstream (blue) and downstream (red) assemblage groups. There are three sites (1, 29, and 47) which occur outside of the 95% confidence interval ellipses.
Diversity 13 00086 g002
Figure 3. Heat map showing results of indicator species analysis for upstream and downstream mussel assemblage groups in the Strawberry River. Deeper red coloring indicates stronger indicator relationships within each group.
Diversity 13 00086 g003
Table 1. Species list of Strawberry River freshwater mussels collected at 59 stations and stream size which a species is strongly associated as reported by Haag [3]; species not categorized by Haag [3] are indicated with a dash (-); stream size guild designation listed from highest to lowest dominance. Nomenclature follows Williams et al. [17]. G1 = critically imperiled globally, G2 = imperiled globally because of rarity, G3 = very rare or found locally, G4 = apparently secure globally, G5 = demonstrably secure globally; Q in the global rank indicates the element’s taxonomic classification is uncertain, S1 = extremely rare, S2 = very rare, S3 = rare to uncommon, S4 = common, apparently secure, S5 = common and secure, SNR = Unranked, the state rank not yet assessed, T = subranks are given to global ranks when a subspecies, variety, or race is considered at the state level. The subrank is made up of a "T" plus a number or letter (1, 2, 3, 4, 5, H, U, X) with the same ranking rules as a full species. Global (G) and State (S) rankings obtained from Arkansas Natural Heritage Commission database [18].
TaxonG RankS RankStream Size Haag (2012)
Actinonaias ligamentina (Lamarck 1819)G5S5Mid and Large
Alasmidonta marginata (Say 1818)G4S3Small
Amblema plicata (Say, 1817)G5S5Mid, Large, and Small
Cyclonaias pustulosa (Lea, 1831)G5T5SNRLarge and Mid
Cyclonaias tuberculata (Rafinesque, 1820)G5S3Mid
Cyprogenia aberti (Conrad, 1850)G2G3QS2Mid
Ellipsaria lineolata (Rafinesque, 1820)G4G5S3Large
Eurynia dilatata (Rafinesque, 1820)G5S4Mid, Small, and Large
Fusconaia flava (Rafinesque, 1820)G5S4Mid, Large, and Small
Fusconaia ozarkensis (Call, 1887)G3G4S3Mid and Small
Lampsilis cardium (Rafinesque, 1820)G5S4Small and Mid
Lampsilis reeveiana (Call, 1887)G3S3Small and Mid
Lampsilis siliquoidea (Barnes, 1823)G5S3Small and Mid
Lampsilis teres (Rafinesque, 1820)G5S4Large
Lasmigona complanata (Barnes, 1823)G5S3S4Small and Mid
Lasmigona costata (Rafinesque, 1820)G5S3Small and Mid
Leptodea fragilis (Rafinesque, 1820)G5S4Mid
Leptodea leptodon (Rafinesque, 1820)G1G2S1-
Ligumia recta (Lamarck, 1819)G4G5S2-
Obliquaria reflexa (Lea, 1845)G5S4Large
Obovaria arkansasensis (Lea, 1862)G2S2Small and Mid
Plectomerus dombeyanus (Valenciennes, 1827) G4S4-
Pleurobema sintoxia (Rafinesque, 1820)G4G5S3Mid
Potamilus ohiensis (Rafinesque, 1820)G5S3
Potamilus purpuratus (Lea, 1831)G5S4Large
Ptychobranchus occidentalis (Conrad, 1836)G3G4S3Mid and Small
Pyganodon grandis (Say, 1829)G5S5Mid
Quadrula quadrula (Rafinesque, 1820)G5S5Mid
Reginaia ebenus (Lea, 1831)G4G5S3S4Large
Strophitus undulatus (Say, 1817)G5S3Small
Theliderma cylindrica (Say, 1817)G3G4T3S2-
Theliderma metanevra (Rafinesque, 1820)G4S3S4-
Toxolasma lividum (Rafinesque, 1831)G3QS2Small
Tritogonia verrucosa (Rafinesque, 1820)G4G5S4Mid
Truncilla truncata (Rafinesque, 1820)G5S4Large
Utterbackia imbecillis (Say, 1829)G5S4-
Venustaconcha pleasii (Marsh, 1891)G3G4S3-
Villosa iris (Lea, 1829)G5QS2/S3Small and Mid
Villosa lienosa (Conrad, 1834)G5S3Small and Mid
Table 2. Strawberry River freshwater mussel species occurrence at upstream and downstream assemblage group sites (n = number of sites), mean % relative abundance of a posteriori upstream and downstream assemblage sites and total sites, and upstream and downstream assemblage group species indictor analysis correlations with associated p values. Nomenclature follows Williams et al. [17].
SpeciesUpstream Sites (n)Downstream Sites (n)Mean Upstream Abundance (%)Mean Downstream Abundance (%)Mean Total Abundance (%)Upstream Indicator ValueDownstream Indicator Valuep Value
Actinonaias ligamentina11201.7613.037.11 0.8170.001
Alasmidonta marginata1271.630.521.10
Amblema plicata242119.767.5513.97
Cyclonaias pustulosa3220.1413.976.70 0.8810.001
Cyclonaias tuberculata730.970.120.56
Cyprogenia aberti8100.741.581.14
Ellipsaria lineolata020.000.090.04
Eurynia dilatata20137.334.375.92
Fusconaia flava12220.965.232.99 0.8060.001
Fusconaia ozarkensis1704.570.002.400.741 0.001
Lampsilis cardium252111.527.429.57
Lampsilis reeveiana2409.020.004.740.880 0.001
Lampsilis siliquoidea1642.990.401.760.678 0.002
Lampsilis teres01603.741.78 0.7560.001
Lasmigona complanata0800.280.13 0.5350.002
Lasmigona costata20135.71.693.80
Leptodea fragilis1100.022.371.14 0.5840.003
Leptodea leptodon0100.060.03
Ligumia recta672.260.511.43
Obliquaria reflexa1150.081.760.87 0.7090.001
Obovaria arkansasensis020.000.070.03
Plectomerus dombeyanus100.170.000.09
Pleurobema sintoxia10141.33.322.26
Potamilus ohiensis0100.090.04
Potamilus purpuratus14246.5814.5910.38 0.7780.005
Ptychobranchus occidentalis2229.220.074.870.837 0.001
Pyganodon grandis0100.080.04
Quadrula quadrula0600.490.23 0.4630.009
Reginaia ebenus0801.270.60 0.5350.002
Strophitus undulatus380.820.50.66
Theliderma cylindrica4110.182.391.23 0.5980.004
Theliderma metanevra6180.814.042.35 0.7560.001
Toxolasma lividum410.10.200.15
Tritogonia verrucosa23197.35.636.51
Truncilla truncata2140.091.820.91 0.6890.001
Utterbackia imbecillis220.140.180.16
Venustaconcha pleasii1002.990.001.570.568 0.002
Villosa iris500.350.000.18
Villosa lienosa760.510.570.54
Publisher’s Note: MDPI stays neutral with regard to jurisdictional claims in published maps and institutional affiliations.

