1. Introduction
Troglobites, characterized by exclusively subterranean species [
1], show, in general, small population size [
2]. In many cases, this statement is based on inference, taken from the notion of restricted geographic distribution (which applies to many but not all species) associated with low population densities rather than on data obtained through population study methods, such as capture-mark-recapture.
Available data for subterranean fish show that population densities may vary considerably, from very low to very high, and are sometimes higher than their relatives from epigean (surface) environments [
3]. This variation can be partly related to the methods of study since the lowest densities are usually recorded in studies that used the visual census method [
3].
There is great difficulty in estimating the absolute size of the troglobitic populations, important not only from a scientific point of view but also for conservation purposes. Most of the time, we do not know the full extent of habitats occupied by the species, and the characteristics of the subterranean realm, which is largely inaccessible, prevent accurate studies [
3].
Based on literature data, Trajano (2001) proposed a classification for possible population density patterns for troglobitic fish: species with low population densities (<0.1 ind/m
2), for example,
Nemacheilus troglocataractus, Typhlichthys subterraneus, Pimelodella kronei,
Rhamdiopsis krugi (Poço Encantado cave population), and
Rhamdiopis sp.; species with medium population densities (0.1–1.0 ind/m
2) [
4] such as
Schistura oedipus,
Amblyopsis rosae,
Trichomycterus itacarambiensis, and
Ancistrus cryptophthalmus; and species with high population densities (1.0 ind/m
2), such as
Astyanax spp. [
5],
Poecilia mexicana, and
Caecobarbus geertsii. Variability in the densities is observed for
Eigenamannia vicentespelaea population (densities varying from 0.04 ind/m
2 to 0.17 ind/m
2), tending toward low [
6], and
Rhamdiopsis krugi (densities varying from 0.07 ind/m
2 to 9 ind/m
2 indicated by personal observation (pers. obs.) from M. E. Bichuette.
Ecological characters usually associated with energy saving comprise the life cycles of many troglobites, which feature strategies tending to K in r-K continuum or early life cycle
sensu [
7]. Such strategies include production of low fecundity, infrequent reproduction, delayed reproductive maturity, slow individual growth, and high longevity [
8], interpreted as adaptations to conditions of low, infrequent, and often unpredictable nutrient supply. One consequence of scarce and infrequent food is the generally small home range, with some cavefish species presenting low individual movements and therefore a sedentary behavior [
9,
10,
11,
12], saving energy. However, some studies have shown the contrary, a large home range [
13,
14].
Because of these attributes, low values of condition factor have been recorded for many cavefish and are attributed to scarce food availability [
3], commonly observed (with exceptions) in subterranean habitats. Few studies have produced robust reliable data on growth rates and longevity in troglobitic fish [
5,
15] for
Caecobarbus geertsii, [
16,
17] for Amblyopsidae cavefish [
9,
10] and [
12] for cave catfishes
Pimelodella kronei,
Trichomycterus itacarambiensis, and
Ancistrus cryptophthalmus, respectively. Such studies have indicated an early life cycle for these species.
Trichomycteridae (Gill, 1872) catfishes represent one of the most diverse groups of Siluriformes (Ostariophysi), with 304 species [
18]. Currently, the family Trichomycteridae is considered the third richest in exclusively subterranean species, with 19 troglobites distributed in four genera:
Glaphyropoma [
19],
Silvinichthys [
20],
Trichomycterus [
21,
22,
23,
24,
25,
26,
27], and
Ituglanis (six species) [
28,
29,
30,
31].
Ituglanis (Costa and Bockmann, 1993) includes six troglobitic species, all from limestone caves in Central Brazil:
I. passensis (Fernández and Bichuette, 2002)
, I. bambui (Bichuette and Trajano, 2004),
I. epikarsticus (Bichuette and Trajano, 2004),
I. ramiroi (Bichuette and Trajano, 2004),
Ituglanis mambai (Bichuette and Trajano, 2008), and
Ituglanis boticario (Rizzato and Bichuette, 2014), plus three undescribed species (M.E. Bichuette, pers. obs.). Most species are characterized by reduction until absence of eye and melanic pigmentation [
28,
29,
31].
One of the places with high endemism of subterranean
Ituglanis species in Brazil is the São Domingos karst area (upper Tocantins River basin) [
32,
33]. Four exclusively subterranean
Ituglanis occur in caves from Terra Ronca State Park, and all are regionally threatened:
I. passensis,
I. epikarsticus, and
I. ramiroi (vulnerable category, VU) and
I. bambui (critically endangered category, CR) [
34]. We monitored these populations with the aim to determine some population parameters: population sizes and densities, recruitment, and condition factor (body conditions). These data are useful in conservation proposals to protect and maintain these populations.
2. Materials and Methods
2.1. Study Area and Fish
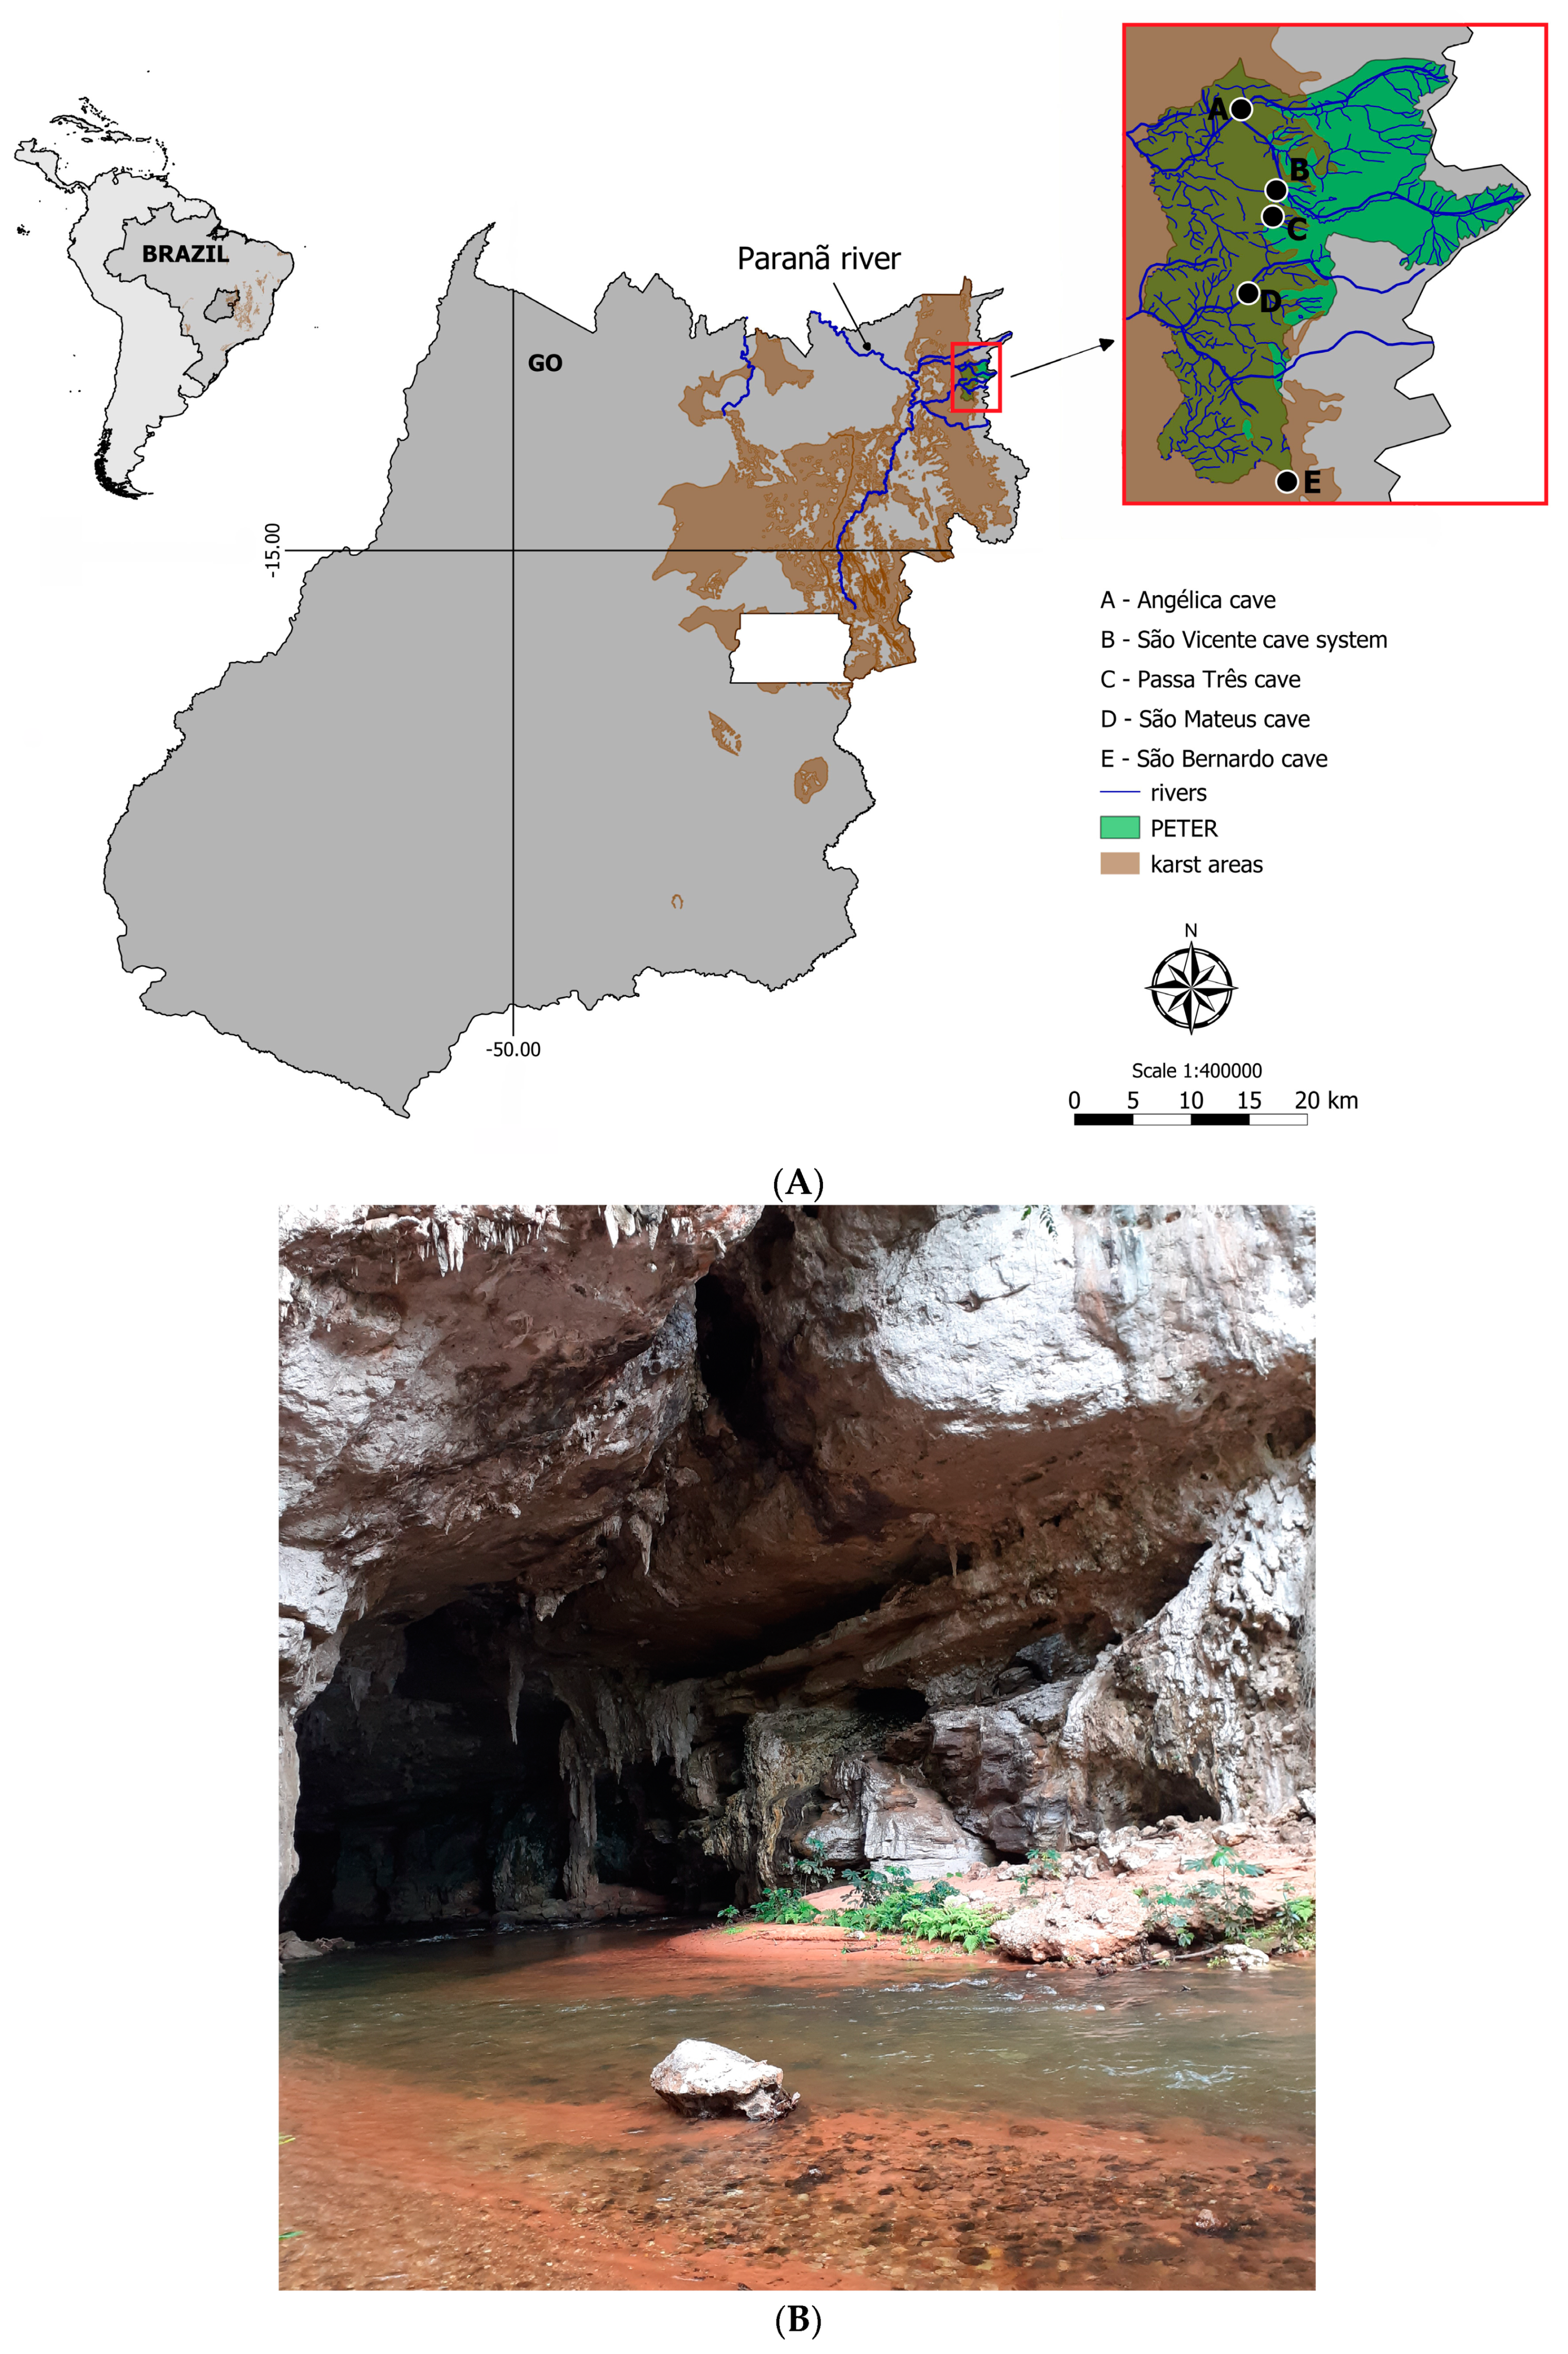
The study sites were located in Terra Ronca State Park (46°10′–46°30′ S, 13°30′–13°50′ W) in the upper Tocantins River basin, State of Goiás, Central Brazil. The park is part of large limestone and sandstone landscape commonly called São Domingos karst area. More than 200 caves occur in the region, including some of the largest cave systems in Brazil (some with more than 20 km of map passageways) (
Figure 1A).
The troglobitic populations of all four
Ituglanis catfishes from the São Domingos karst area live in the upper levels of subterranean systems isolated from each other by non-karst rocks (
Figure 1B). The subterranean streams run parallel westwards and dozens of kilometers downstream until their resurgence; hence, there are no subterranean connections between those populations, which seemingly evolved independently.
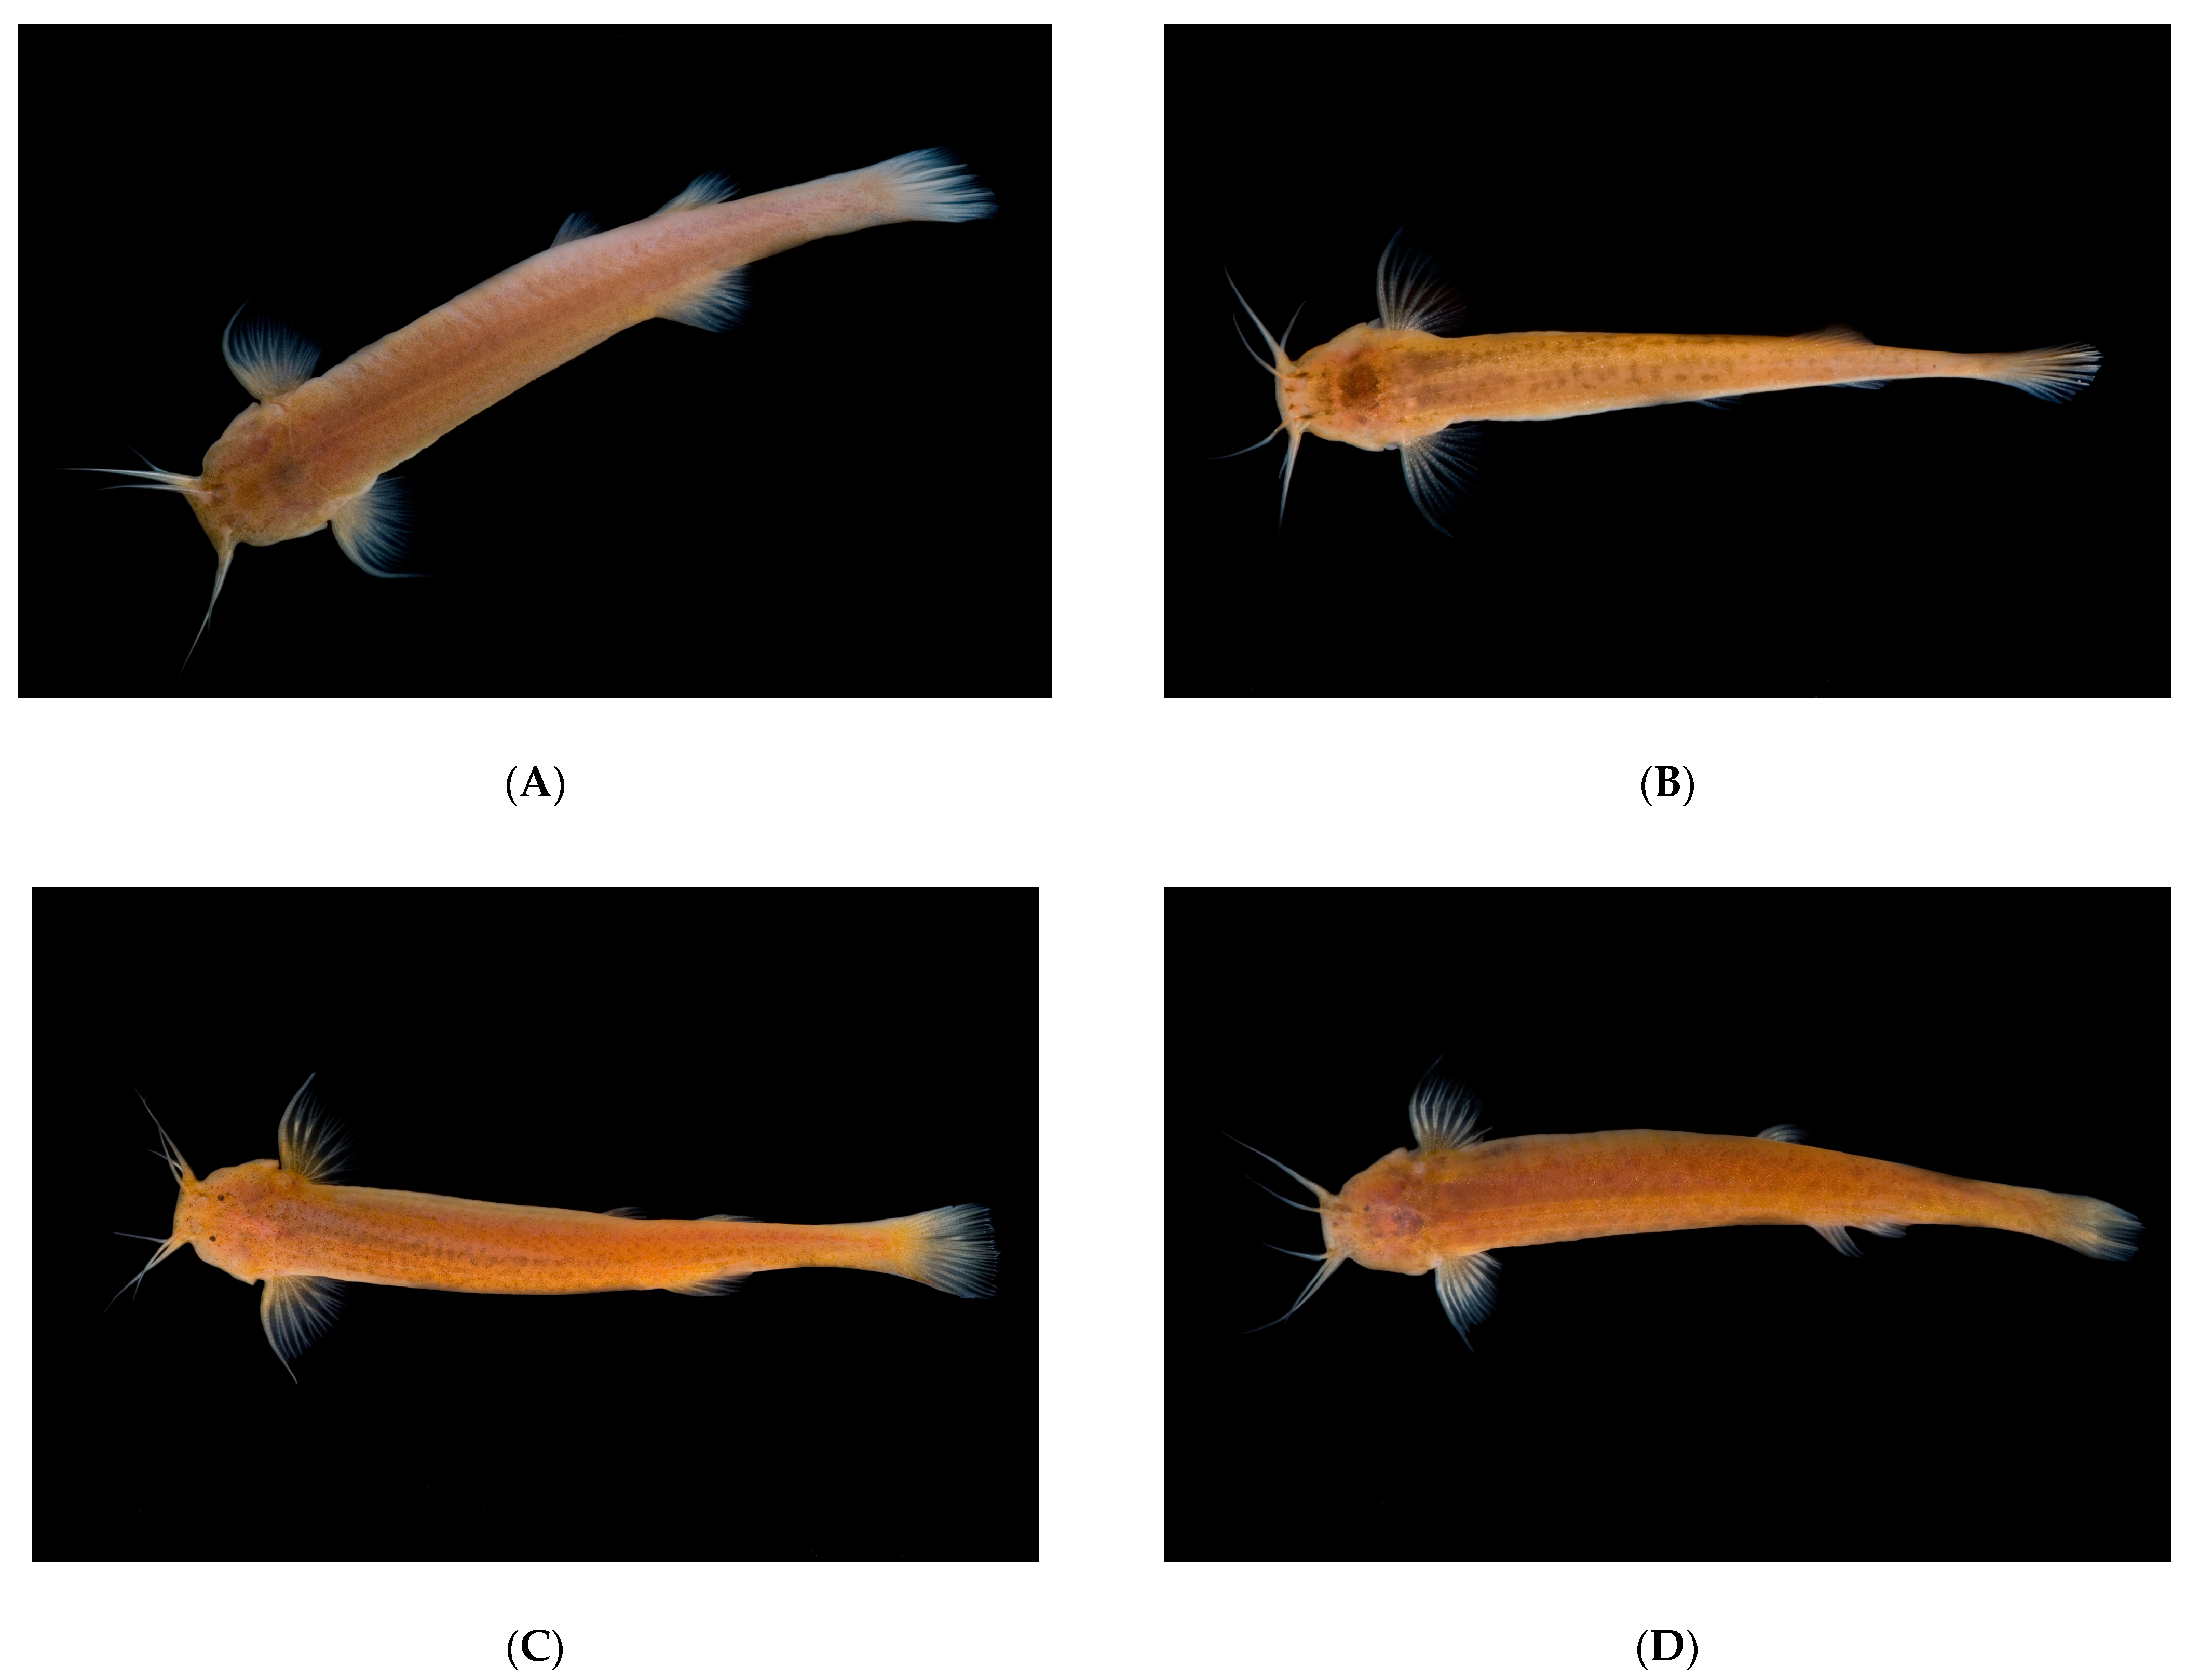
The
Ituglanis passensis (
Figure 2A) population is endemic to Passa Três cave, an upper vadose tributary of the São Vicente cave system, São Domingos karst area, Central Brazil. There is morphological evidence for preterit adaptation to the epikarst, indicating vertical colonization of the subterranean biotope [
32].
Among the species that live and disperse through non-cave habitats,
I. epikarsticus (
Figure 2B) was the first described troglobitic fish adapted to life in the epikarst [
29]. The species is known from few specimens found in a set of rimstone pools located ca. 1000 m deep inside São Mateus cave, São Domingos karst area, Central Brazil; this is the only place where such catfish are found. There is no contact between the matrix rock and the rimstone pools; therefore, there is no possibility of horizontal movements to and from non-cave habitats. One possibility for these catfish to reach the rimstone pools is through washing events from the epikarst population.
Ituglanis epikarsticus has not been observed anywhere else in the cave, which has been explored by speleologists since the 1970s [
29].
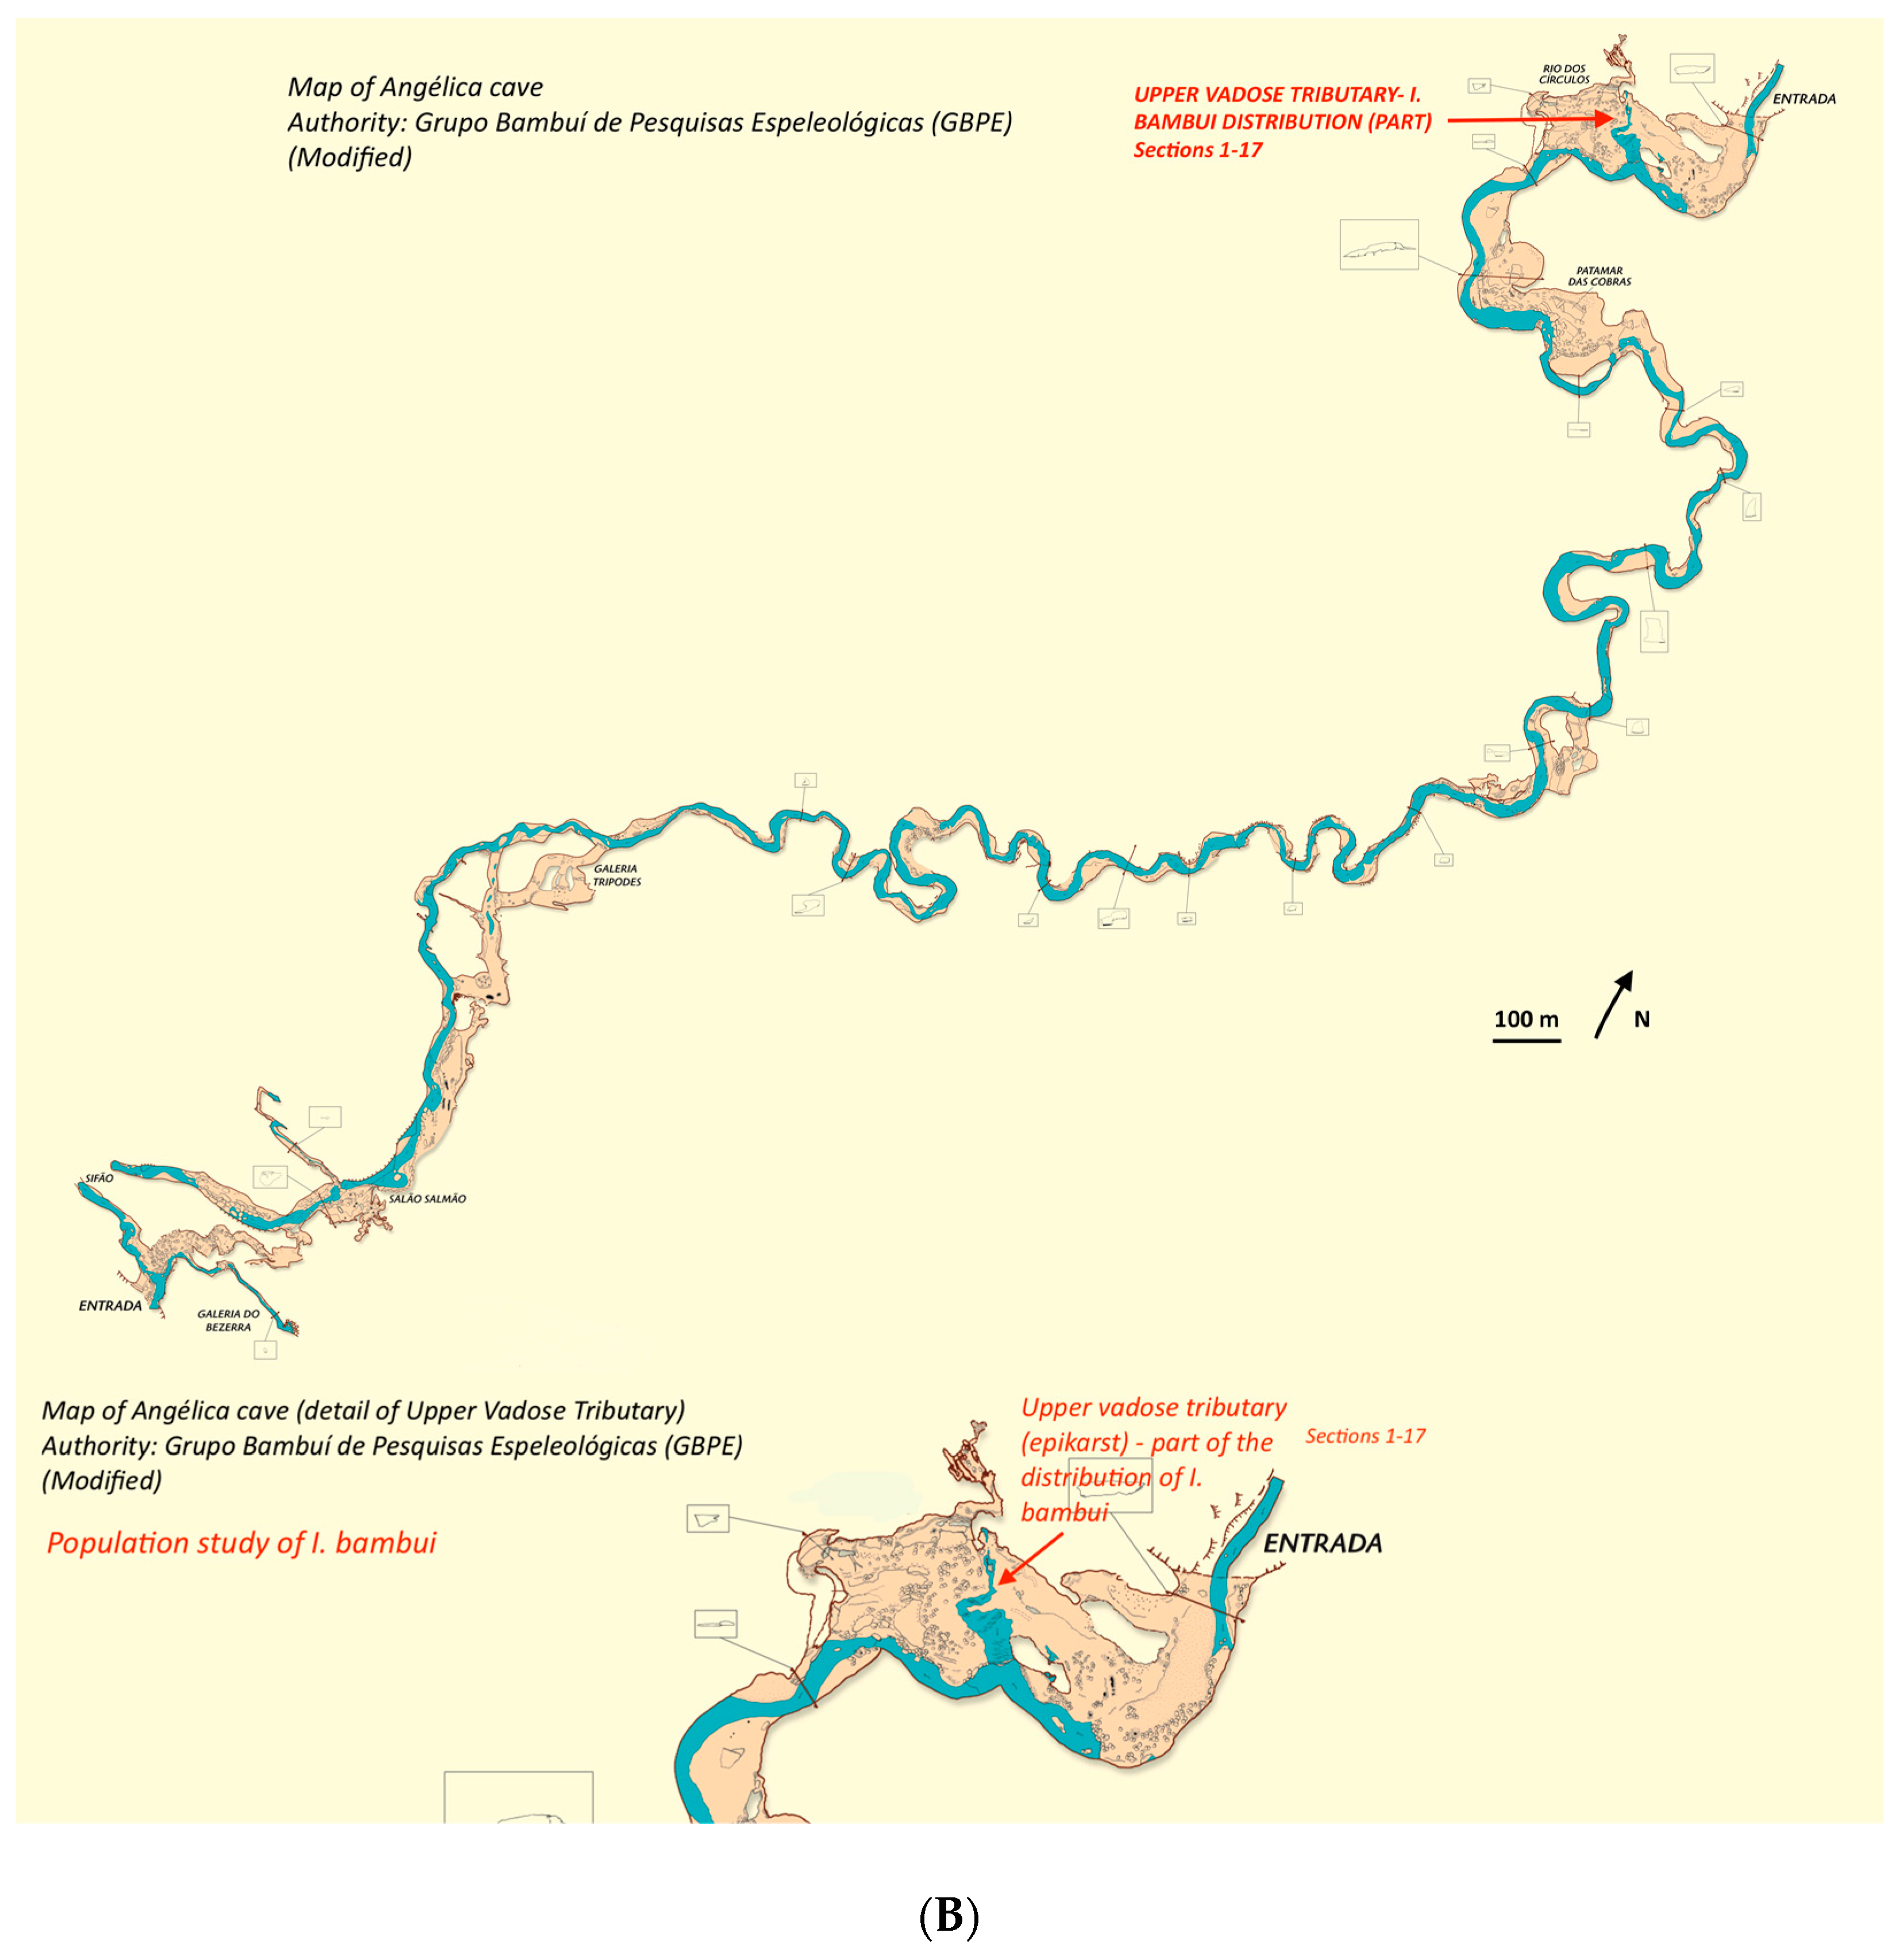
Ituglanis bambui (
Figure 2C) was described based on specimens found in an upper vadose tributary inside Angélica cave, São Domingos karst area, Central Brazil, located near (ca. 200 m) the cave sinkhole [
29]. Later on, several specimens matching
I. bambui description were recovered in rimstone pools near the opposite (the resurgence) end of the cave system, approximately 4 km from the first site in a straight line. This indicates that the
I. bambui population distributes through the epikarst above Angélica cave. Fish observed in the vadose tributary near the sinkhole may be a small cave peripherical population of the main population [
32].
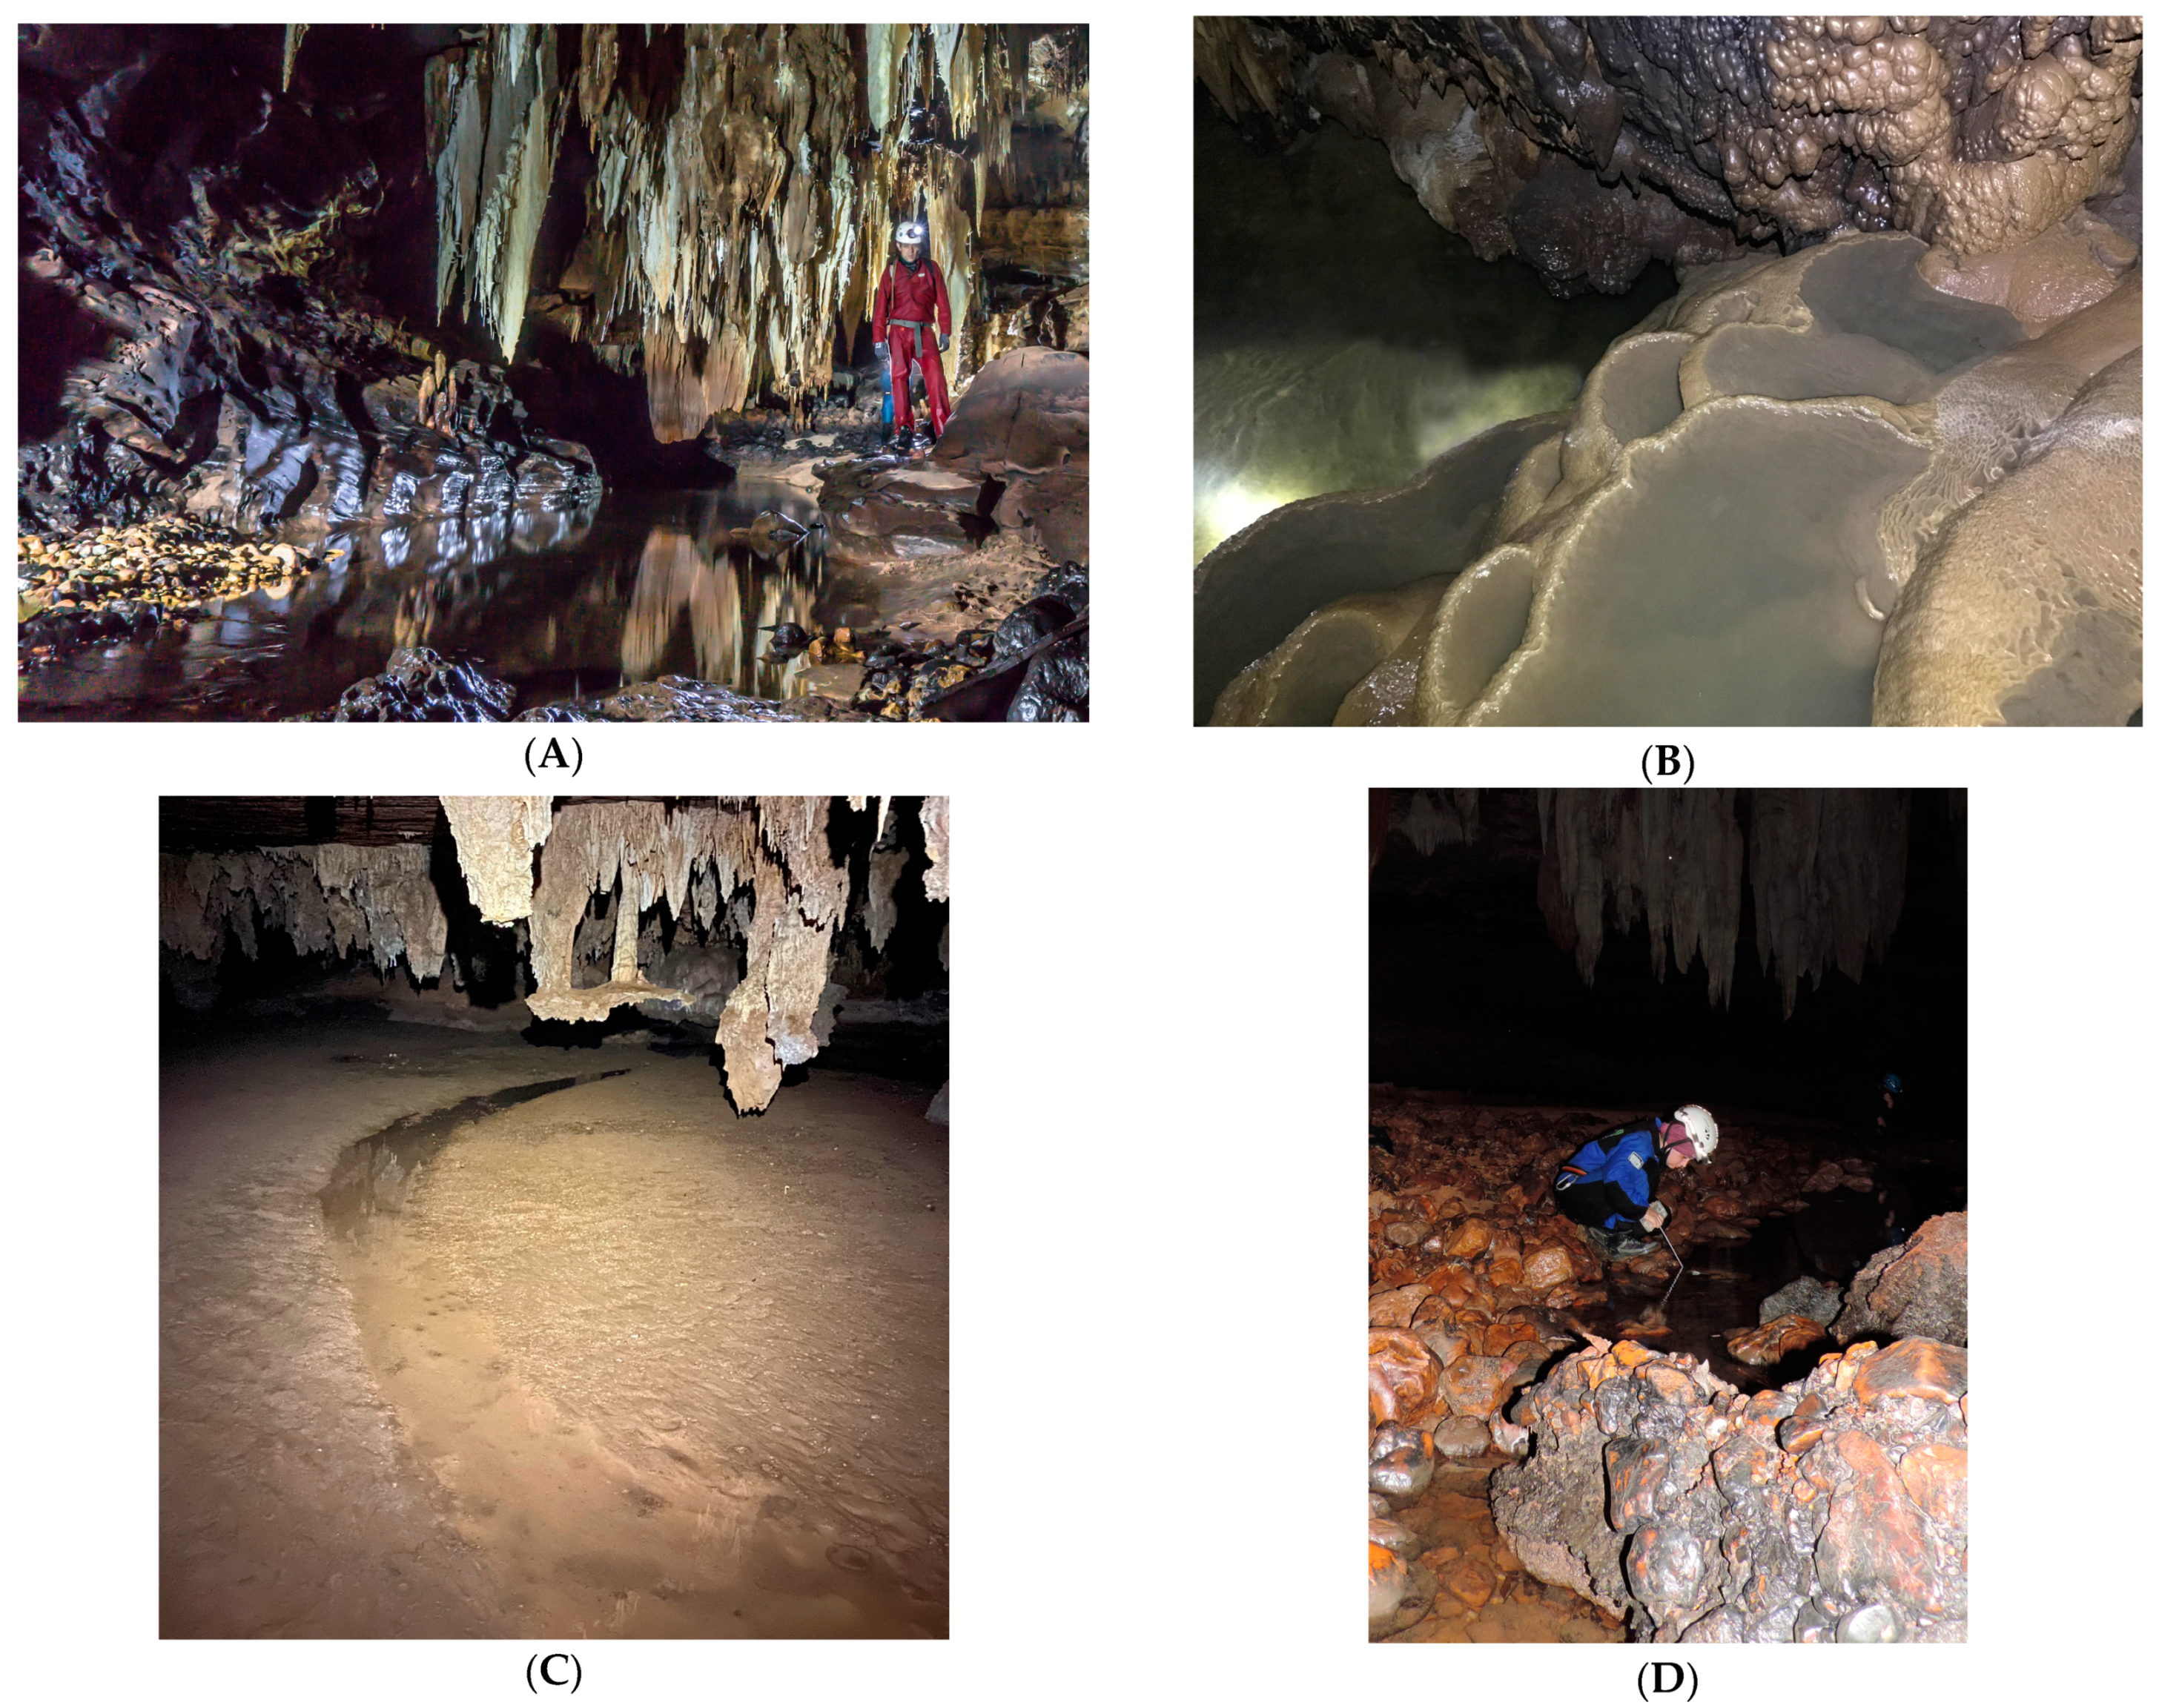
Ituglanis ramiroi (
Figure 2D) was first known from specimens collected at side pools (
Figure 3D) at the base level stream conduit in São Bernardo cave [
29]. Later on, individuals were found in an upper tributary located near the surface level and fed by the epikarst aquifer, above the tributary where the troglobitic
Pimelodella spelaea catfish lives [
35].
Figure 3A–D below show the details of habitats of the four
Ituglanis species.
2.2. Fieldwork
Ituglanis passensis (Passa Três cave) and I. bambui (Angélica cave) were studied in seven fieldtrips conducted across three years (between July 1999 and August 2001), always in the dry season, with variable intervals between each visit: 8–25 July 1999, 3–19 September 1999, 23 April–7 May 2000, 18 July–6 August 2000, 9–19 September 2000, 27 April–14 May 2001, and 5–26 August 2001. After we realized that the marks were lost after a few months due to reabsorption, we visited Passa Três cave twice (with an interval of 11 days) and Angélica cave also twice (with an interval of seven days) in August 2001. Direct observations and capture data were used in the calculations of population parameters. Fieldwork was restricted to the dry season due to the occurrence of flash floods in the rainy season.
To study the
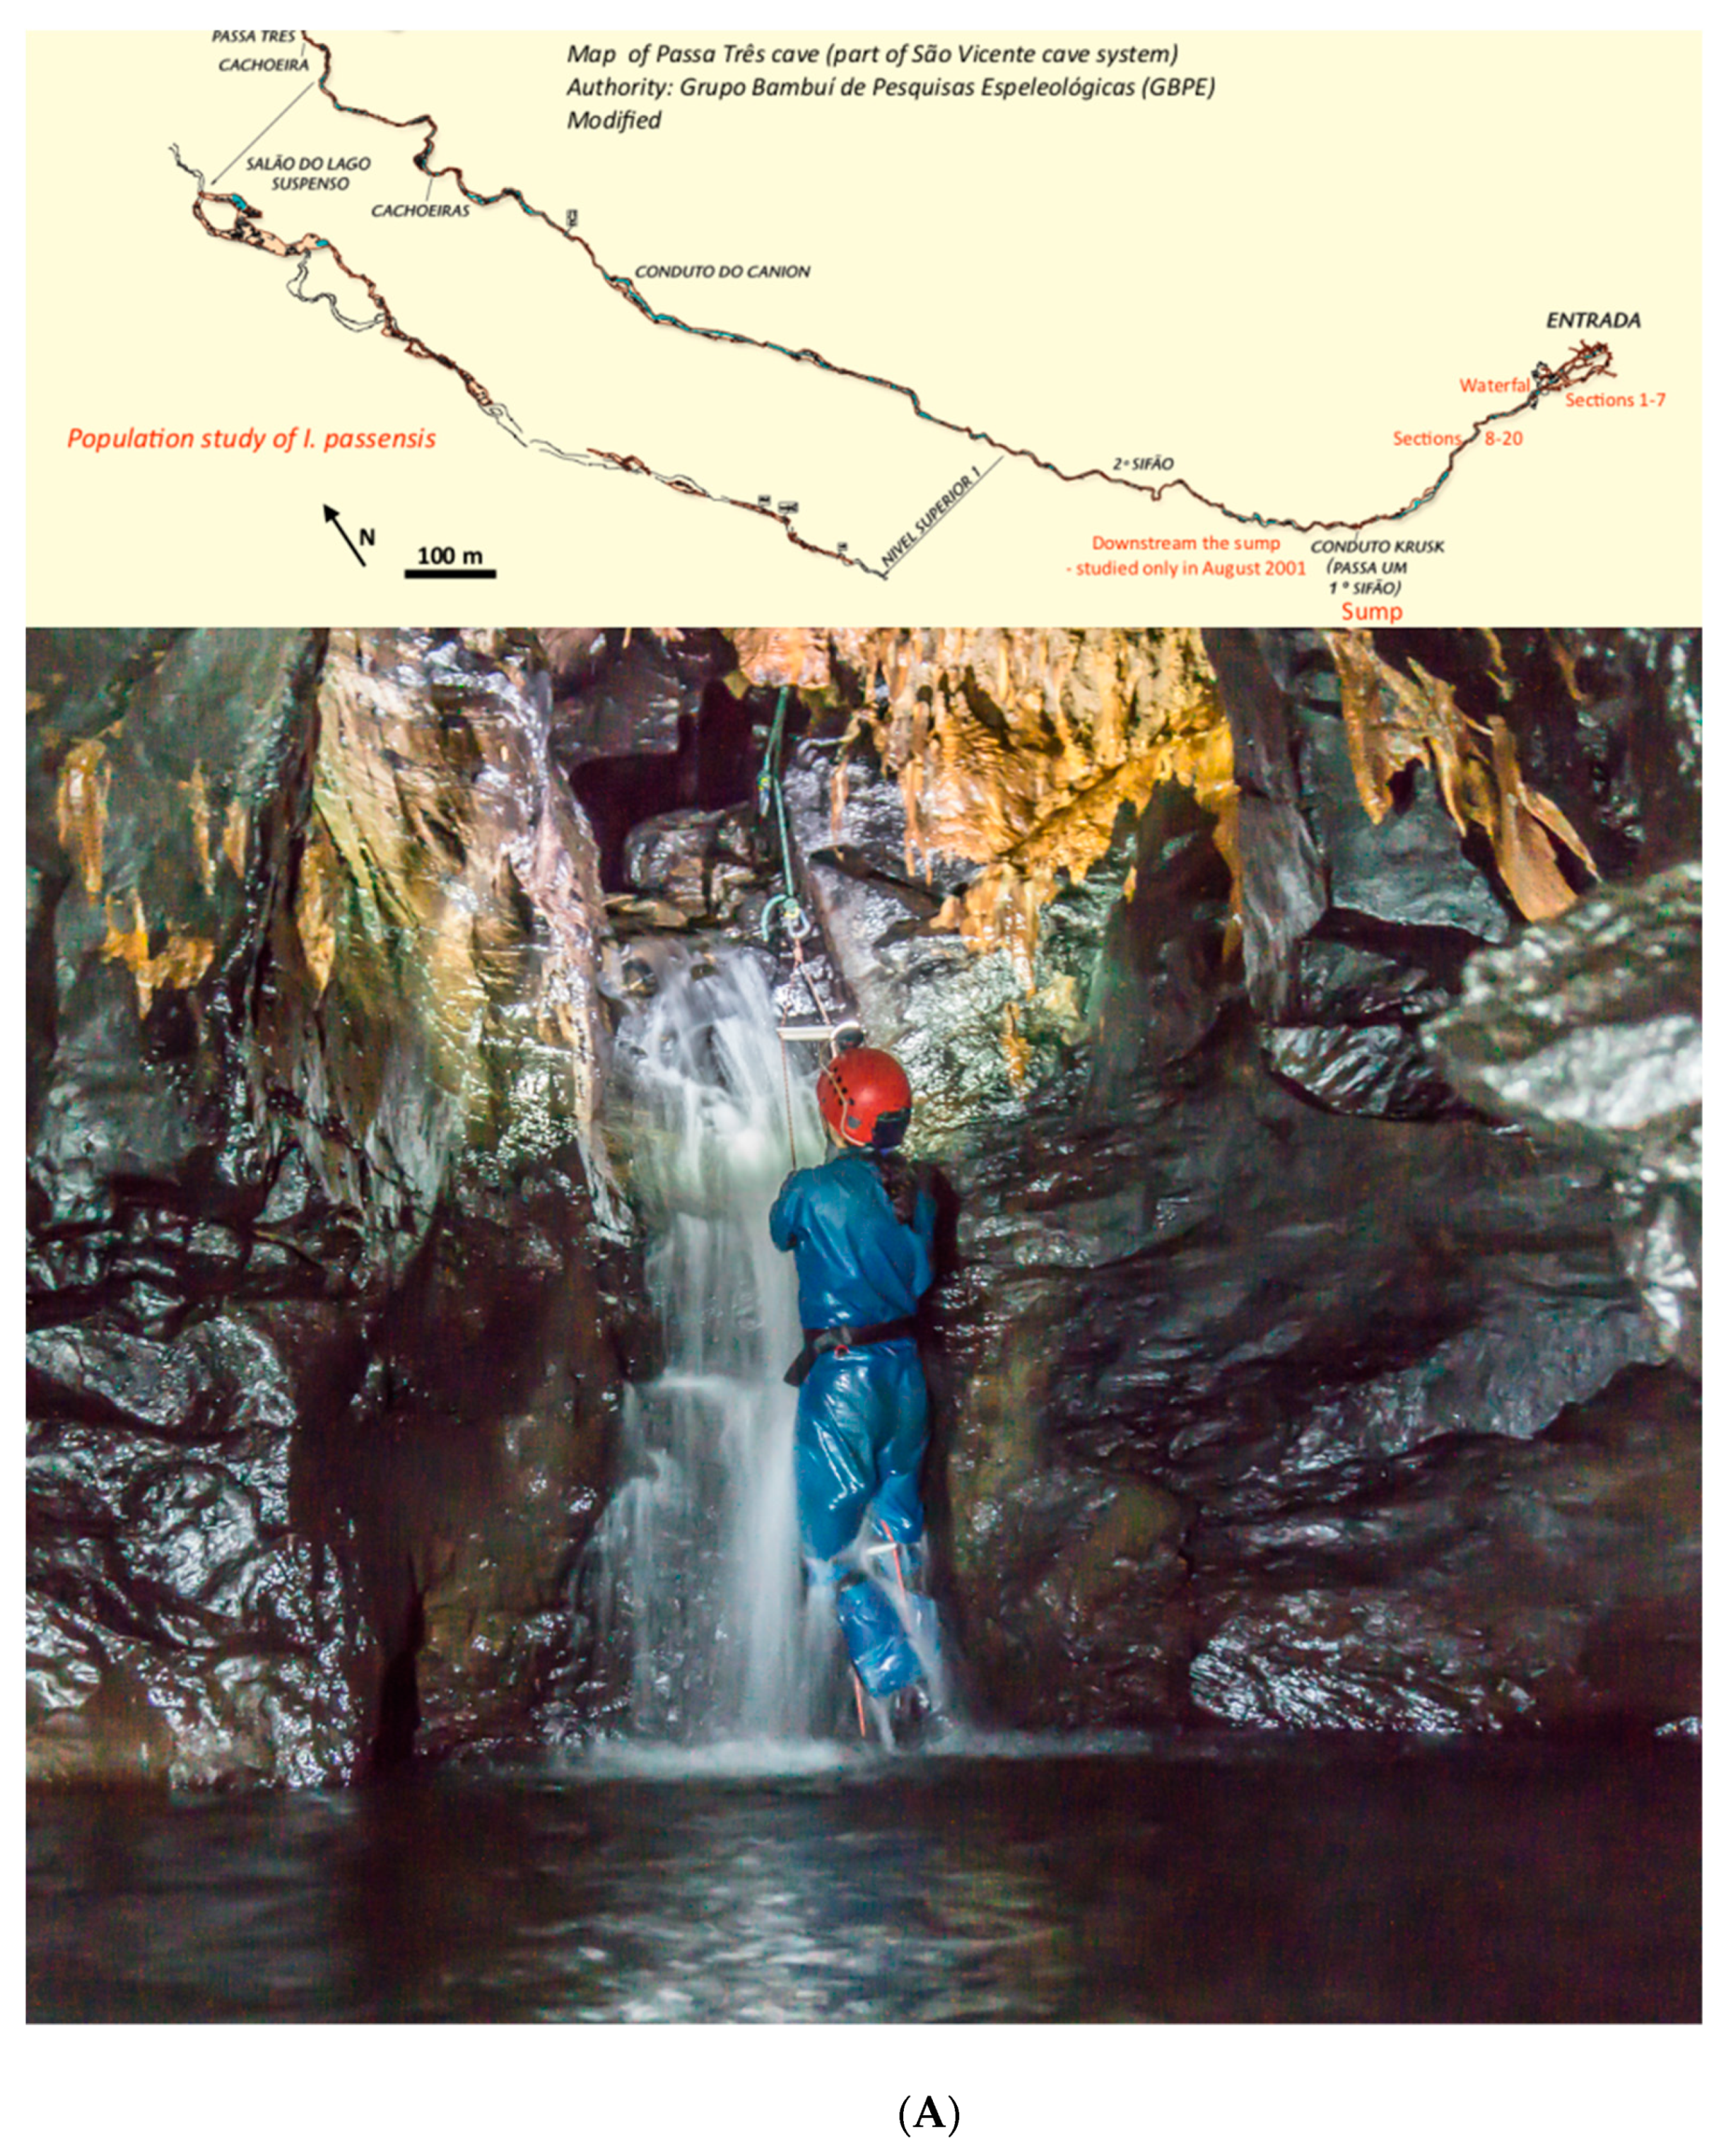
I. passensis population, we divided the stream conduit in 20 sections 20 m long, marked with colored plastic tape.
Section 1 to
Section 4 were located before a waterfall of 6 m (
Figure 4A), about 100 m from the entrance to the cave (sinkhole). The remaining sections were located downstream from this waterfall towards the deeper area of the cave, ending at a short sump (a section of flooded passage), transposed only in July 2001 (
Figure 4A). Using the mark-recapture method, the study covered about 400 m
2 (calculated from map), that is, ca. 1/5 of the accessible habitat occupied by
I. passensis. In addition, visual censuses were conducted in July and August 2001 downstream from the sump. To study
I. bambui, we divided the upper vadose tributary of Angélica cave into 17 sections (ca. 900 m
2 calculated from a map); each section was 15 m long, and widths varied between 0.80 and 10 m (
Figure 4B).
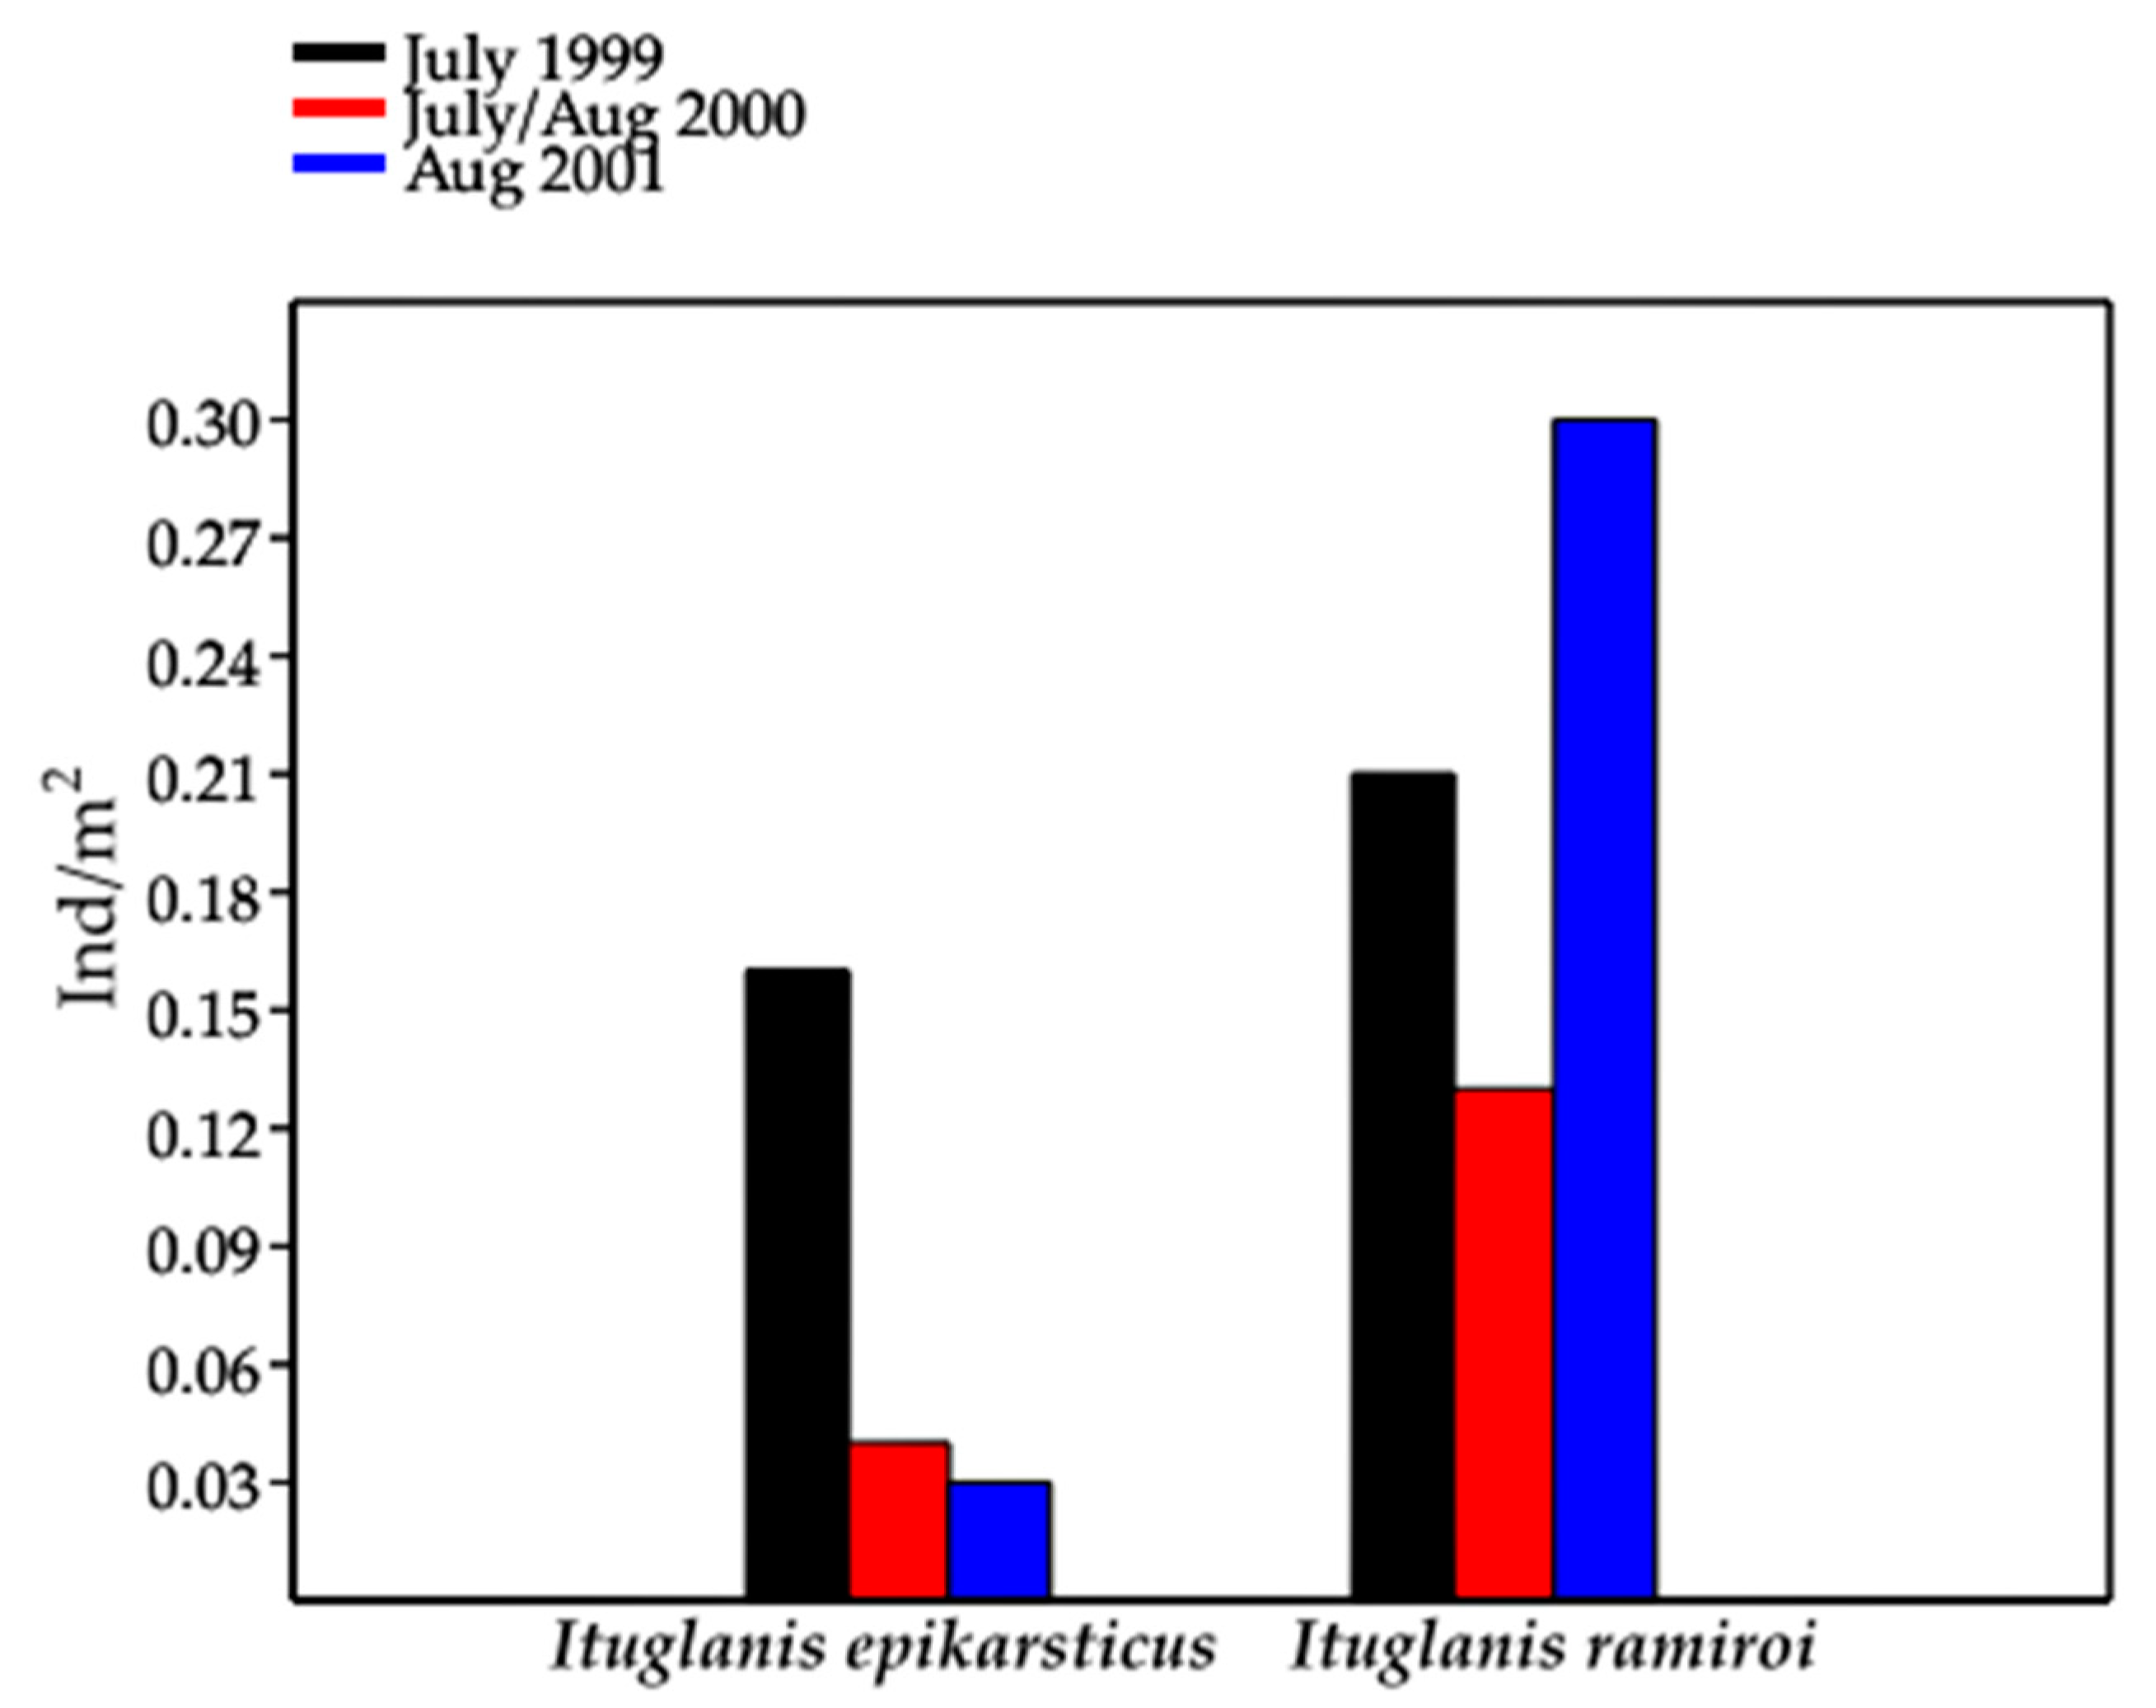
On three occasions (July 1999, July or August 2000, and August 2001), we conducted visual censuses for I. epikarsticus at São Mateus cave (two hours of observations on each occasion) and I. ramiroi at São Bernardo cave (three hours of observations). We measured the areas of rimstone and side pools to estimate the densities of individuals in these populations.
We captured the specimens with hand nets after visual inspection of the habitats, including potential hiding places such as rock crevices, under stone chips and pebbles, and by revolving the bottom to dislodge buried fish. The time of inspection was 30 min per section in Passa Três cave and 30–40 min per section in Angélica cave.
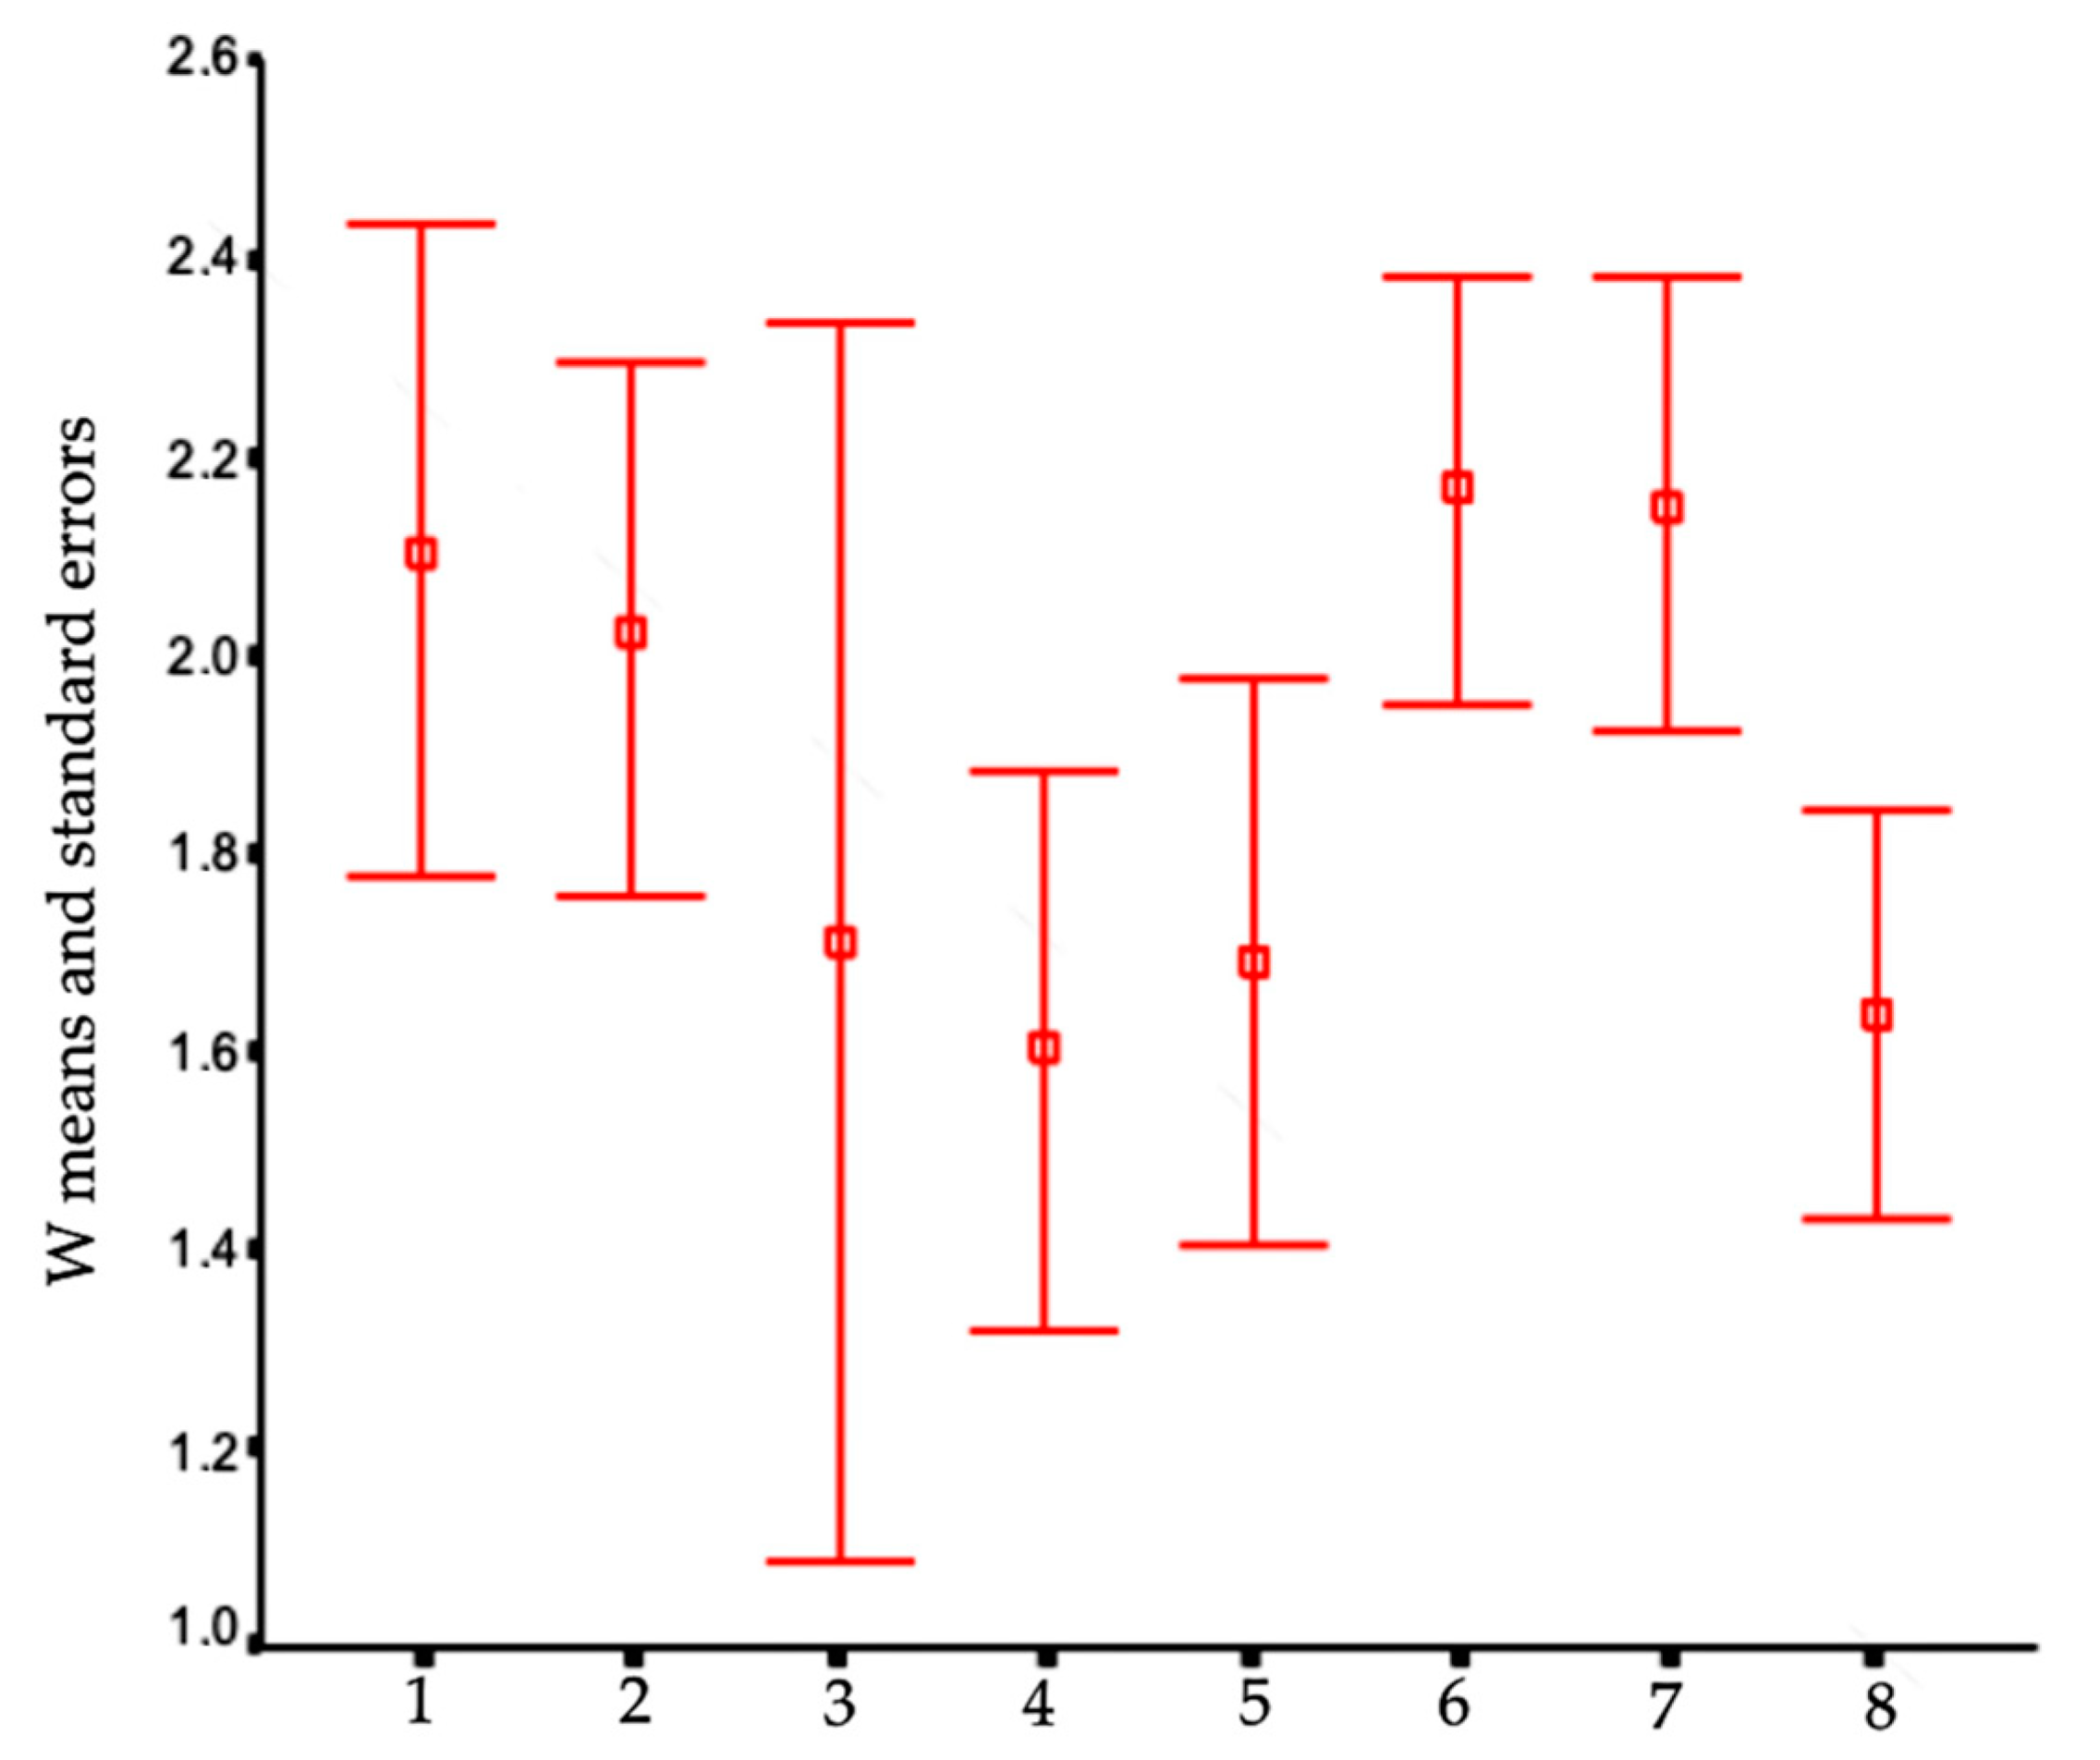
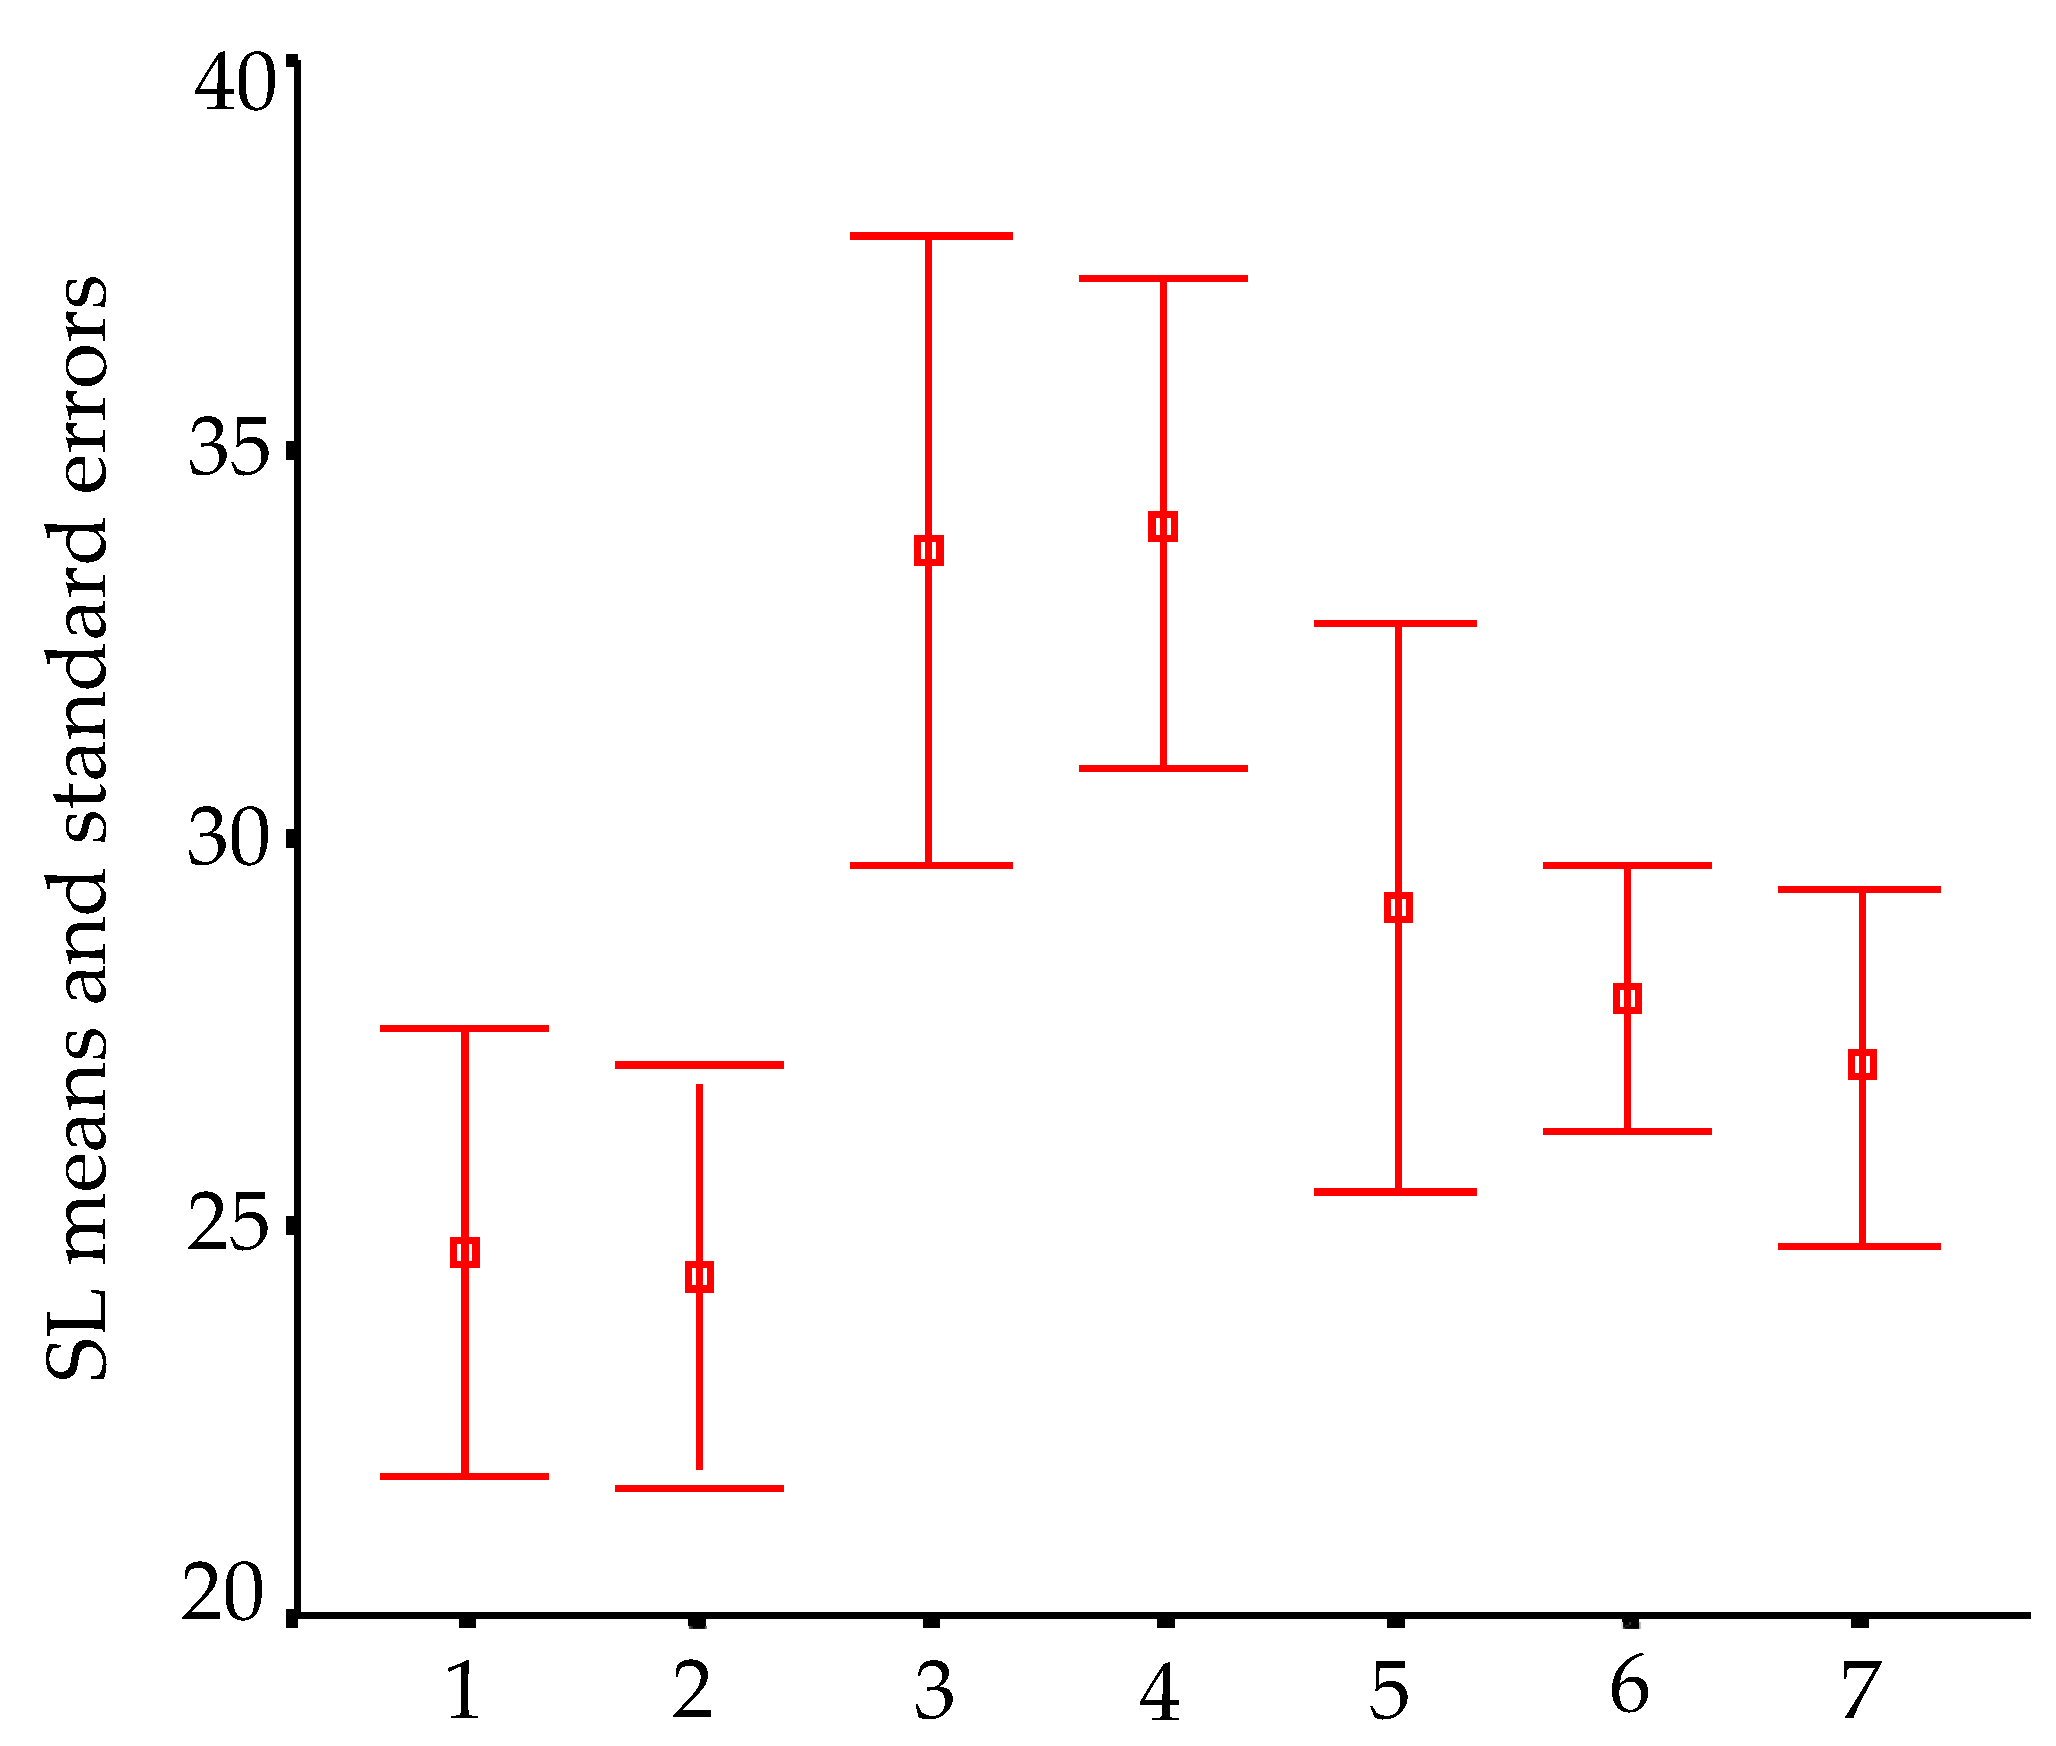
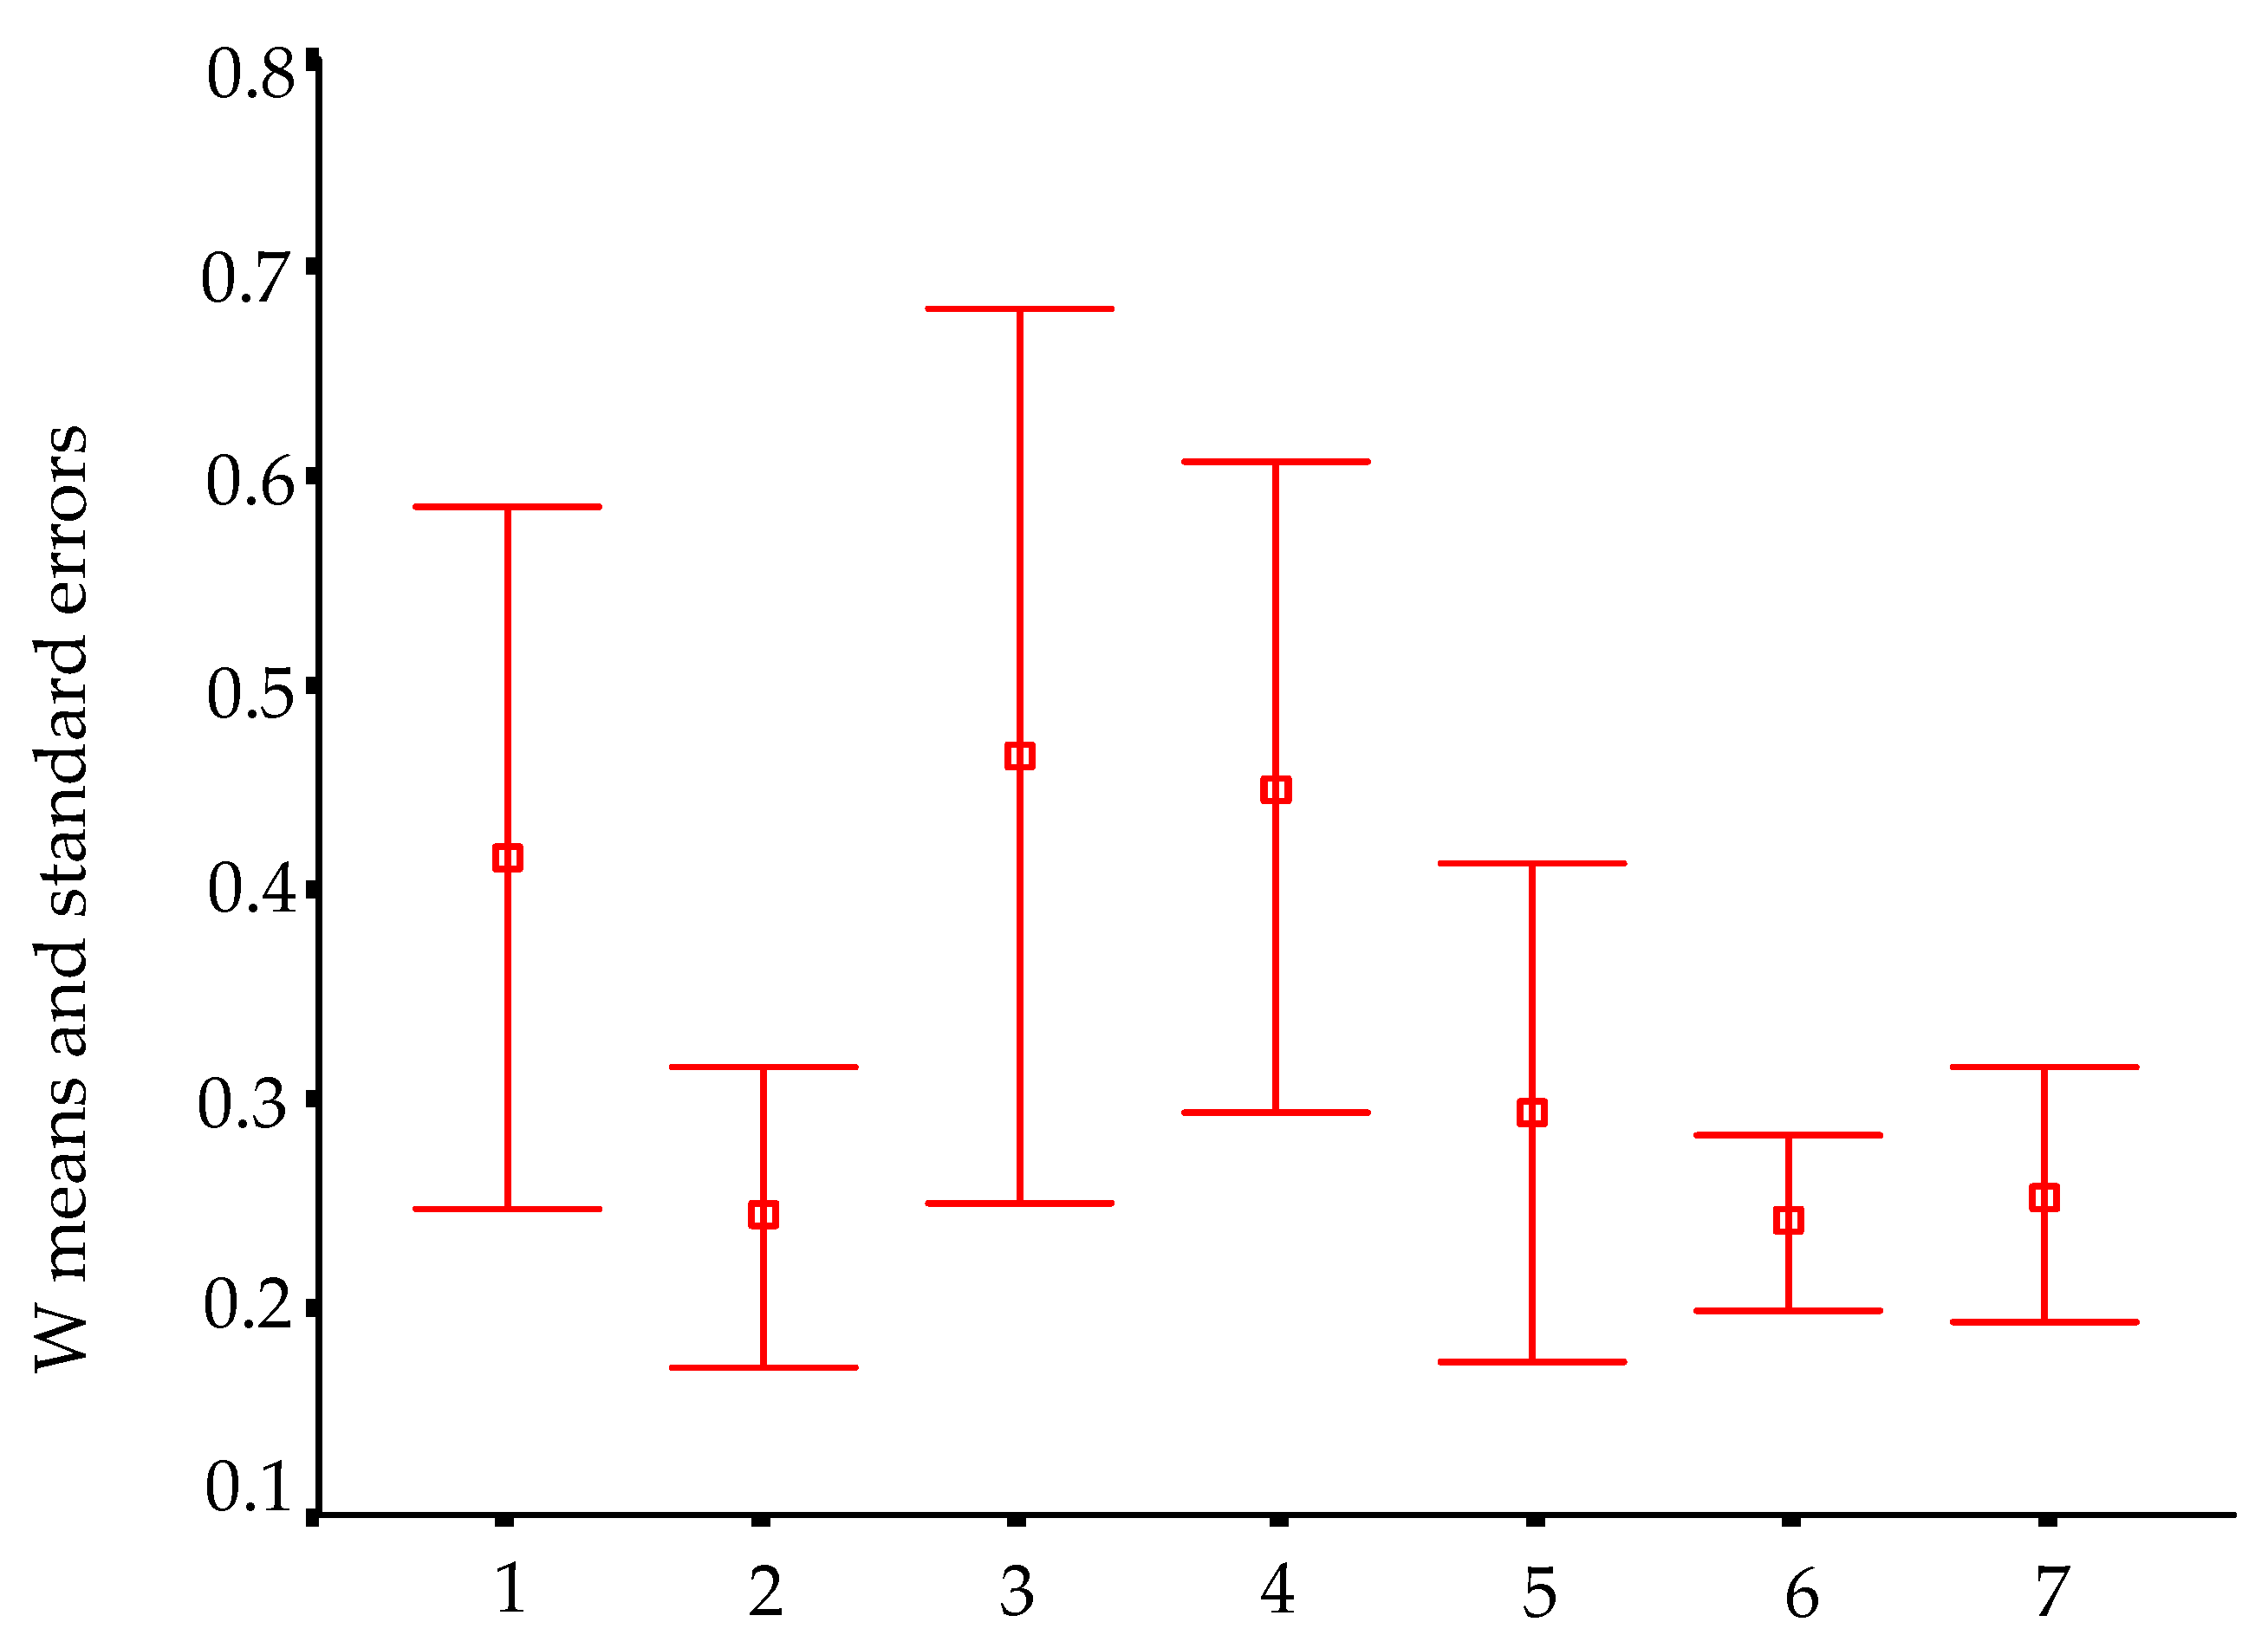
After capture, the catfish were anesthetized in a solution of benzocaine, weighed (W) with a dynamometer (0.20 g accuracy), and measured (standard length, SL, in mm) with a caliper with 0.1 mm accuracy. They were marked using subcutaneous injection of biocompatible ink (nankeen). For I. bambui, we marked individuals larger than 23.0 mm SL; we did not capture I. passensis specimens smaller than 35.0 mm SL. Individual marking took place by a combination of the position of marks, in the flanks (left or right side), below the dorsal fin. For each capture, we recorded date, section, position of the marks, weight, and length. The fish were then released in the same section in which they were collected.
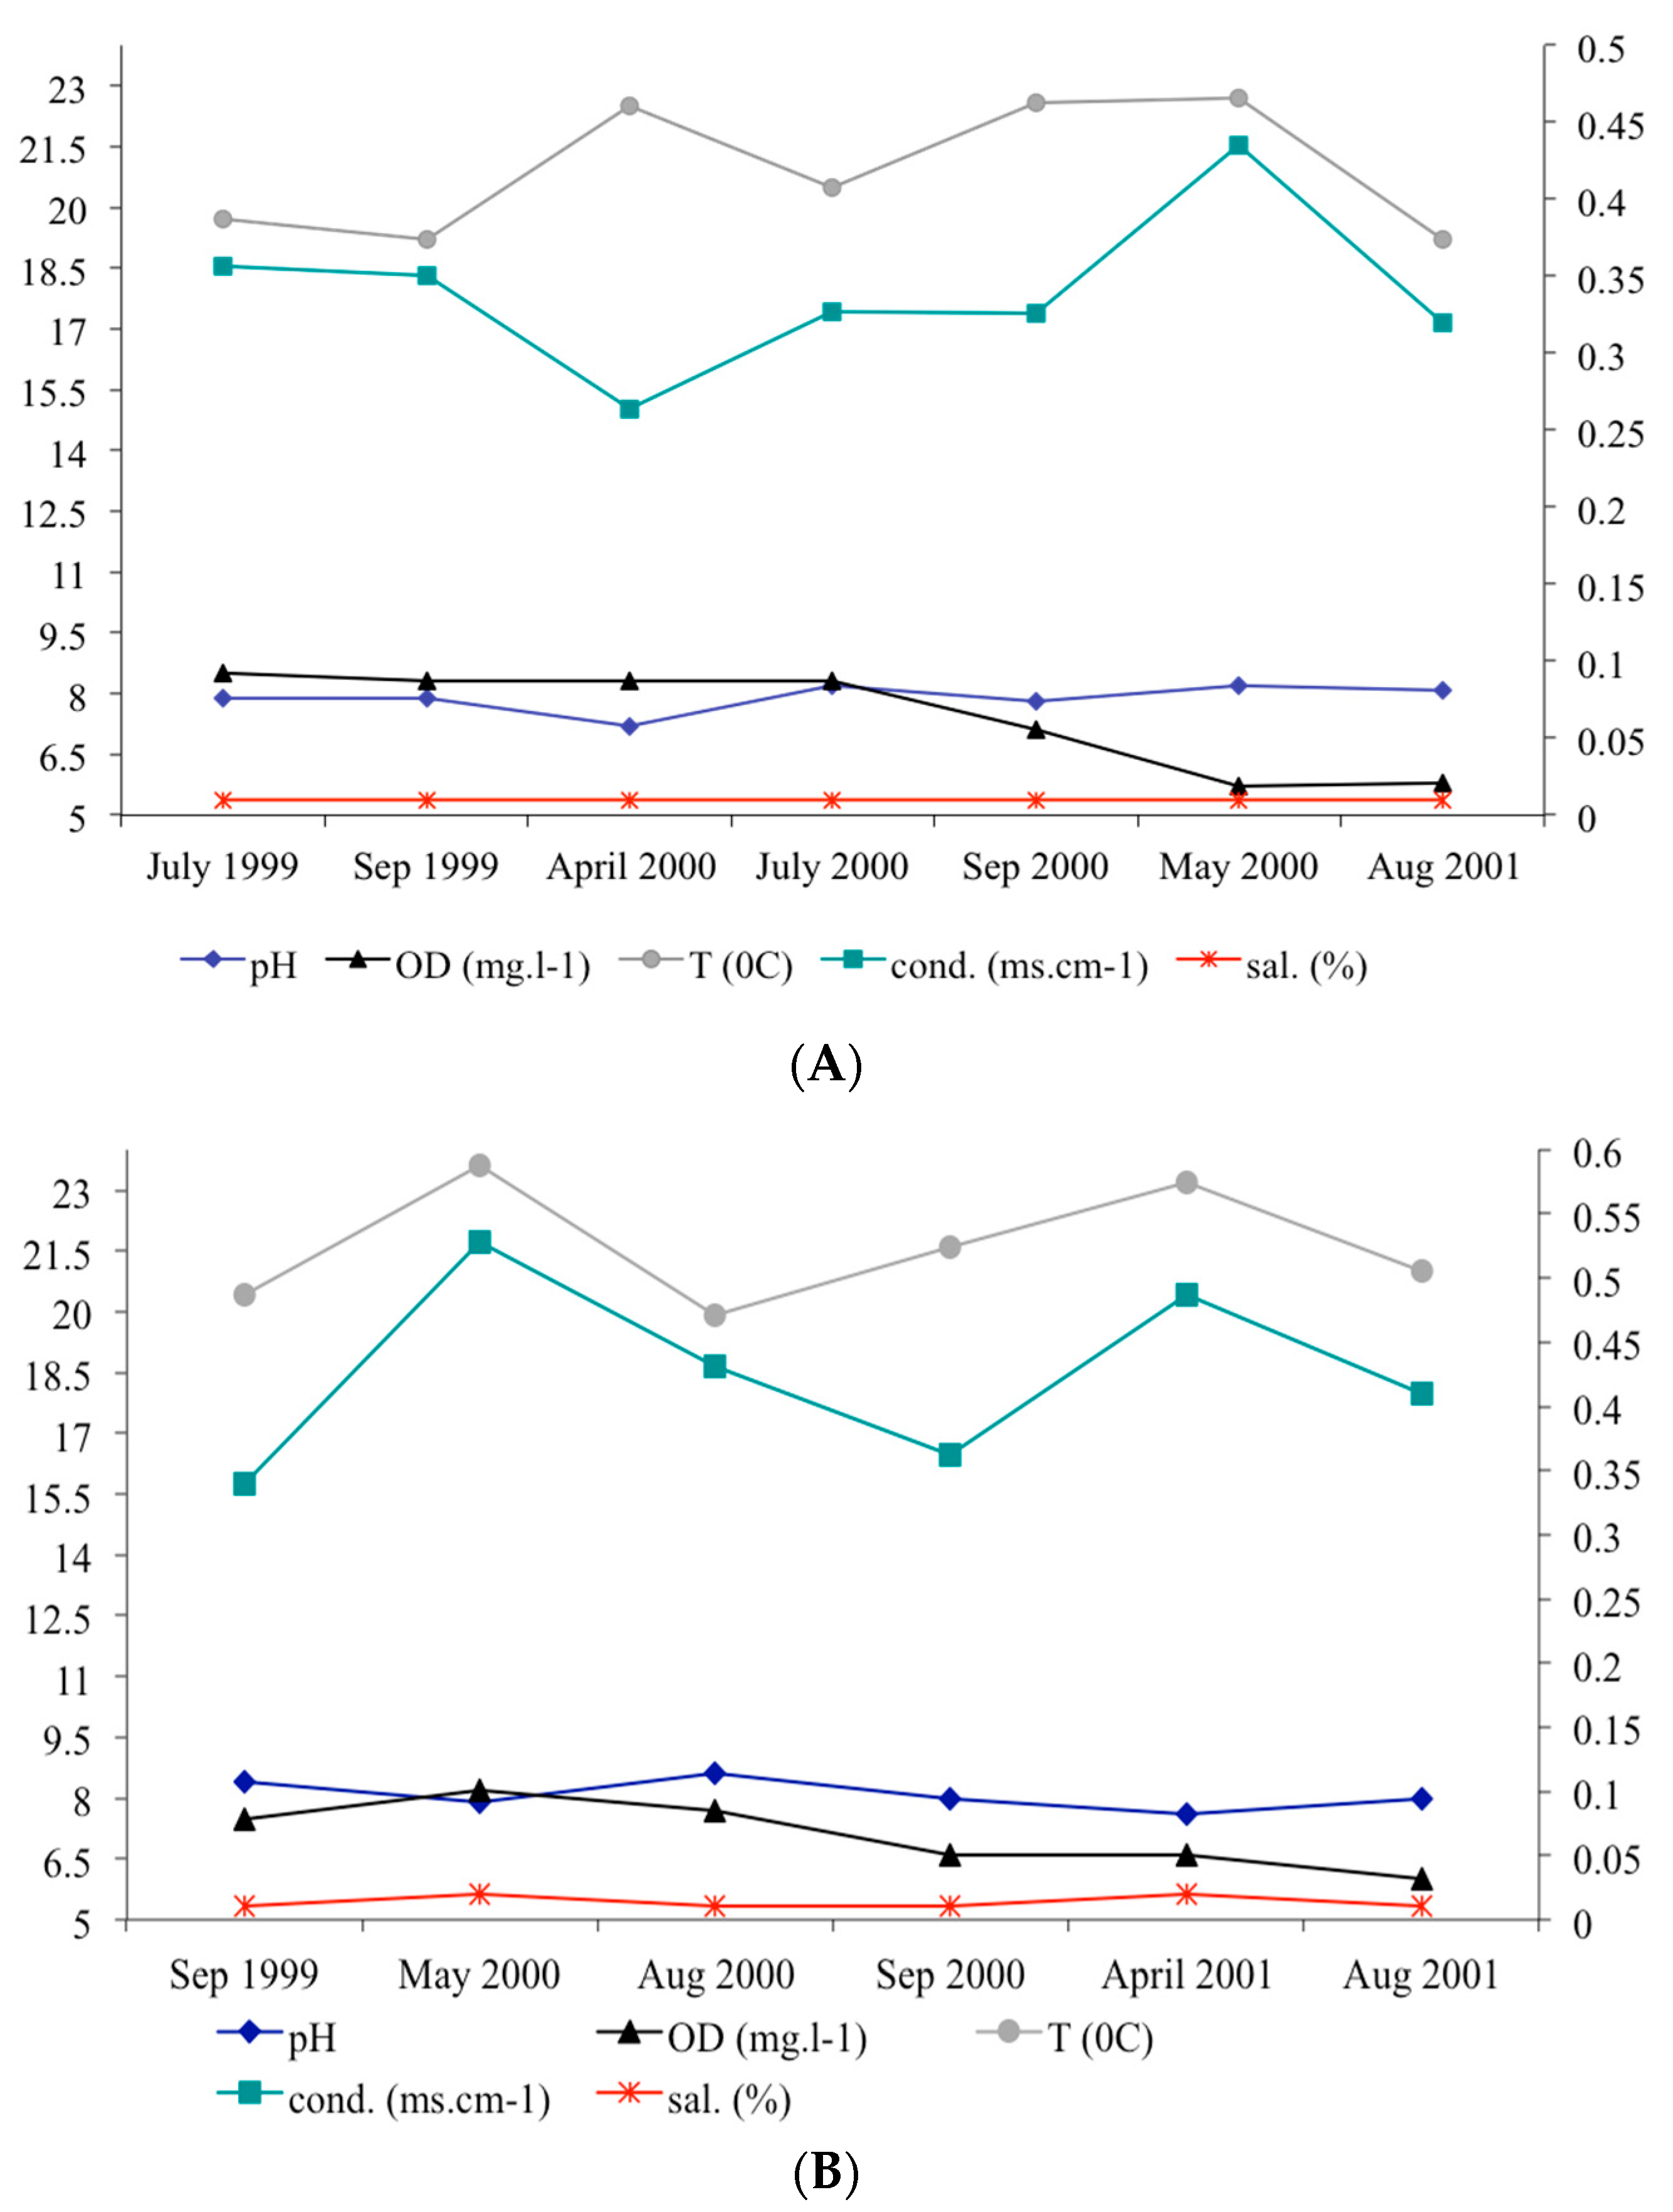
We measured the water physico-chemical variables at Passa Três and Angélica caves (pH, conductivity.ms.cm−1, dissolved oxygen.mg.L−1, temperature/°C, and salinity/%) during the population study. We established two fixed points located in the aphotic zone of Passa Três cave (section 3, 50 m downstream the sinkhole/cave entrance; section 17, 340 m downstream from the sinkhole/cave sinkhole) and in one point at the aphotic zone of Angélica cave (section 9, about 200 m from the cave entrance). For São Bernardo (I. ramiroi locality) and São Mateus (I. epikarsticus locality) caves, punctual measures were recorded. For comparison purposes, we recorded water variables in epigean drainages of Passa Três, Angélica, São Bernardo, and São Mateus.
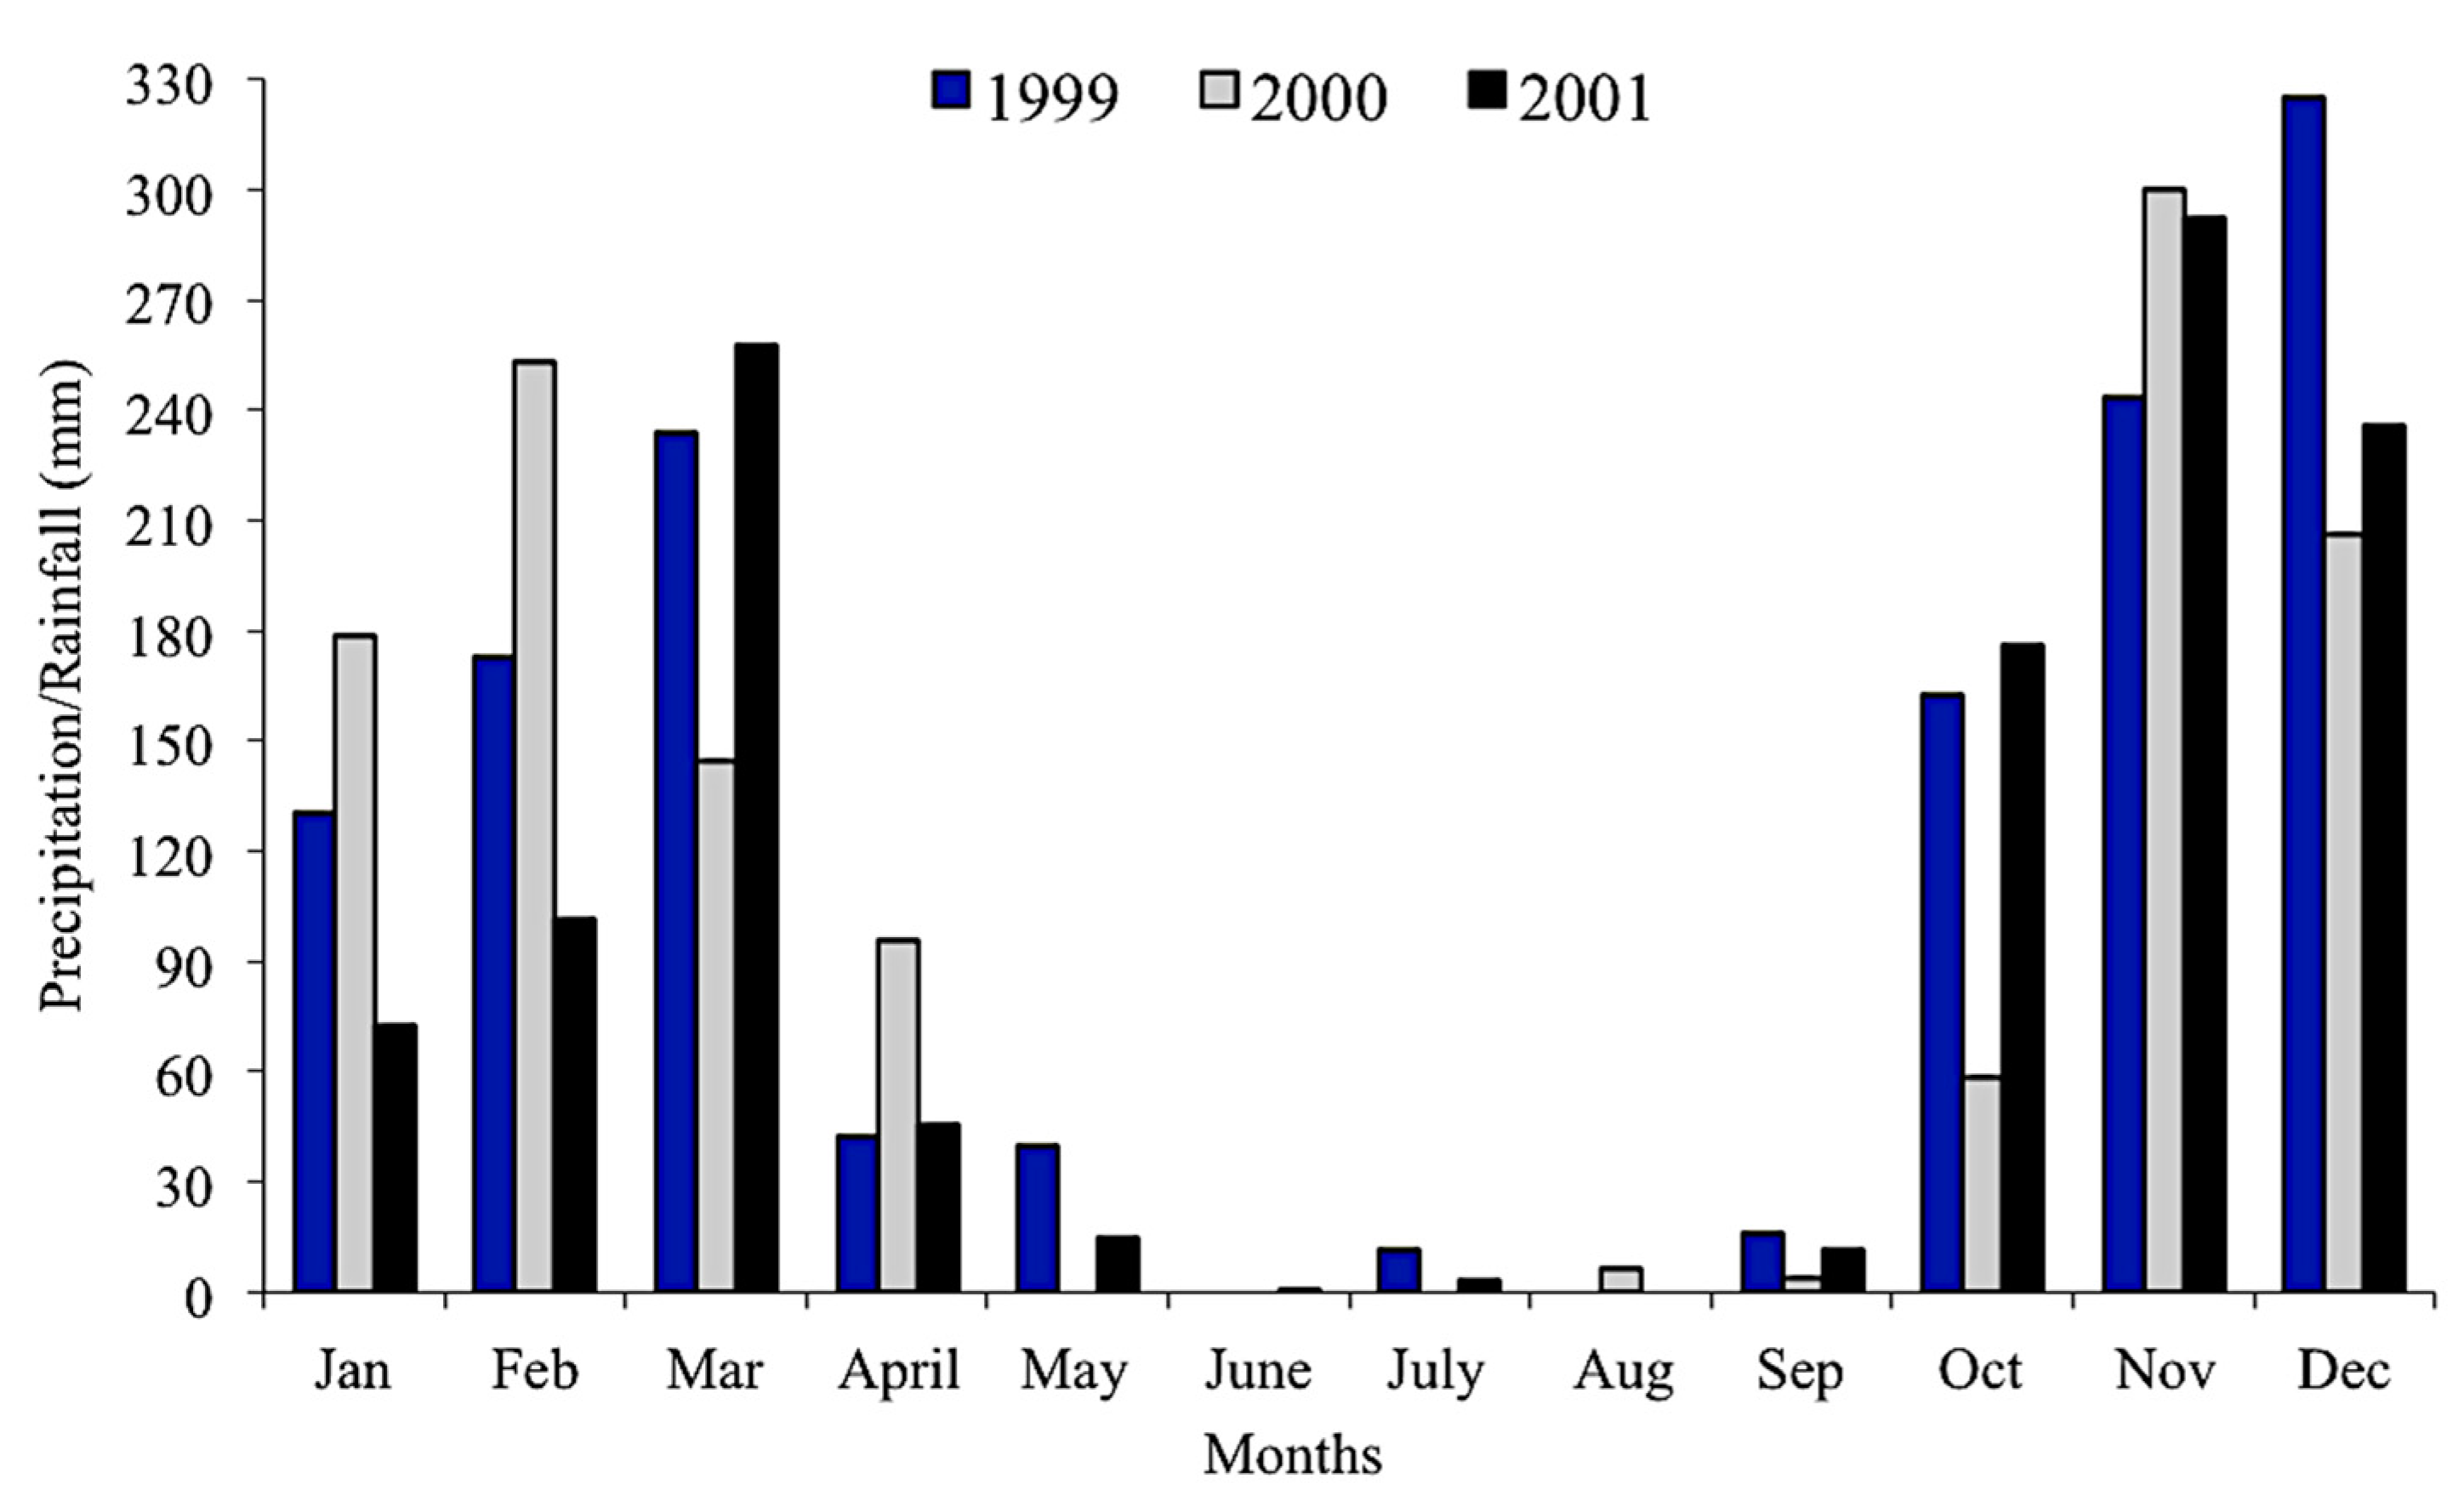
We obtained precipitation data from 1999 to 2001 from a station located 80 km from the study area in the municipality of Posse (INMET–National Institute of Meteorology).
2.3. Data Analysis
We estimated the monthly population sizes and densities of
I. passensis and
I. bambui based on observed and captured individuals per each year of study (1999, 2000, and 2001). We also verified the preference of these species by upstream or downstream subterranean stream stretches. We used the Lincoln–Petersen model [
36]—based on a single episode of capture, marking, and recapture—to estimate the population sizes per year (three year blocks). Standard errors of means (SEM) and confidence intervals were calculated. We used the Petersen method to develop the analysis [
37].
The individual growth rates were calculated for
I. passensis and
I. bambui using the capture-recapture data. For this, we used the increment in body length divided by the time between the captures (days). Standard length (SL) measures presented ± 0.1 mm errors, thus we calculated the error propagation formula in subtraction, sv = ±(s
a2 + s
b2)
1/2, where sv is the propagated final error, and s
a2 and s
b2 are the errors of measures associated with each of the measures [
38], calculated in ±0.14 mm. For cases where the differences between initial and final standard lengths fell within this interval, growth was considered null.
To detect possible differences in the distribution of standard lengths and weights of
I. passensis and
I. bambui, which would reveal recruitment and starvation/unhealthy periods, we compared their frequency classes for each collecting occasion. The condition factor—which measures its degree of health, reflecting its feeding conditions [
39]—of each individual was also calculated. For comparison purposes, 20 specimens of
I. passensis captured downstream from the sump of Passa Três cave stream had their standard lengths and weights recorded.
The relationship between the weight and the standard length of the individuals captured in all occasions was represented by regressions log P =
b × (log SL)
−a, where
b is the regression coefficient, and
a is the point of intersection with the
y-axis when (SL) is zero. The values of
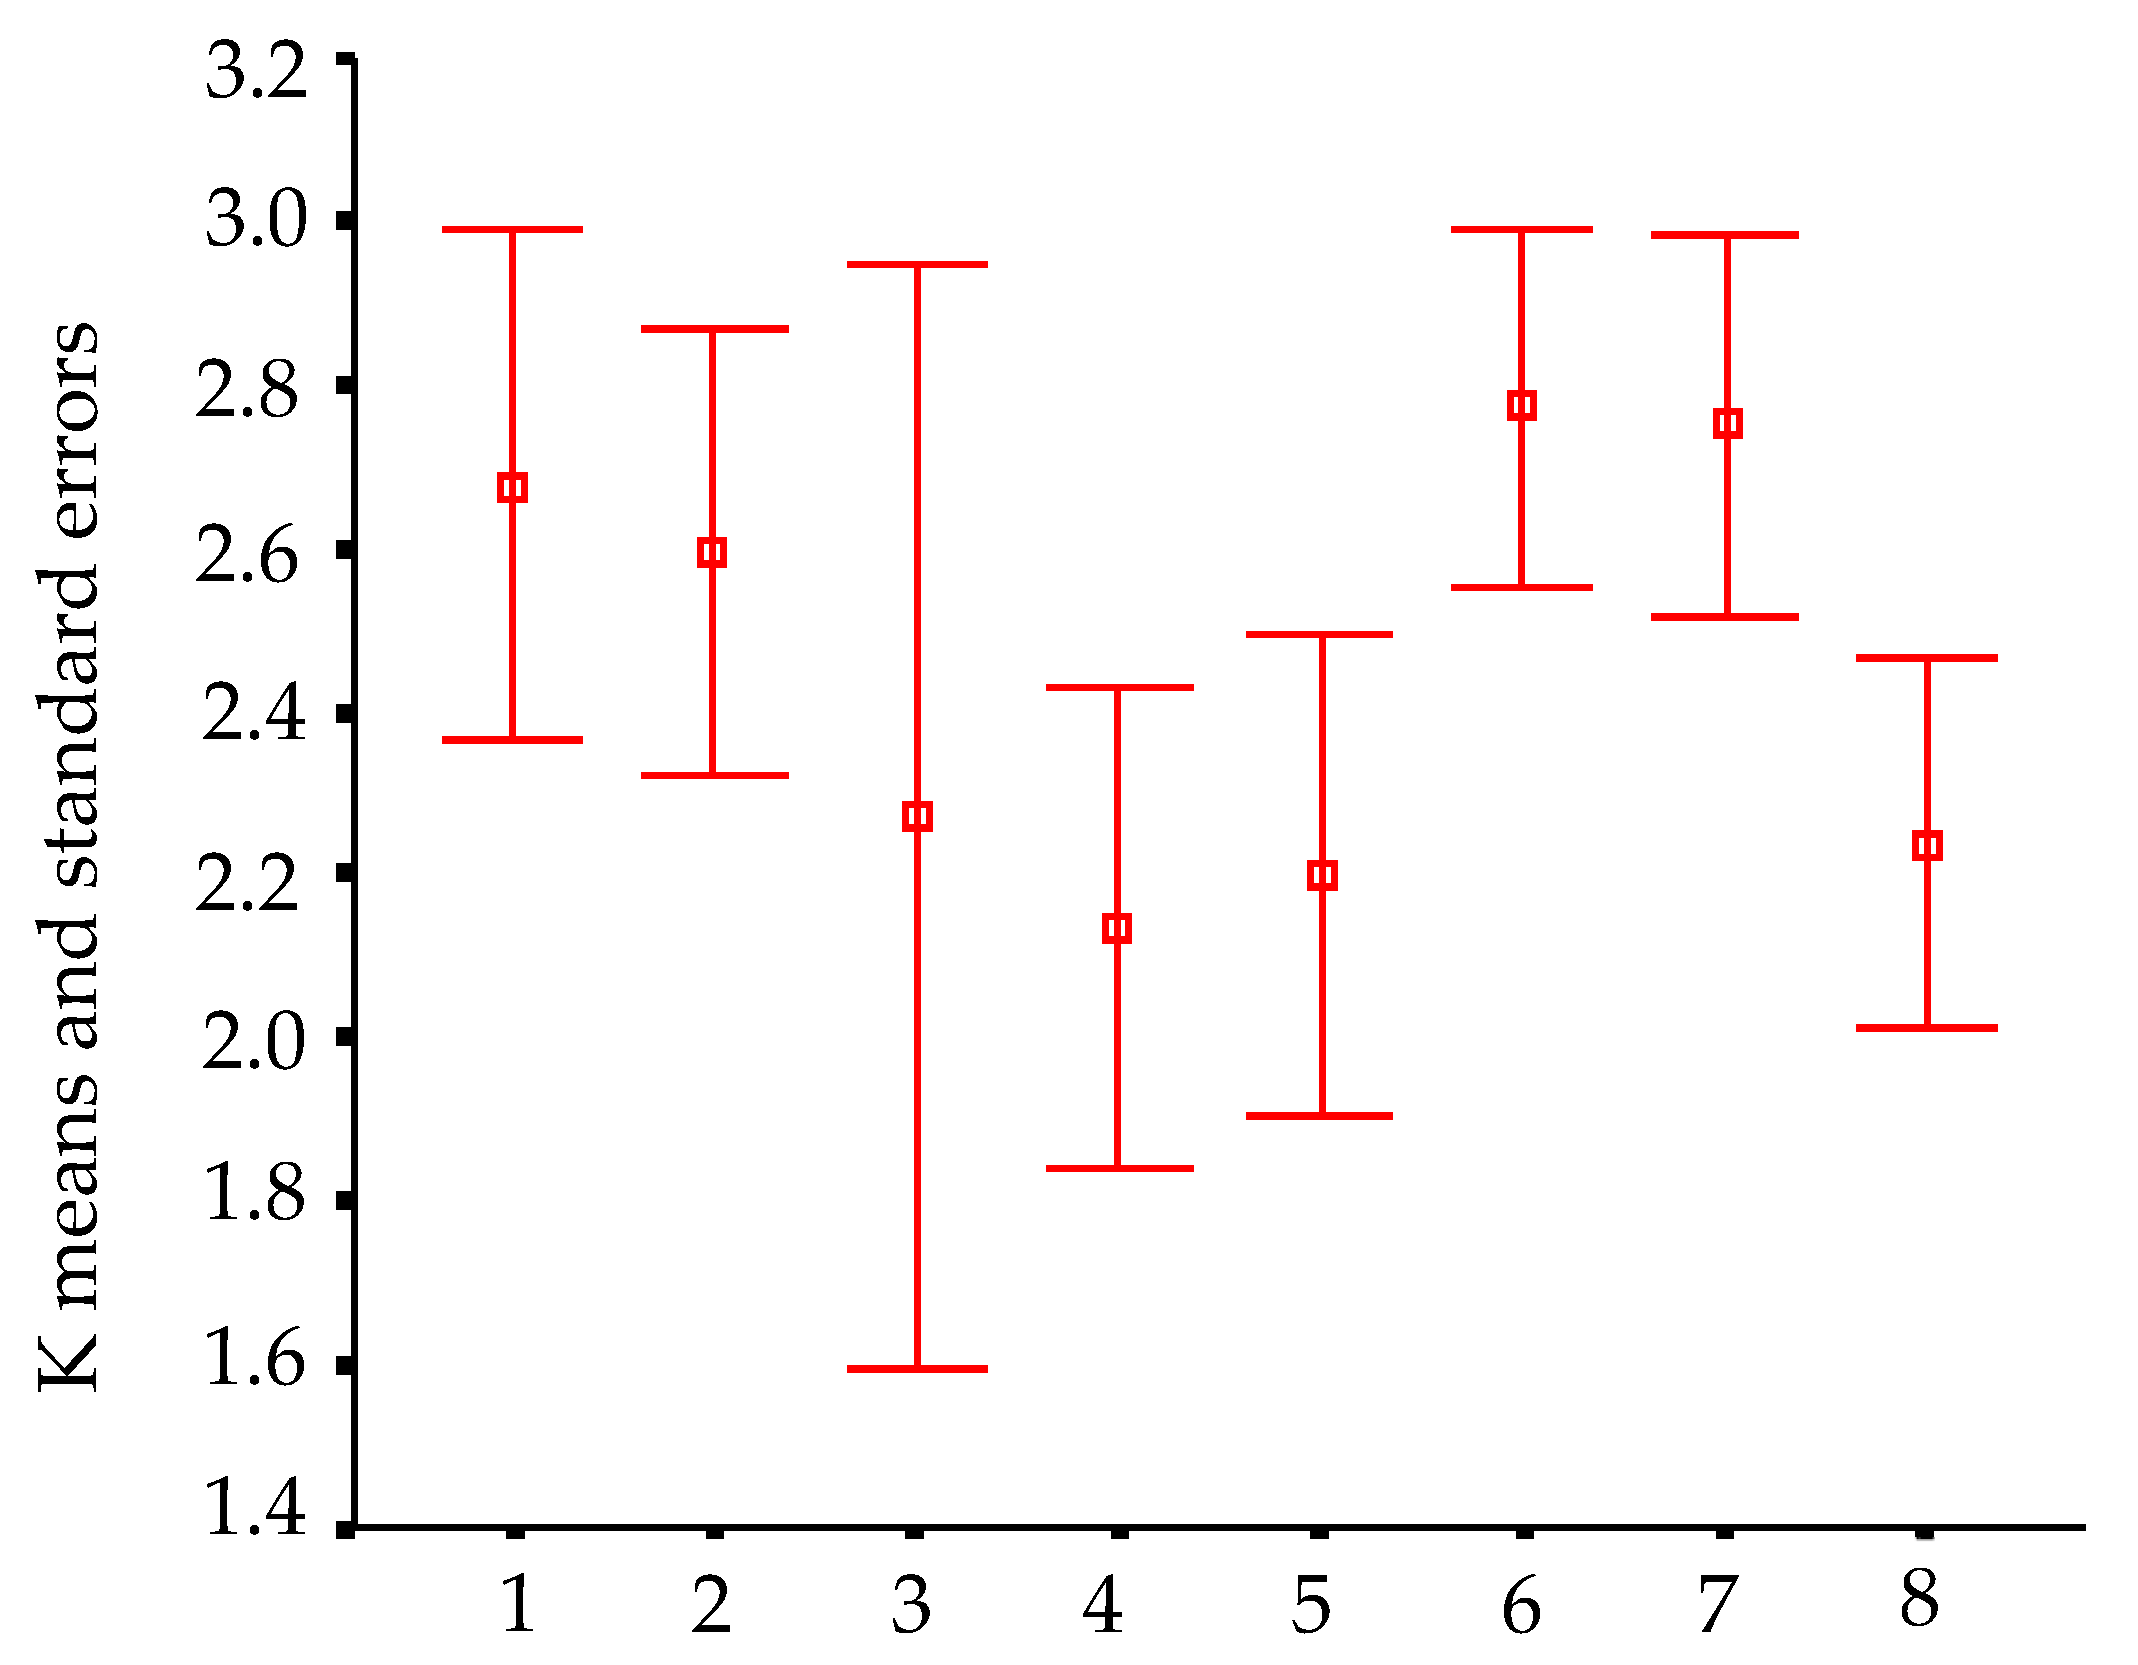
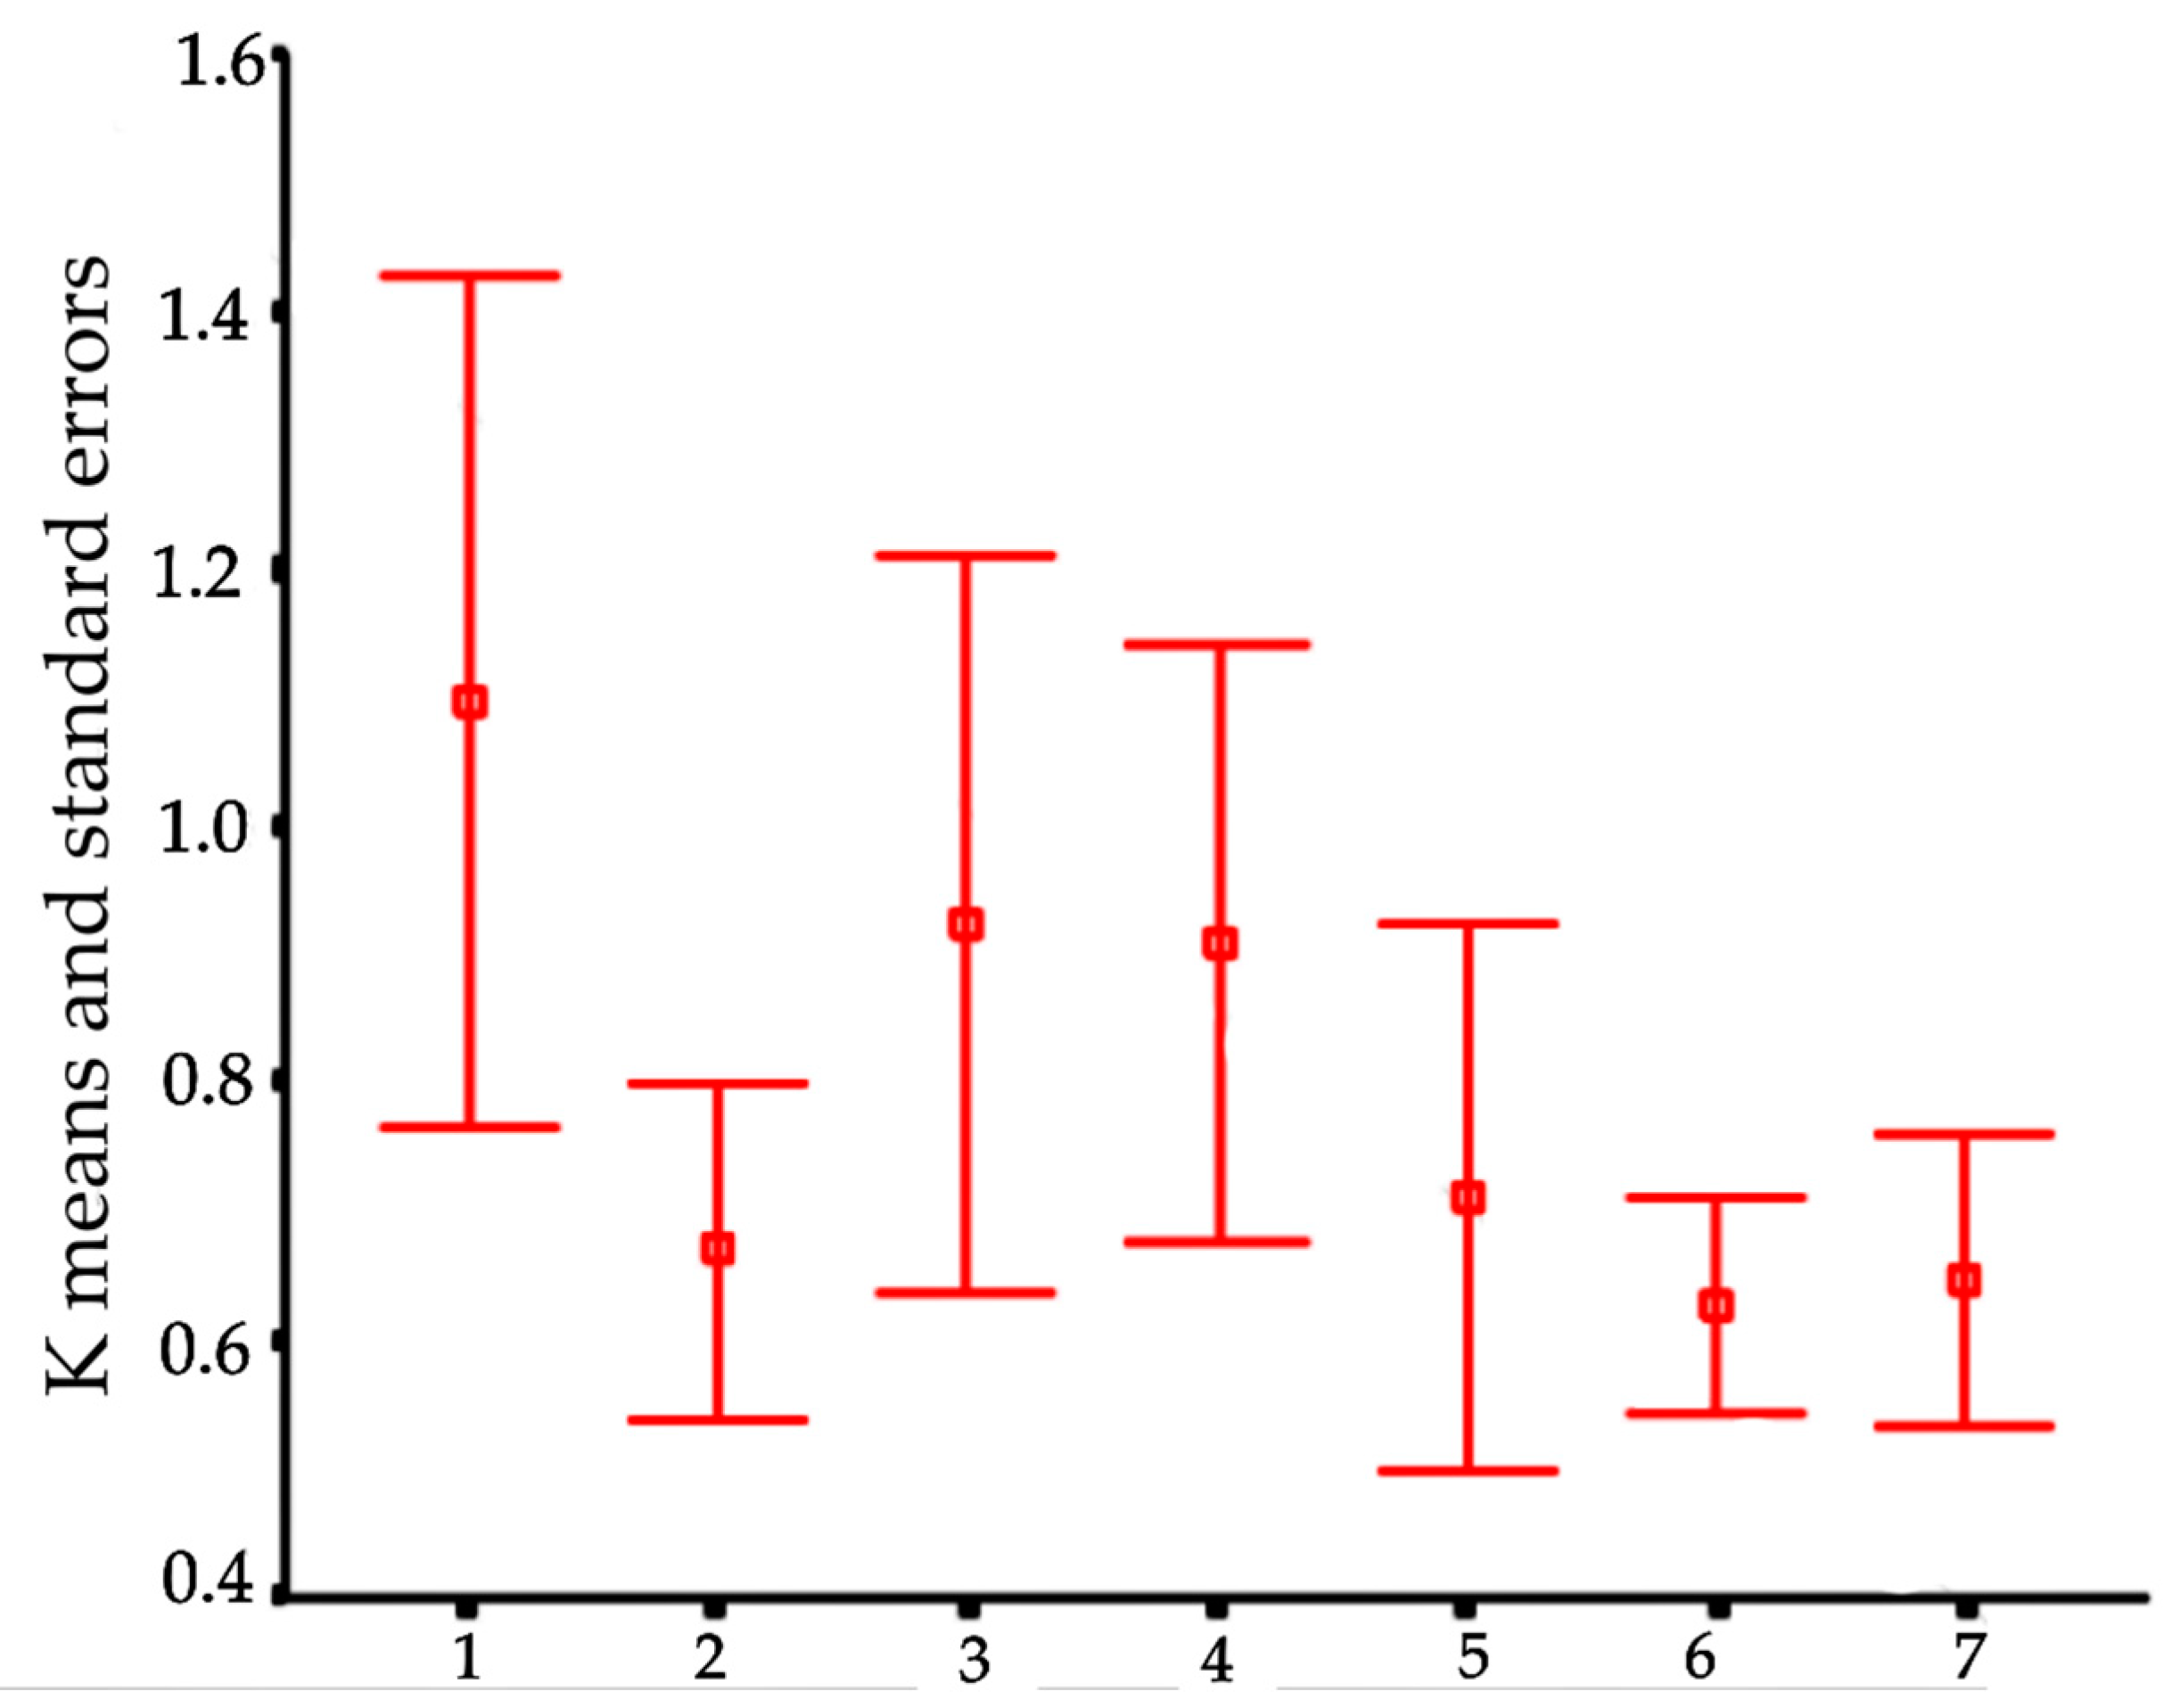
b were compared to 3, indicating isometric growth, and were used for the calculation of the condition factor of Fulton (
K):
K = 100P.SL
−b [
39], considering the data sets for each occasion of collecting.
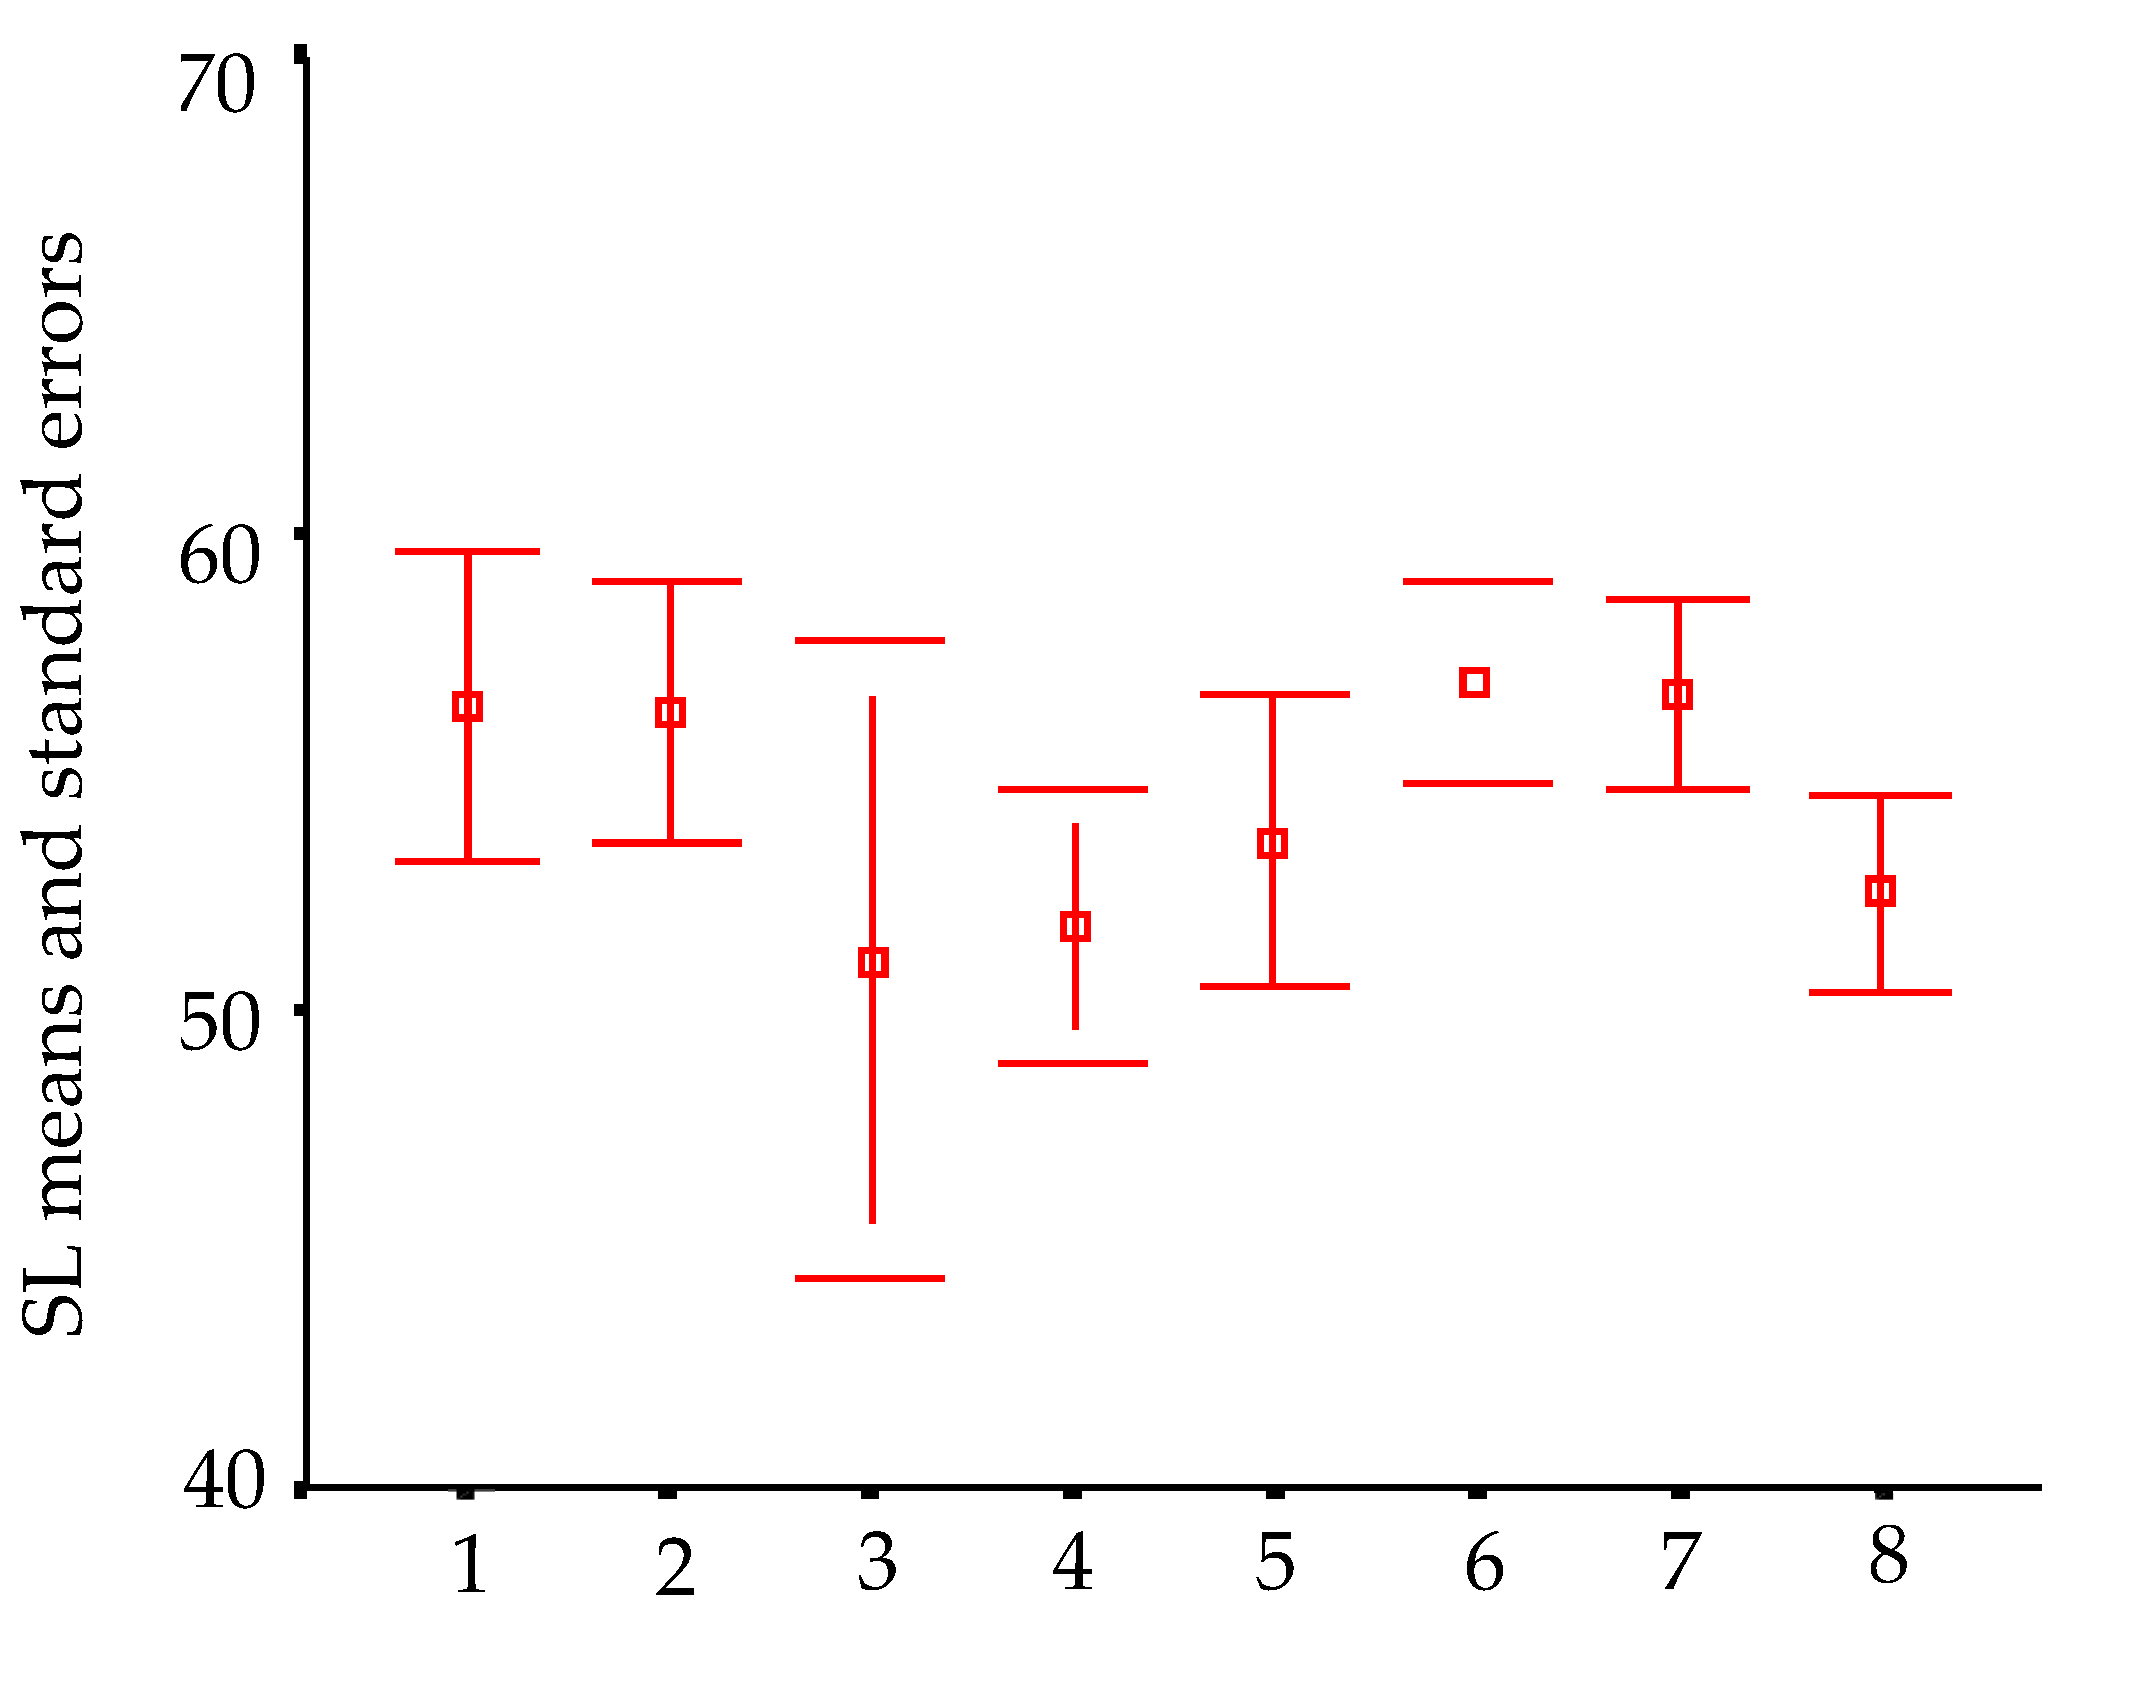
In order to visualize trends in population/fish densities, standard lengths, weights, and condition factor across the two-year study, we created Dice-Leeras diagrams that displayed the means and the standard errors for these variables [
40].
The variables—population/fish densities, standard length, weight, and condition factor—were compared through parametric and non-parametric tests (before tests, the data were tested for homogeneity of variances and normality). For comparisons of two samples, e.g., data from 1999 versus 2000, we used the two-sample
t-test (for parametric data) or the Mann–Whitney test (U), and for three or more groups (treatments), we used the Kruskal–Wallis test (H, for non-parametric group of data). Then, Dunnett’s post-hoc test was carried out to detect significantly different groups [
41]. For these statistical analyses, we used SigmaStat software (version 2.0, 1992–1995, Jandel Corporation, San Jose, CA, USA), with α = 5%.
For I. epikarsticus and I. ramiroi, estimates of abundance and density were based on the counts using the visual census technique (VC).
4. Discussion
High pH, conductivity, and salinity values recorded for all caves from the São Domingos karst area are expected and typical of karstic drainages. Despite fluctuations of cave stream temperature during the study, their amplitudes were lower than those observed in the epigean drainages, according to the environmental stability of a hypogean environment [
42]. The decline in dissolved oxygen values across the three years is probably related to a decrease in annual rainfall. We observed an accentuated decrease in the volume of watercourses of Angélica cave throughout the study. In the case of Angélica, São Mateus, and São Bernardo caves, the drainages where
Ituglanis spp. occurs are isolated from the base level drainages (and principal), reducing the influence of surface drainages.
The low rates of recapture observed for
I. passensis and
I. bambui are probably related to the loss of marks. For
I. bambui, which occurs in an upper vadose tributary of Angélica cave, recapture rates were markedly lower than rates recorded for
I. passensis, which occurs in a base level stream. This difference is related to the fact that the population of
I. bambui probably represents a small sample of a larger population distributed throughout the epikarst, since specimens morphologically similar were recorded in pools about 4 km away from the studied tributary. A population study of troglobitic amphipods in the U.S., which occurs in pools formed by infiltration water and base level rivers, also showed a similar pattern [
43].
The estimated population size for
I. passensis shows that this species has a relatively small population. Population sizes, based on mark-recapture studies as herein, also varied from very small to comparable to relatively small populations of epigean species. The population size of the troglobitic trichomycterid,
Trichomycterus itacarambiensis, from eastern Brazil (5000 m of habitat extension) varied from 1500 to 2000 individuals. The cave catfish
Pimelodella kronei from southeastern Brazil (5000 m of habitat extension) reached 900–1200 adults; the armored catfish
Ancistrus cryptophthalmus from the same region (São Domingos karst area) reached 20,000 individuals in 8000 m of habitat extension at Angélica cave and 1000 individuals at Passa Três cave (2000 m of habitat extension) [
4].
There is very little information about the population size of epigean trichomycterids, and most of that information was based on indirect observations. However, it is possible to see the amplitude of differences in relation to troglobitic populations. Shoals of 40,000 individuals were observed for
T. migrans from Colombia, and more than 7000 individuals of
Trichomycterus areolatus were captured across three years in two streams from Chile [
44]. While small abundances were recorded for
Trichomycterus sp. from southeastern Brazil (with 341 individuals in three sites of a small stream six-time sampled [
45]), and for the benthonic catfish
Pygidianops amphioxus from igarapé of northern Brazil (with 136 individuals in a 1150 m long sampled in 11 occasions [
46]), its distribution is the broadest for the genus, reaching 900 km in a straight line [
47]. One study used the capture-mark-recapture method for
T. brasiliensis from southeastern Brazil, however, the population size estimated by Lincoln–Petersen was 38.5, and the absolute abundance was 148 individuals [
48]. This study was conducted for a short period (two occasions in the same month), thus these discrepant values would be expected.
Densities recorded for the four
Ituglanis species (Passa Três, Angélica, São Mateus, and São Bernardo caves) were always smaller than 0.7 ind/m
2 and, in general, smaller than 0.11 ind/m
2. According to [
3], these values should be considered as medium-to-low. Low densities were recorded for other troglobitic trichomycterids, such as
T. itacarambiensis from Brazil (between 0.15 and 0.20 ind/m
2, mark-recapture method) [
10] and
T. conradi from Venezuela (0.01 ind/m
2, visual census method) [
49]. Medium to high densities were recorded for the armored catfish
Ancistrus cryptophthalmus (Loricariidae) from the São Domingos karst area: 0.63 and 1.0 ind/m
2 for Passa Três and Angélica caves [
12] through the capture-mark-recapture method and for
Aspidoras mephisto (Callichthyidae), 5–6 ind/m
2 [
50] through the visual census method. As expected, higher densities were recorded for epigean trichomycterids: 0.7 ind/m
2 for
Trichomycterus brasiliensis from streams of southeastern Brazil [
48]; 3–12 ind/m
2 and 18–25 ind/m
2 for
Trichogenes longipinnis in two coastal rainforest streams from southeastern Brazil [
51].
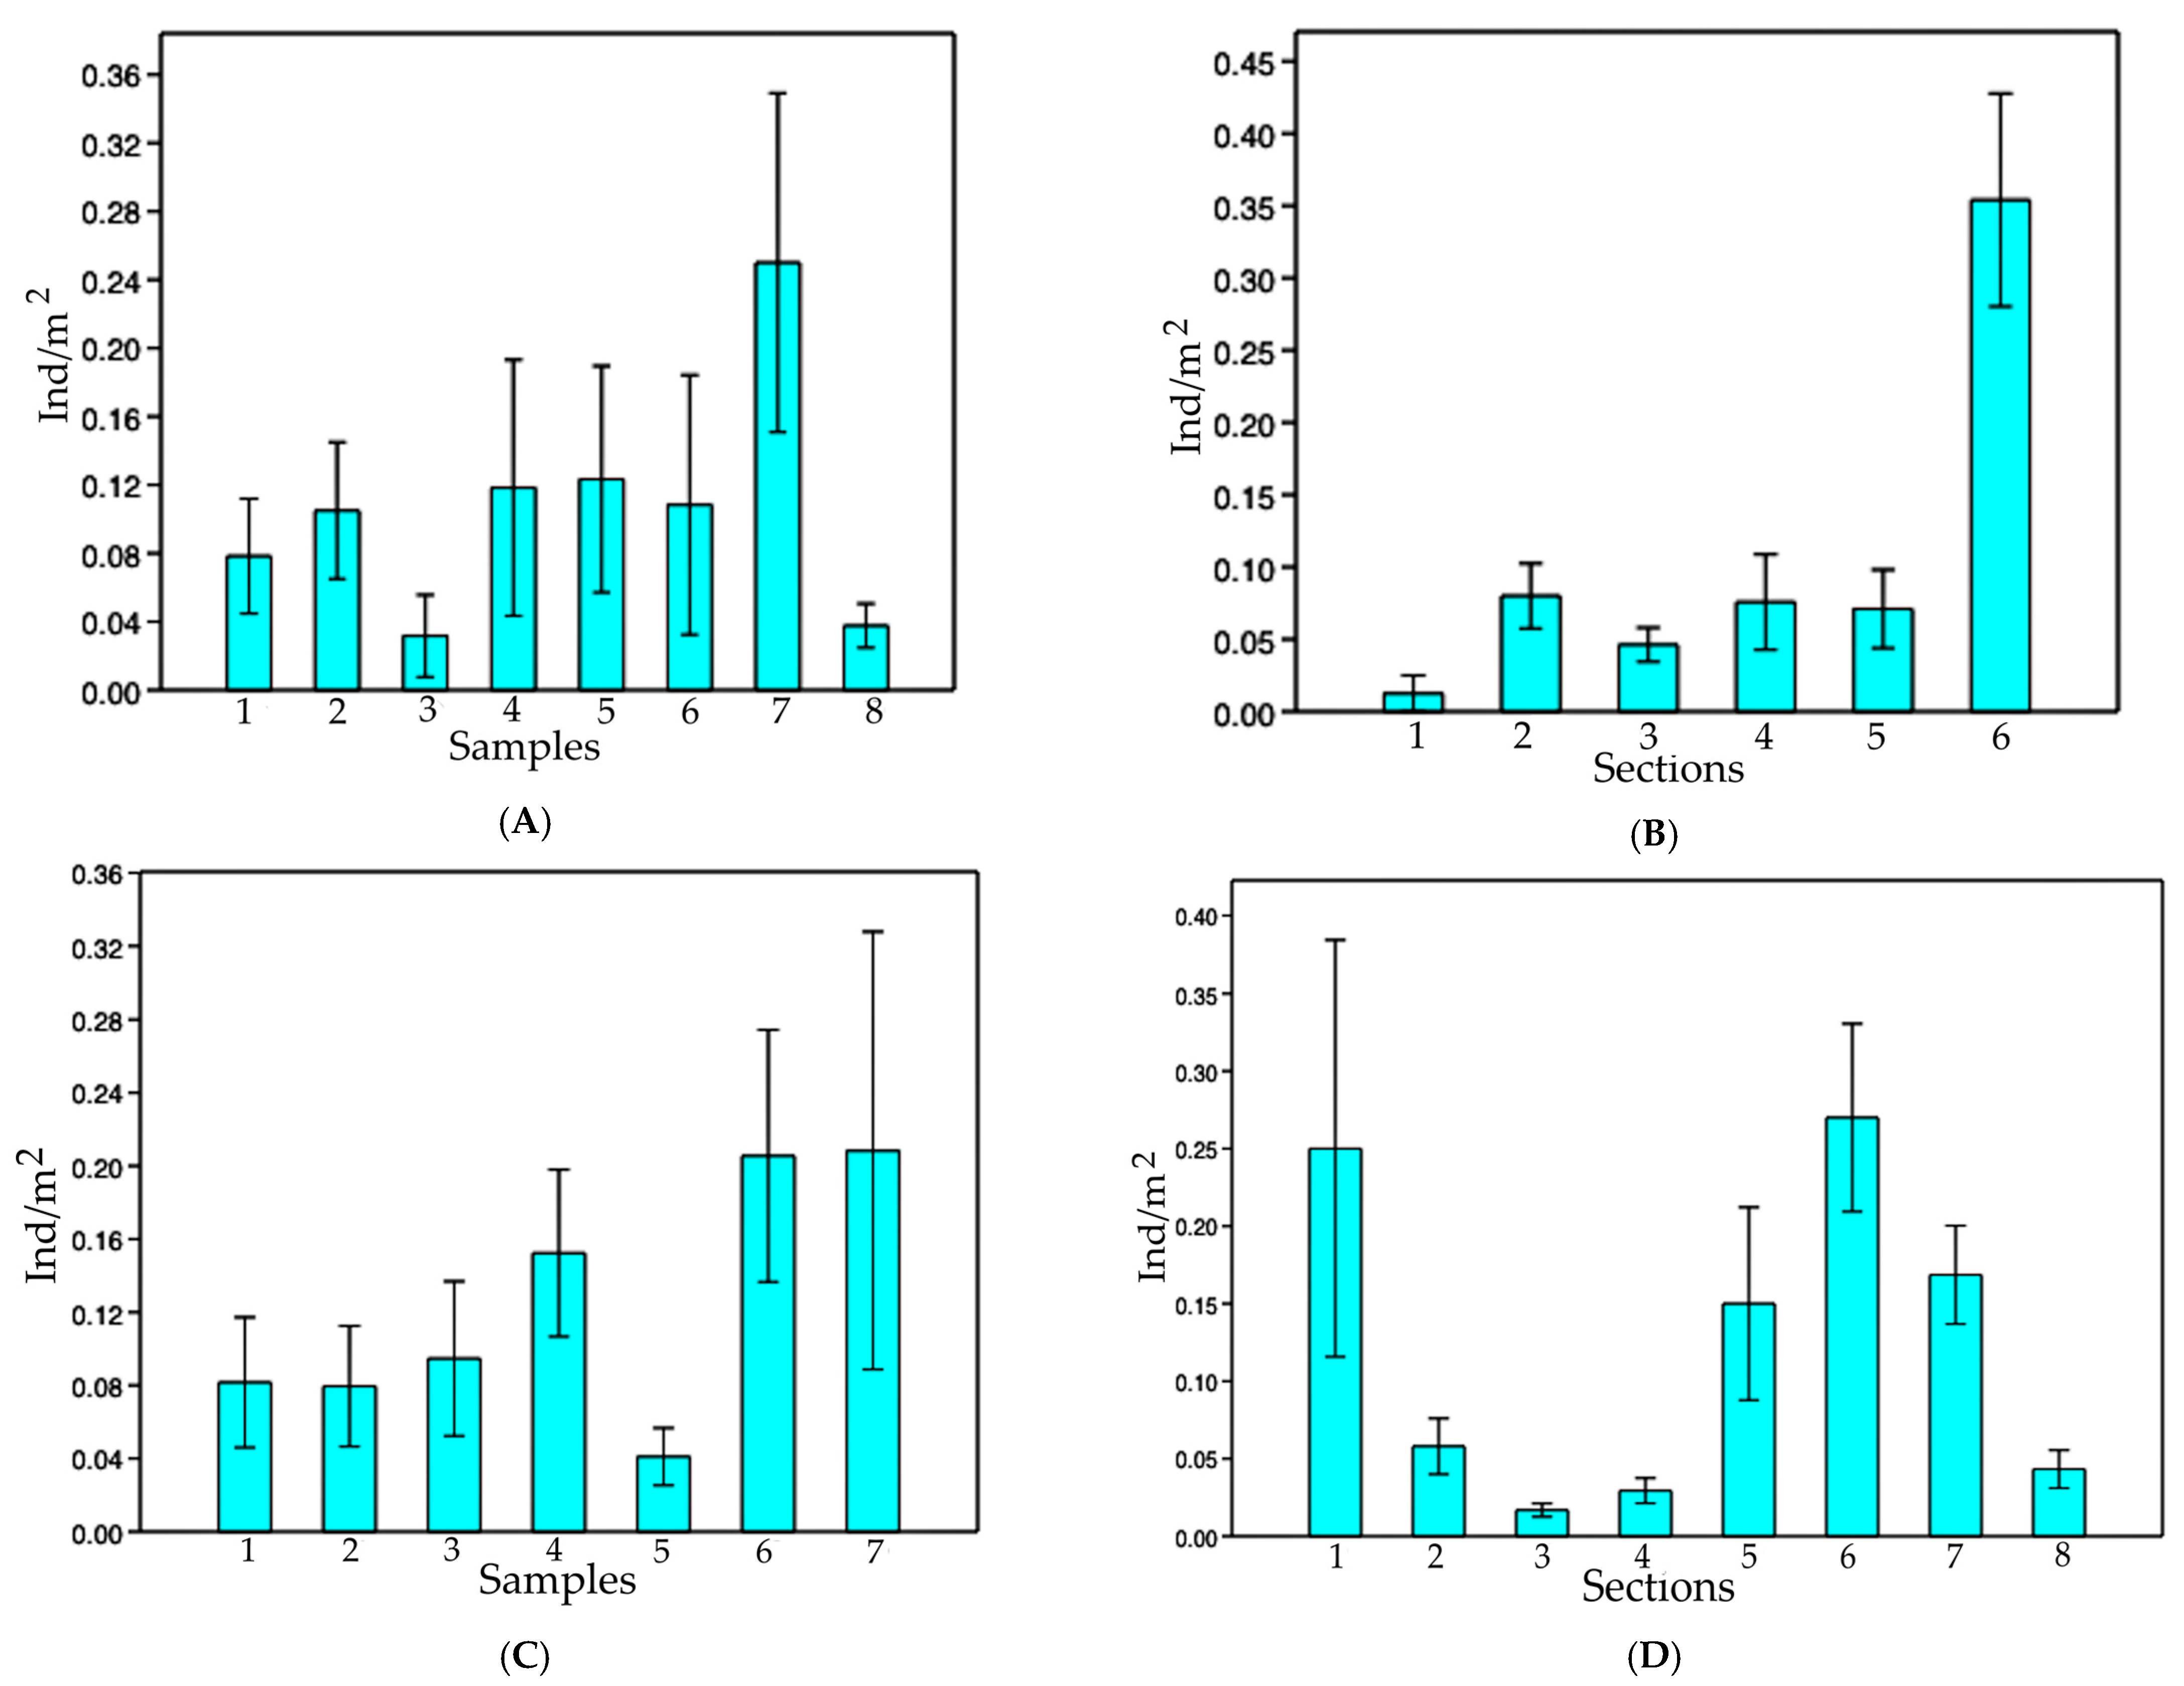
The increase in population densities of
I. passensis according to the distance to the epigean environment (sinkhole of Passa Três cave) may be related to the greater availability of organic matter (and substrate for aquatic invertebrates, food items of
I. passensis) close to the sump or even due to the drastic floods that can carry the fish downstream. The higher abundance of
I. passensis downstream from the sump corroborated this idea. Trajano (1997) also observed higher densities for
T. itacarambiensis downstream in Olhos D’água cave, where the availability of food is apparently higher; in this case, the downstream stretches are closer to the epigean environment. Another factor that limits the distribution of
I. passensis upstream (in sections 1 to 7) is the waterfall between sections 7 and 8, reaching 6 m high in the dry season when the water level is lower (
Figure 4B).
For I. bambui from Angélica cave, we noted an increase in densities toward the deepest part of the cave; however, this increase is upstream from the drainage and does not seem to be related to the amount of food. There was a very low concentration of organic matter upstream. The higher number of rocky blocks observed in these places can offer shelters for catfish, although we did not observe any regular predator of I. bambui in the vadose tributary.
Small fluctuations observed in the population size and densities for both
I. passensis and
I. bambui throughout the dry season were also observed for the armored catfish from Passa Três and Angélica caves (
Ancistrus cryptophthalmus) [
12] but only in the year 2000. This was probably related to higher precipitation rates and consequently higher food input to caves.
Due to the quite different environmental conditions in which hypogean and epigean populations live, differences in the use of space, including individual movements, are expected. The low rates of recaptures recorded for
I. passensis and
I. bambui did not allow robust analysis of the movements, however, we can make some inferences.
Ituglanis passensis and
I. bambui showed movements in an extension of 80 and 60 m, respectively. Smaller fish tend to have limited movements [
52], which would explain the limited movements observed for
I. bambui. Similar results were observed for
Trichomycterus itacarambiensis, who remained in an area of about 100 m along the river [
10]; this species is under a marked food restriction in dry seasons. The absence of seasons with marked food restriction in Passa Três cave explains the existence of more limited movements of
I. passensis compared to
T. itacarambiensis. The heptapterid
Pimelodella kronei is a mid-sized catfish, with SL reaching 150 mm (significantly greater than trichomycterids studied herein) and fewer and shorter movements than
T. itacarambiensis,
I. passensis, and
I. bambui [
9], suggesting that seasonality can be one of the main factors influencing home ranges. There are few studies about movements of epigean trichomycterids. A massive migration of juvenile
Trichomycterus barbouri catfishes on floodplains from Bolívia was recorded and the authors considered that each individual could migrate upstream more than 300 km [
53]. The reason for this migration seems unclear, and the authors suggest that sites more upstream would be more appropriate for survivorship and development to reach sexual maturity.
The slow growth rates observed for
I. passensis, 0.89 mm/month on average, and
I. bambui, 0.39 and 1.58 mm/month (for two recaptures), are higher than those observed for the troglobitic catfish
Trichomycetrus itacarambiensis, 0.06 mm/month [
10], and for the armored troglobitic catfish
Ancistrus cryptophthalmus (0.35 to 0.7 mm/month on average) [
12], and are close to those observed for the troglobitic catfish
Pimelodella kronei, 1.0 mm/month on average [
9]. Compared to the epigean trichomycterid catfish
Trichomycterus chiltoni and
Bullockia maldonadoi, which have high rates of growth [
44], the rates registered for
Ituglanis spp. feature low growth, which would imply high longevity. Laboratory data for
I. bambui and
I. passensis reinforces this hypothesis since two individuals of these species survived for 20 years in captivity (from May 1999 to December 2019) (M.E. Bichuette, pers. obs.). Although we did not quantify the food availability for
Ituglanis cave catfish, it is quite clear that it is much lower than in epigean habitats. This explains the low growth rates and the high longevity expected for
I. passensis and I. bambui, a precocial lifestyle.
Monthly distributions of frequencies of weight and condition factor suggest that, for
I. passensis, there was no direct relationship with seasonality. However, those individuals that were located downstream from the sump were thinner than those living upstream. This fact reinforces the idea that the sump blocks organic matter. For
I. bambui, we observed a decline in condition factor values during the two-year dry seasons. In contrast to the situation observed in Passa Três cave, food was scarcer in Angélica cave, with apparently decreased availability by the end of the dry season. This low condition factor across the study period indicates a regime of food restriction intensified during the dry season. Similar results were reported for the troglobitic catfishes
Trichomycterus itacarambiensis [
10] and
Pimelodella spelaea [
35] and for the armored troglobitic catfish
Ancistrus cryptophthalmus [
12].


