
Assessing the Ecological Need for Prescribed Fire in Michigan Using GIS-Based Multicriteria Decision Analysis: Igniting Fire Gaps


Abstract
:1. Introduction
1.1. Fire Ecology, Fire Suppression, and the Need for Prescribed Fire
1.2. Necessity of Assessing Fire Needs
1.3. Landscape Factors
1.4. Stand-Scale Factors
1.5. Species-Level Factors
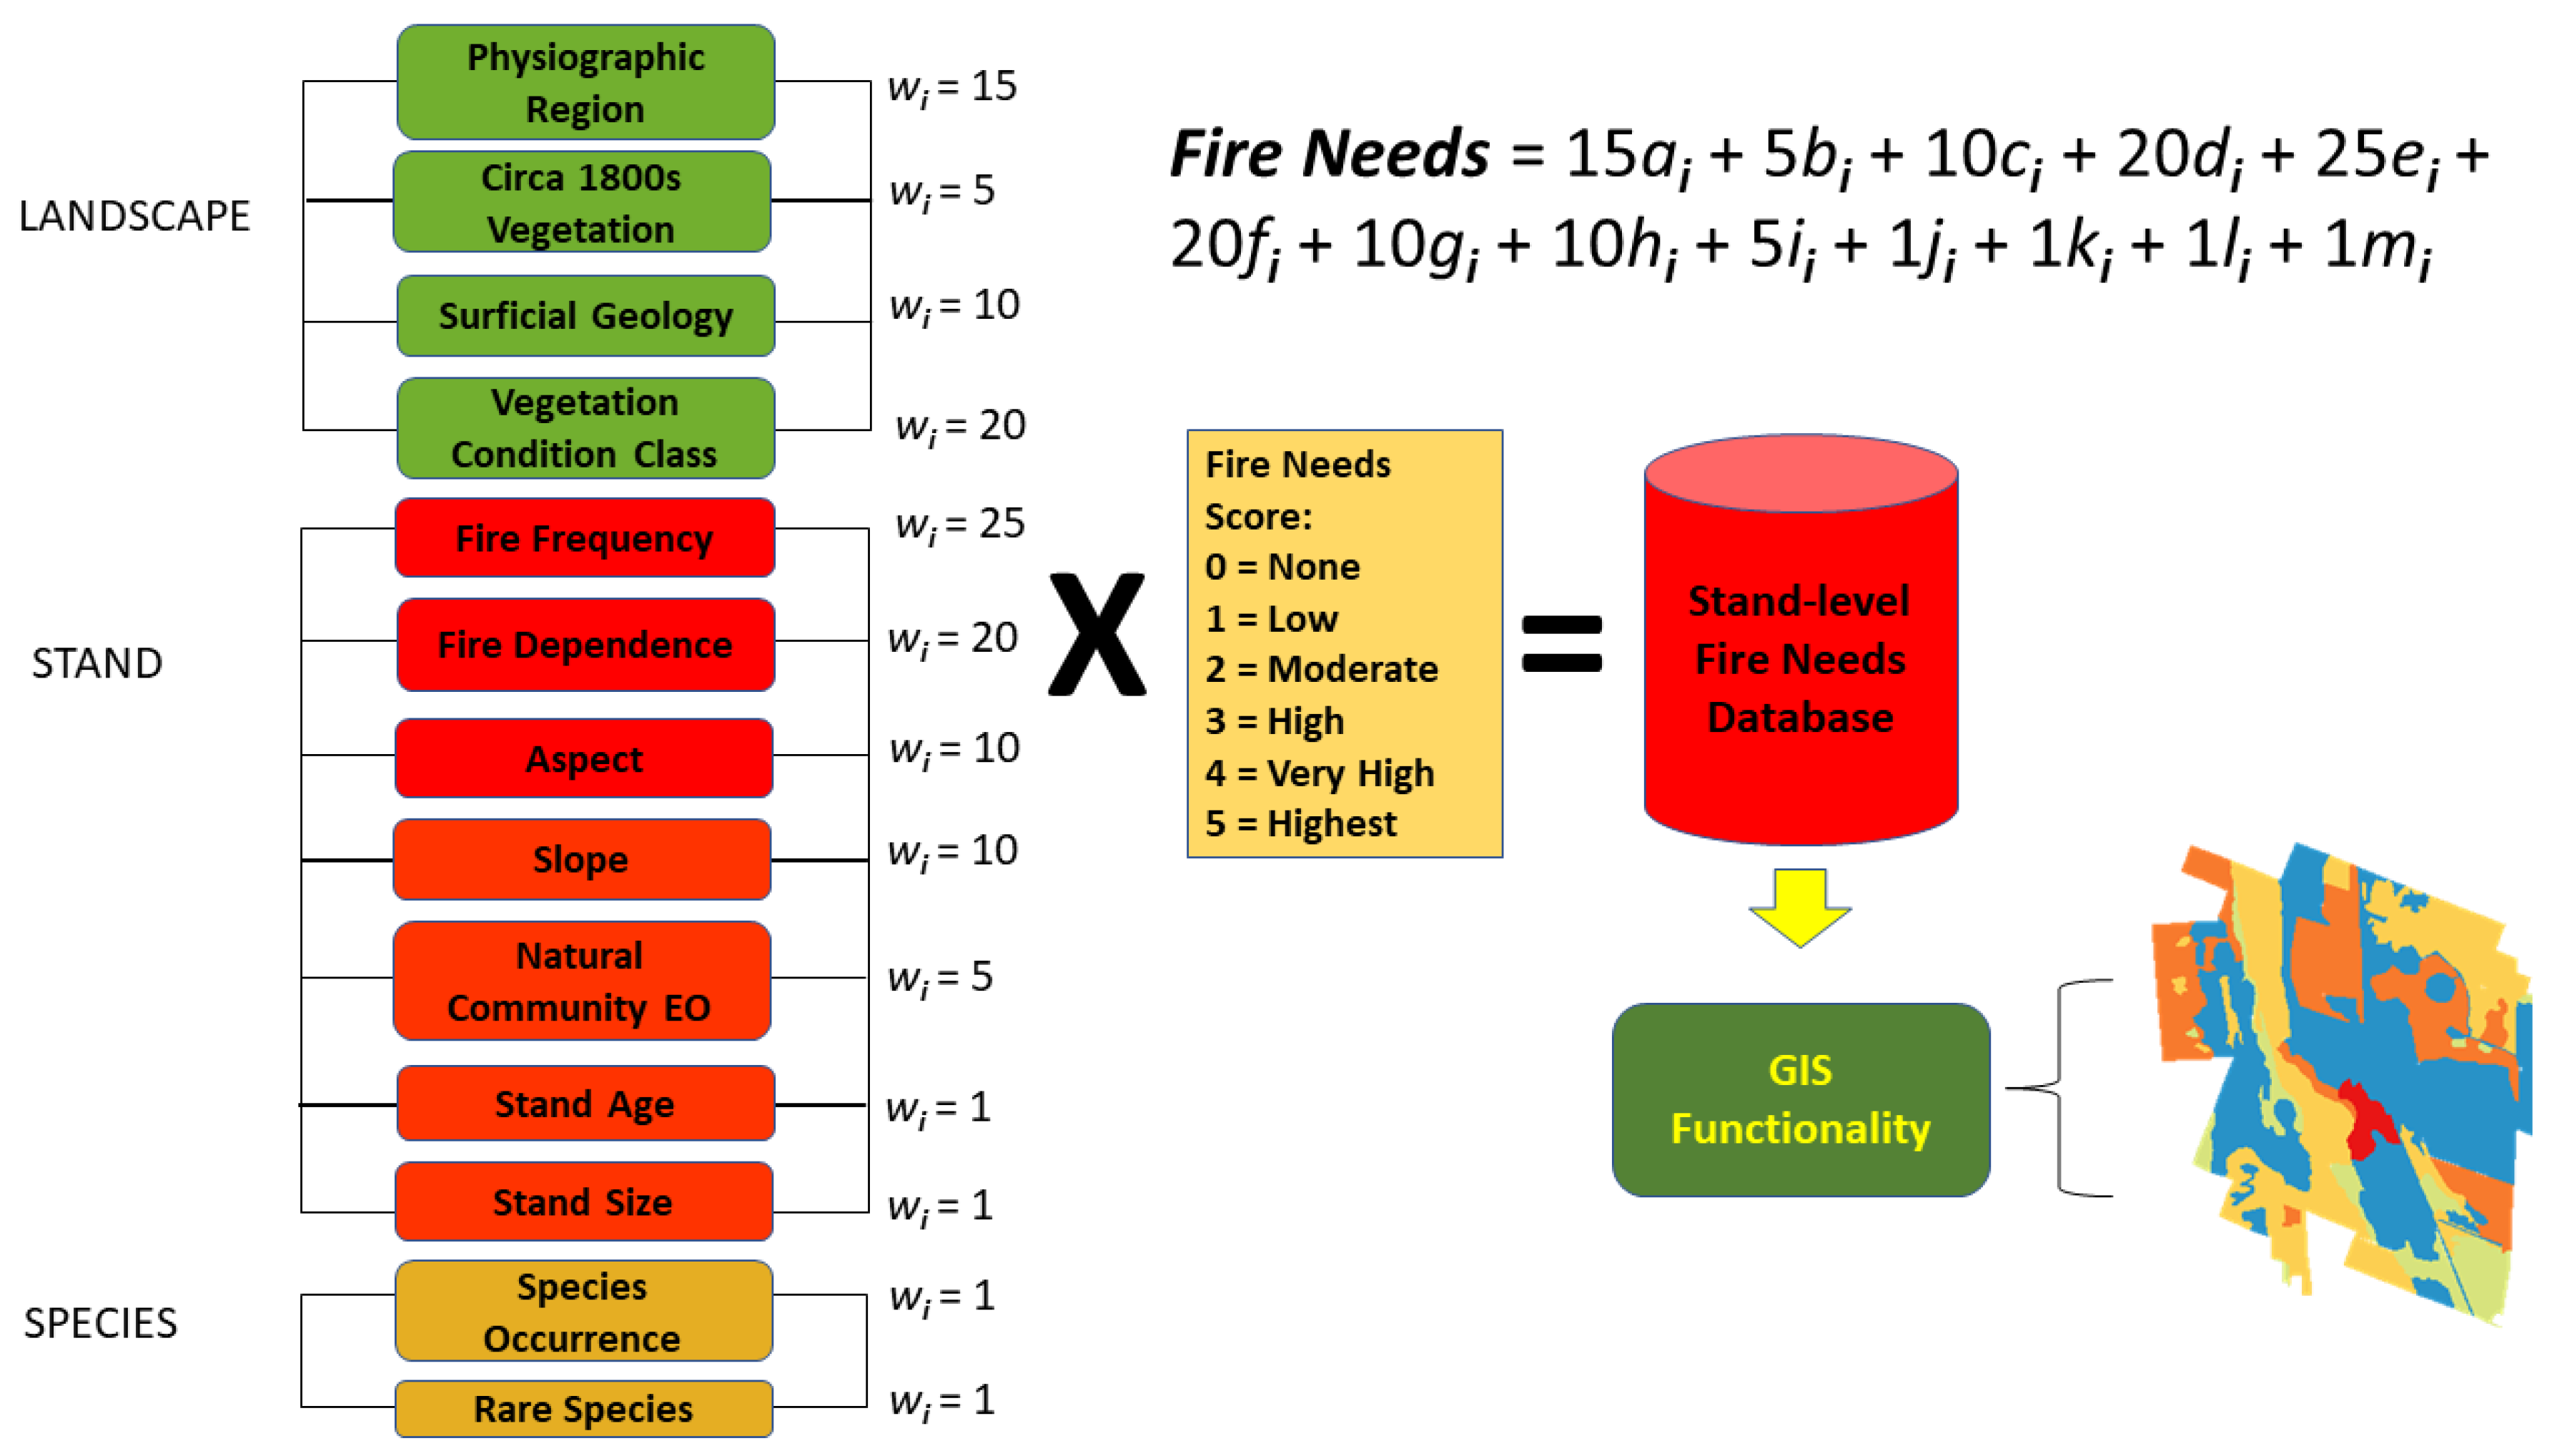
1.6. General Introduction of the Model
2. Methods
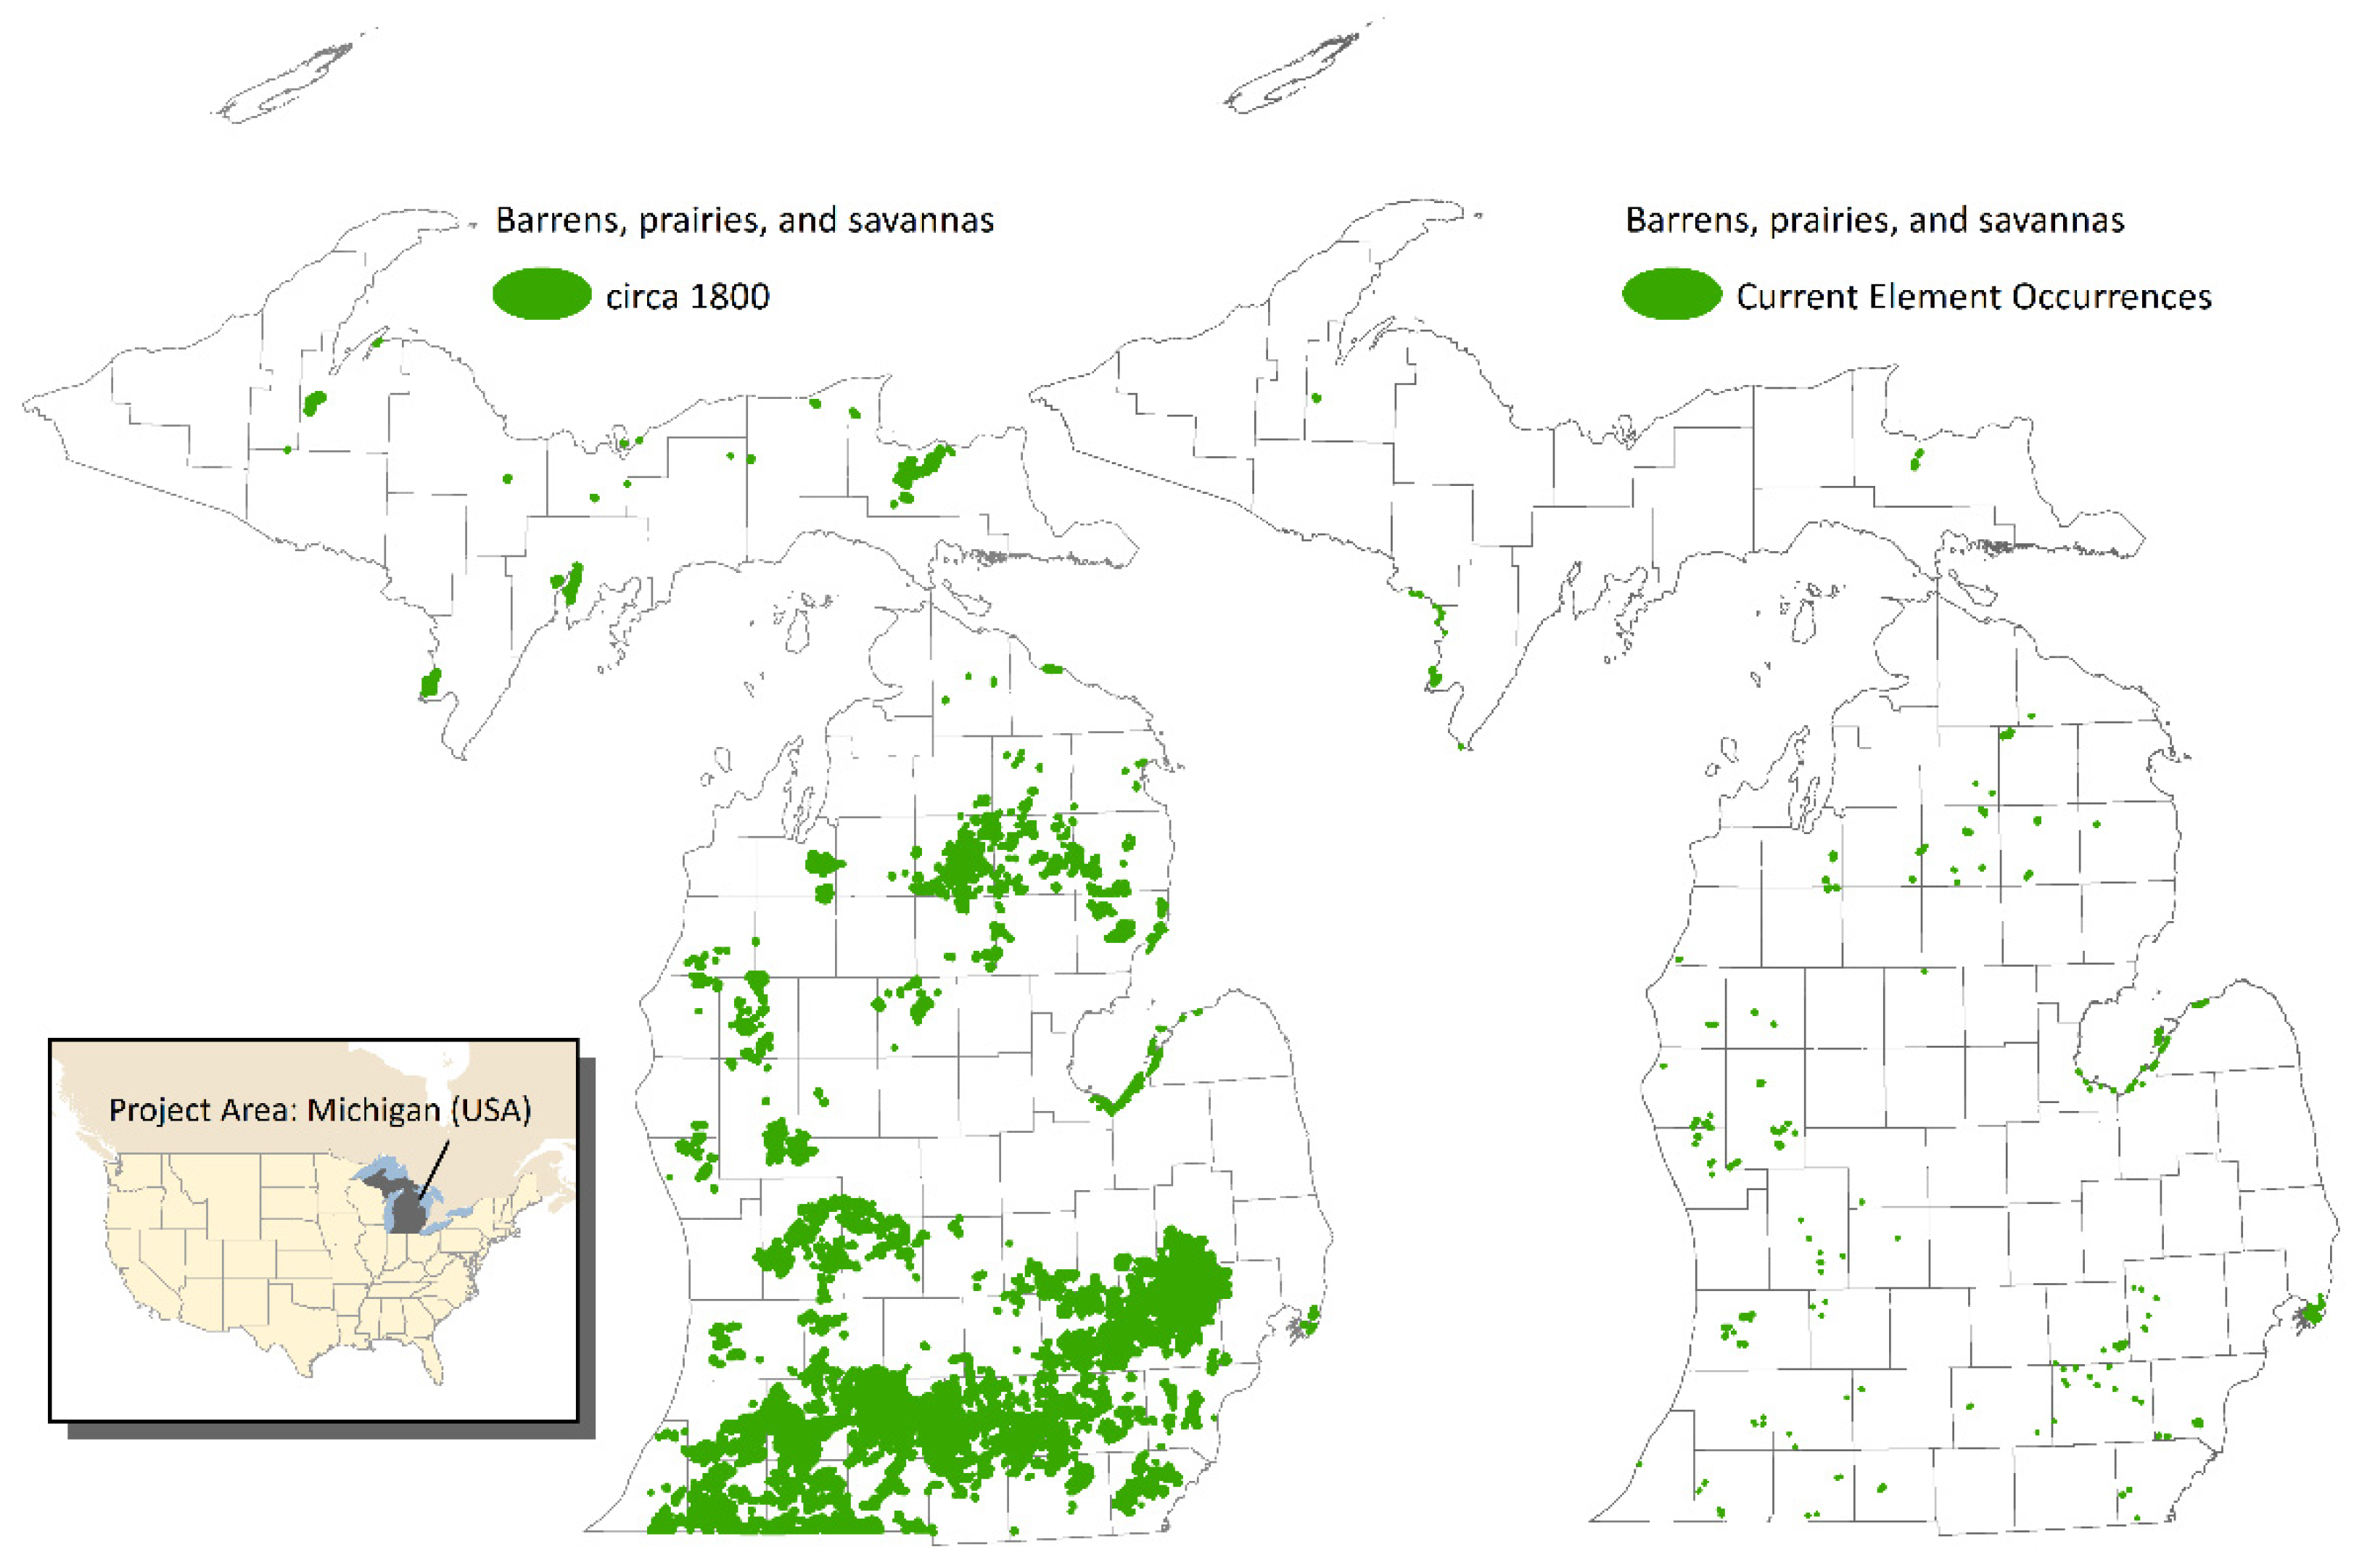
2.1. Study Area
2.2. Michigan Forest Inventory Database and Natural Community Crosswalk
2.3. Variable Selection and Data Preparation
2.3.1. Landscape
2.3.2. Stand
2.3.3. Species
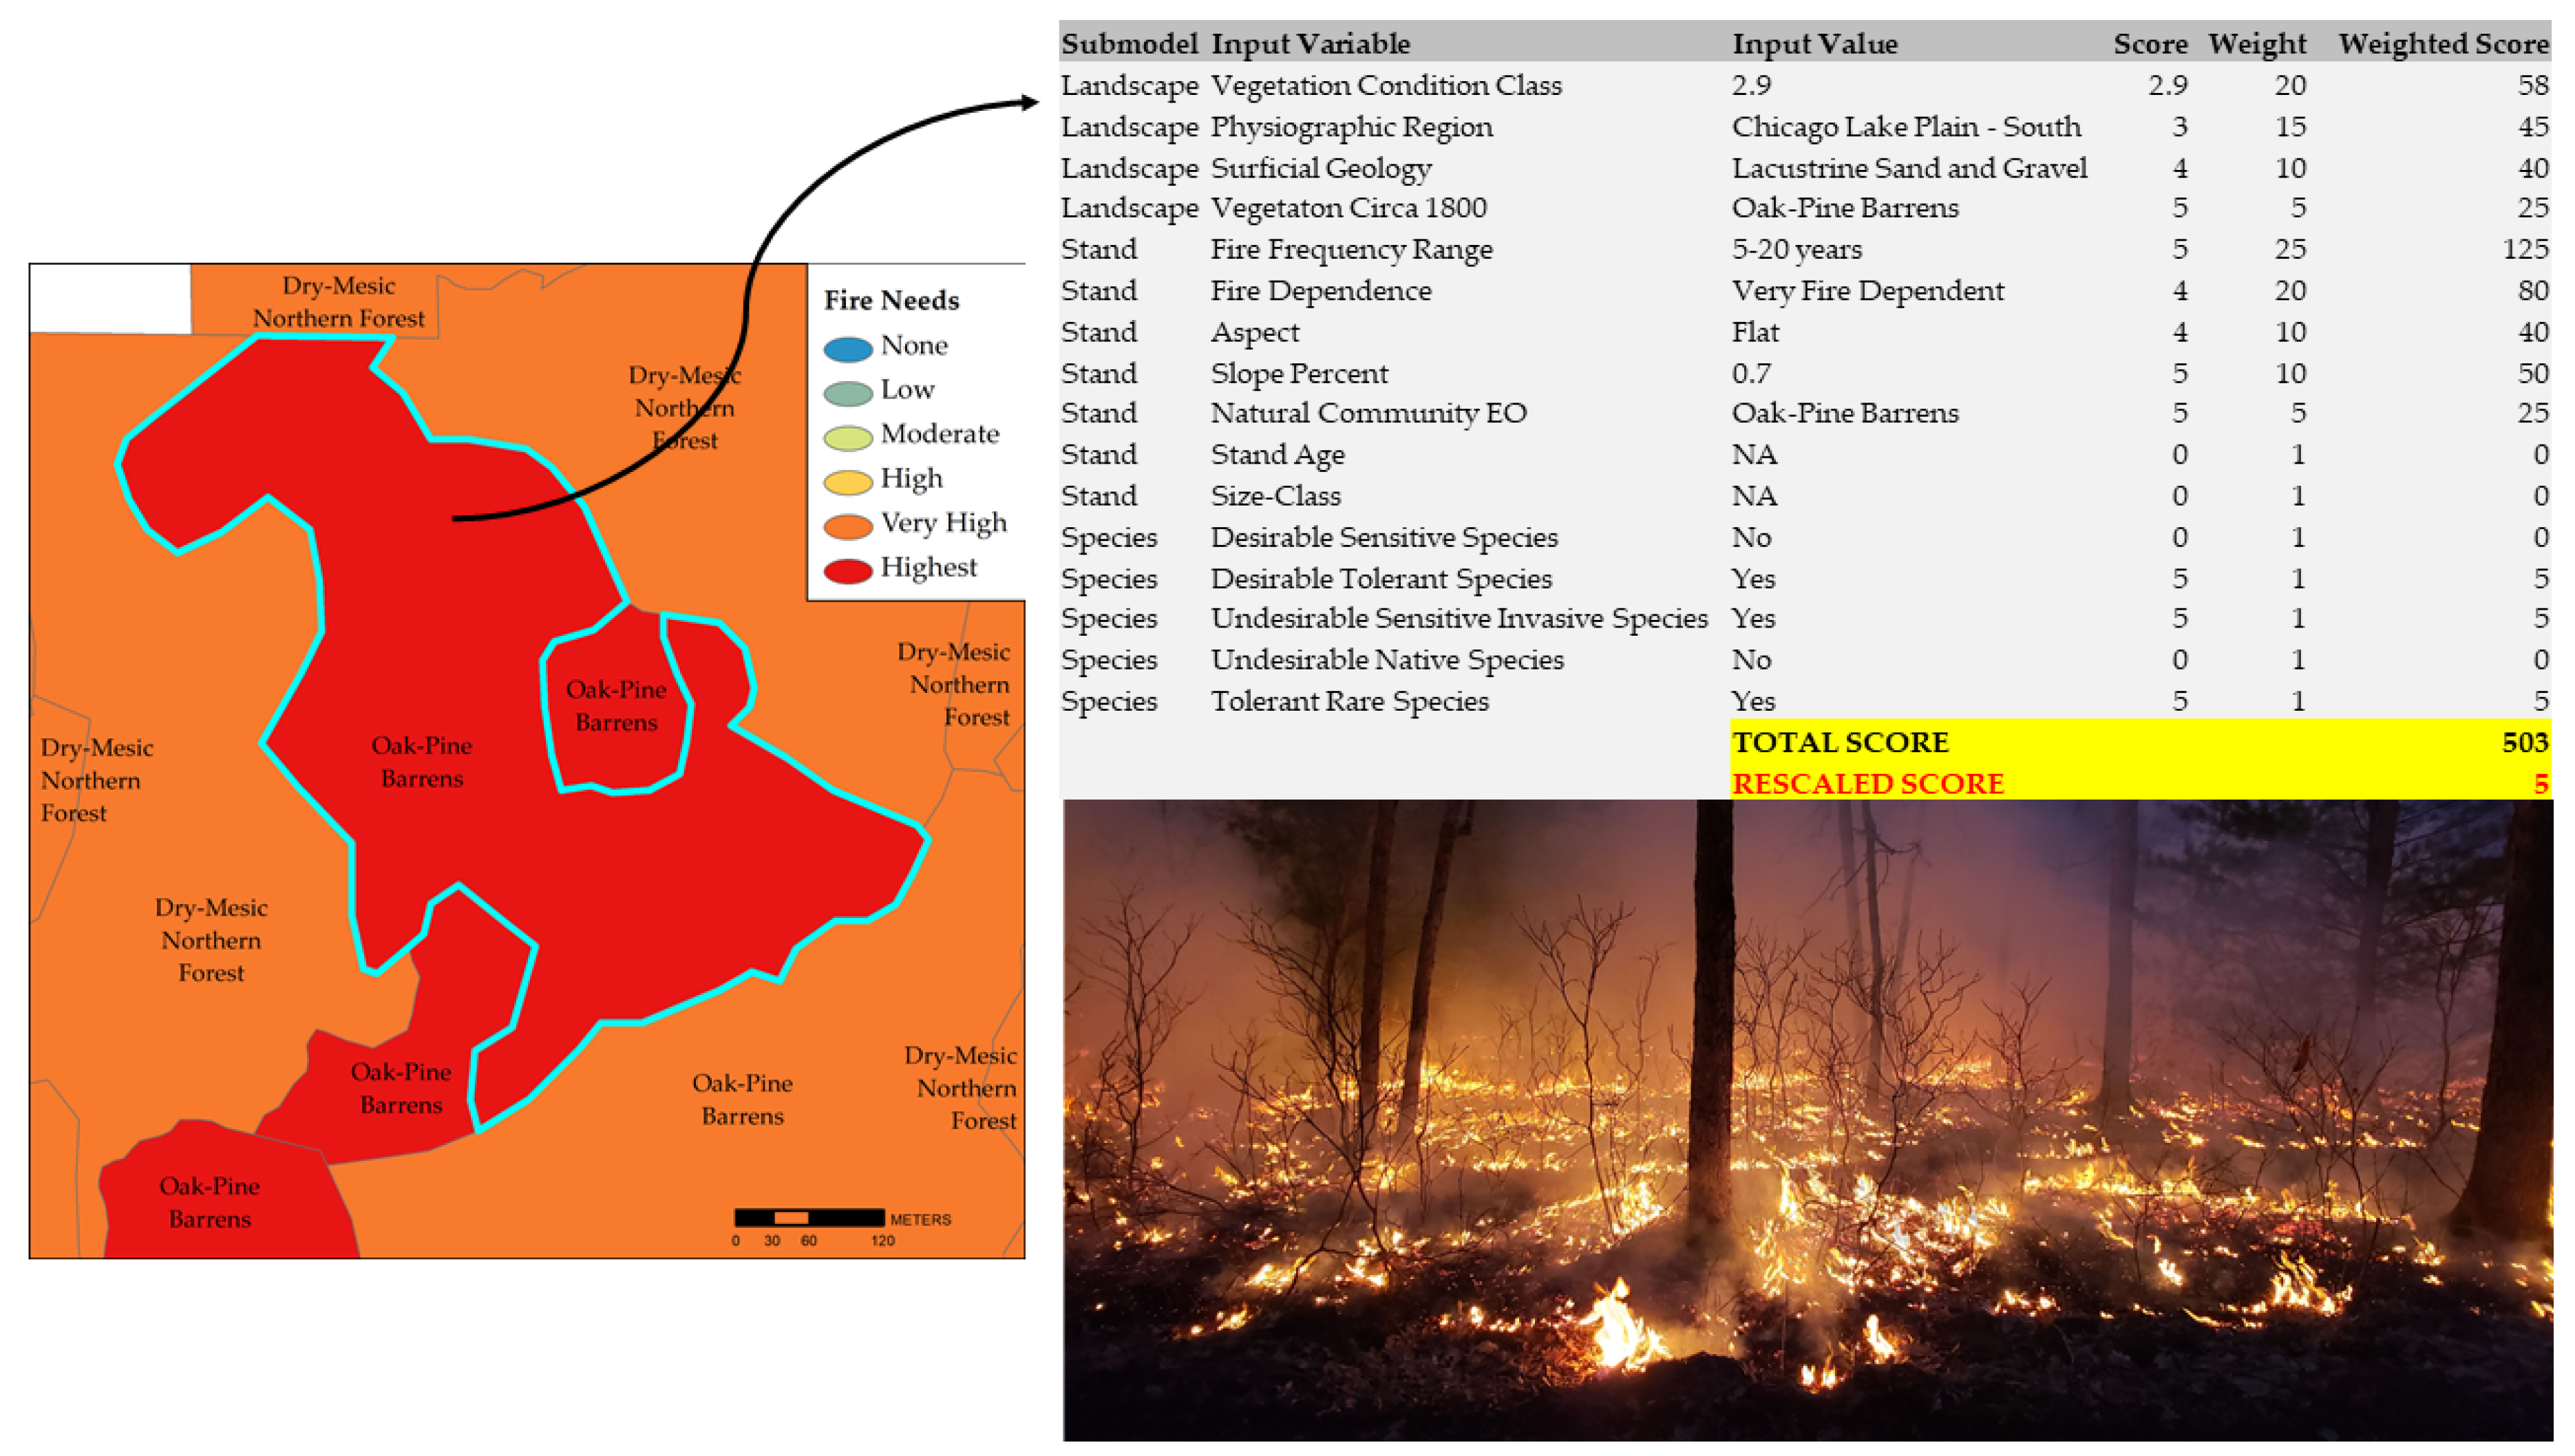
2.4. Variable Scoring
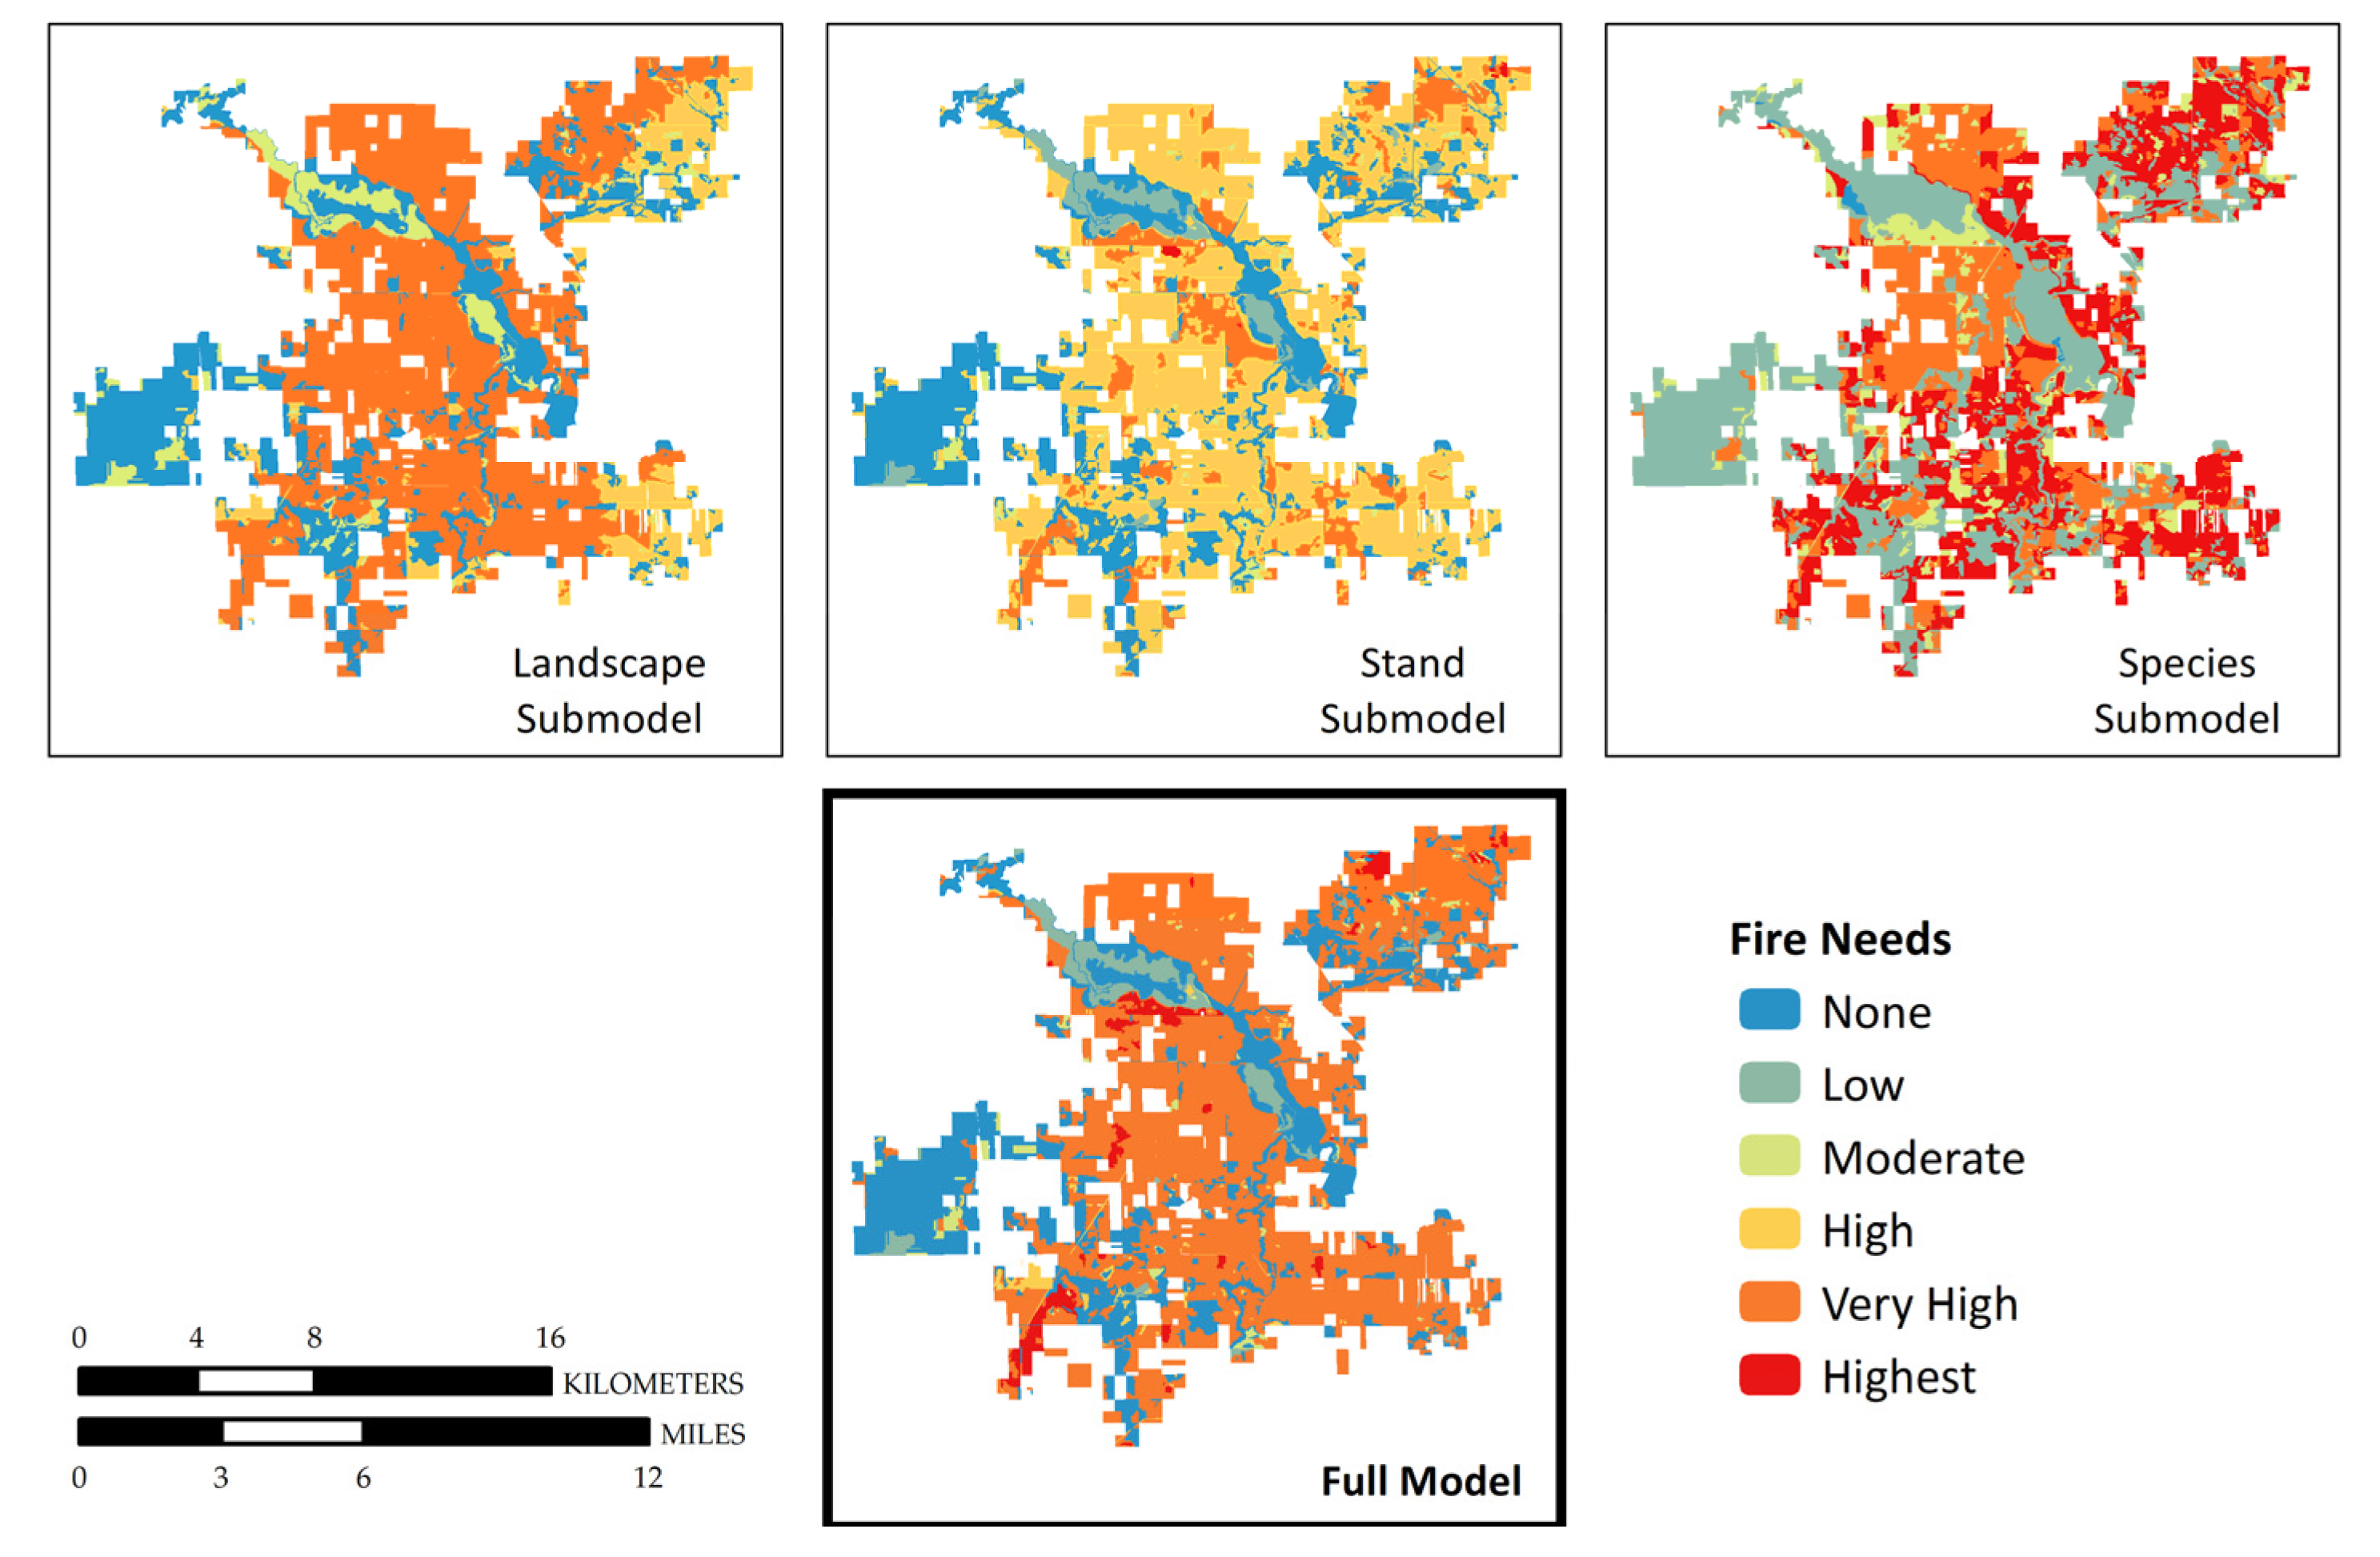
2.5. GIS-Based Multicriteria Decision Analysis
2.6. Incorporating Complexity
2.7. Quality Control
2.8. Summary of Prescribed Fire Application on State Lands in Michigan
3. Results
3.1. Statewide
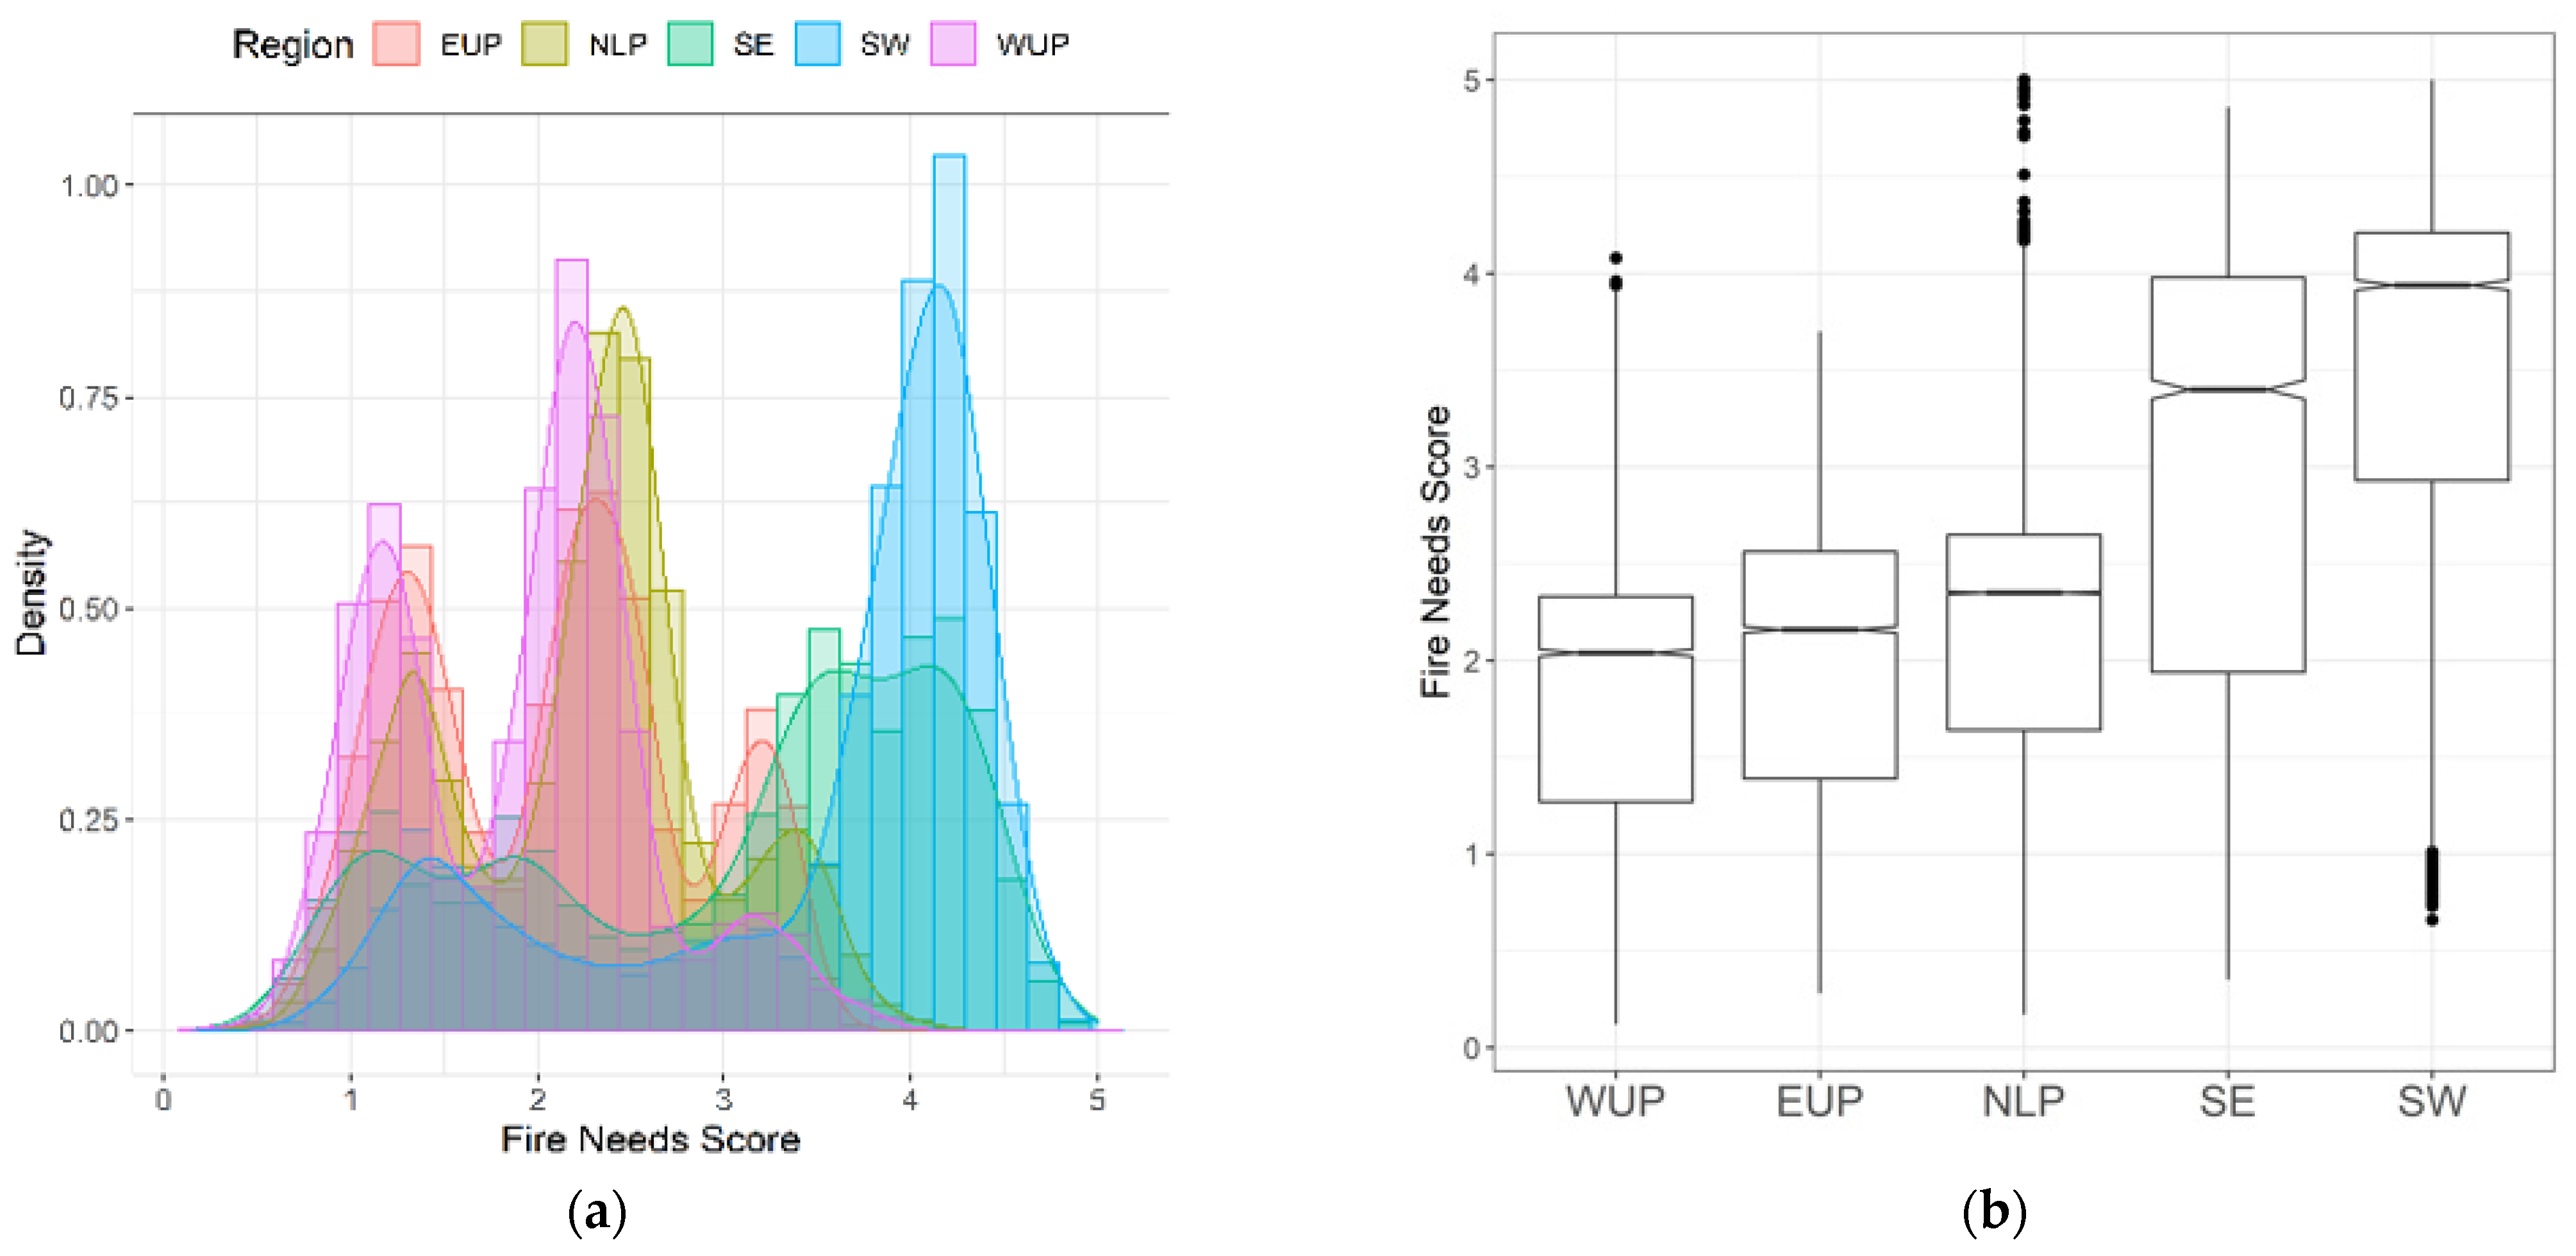
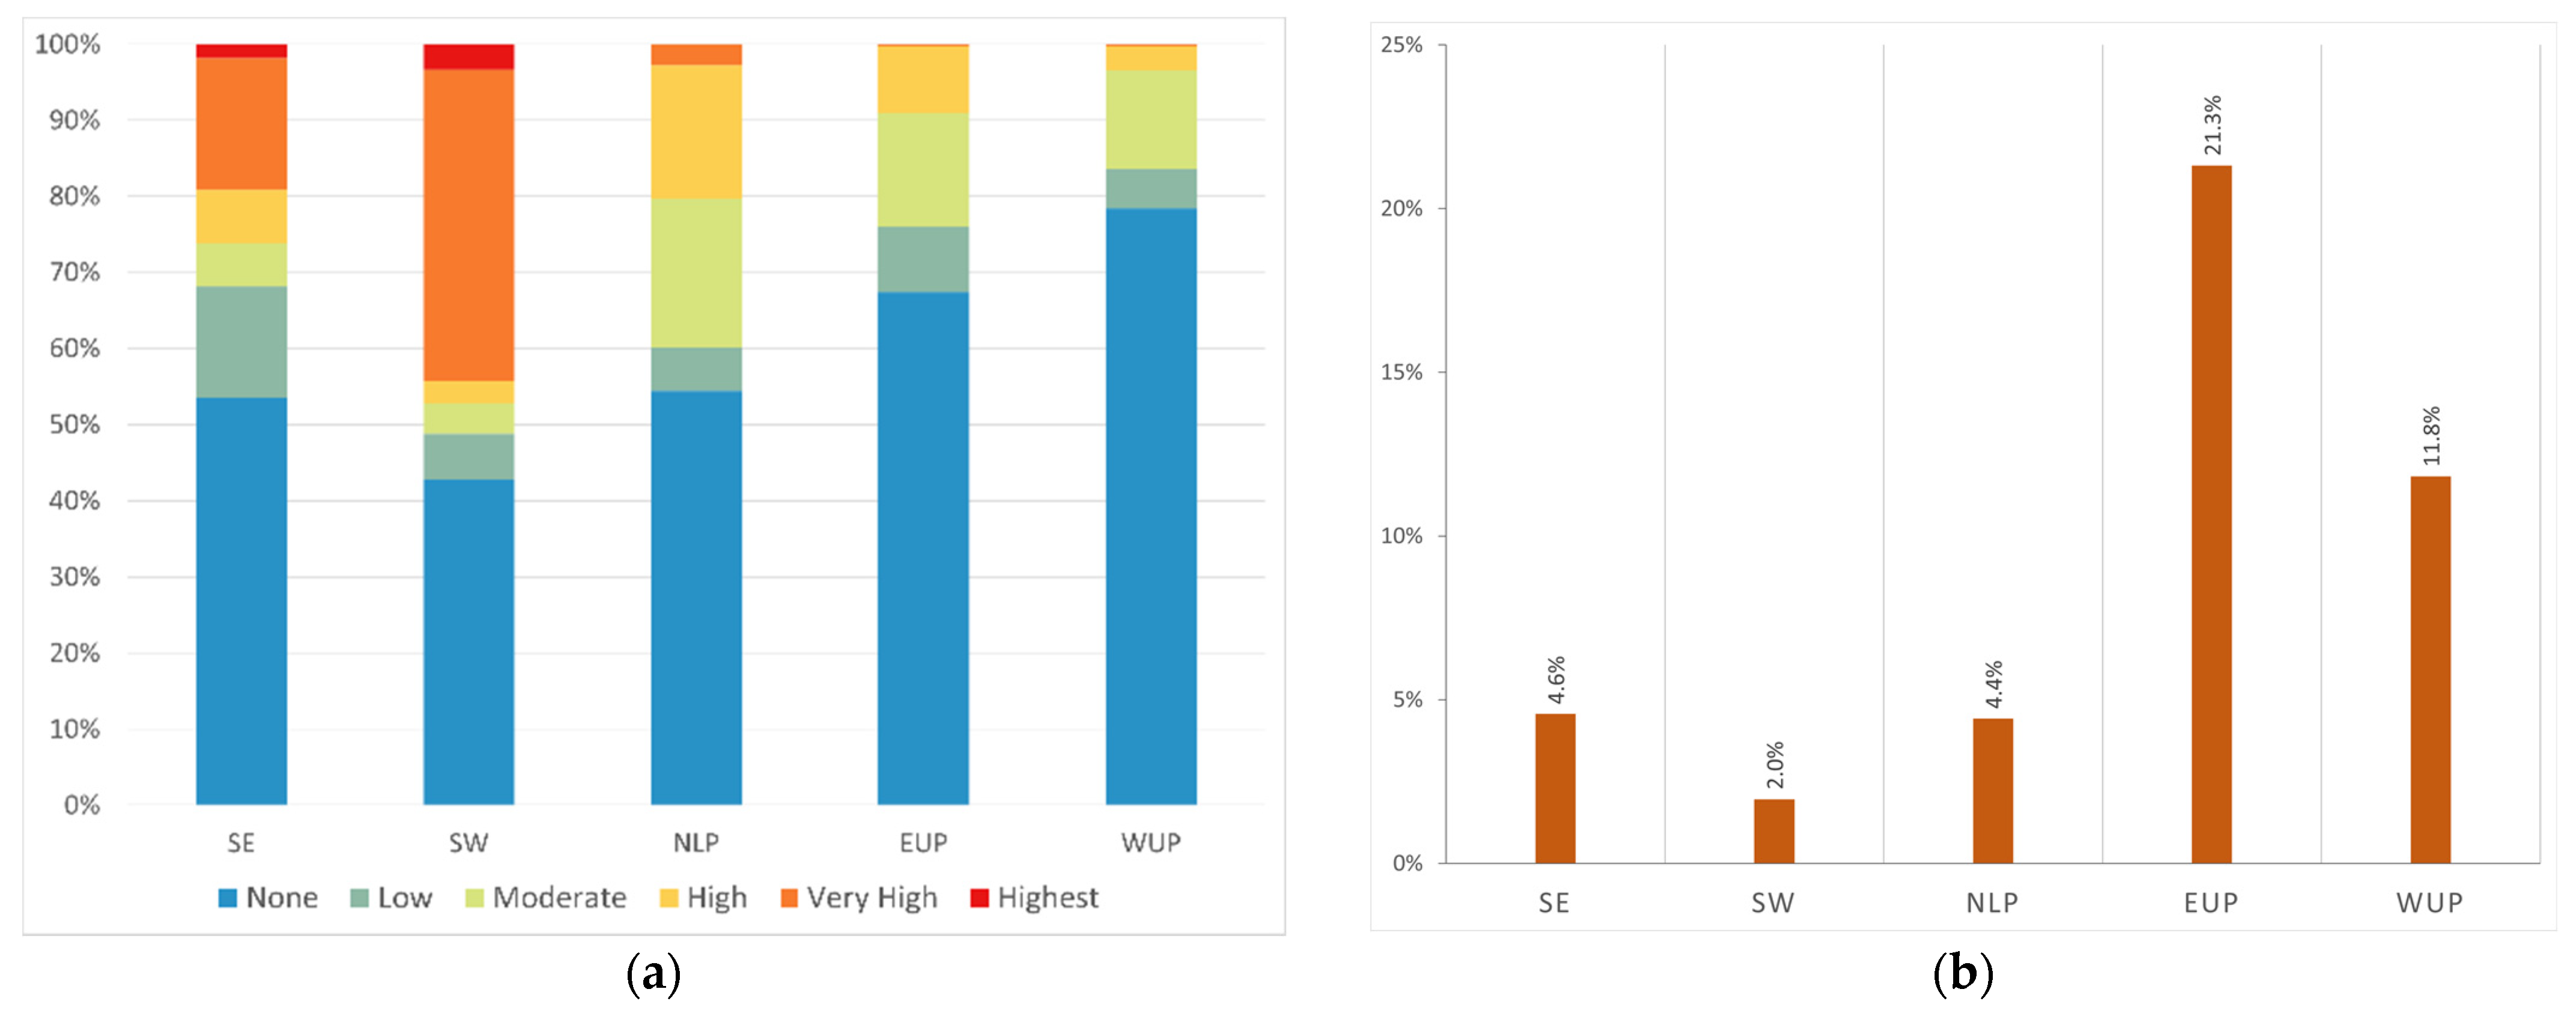
3.2. Management Regions
3.3. Management Areas
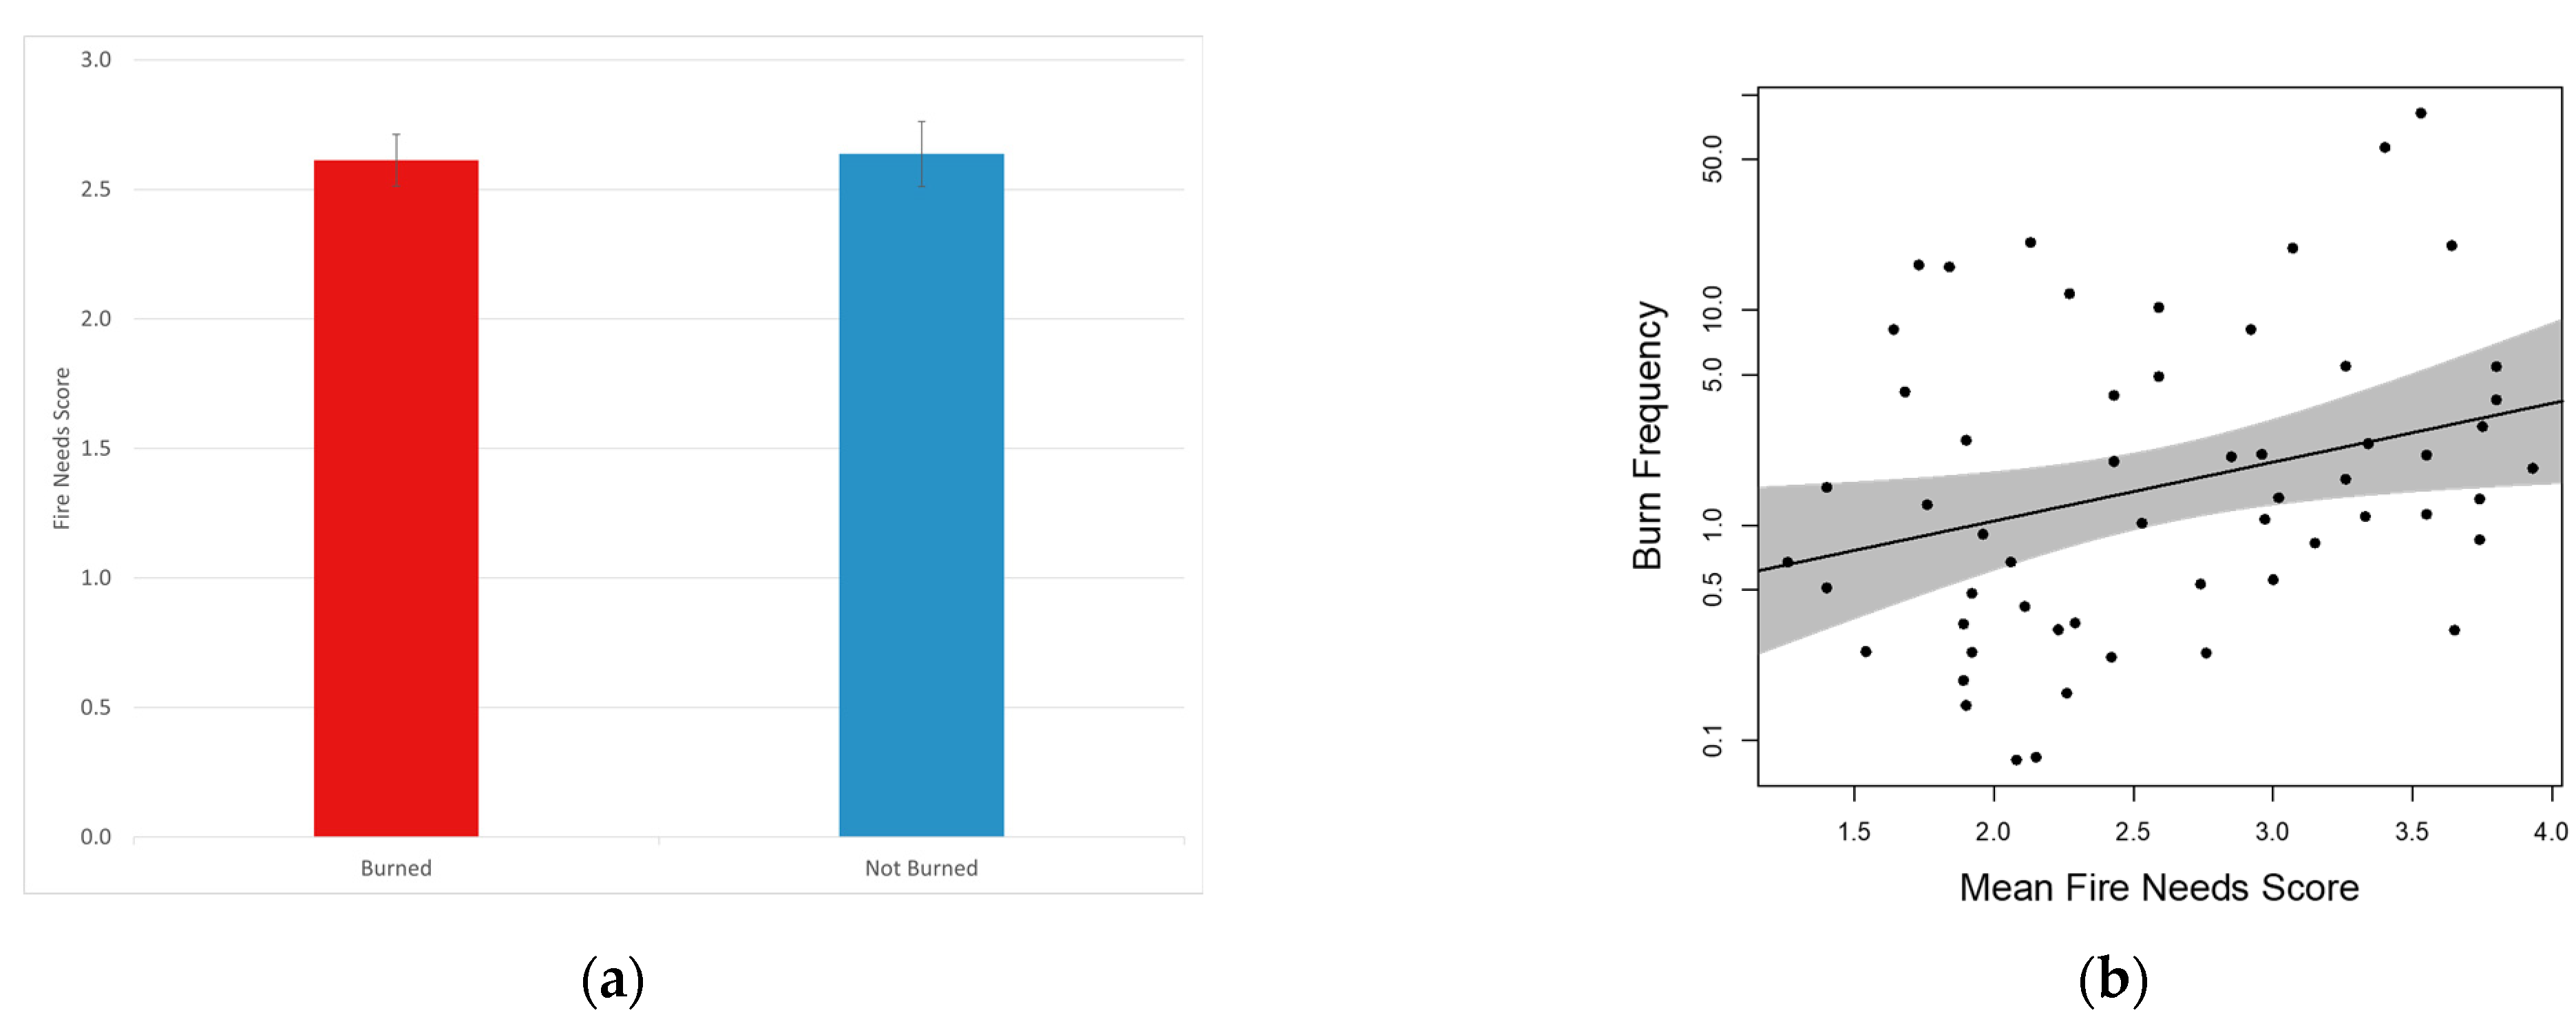
3.4. Incorporating Complexity
4. Discussion
4.1. Limitations: From Model to Management
4.2. Context for Informed Decision Making
4.3. Broader Applications
5. Conclusions
Author Contributions
Funding
Institutional Review Board Statement
Informed Consent Statement
Data Availability Statement
Acknowledgments
Conflicts of Interest
Appendix A. Fire Frequency Ranges by Natural Community Types

| Natural Community Type | Fire Frequency | Fire Frequency Range | Confidence | Reference |
|---|---|---|---|---|
| Alvar | Infrequent | >200 years | Low | Reschke et al. 1999 [121], Jones and Reschke 2005 [122], Catling and Brownell 1998 [123] |
| Bog | Infrequent | 100–>200 years | Low | Camill et al. 2009 [124], Wieder et al. 2009 [125] |
| Boreal Forest | Very Infrequent | >200–500 years | Medium | Bergeron et al. 2004 [126] |
| Bur Oak Plains | Very Frequent | 1–10 years | Low | Leitner et al. 1991 [13], Chapman and Brewer 2008 [16] |
| Cave | NA | NA | High | - |
| Clay Bluff | NA | NA | High | - |
| Coastal Fen | Very Infrequent | >500 years | Medium | - |
| Coastal Plain Marsh | Infrequent | 70–200 years | Low | - |
| Dry Northern Forest (low-severity) | Frequent | 10–40 years | High | Simard and Blank 1982 [127], Drobyshev et al. 2008 [128], Meunier et al. 2019 [129], Meunier and Shea 2020 [109] |
| Dry Northern Forest (high-severity) | Frequent | 60–300 years | High | Heinselman 1973 [8], Whitney 1986 [12], Drobyshev et al. 2008 [128] |
| Dry Sand Prairie | Very Frequent | 1–10 years | High | Chapman 1984 [11], Chapman and Brewer 2008 [16] |
| Dry Southern Forest | Frequent | 10–35 years | Medium | Nowacki and Abrams 2008 [17] |
| Dry-Mesic Northern Forest | Infrequent | 120–300 years | High | Heinselman 1973 [8], Heinselman 1981 [10], Whitney 1986 [12] |
| Dry-Mesic Prairie | Very Frequent | 1–5 years | High | Cottam 1949 [33], Chapman 1984 [11], Chapman and Brewer 2008 [16] |
| Dry-Mesic Southern Forest | Infrequent | 10–35 years | Medium | Schmidt et al. 2002 [90], Nowacki and Abrams 2008 [17] |
| Emergent Marsh | Very Infrequent | >500 years | High | - |
| Floodplain Forest | Infrequent | >500 years | Low | - |
| Granite Bedrock Glade | Infrequent | 20–100 years | Low | - |
| Granite Bedrock Lakeshore | NA | NA | High | - |
| Granite Cliff | Very Infrequent | >1000 years | Medium | - |
| Granite Lakeshore Cliff | NA | NA | High | - |
| Great Lakes Barrens | Infrequent | 80–300 years | Low | - |
| Great Lakes Marsh | Very Infrequent | >500 years | High | - |
| Hardwood-Conifer Swamp | Infrequent | 120–>500 years | Medium | Whitney 1986 [12], Zhang et al. 1999 [130] |
| Hillside Prairie | Frequent | 5–20 years | Medium | Chapman and Brewer 2008 [16] |
| Inland Salt Marsh | Infrequent | 70–300 years | Low | Chapman et al. 1985 [131] |
| Intermittent Wetland | Infrequent | 50–200 years | Low | - |
| Inundated Shrub Swamp | Very Infrequent | >500 years | High | Snyder 1991 [132] |
| Lakeplain Oak Openings | Frequent | 5–20 years | High | Dorney 1981 [5], Wolf 2004 [133] |
| Lakeplain Wet Prairie | Frequent | 5–20 years | Medium | Chapman and Brewer 2008 [16] |
| Lakeplain Wet-Mesic Prairie | Frequent | 1–10 years | High | Chapman and Brewer 2008 [16] |
| Limestone Bedrock Glade | Infrequent | >200 years | Low | Jones and Reschke 2005 [122], Catling and Brownell 1998 [123] |
| Limestone Bedrock Lakeshore | NA | NA | High | - |
| Limestone Cliff | NA | NA | High | - |
| Limestone Cobble Shore | NA | NA | High | - |
| Limestone Lakeshore Cliff | NA | NA | High | - |
| Mesic Northern Forest | Extremely Infrequent | >1000 years | High | Whitney 1986 [12], Frelich and Lorimer 1991 [134] |
| Mesic Prairie | Very Frequent | 1–2 years | High | Cottam 1949 [33], Chapman 1984 [11], Chapman and Brewer 2008 [16] |
| Mesic Sand Prairie | Very Frequent | 1–5 years | High | Chapman 1984 [11], Chapman and Brewer 2008 [16] |
| Mesic Southern Forest | Very Infrequent | >1000 years | High | Curtis 1959 [4], Grimm 1984 [6] |
| Muskeg | Infrequent | 100–>500 years | Medium | Heinselman 1981 [10], Camill et al. 2009 [124], Wieder et al. 2009 [125] |
| Northern Bald | Infrequent | >200 years | Low | - |
| Northern Fen | Infrequent | 100–> 200 years | Low | - |
| Northern Hardwood Swamp | Very Infrequent | >500 years | High | MN DNR 2003 [135] |
| Northern Shrub Thicket | Very Infrequent | >500 years | Low | - |
| Northern Wet Meadow | Infrequent | 100–>200 years | Low | Curtis 1959 [4], Davis 1979 [136] |
| Oak Barrens | Frequent | 5–20 years | High | Dorney 1981 [5], Wolf 2004 [133], Nowacki and Adams 2008 [17] |
| Oak Openings | Very Frequent | 1–10 years | Low | Cottam 1949 [33], Chapman 1984 [11], Chapman and Brewer 2008 [16] |
| Oak-Pine Barrens | Frequent | 5–20 years | Low | Dorney 1981 [5], Faber-Langendoen and Davis 1995 [137], Wolf 2004 [133], Nowacki and Adams 2008 [17] |
| Open Dunes | NA | NA | High | - |
| Patterned Fen | Infrequent | 100–>200 years | Low | Camill et al. 2009 [124], Wieder et al. 2009 [125], Drobyshev et al. 2008 [128] |
| Pine Barrens | Frequent | 5–40 years | High | Curtis 1959 [4], Simard and Blank 1982 [127], Whitney 1986 [12] |
| Poor Conifer Swamp | Infrequent | 100–>200 years | High | Heinselman 1981 [10], Whitney 1986 [12] |
| Prairie Fen | Frequent to Infrequent | 20–>100 years | Low | Kost and Hyde 2009 [138] |
| Rich Conifer Swamp | Extremely Infrequent | >1500 | High | Whitney 1986 [12], Zhang et al. 1999 [130] |
| Rich Tamarack Swamp | Infrequent | 100–>200 years | Low | Zhang et al. 2000 [139] |
| Sand and Gravel Beach | NA | NA | High | - |
| Sandstone Bedrock Lakeshore | NA | NA | High | - |
| Sandstone Cliff | NA | NA | High | - |
| Sandstone Cobble Shore | NA | NA | High | - |
| Sandstone Lakeshore Cliff | NA | NA | High | - |
| Sinkhole | NA | NA | High | - |
| Southern Hardwood Swamp | Very Infrequent | >500 years | High | - |
| Southern Shrub-Carr | Very Infrequent | >500 years | Low | - |
| Southern Wet Meadow | Frequent to Infrequent | 50–100 years | Medium | Curtis 1959 [4], Davis 1979 [136] |
| Submergent Marsh | NA | NA | High | - |
| Volcanic Bedrock Glade | Frequent | 20–100 years | Low | - |
| Volcanic Bedrock Lakeshore | NA | NA | High | - |
| Volcanic Cliff | NA | NA | High | - |
| Volcanic Cobble Shore | NA | NA | High | - |
| Volcanic Lakeshore Cliff | NA | NA | High | - |
| Wet Prairie | Very Frequent | 5–20 years | High | Chapman 1984 [11], Chapman and Brewer 2008 [16] |
| Wet-Mesic Flatwoods | Very Infrequent | >500 years | High | - |
| Wet-Mesic Prairie | Frequent | 1–10 years | High | Chapman 1984 [11], Chapman and Brewer 2008 [16] |
| Wet-Mesic Sand Prairie | Very Frequent | 1–10 years | High | Chapman 1984 [11], Chapman and Brewer 2008 [16] |
| Wooded Dune and Swale Complex | Frequent to Very Infrequent | 50–>500 years | Low | - |
Appendix B. Detailed Summaries of Modeling Results, Maps, and Histograms by Management Region
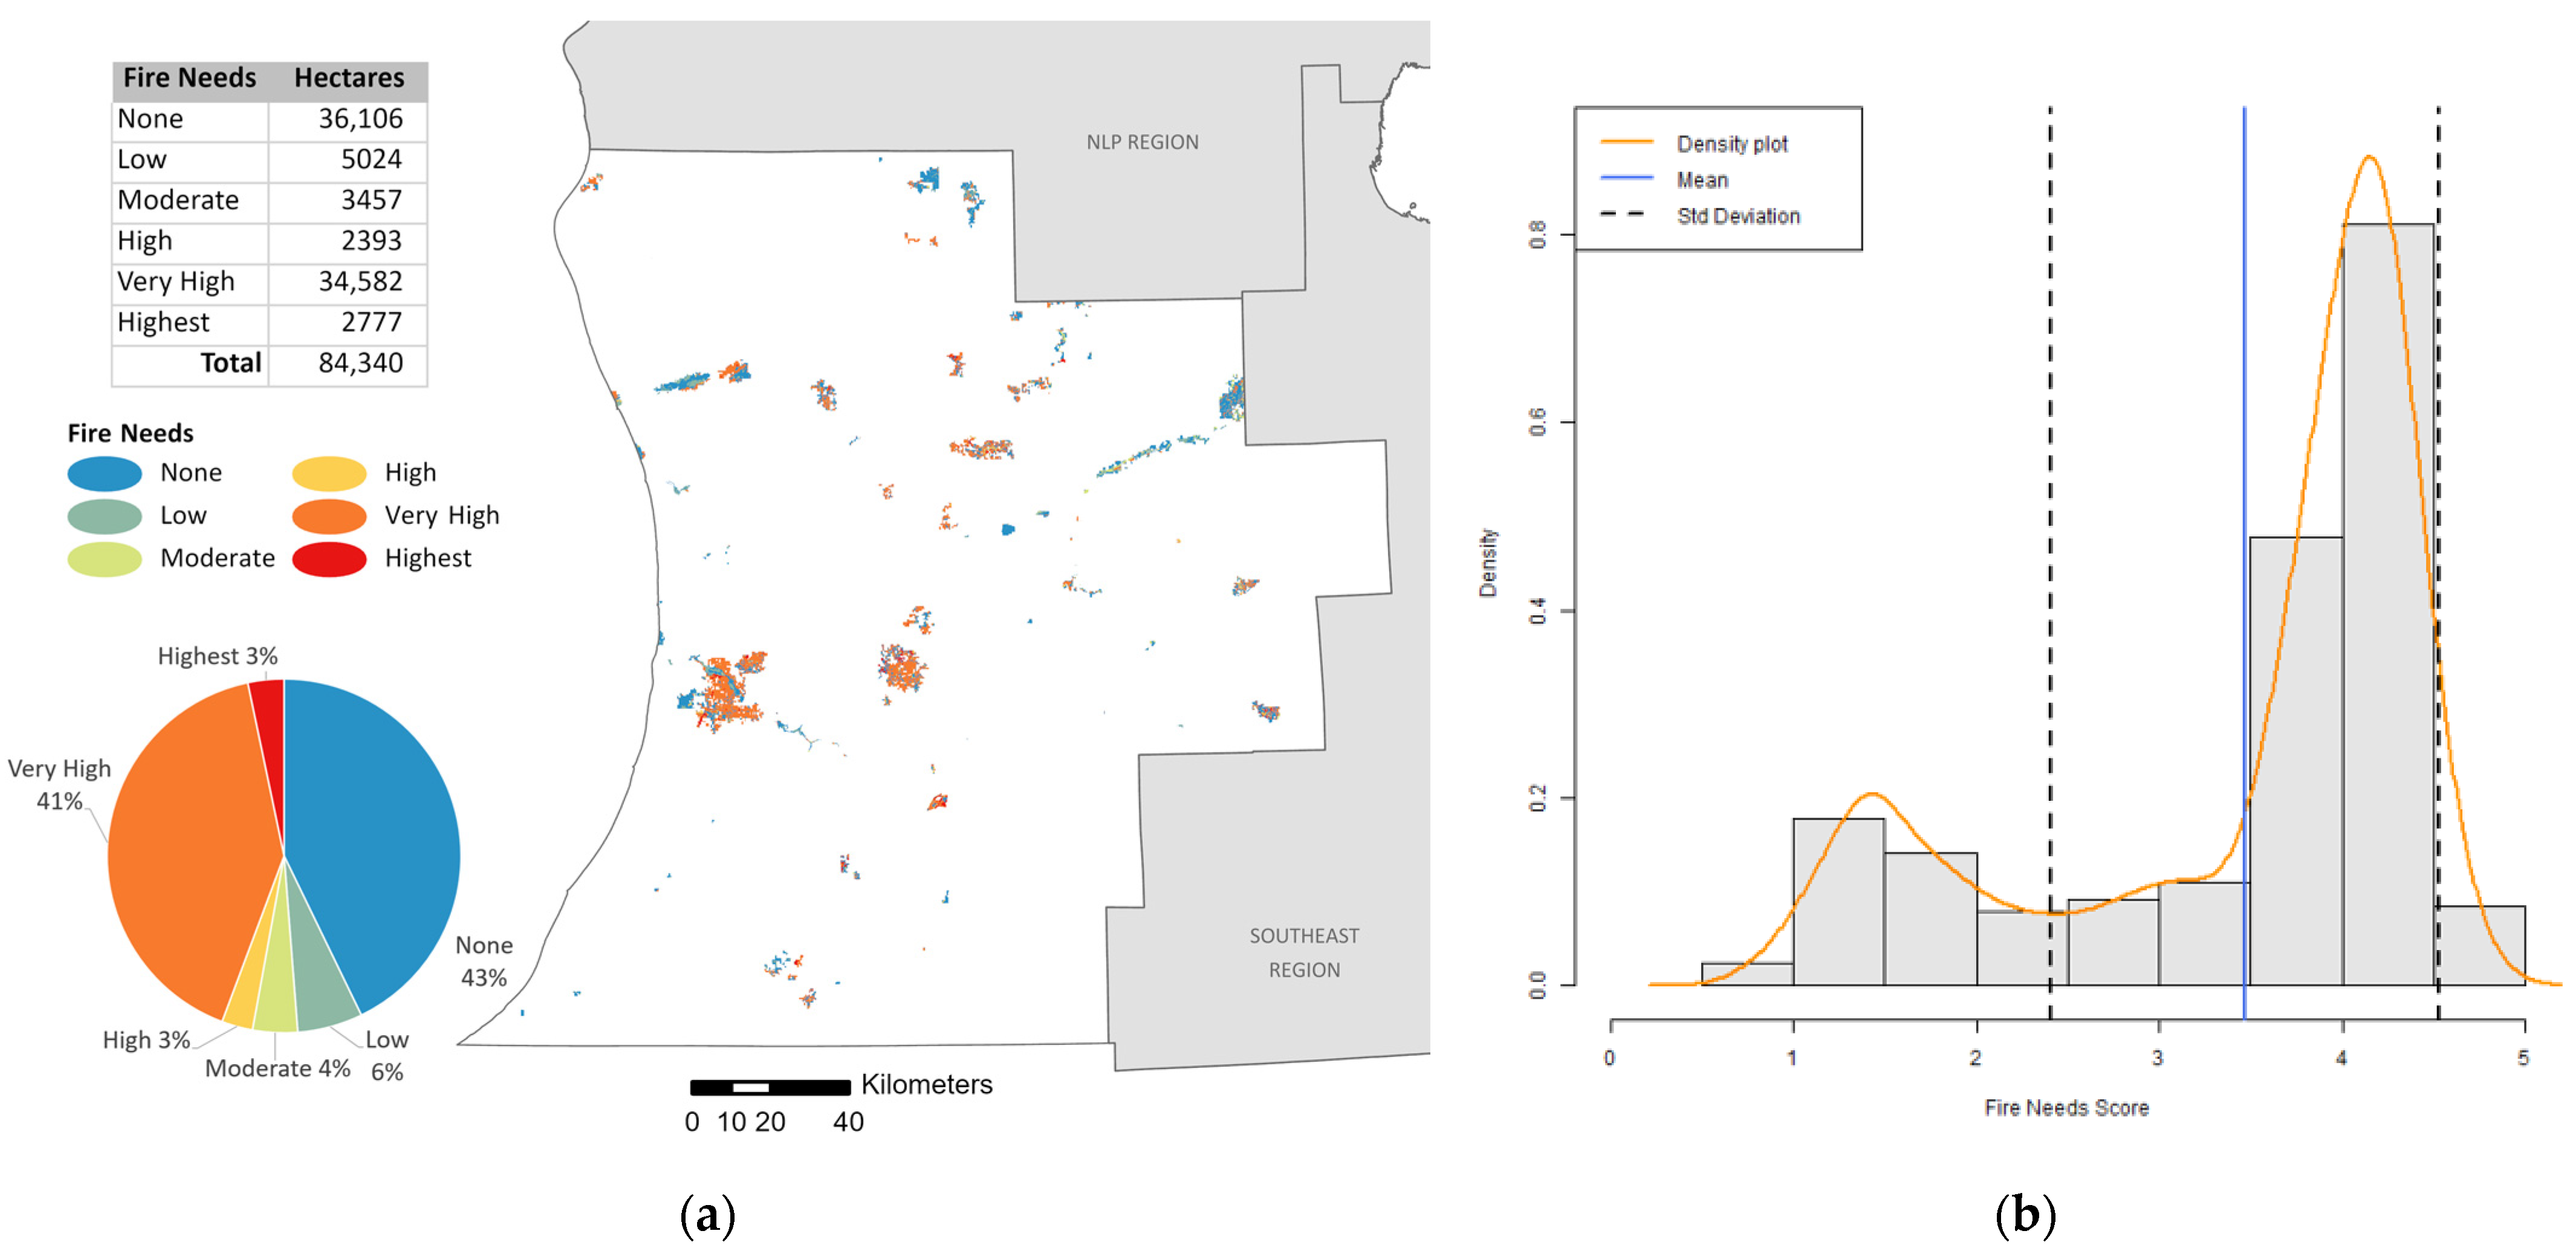
Appendix B.1. Southwest Region
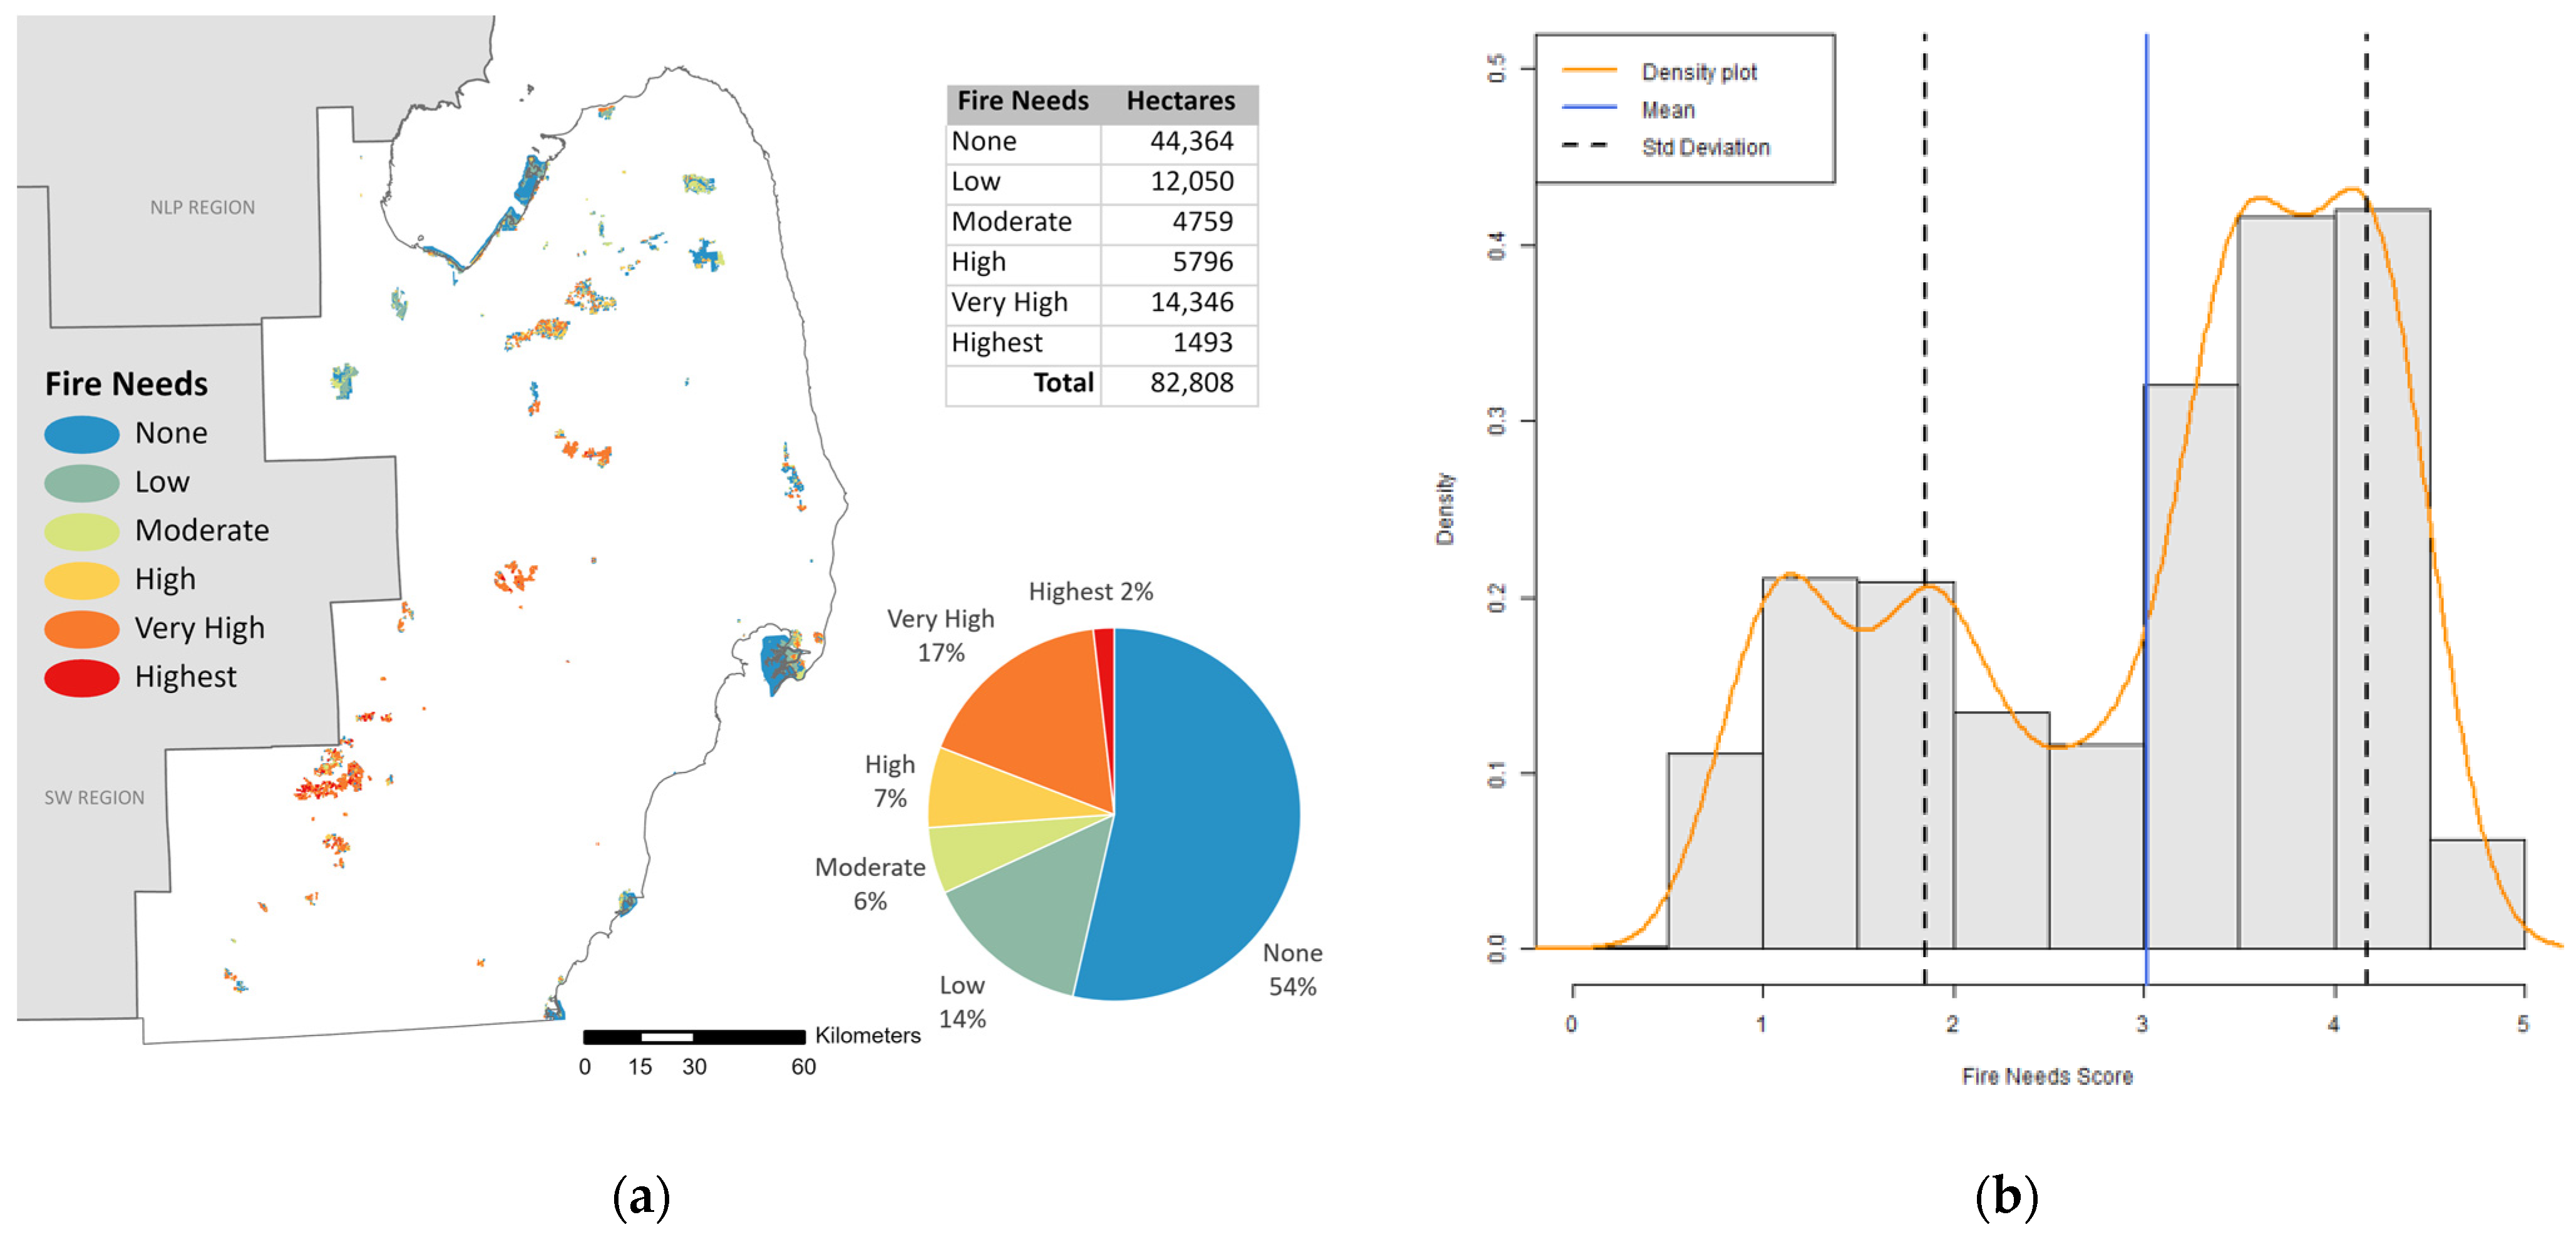
Appendix B.2. Southeast Region

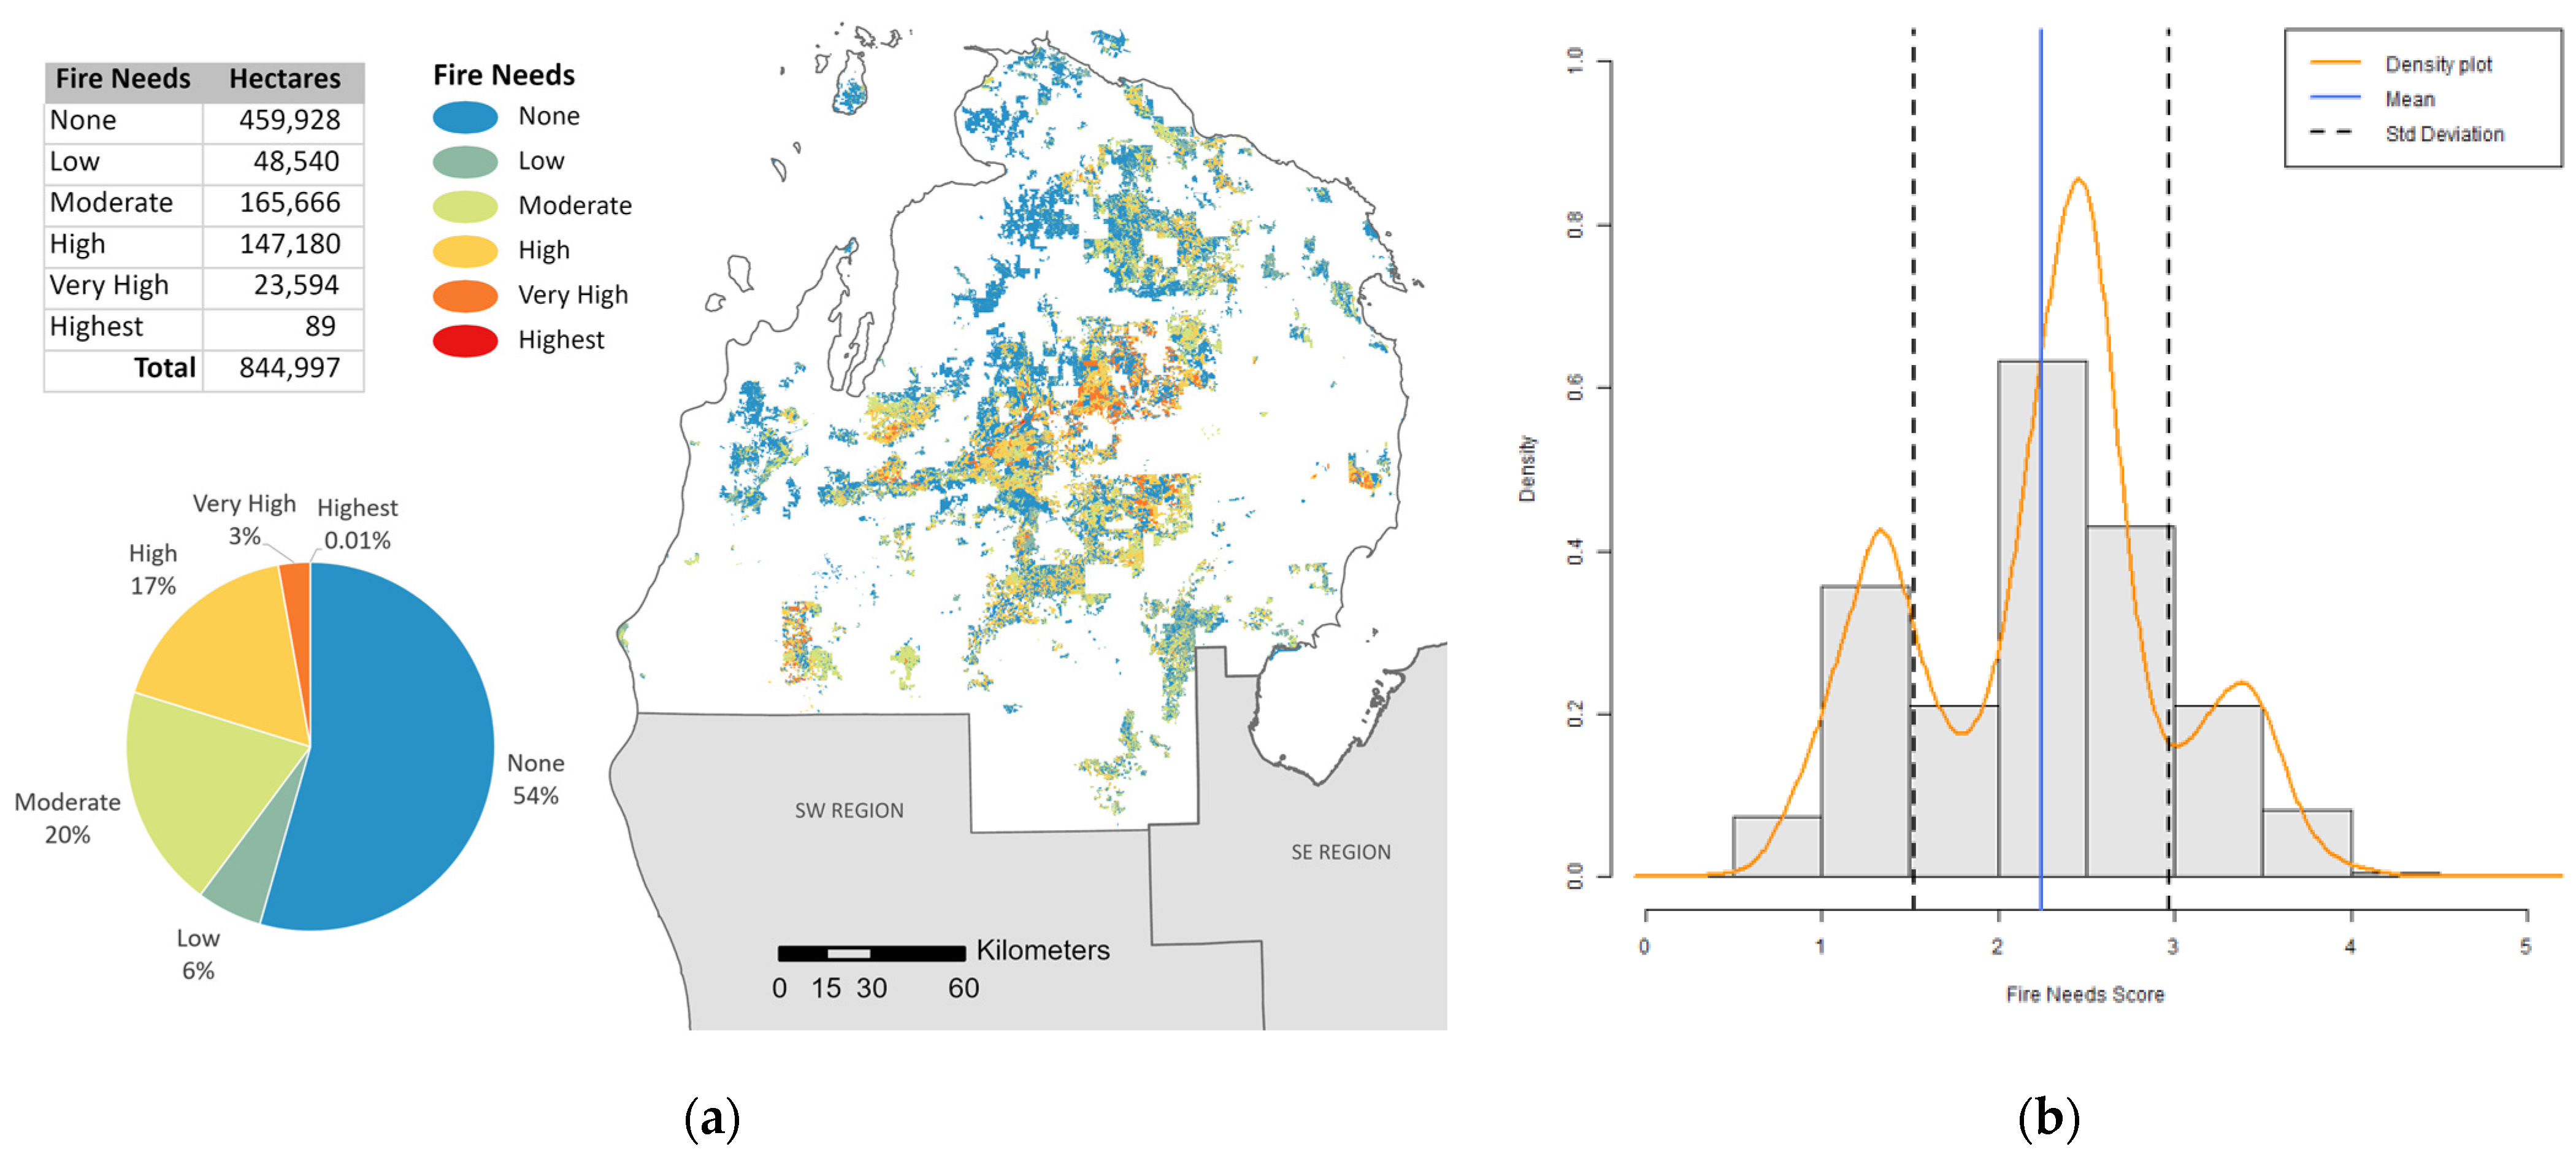
Appendix B.3. Northern Lower Peninsula Region

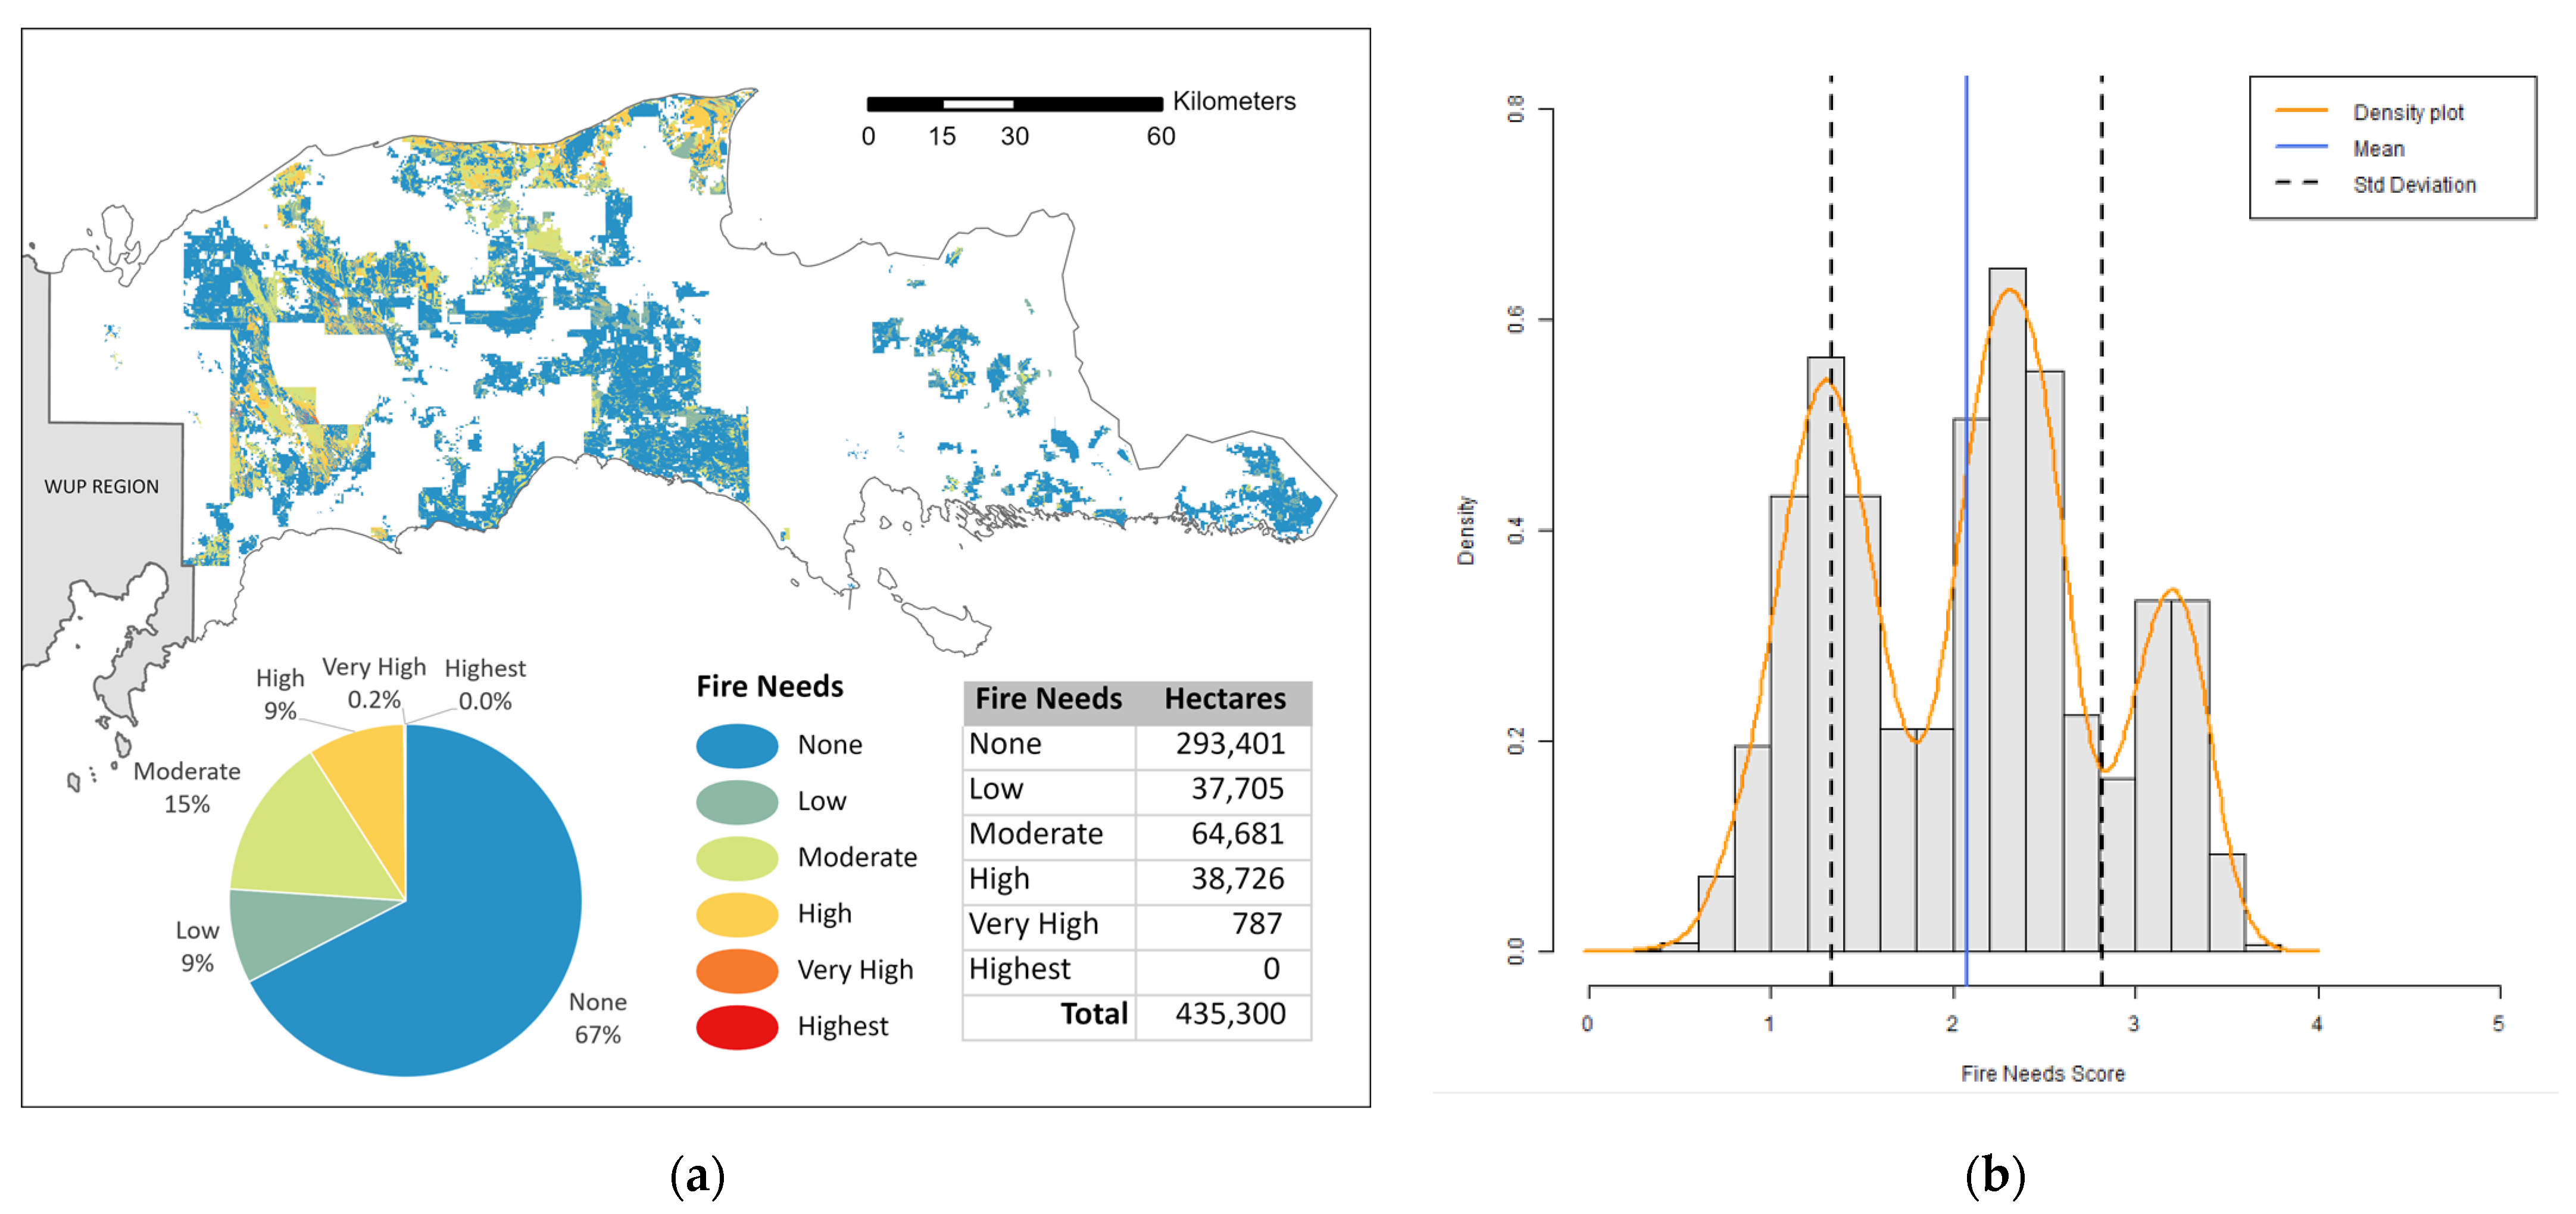
Appendix B.4. Eastern Upper Peninsula Region
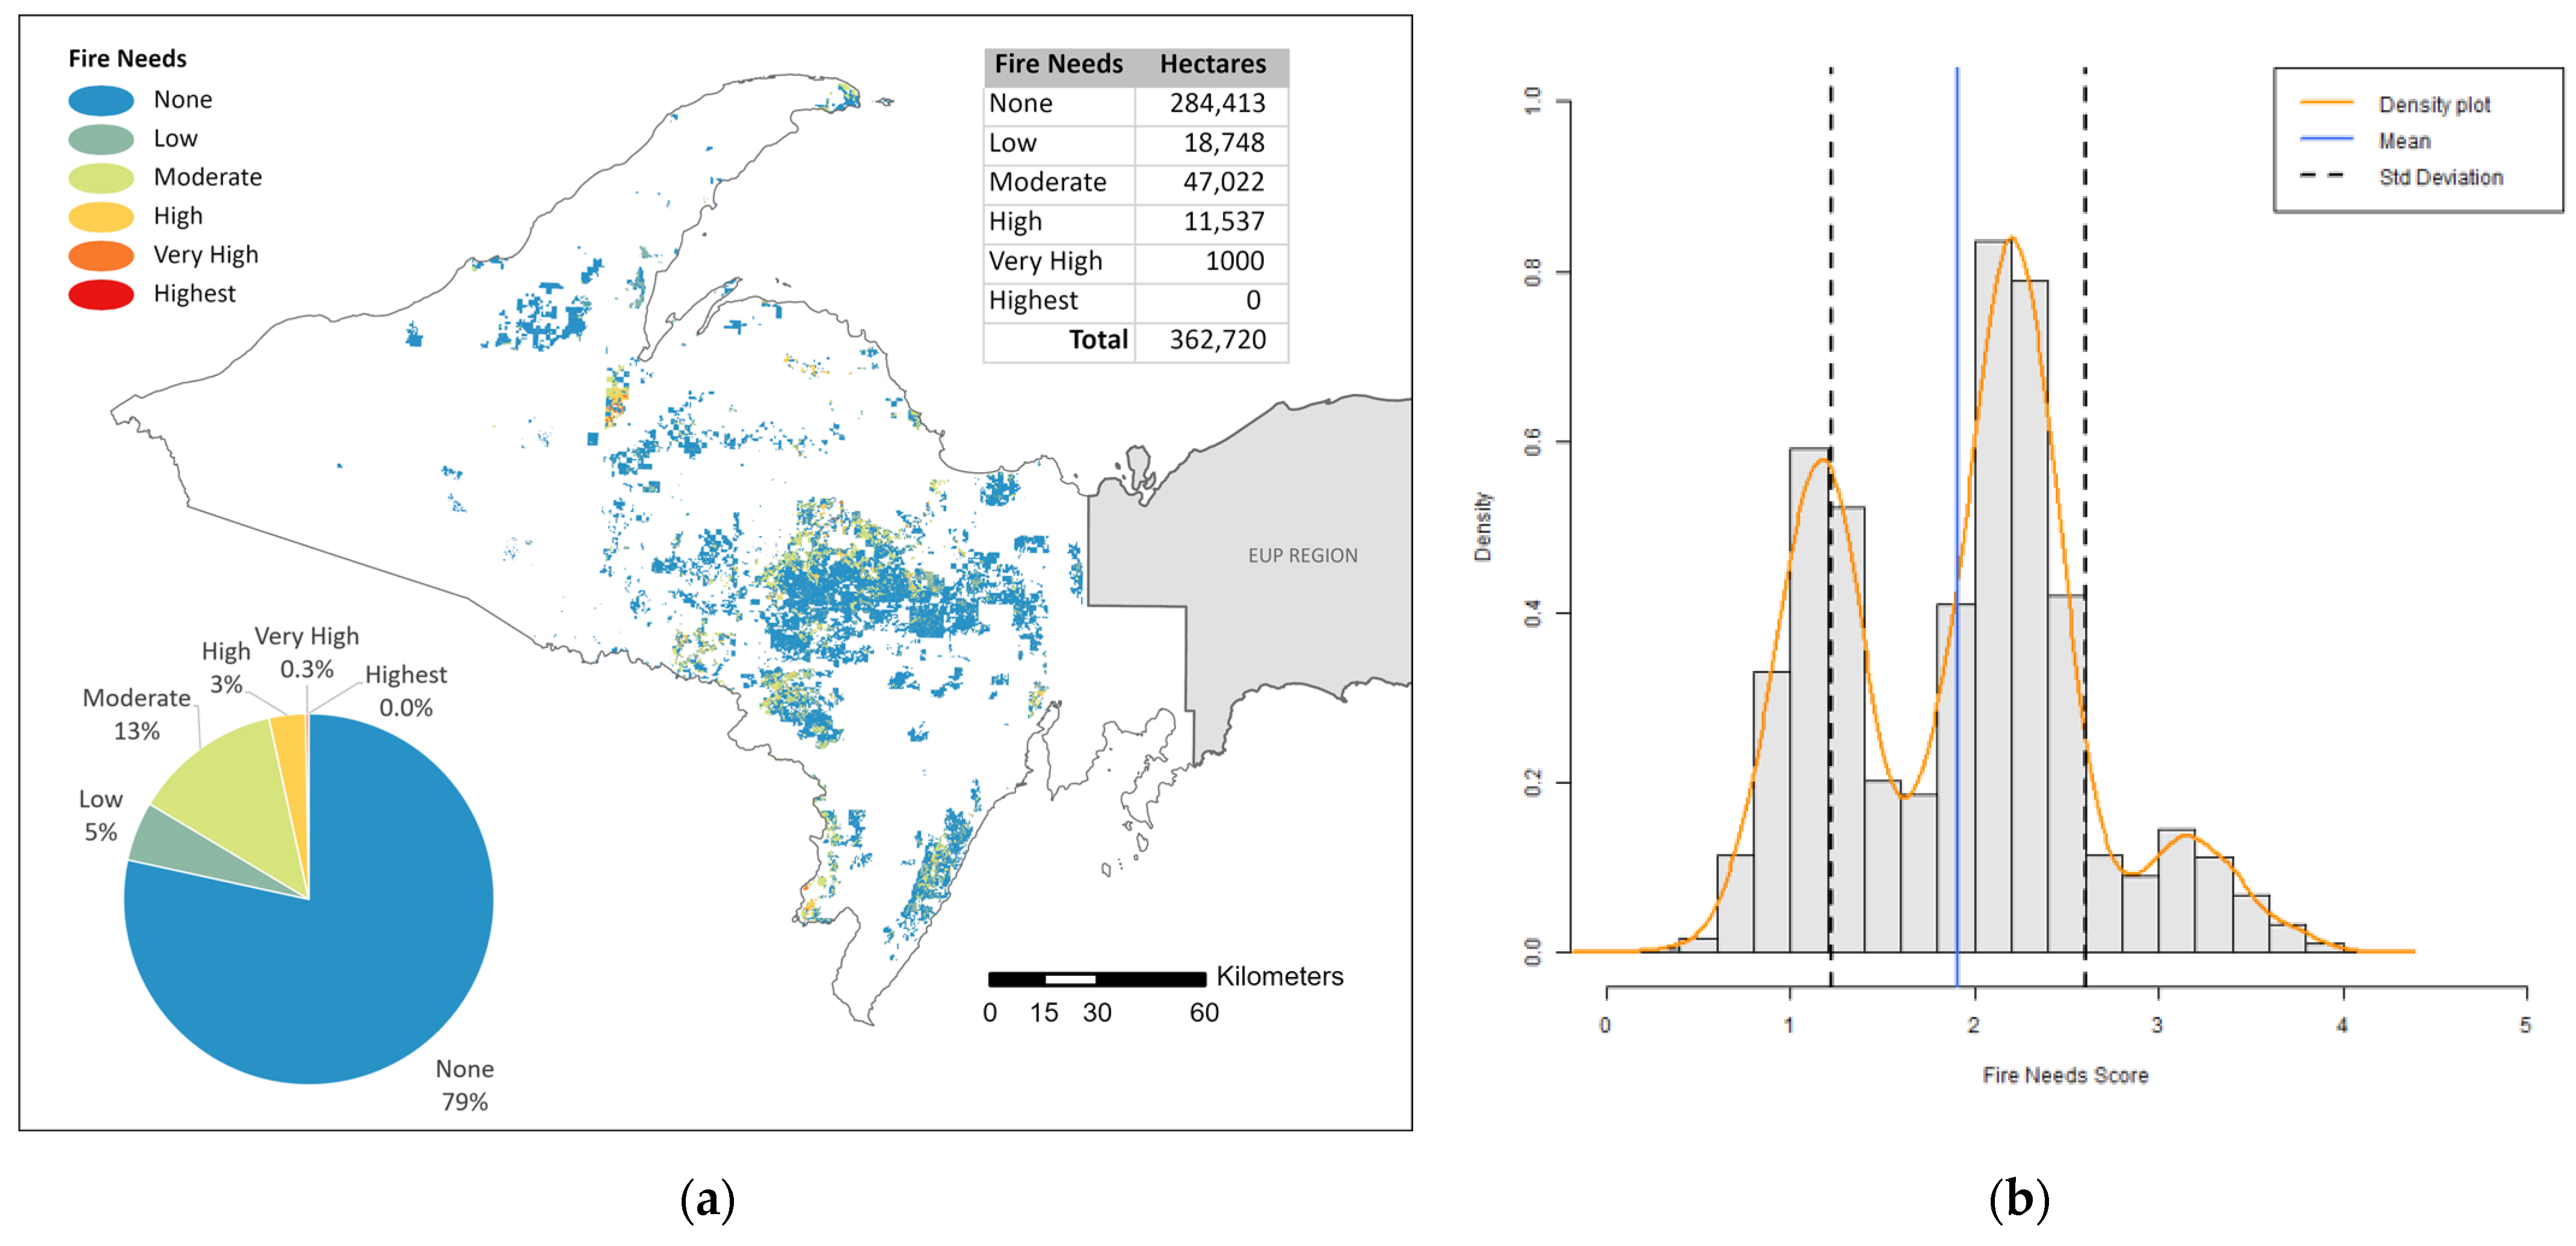
Appendix B.5. Western Upper Peninsula Region


Appendix C. Detailed Summaries of Modeling Results, Maps, and Histograms for Three Example Management Areas
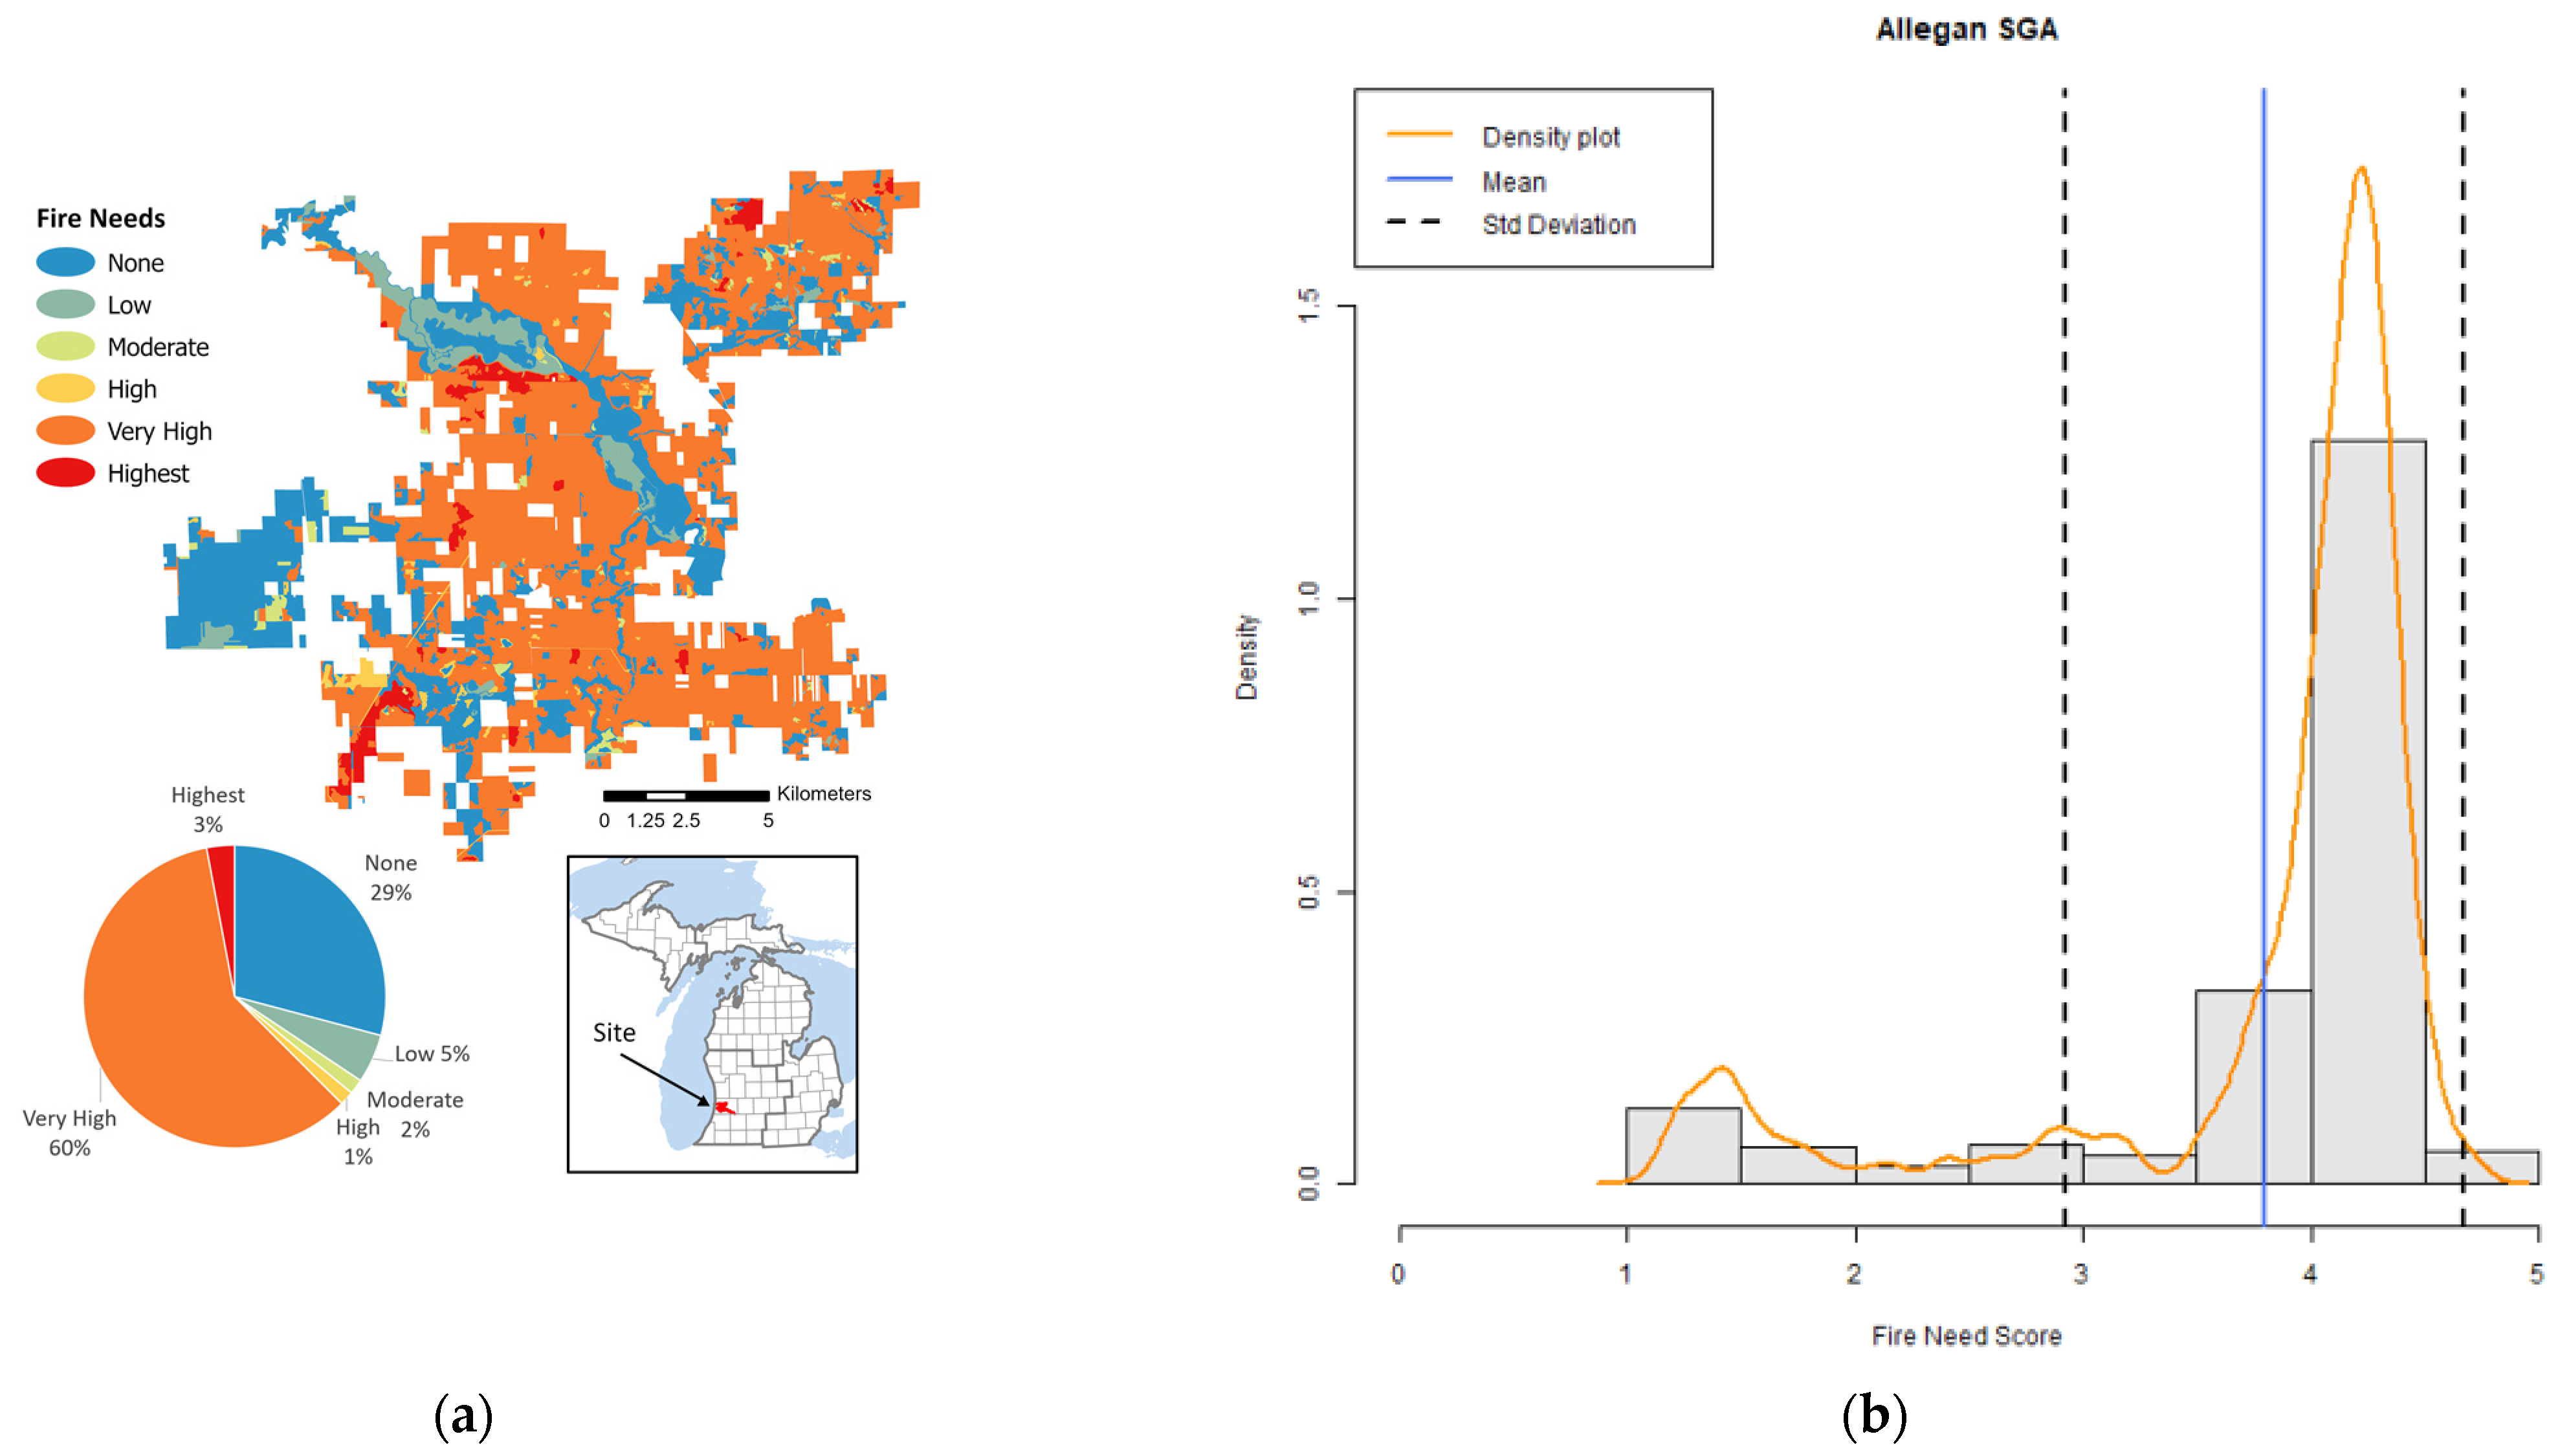
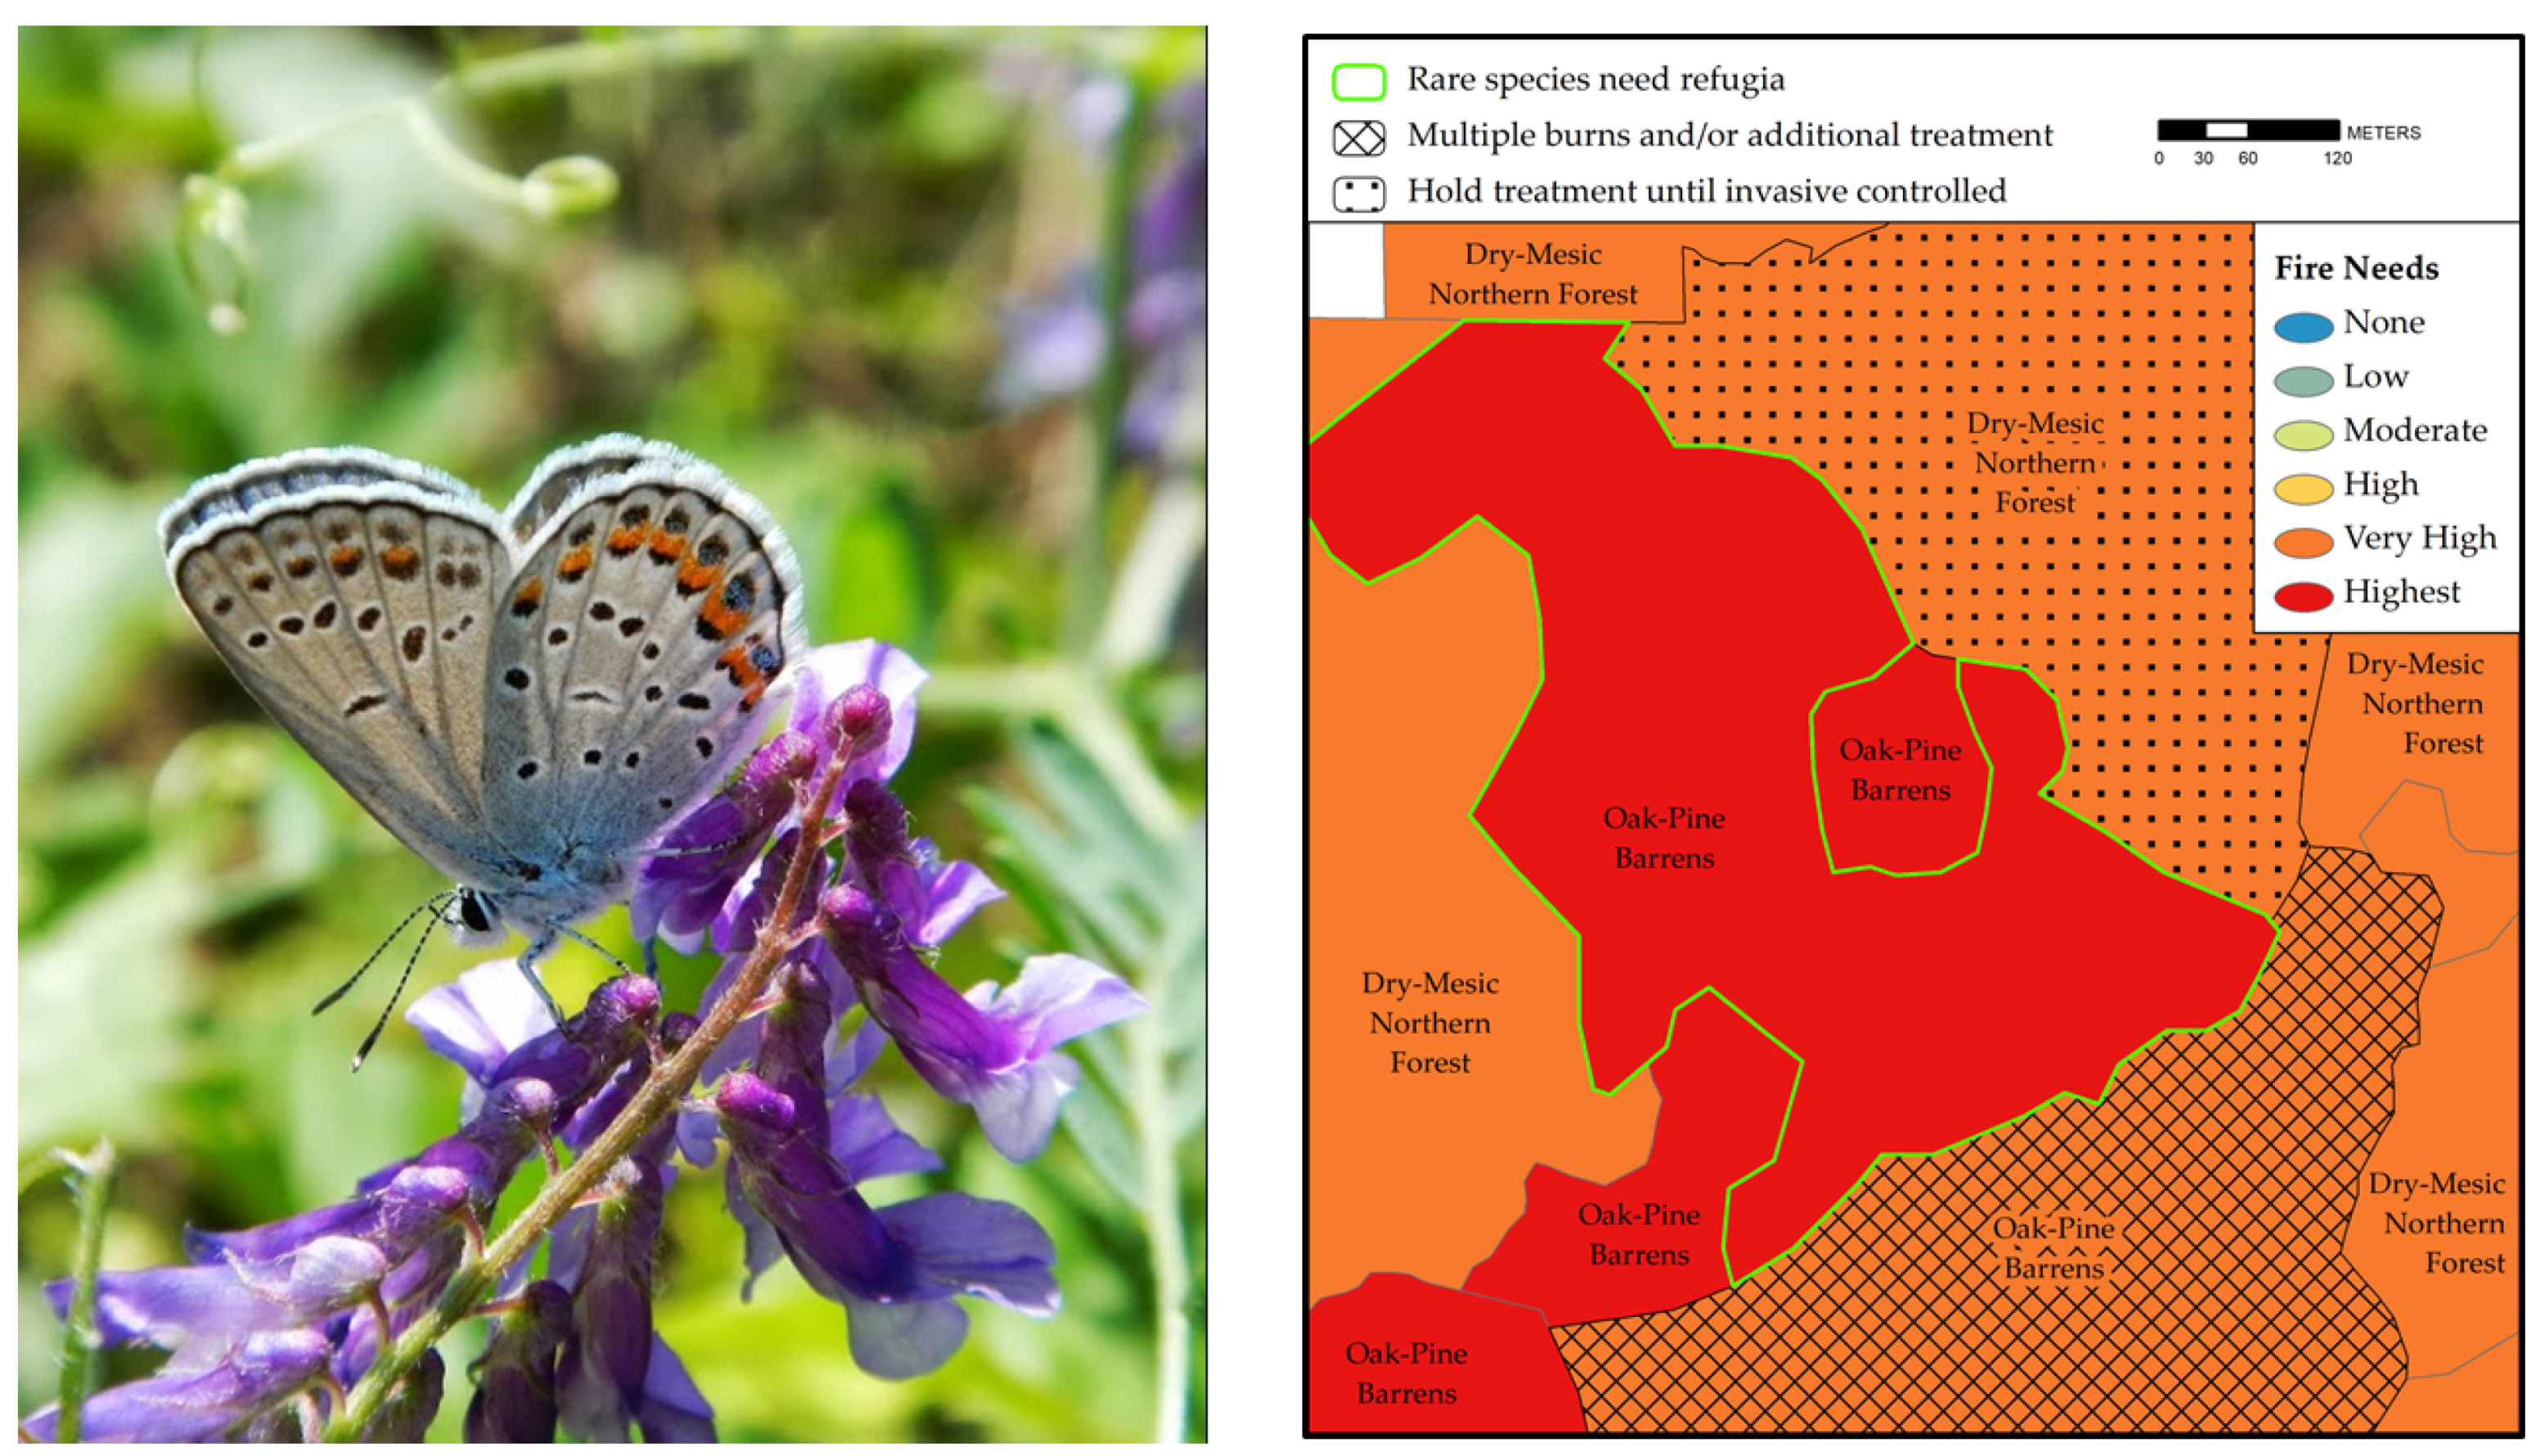
Appendix C.1. Allegan State Game Area
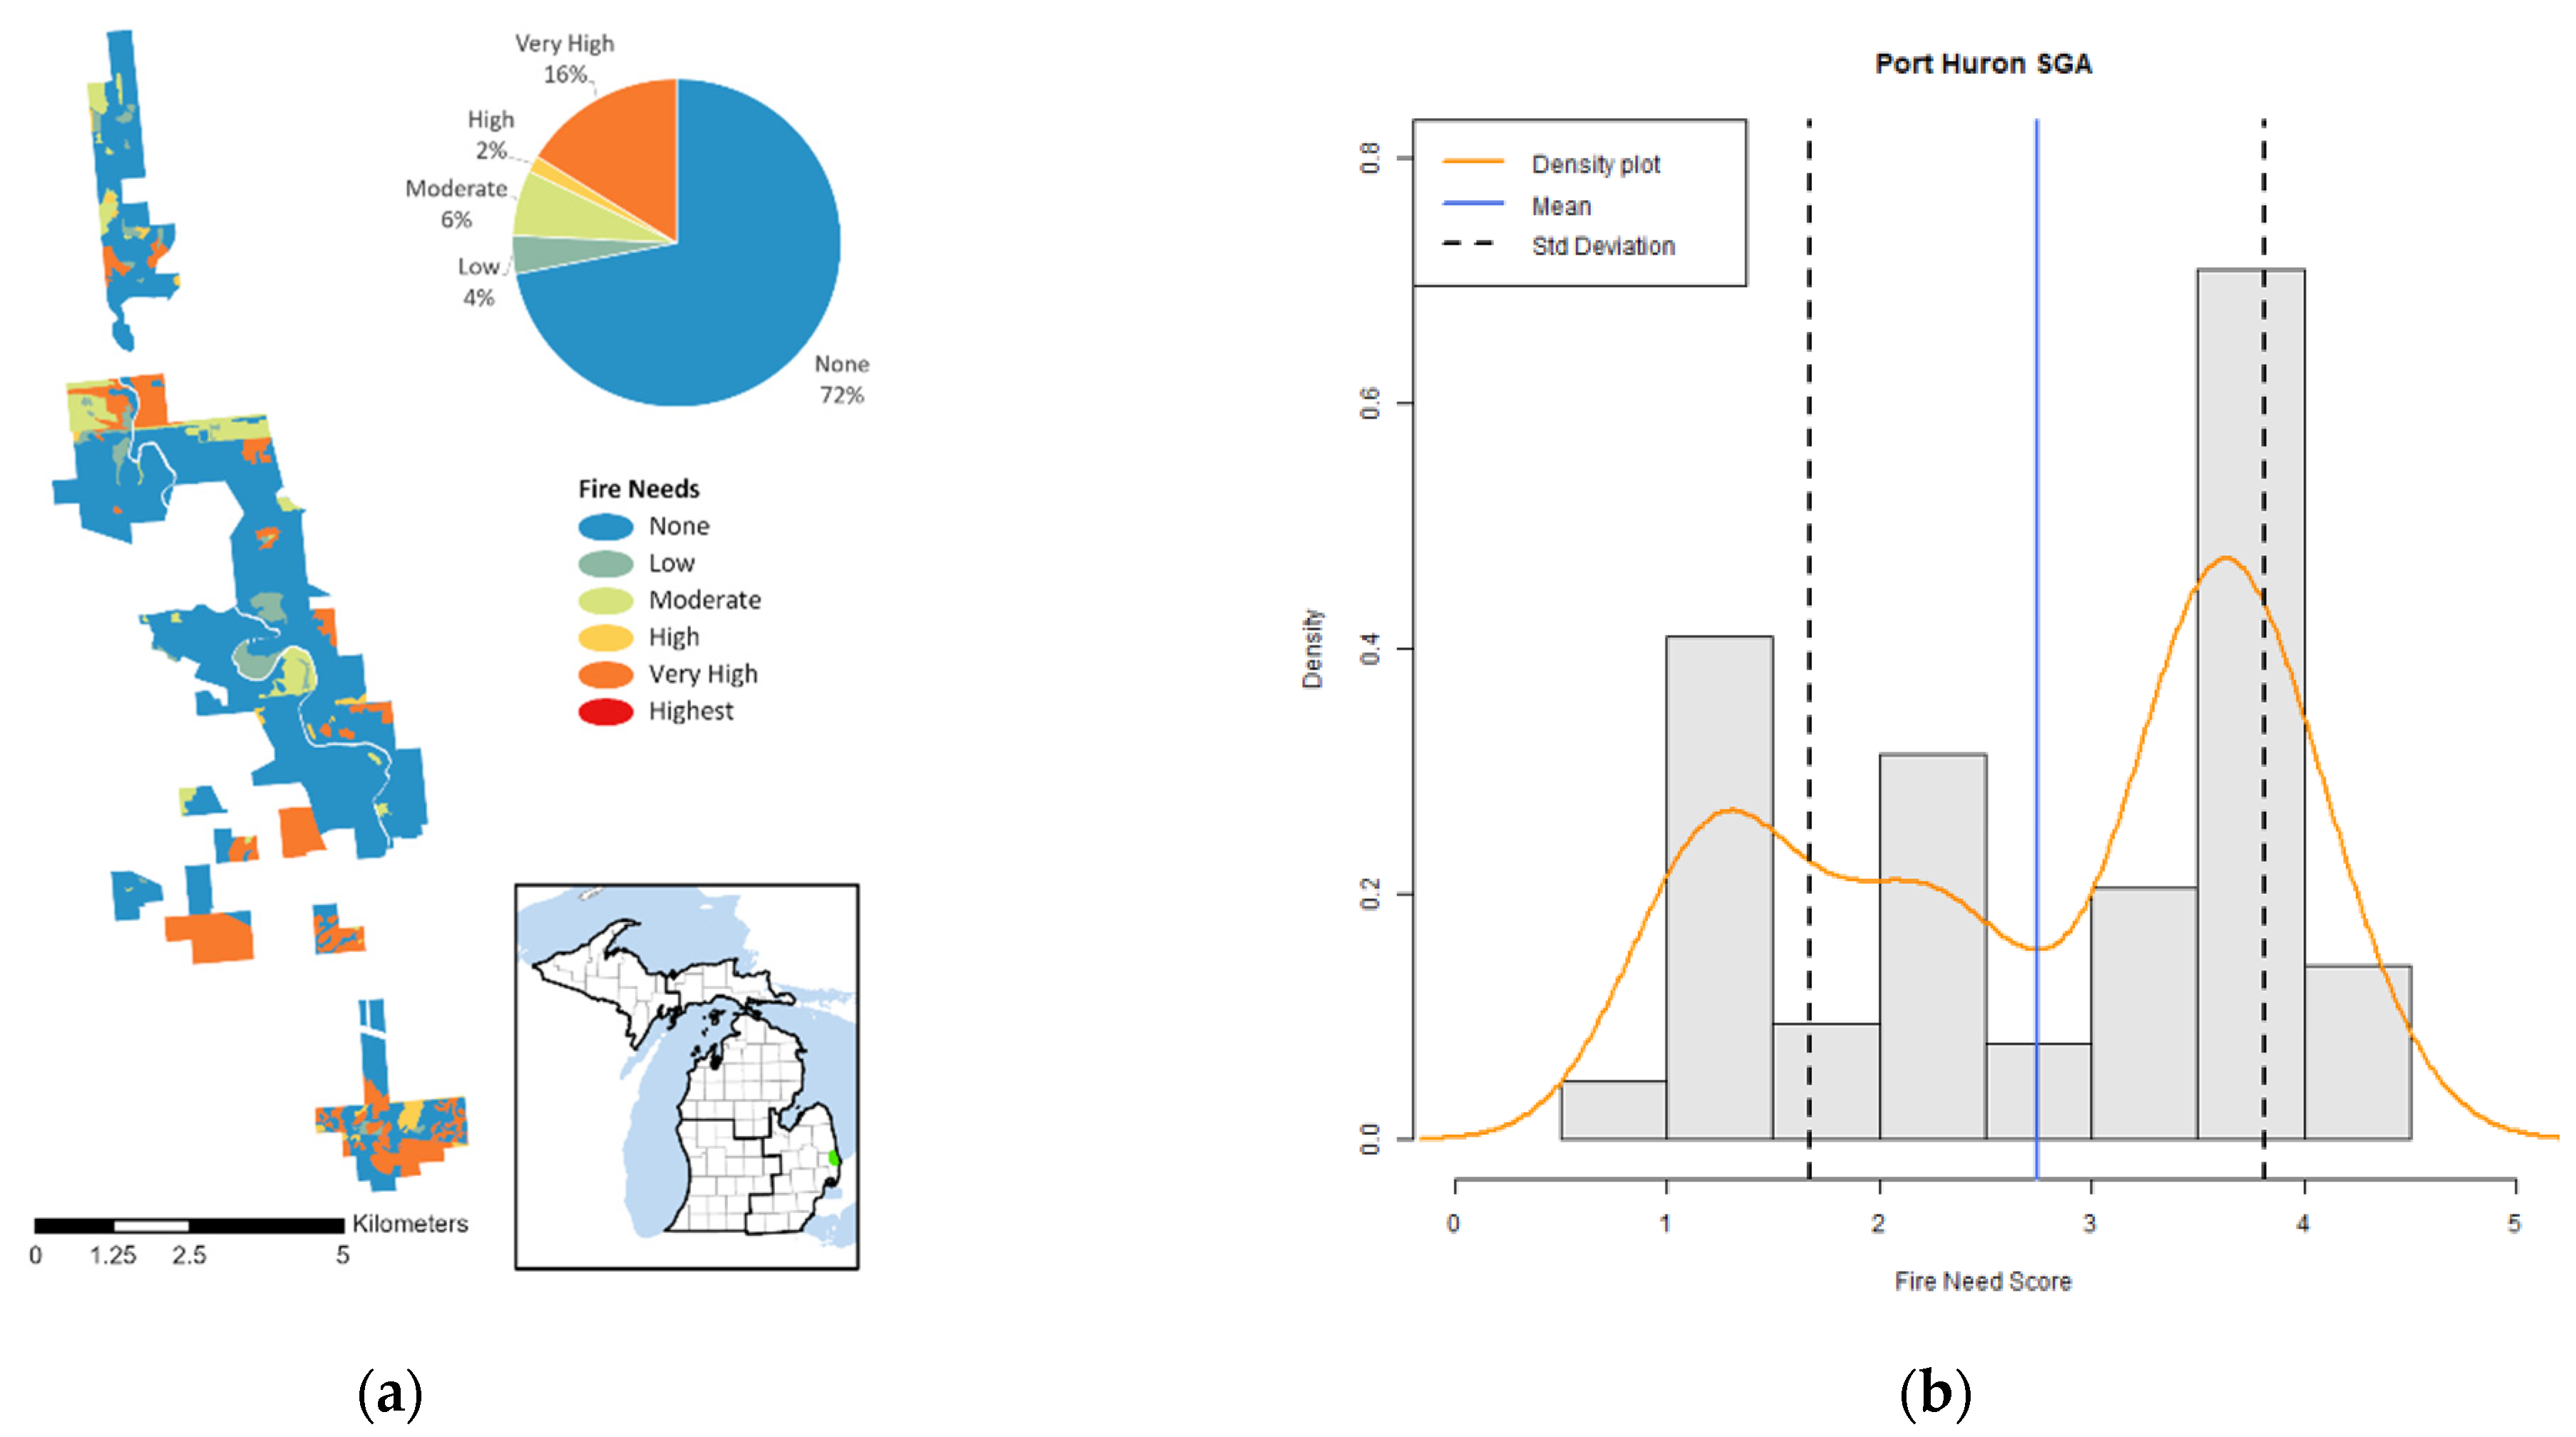
Appendix C.2. Port Huron State Game Area

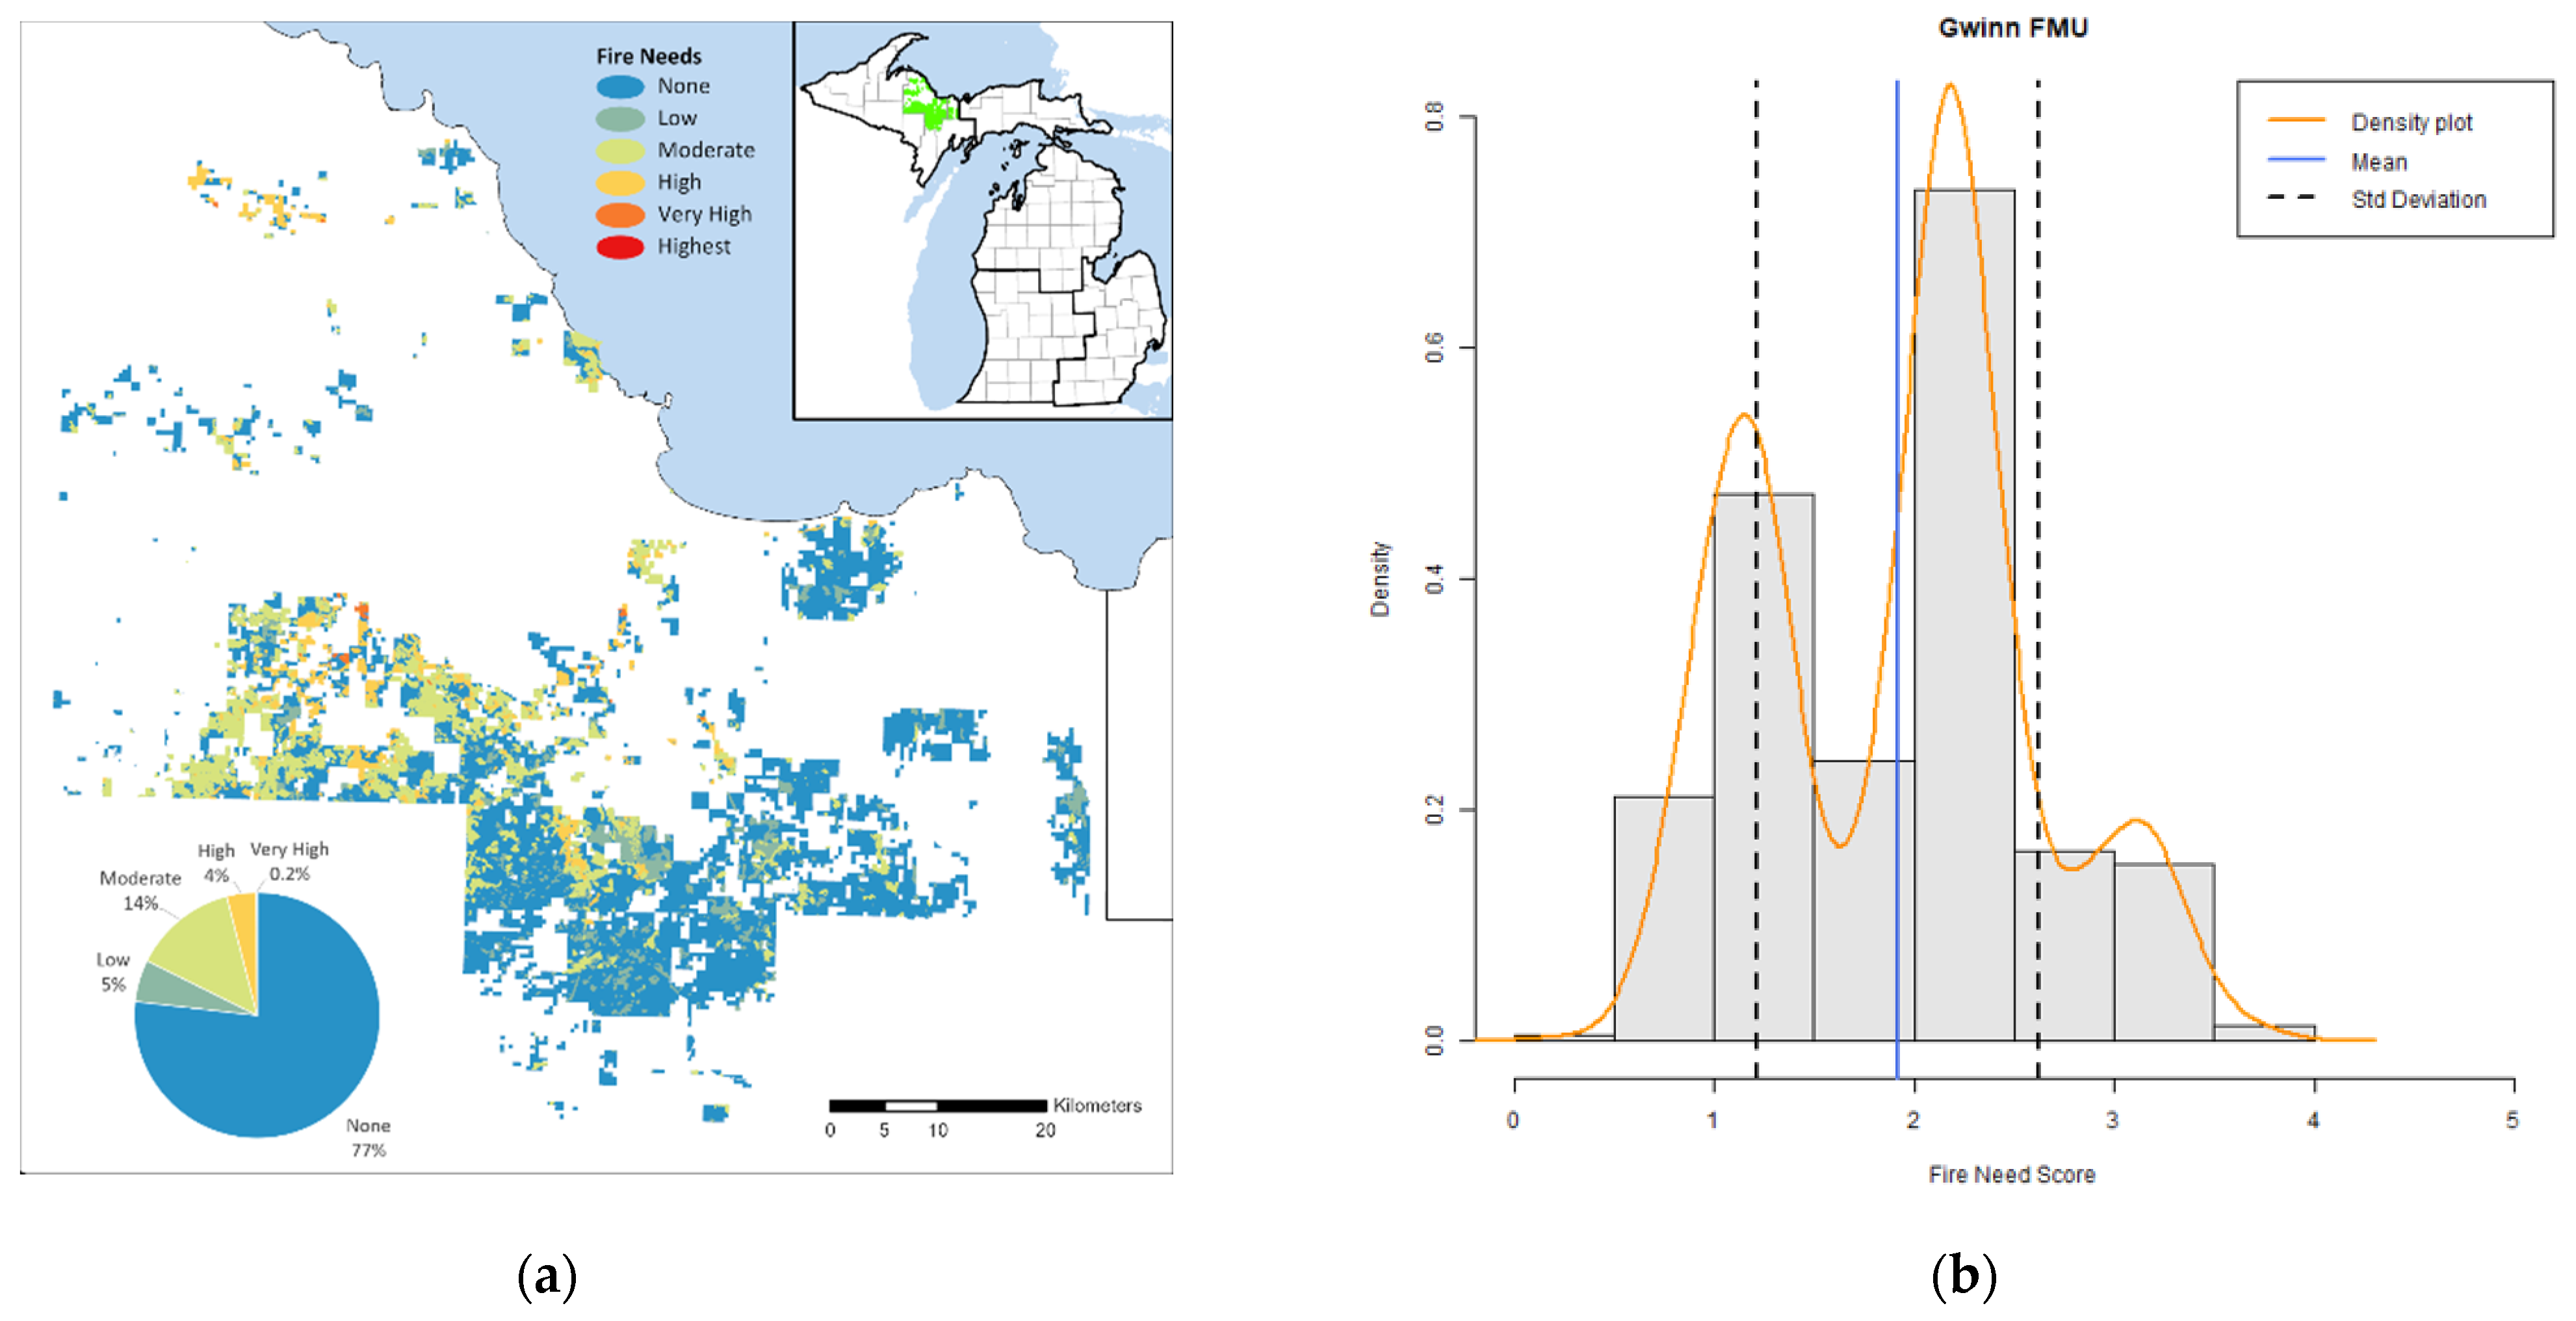
Appendix C.3. Gwinn Forest Management Unit


References
- Bowman, D.M.J.S.; Balch, J.K.; Artaxo, P.; Bond, W.J.; Carlson, J.M.; Cochrane, M.A.; D’Antonio, C.M.; DeFries, R.S.; Doyle, J.C.; Harrison, S.P.; et al. Fire in the earth system. Science 2009, 324, 481–484. [Google Scholar] [CrossRef]
- Christensen, N.L.; Bartuska, A.M.; Brown, J.H.; Carpenter, S.; D’Antonio, C.; Francis, R.; Franklin, J.F.; MacMahon, J.A.; Noss, R.F.; Parsons, D.J.; et al. The report of the Ecological Society of America committee on the scientific basis for ecosystem management. Ecol. Appl. 1996, 6, 665–691. [Google Scholar] [CrossRef] [Green Version]
- Packard, S.; Mutel, C.F. The Tallgrass Restoration Handbook for Prairies, Savannas, and Woodlands; Island Press: Washington, DC, USA, 1998; p. 463. [Google Scholar]
- Curtis, J.T. Vegetation of Wisconsin: An Ordination of Plant Communities; University of Wisconsin Press: Madison, WI, USA, 1959; p. 657. [Google Scholar]
- Dorney, J.R. The impact of Native Americans on presettlement vegetation in Southeastern Wisconsin. Trans. Wis. Acad. Sci. Arts Lett. 1981, 69, 26–36. [Google Scholar]
- Grimm, E.C. Fire and other factors controlling the Big Woods vegetation of Minnesota in the midnineteenth century. Ecol. Monogr. 1984, 54, 291–311. [Google Scholar] [CrossRef]
- Briggs, J.M.; Knapp, A.K.; Blair, J.M.; Heisler, J.L.; Hoch, G.A.; Lett, M.S.; McCarron, J.K. An ecosystem in transition: Causes and consequences of the conversion of mesic grassland to shrubland. Bioscience 2005, 55, 243–254. [Google Scholar] [CrossRef]
- Heinselman, M.L. Fire in the virgin forests of the Boundary Waters Canoe Area, Minnesota. J. Quat. Res. 1973, 3, 329–382. [Google Scholar] [CrossRef]
- Swain, A.M. A history of fire and vegetation in northeastern Minnesota as recorded in lake sediments. Quat. Res. 1973, 3, 383–396. [Google Scholar] [CrossRef]
- Heinselman, M.L. Fire intensity and frequency as factors in the distribution and structure of northern ecosystems. In Fire Regimes and Ecosystem Properties; Mooney, H., Bonnicksen, J.M., Christensen, N.L., Lotan, J.E., Reiners, W.A., Eds.; General Technical Report WO-26; U.S. Department of Agriculture, Forest Service: Washington, DC, USA, 1981; pp. 7–57. [Google Scholar]
- Chapman, K.A. An Ecological Investigation of Native Grassland in Southern Lower Michigan. Master’s Thesis, Western Michigan University, Kalamazoo, MI, USA, 1984. [Google Scholar]
- Whitney, G.C. Relation of Michigan’s presettlement pine forest to substrate and disturbance history. Ecology 1986, 67, 1548–1559. [Google Scholar] [CrossRef]
- Leitner, L.A.; Dunn, C.P.; Guntenspergen, G.R.; Stearns, F.; Sharpe, D.M. Effects of site, landscape features, and fire regime on vegetation patterns in presettlement southern Wisconsin. Landsc. Ecol. 1991, 5, 203–217. [Google Scholar] [CrossRef]
- Dickman, D.I.; Cleland, D.T. Fire Return Intervals and Fire Cycles for Historic Fire Regimes in the Great Lakes Region: A Synthesis of the Literature; Great Lakes Ecological Assessment, U.S. Forest Service, North Central Research Station: Saint Paul, MN, USA, 2002.
- Cleland, D.T.; Crow, T.R.; Saunders, S.C.; Dickmann, D.I.; Maclean, A.L.; Jordan, J.K.; Watson, R.L.; Sloan, A.M.; Brosofske, K.D. Characterizing historical and modern fire regimes in Michigan (USA): A landscape ecosystem approach. Landsc. Ecol. 2004, 19, 311–325. [Google Scholar] [CrossRef]
- Chapman, K.A.; Brewer, R. Prairies and savanna in southern Lower Michigan: History, classification, ecology. Mich. Bot. 2008, 47, 1–48. [Google Scholar]
- Nowacki, G.J.; Abrams, M.D. The demise of fire and “mesophication” of forests in the eastern United States. BioScience 2008, 58, 123–138. [Google Scholar] [CrossRef]
- Guyette, R.P.; Stambaugh, M.C.; Dey, D.C.; Muzika, R.-M. Predicting fire frequency with chemistry and climate. Ecosystems 2012, 15, 322–335. [Google Scholar] [CrossRef] [Green Version]
- Ryan, K.C.; Knapp, E.E.; Varner, J.M. Prescribed fire in North American forests and woodlands: History, current practice, and challenges. Front. Ecol. Environ. 2013, 11, e15–e24. [Google Scholar] [CrossRef]
- Abrams, M.D.; Nowacki, G.J. Global change impacts on forest and fire dynamics using paleoecology and tree census data for eastern North America. Ann. For. Sci. 2019, 76, 1–23. [Google Scholar] [CrossRef] [Green Version]
- Stout, A.B. The bur oak openings of southern Wisconsin. Trans. Wis. Acad. Sci. Arts Lett. 1946, 36, 141–161. [Google Scholar]
- Packard, S. Just a few oddball species: Restoration and the rediscovery of the tallgrass savanna. Restor. Manag. Notes 1988, 6, 13–20. [Google Scholar]
- Bronny, C. Chronicles of restoration. One-two punch: Grazing history and the recovery potential of oak savannas. Restor. Manag. Notes 1989, 7, 73–76. [Google Scholar] [CrossRef]
- Hutchinson, M.D. The barrens of the Midwest: An historical perspective. Castanea 1994, 59, 195–203. [Google Scholar]
- Abrams, M.D. Fire and the development of oak forests. BioScience 1992, 42, 346–353. [Google Scholar] [CrossRef]
- Alstad, A.O.; Damschen, E.I. Fire may mediate effects of landscape connectivity on plant community richness in prairie remnants. Ecography 2015, 39, 36–42. [Google Scholar] [CrossRef]
- Alstad, A.O.; Damschen, E.I.; Givnish, T.J.; Harrington, J.A.; Leach, M.K.; Rogers, D.A.; Waller, D.M. The pace of plant community change is accelerating in remnant prairies. Sci. Adv. 2016, 2, e1500975. [Google Scholar] [CrossRef] [Green Version]
- Ladwig, L.M.; Damschen, E.I.; Martin-Blangy, S.; Alstad, A.O. Grasslands maintained with frequent fire promote cold-tolerant species. J. Veg. Sci. 2018, 29, 541–549. [Google Scholar] [CrossRef]
- Nuzzo, V. Extent and status of Midwest oak savanna: Presettlement and 1985. Nat. Areas J. 1986, 6, 6–36. [Google Scholar]
- Sampson, F.; Knopf, F. Prairie conservation in North America. BioScience 1994, 44, 418–421. [Google Scholar] [CrossRef] [Green Version]
- Comer, P.J.; Albert, D.A.; Wells, H.A.; Hart, B.L.; Raab, J.B.; Price, D.L.; Kashian, D.M.; Corner, R.A.; Schuen, D.W. Michigan’s Native Landscape, As Interpreted from the GLO Surveys 1816-56; Michigan Natural Features Inventory: Lansing, MI, USA, 1995. [Google Scholar]
- Michigan Natural Features Inventory (MNFI). Michigan Natural Heritage Database; Michigan Natural Features Inventory, Michigan State University Extension: Lansing, MI, USA, 2020. [Google Scholar]
- Cottam, G. The phytosociology of an oak woods in southwestern Wisconsin. Ecology 1949, 30, 271–287. [Google Scholar] [CrossRef]
- Chapman, K.A.; White, M.A.; Huffman, M.R.; Faber-Langendoen, D. Ecology and Stewardship Guidelines for Oak Barrens Landscapes in the Upper Midwest. In Proceedings of the Midwest Oak Savanna Conference, Chicago, IL, USA, January 1993; Stearns, F., Holland, K., Eds.; U.S. Environmental Protection Agency: Chicago, IL, USA, 1993; pp. 1–29. [Google Scholar]
- Ratajczak, Z.; Nippert, J.B.; Collins, S.L. Woody encroachment decreases diversity across North American grasslands and savannas. Ecology 2012, 93, 697–703. [Google Scholar] [CrossRef]
- Anderson, R.C.; Bowles, M.L. Deep-soil savannas and barrens of the Midwestern United States. In Savannas, Barrens, and Rock Outcrop Plant Communities of North America; Anderson, R.C., Fralish, J.S., Baskin, J.M., Eds.; Cambridge University Press: Cambridge, UK, 1999; pp. 155–170. [Google Scholar]
- Bowles, M.; McBride, J.; Stynoff, N.; Johnson, K. Temporal changes in vegetation composition and structure in a fire-managed prairie fen. Nat. Areas J. 1996, 16, 275–278. [Google Scholar]
- Kost, M.A.; De Steven, D. Plant community responses to prescribed burning in Wisconsin sedge meadows. Nat. Areas J. 2000, 20, 36–45. [Google Scholar]
- Reich, P.B.; Abrams, M.D.; Ellsworth, D.S.; Kruger, E.L.; Tabone, T.J. Fire affects ecophysiology and community dynamics of Central Wisconsin oak forest regeneration. Ecology 1990, 71, 2179–2190. [Google Scholar] [CrossRef]
- Daubenmire, R. Ecology of fire in grasslands. Adv. Ecol. Res. 1968, 5, 209–266. [Google Scholar]
- Viro, P.J. Effects of forest fire on soil. In Fire and Ecosystems; Kozlowski, T.T., Ahlgren, C.E., Eds.; Academic Press: New York, NY, USA, 1974; pp. 7–45. [Google Scholar]
- Schmalzer, P.A.; Hinkle, C.R. Soil dynamics following fire in Juncus and Spartina marshes. Wetlands 1992, 12, 8–21. [Google Scholar] [CrossRef]
- Hulbert, L.C. Fire and litter effects in undisturbed bluestem prairie in Kansas. Ecology 1969, 50, 874–877. [Google Scholar] [CrossRef]
- Knapp, A.K. Post-burn differences in solar radiation, leaf temperature and water stress influencing production in a lowland tallgrass prairie. Am. J. Bot. 1984, 71, 220–227. [Google Scholar] [CrossRef]
- Tester, J.R. Effects of fire frequency on oak savanna in east-central Minnesota. Bull. Torrey Bot. Club 1989, 116, 134–144. [Google Scholar] [CrossRef]
- Anderson, R.C.; Schwegman, J.E. Twenty years of vegetational change on a southern Illinois Barren. Nat. Areas J. 1991, 11, 100–107. [Google Scholar]
- Warners, D.P. Plant Diversity in Sedge Meadows: Effects of Groundwater and Fire. Ph.D. Thesis, University of Michigan, Ann Arbor, MI, USA, 1997. [Google Scholar]
- Abrams, M.D.; Knapp, A.K.; Hulbert, L.C. A ten year record of aboveground biomass in a Kansas tallgrass prairie: Effects of fire and topographic position. Am. J. Bot. 1986, 73, 1509–1515. [Google Scholar] [CrossRef]
- Laubhan, M.K. Effects of prescribed fire on moist-soil vegetation and macronutrients. Wetlands 1995, 15, 159–166. [Google Scholar] [CrossRef]
- White, A.S. Prescribed Burning for Oak Savanna Restoration in Central Minnesota; Research Paper NC-266; U.S. Department of Agriculture, Forest Service, North Central Forest Experiment Station: Saint Paul, MN, USA, 1986.
- Abrams, M.D.; Hulbert, L.C. Effect of topographic position and fire on species composition in tall grass prairie in northeast Kansas. Am. Midl. Nat. 1987, 117, 442–445. [Google Scholar] [CrossRef]
- Collins, S.L.; Gibson, D.J. Effects of fire on community structure in tallgrass and mixed-grass prairie. In Fire in North American Tallgrass Prairies; Collins, S.L., Wallace, L.L., Eds.; University of Oklahoma Press: Norman, OK, USA, 1990; pp. 81–98. [Google Scholar]
- Glenn-Lewin, D.C.; Johnson, L.A.; Jurik, T.W.; Akey, A.; Leoschke, M.; Rosberg, T. Fire in central North American grasslands: Vegetative reproduction, seed germination, and seedling establishment. In Fire in North American Tallgrass Prairies; Collins, S.L., Wallace, L.L., Eds.; University of Oklahoma Press: Norman, OK, USA, 1990; pp. 28–45. [Google Scholar]
- Peterson, D.W.; Reich, P.B.; Wrage, K.J. Plant functional group responses to fire frequency and tree canopy cover gradients in oak savannas and woodlands. J. Veg. Sci. 2007, 18, 3–12. [Google Scholar] [CrossRef]
- Brose, P.H.; Dey, D.C.; Phillips, R.J.; Waldrop, T.A. A meta-analysis of the fire-oak hypothesis: Does prescribed burning promote oak reproduction in eastern North America? For. Sci. 2013, 59, 322–334. [Google Scholar] [CrossRef] [Green Version]
- Lehman, C.E.R.; Anderson, T.M.; Sankaran, M.; Higgins, S.I.; Archibald, S.; Hoffmann, W.A.; Hanan, N.P.; Williams, R.J.; Fensham, R.J.; Felfili, J.; et al. Savanna vegetation-fire-climate relationships differ among continents. Science 2014, 343, 548–552. [Google Scholar] [CrossRef] [PubMed]
- Leach, M.K.; Givnish, T.J. Ecological determinants of species loss in remnant prairies. Science 1996, 273, 1555–1558. [Google Scholar] [CrossRef]
- Cavender-Bares, J.; Reich, P.B. Shocks to the system: Community assembly of the oak savanna in a 40-year fire frequency experiment. Ecology 2012, 93, S52–S69. [Google Scholar] [CrossRef]
- Bowles, M.; Jones, M.D. Repeated burning of eastern tallgrass prairie increases richness and diversity, stabilizing late successional vegetation. Ecol. Appl. 2013, 23, 464–478. [Google Scholar] [CrossRef]
- Grundel, R.; Jean, R.P.; Frohnapple, K.J.; Glowacki, G.A.; Scott, P.E.; Pavlovic, N.B. Floral and nesting resources, habitat structure, and fire influence bee distribution across an open-forest gradient. Ecol. Appl. 2010, 20, 1678–1692. [Google Scholar] [CrossRef]
- Lettow, M.C.; Brudvig, L.A.; Bahlai, C.A.; Gibbs, J.; Jean, R.P.; Landis, D.A. Bee community responses to a gradient of oak savanna restoration practices. Restor. Ecol. 2018, 26, 882–890. [Google Scholar] [CrossRef]
- Hartung, S.C.; Brawn, J.D. Effects of savanna restoration on the foraging ecology of insectivorous songbirds. Condor 2005, 107, 879–888. [Google Scholar] [CrossRef]
- Grundel, R.; Pavlovic, N.B. Response of bird species densities to habitat structure and fire history along a Midwestern open-forest gradient. Condor 2007, 109, 734–749. [Google Scholar] [CrossRef]
- Au, L.; Anderson, D.E.; Davis, M. Patterns in bird community structure related to restoration of Minnesota dry oak savannas and across a prairie to oak woodland ecological gradient. Nat. Areas J. 2008, 28, 330–341. [Google Scholar] [CrossRef]
- Holoubek, N.S.; Jensen, W.E. Avian occupancy varies with habitat structure in oak savanna of the South-Central United States. J. Wildl. Manag. 2015, 79, 458–468. [Google Scholar] [CrossRef]
- Larsen, A.L.; Jacquot, J.J.; Keenlance, P.W.; Keough, H.L. Effects of an ongoing oak savanna restoration on small mammals in Lower Michigan. For. Ecol. Manag. 2016, 367, 120–127. [Google Scholar] [CrossRef]
- Anderson, S.H. Effects of the 1976 Seney National Wildlife Refuge Wildfire on Wildlife and Wildlife Habitat; Resource Publication 146; U.S. Department of Interior, U.S. Fish and Wildlife Service: Washington, DC, USA, 1982.
- Vogl, R.J.; Beck, A.M. Response of white-tailed deer to a Wisconsin Wildfire. Am. Midl. Nat. 1970, 84, 270–273. [Google Scholar] [CrossRef]
- Harper, C.A.; Ford, W.M.; Lashley, M.A.; Moorman, C.E.; Stambaugh, M.C. Fire effects on wildlife in the Central Hardwoods and Appalachian Regions, USA. Fire Ecol. 2016, 12, 127–159. [Google Scholar] [CrossRef]
- Marc, D.; Abrams, M.D.; Nowacki, G.J.; Gregory, J. Native Americans as active and passive promoters of mast and fruit trees in the eastern USA. Holocene 2008, 18, 1123–1137. [Google Scholar] [CrossRef]
- Leverkus, S.E.R.; Fuhlendorf, S.D.; Geertsema, M.; Allred, B.W.; Gregory, M.; Bevington, A.R.; Engle, D.M.; Scasta, J.D. Resource selection of free-ranging horses influenced by fire in northern Canada. Hum. Wildl. Interact. 2018, 12, 85–101. [Google Scholar] [CrossRef]
- Quinn-Davidson, L.N.; Morgan Varner, J. Impediments to prescribed fire across agency, landscape and manager: An example from northern California. Int. J. Wildland Fire 2011, 21, 210–218. [Google Scholar] [CrossRef]
- McGowan-Stinski, J.; Pearsall, D.; Sobaski. Fire needs assessment for portfolio areas within Michigan. In Proceedings of the Tallgrass Prairie and Oak Savanna Regional Fire Conference, Dubuque, IA, USA, 31 January 2013.
- Hmielowski, T.L. Assessing Needs. Where Should We Burn? A Fire Needs Assessment for Wisconsin. In LANDFIRE Joint Fire Science Program Webinar Series. Tallgrass Prairie and Oak Savanna Fire Science Consortium and Lakes State Fire Science Consortium. Available online: http://lakestatesfiresci.net/docs/LSFSC_Oct82014_Assessing%20Needs%20Hmielowski_TPOS_LS%20FINAL.pdf (accessed on 1 October 2020).
- Hmielowski, T.L.; Carter, S.K.; Spaul, H.; Helmers, D.; Radeloff, V.C.; Zedler, P. Prioritizing land management efforts at a landscape scale: A case study using prescribed fire in Wisconsin. Ecol. Appl. 2016, 26, 1018–1029. [Google Scholar] [CrossRef] [Green Version]
- Saxton, M.; Kleiman, B.; Walk, J.; Hagen, S. Illinois Fire Needs Assessment; Illinois Prescribed Fire Council: Franklin Grove, IL, USA, 2016. [Google Scholar]
- LANDFIRE. Existing Vegetation Type Layer, LANDFIRE 1.1.0.; U.S. Department of the Interior, Geological Survey: Washington, DC, USA, 2008. Available online: http://landfire.cr.usgs.gov/viewer/ (accessed on 20 August 2018).
- Rollins, M.G. LANDFIRE: A nationally consistent vegetation, wildland fire, and fuel assessment. Int. J. Wildland Fire 2009, 18, 235–249. [Google Scholar] [CrossRef] [Green Version]
- Brubaker, L.B. Postglacial forest patterns associated with till and outwash in northcentral Upper Michigan. Quat. Res. 1975, 5, 499–527. [Google Scholar] [CrossRef]
- Dorr, J.A.; Eschman, D.F. Geology of Michigan; University of Michigan Press: Ann Arbor, MI, USA, 1984; p. 488. [Google Scholar]
- Fisher, J.H. Pre-European Settlement Forest of Northern Lower Michigan: The Role of Landform in Determining Composition Across the Landscape. Master’s Thesis, Michigan State University, East Lansing, MI, USA, 1994. [Google Scholar]
- Albert, D.A. Regional Landscape Ecosystems of Michigan, Minnesota, and Wisconsin: A Working Map and Classification; USDA, Forest Service, North Central Forest Experiment Station: Saint Paul, MN, USA, 1995.
- Schaetzl, R.J.; Enander, H.; Luehmann, D.; Lusch, D.P.; Fish, C.; Bigsby, M.; Steigmeyer, M.; Guasco, J.; Forgacs, C.; Pollyea, A. Mapping the physiography of Michigan with GIS. Phys. Geogr. 2013, 34, 2–39. [Google Scholar] [CrossRef]
- Schulte, L.A.; Mladenoff, D.J.; Burrows, S.N.; Sickley, T.A.; Nordheim, E.V. Spatial Controls of Pre–Euro-American Wind and Fire Disturbance in Northern Wisconsin (USA) Forest Landscapes. Ecosystems 2005, 8, 73–94. [Google Scholar] [CrossRef]
- Drever, C.R.; Drever, M.C.; Messier, C.; Bergeron, Y.; Flannigan, M. Fire and the relative roles of weather, climate, and landscape characteristics in the Great Lakes-St. Lawrence forest of Canada. J. Veg. Sci. 2008, 19, 57–66. [Google Scholar] [CrossRef] [Green Version]
- Collins, S.L. Disturbance frequency and community stability in native tallgrass prairie. Am. Midl. Nat. 2000, 155, 311–325. [Google Scholar] [CrossRef] [PubMed]
- Peterson, D.W.; Reich, P.B. Prescribed fire in oak savanna: Fire frequency effects on stand structure and dynamics. Ecol. Appl. 2001, 11, 914–927. [Google Scholar] [CrossRef]
- Briggs, J.M.; Knapp, A.K.; Brock, B.L. Expansion of woody plants in tallgrass prairie: A fifteen year study of fire and fire-grazing interactions. Am. Midl. Nat. 2002, 147, 287–294. [Google Scholar] [CrossRef]
- Peterson, D.W.; Reich, P.B. Fire frequency and tree canopy structure influence plant species diversity in a forest grassland ecotone. Plant Ecol. 2008, 194, 5–16. [Google Scholar] [CrossRef]
- Schmidt, K.M.; Menakis, J.P.; Hardy, C.C.; Hann, W.J.; Bunnell, D.L. Development of Coarse-Scale Spatial Data for Wildland Fire and Fuel Management; General Technical Report RMRS-GTR-87; U.S. Department of Agriculture, Forest Service, Rocky Mountain Research Station: Fort Collins, CO, USA, 2002.
- Collins, R.A. Old-Growth Red Pine in Lower Michigan. Master’s Thesis, University of Michigan, Ann Arbor, MI, USA, 1958. [Google Scholar]
- U.S. Department of Agriculture, Forest Service (USDA, FS). Fire Effects Information System; [Web Application]; U.S. Department of Agriculture, Forest Service, Rocky Mountain Research Station, Missoula Fire Sciences Laboratory: Missoula, MT, USA, 2020. Available online: https://www.feis-crs.org/feis/ (accessed on 1 January 2018).
- Michigan Department of Natural Resources (MDNR). Michigan Forest Inventory Database; Michigan Department of Natural Resources: Lansing, MI, USA, 2020.
- Eichenlaub, V. Weather and Climate of the Great Lakes Region; University of Notre Dame Press: Notre Dame, IN, USA, 1979; p. 352. [Google Scholar]
- Cohen, J.G.; Kost, M.A.; Slaughter, B.S.; Albert, D.A. A Field Guide to the Natural Communities of Michigan; Michigan State University Press: East Lansing, MI, USA, 2015; p. 362. [Google Scholar]
- Cohen, J.G.; Kost, M.A.; Slaughter, B.S.; Albert, D.A.; Lincoln, J.M.; Kortenhoven, A.P.; Wilton, C.M.; Enander, H.D.; Korroch, K.M. Michigan Natural Community Classification; Michigan Natural Features Inventory, Michigan State University Extension: Lansing, MI, USA, 2020; Available online: https://mnfi.anr.msu.edu/communities/classification (accessed on 18 December 2020).
- Farrand, W.R.; Bell, D.L. Quaternary Geology of Northern Michigan; Michigan Department of Natural Resources, Geological Survey Division: Lansing, MI, USA, 1982.
- Farrand, W.R.; Bell, D.L. Quaternary Geology of Southern Michigan; Michigan Department of Natural Resources, Geological Survey Division: Lansing, MI, USA, 1982; 1:500,000 scale map.
- Michigan Natural Features Inventory and Michigan Department of Natural Resources (MNFI and MDNR). Quarternary/Surficial Geology of Michigan. Vector Digital Data Set of Farrand and Bell, 1982; Michigan Natural Features Inventory and Michigan Department of Natural Resources: Lansing, MI, USA, 1998. [Google Scholar]
- LANDFIRE. Vegetation Condition Class (VCC) Layer, LANDFIRE 1.1.0.; U.S. Department of the Interior, Geological Survey: Washington, DC, USA, 2008. Available online: http://landfire.cr.usgs.gov/viewer/ (accessed on 20 August 2018).
- U.S. Geological Survey (USGS). National Map 3D Elevation Program. 1-Arc-Second Seamless Digital Elevation Model (30 m Raster); U.S. Geological Survey: Reston, VA, USA, 2017. Available online: http://nationalmap.gov/3DEP/3dep_prodserv.html (accessed on 20 August 2018).
- U.S. Department of Agriculture, Natural Resources Conservation Services (USDA, NRCS). The PLANTS Database; National Plant Data Team: Greensboro, NC, USA, 2020. Available online: http://plants.usda.gov (accessed on 1 January 2018).
- Michigan Natural Features Inventory (MNFI). Rare Species Explorer; Michigan Natural Features Inventory, Michigan State University Extension: Lansing, MI, USA, 2020; Available online: https://mnfi.anr.msu.edu/species (accessed on 18 December 2020).
- Malczewski, J. GIS-based multicriteria decision analysis: A survey of the literature. Int. J. Geogr. Inf. Sci. 2006, 20, 703–726. [Google Scholar] [CrossRef]
- Malczewski, J.; Jankowski, P. Emerging trends and research frontiers in spatial multicriteria analysis. Int. J. Geogr. Inf. Sci. 2020, 34, 1257–1282. [Google Scholar] [CrossRef]
- R Core Team. R: A Language and Environment for Statistical Computing; R Foundation for Statistical Computing v.3.5.2: Vienna, Austria, 2018; Available online: https://www.r-project.org (accessed on 15 December 2020).
- Transeau, E.N. The prairie peninsula. Ecology 1935, 16, 423–437. [Google Scholar] [CrossRef]
- Hoekstra, J.M.; Boucher, T.M.; Ricketts, T.H.; Roberts, C. Confronting a biome crisis: Global disparities of habitat loss and protection. Ecol. Lett. 2005, 8, 23–29. [Google Scholar] [CrossRef]
- Bowles, M.L. Thinning effects on canopy structure and ground layer diversity in a burned mesic oak savanna. J. Torrey Bot. Soc. 2017, 144, 191–205. [Google Scholar] [CrossRef]
- Bassett, T.J.; Landis, D.A.; Brudvig, L.A. Effects of experimental prescribed fire and tree thinning on oak savanna understory plant communities and ecosystem structure. For. Ecol. Manag. 2020, 464, 118047. [Google Scholar] [CrossRef]
- Meunier, J.; Shea, M.E. Applying the usual rules to an unusual ecological situation: Fire rotation in Great Lakes pine forests. For. Ecol. Manag. 2020, 472, 1–11. [Google Scholar] [CrossRef]
- Taleai, M.; Mansourian, A. Using Delphi-AHP Method to survey major factors causing urban plan implementation failure. J. Appl. Sci. 2008, 8, 2746–2751. [Google Scholar] [CrossRef] [Green Version]
- Saaty, T.L. The Analytic Hierarchy Process; McGraw-Hill Press: New York, NY, USA, 1980. [Google Scholar]
- Ho, W. Integrated analytic hierarchy process and its applications—A literature review. Eur. J. Oper. Res. 2008, 186, 211–228. [Google Scholar] [CrossRef]
- NatureServe. International Ecological Classification Standard: Terrestrial Ecological Classifications; NatureServe Central Databases, NatureServe: Arlington, VA, USA, 2018. [Google Scholar]
- Cohen, J.G.; Wilton, C.M.; Enander, H.D. Prescribed Fire Needs Assessment; Michigan Natural Features Inventory, Michigan State University Extension: Lansing, MI, USA, 2019. [Google Scholar]
- Vitousek, P.M.; D’Antonio, C.M.; Loope, L.L.; Rejmanek, M.; Westbrook, R. Introduced species: A significant component of human-caused global change. N. Z. J. Ecol. 1997, 21, 1–16. [Google Scholar]
- Vila, M.; Espinar, J.L.; Hejda, M.; Hulme, P.E.; Jarosik, V.; Pergl, J.; Schaffner, U.; Sum, Y.; Pysek, P. Ecological impacts of invasive alien plants: A meta-analysis of their effects on species, communities and ecosystems. Ecol. Lett. 2011, 14, 702–708. [Google Scholar] [CrossRef]
- Haddad, N.M.; Brudvig, L.A.; Clobert, J.; Davies, K.F.; Gonzalez, A.; Holt, R.D.; Lovejoy, T.E.; Sexton, J.O.; Austin, M.P.; Collins, C.D.; et al. Habitat fragmentation and its lasting impact on Earth’s ecosystems. Sci. Adv. 2015, 1, e1500052. [Google Scholar] [CrossRef] [PubMed] [Green Version]
- Nunez, S.; Arets, E.; Alkemadel, R.; Verwer, C.; Leemans, R. Assessing the impacts of climate change on biodiversity: Is below 2 °C enough? Clim. Chang. 2019, 154, 351–365. [Google Scholar] [CrossRef] [Green Version]
- Reschke, C.; Reid, R.; Jones, J.; Feeney, T.; Potter, H. Conserving Great Lakes Alvar: Final Technical Report of the International Alvar Conservation Initiative; The Nature Conservancy: Chicago, IL, USA, 1999. [Google Scholar]
- Jones, J.; Reschke, C. The role of fire in Great Lakes alvar landscapes. Mich. Bot. 2005, 44, 13–27. [Google Scholar]
- Catling, P.M.; Brownell, V.R. Importance of fire in the maintenance of distinctive, high diversity plant communities on alvars —Evidence from the Burnt Lands, eastern Ontario. Can. Field Nat. 1998, 112, 662–667. [Google Scholar]
- Camill, P.; Barry, A.; Williams, E.; Andreassi, C.; Limmer, J.; Solick, D. Climate-vegetation-fire interactions and their impact on long-term carbon dynamics in a boreal peatland landscape in northern Manitoba, Canada. J. Geophys. Res. Biogeosci. 2009, 114, 1–10. [Google Scholar] [CrossRef]
- Wieder, R.K.; Scott, K.; Kamminga, K.; Vile, M.A.; Vitt, D.H.; Bone, T.; Xu, B.; Benscoter, B.W.; Bhatti, J.S. Postfire carbon balance in boreal bogs of Alberta, Canada. Glob. Chang. Biol. 2009, 15, 63–81. [Google Scholar] [CrossRef]
- Bergeron, Y.; Gauthier, S.; Flannigan, M.; Kafka, V. Fire regimes at the transition between mixedwood and coniferous boreal forest in northwestern Quebec. Ecology 2004, 85, 1916–1932. [Google Scholar] [CrossRef]
- Simard, A.J.; Blank, R.W. Fire history of a Michigan jack pine forest. Mich. Acad. 1982, 15, 59–71. [Google Scholar]
- Drobyshev, I.; Charles Goebel, P.; Hix, D.M.; Gregory Corace, R.; Semko-Duncan, M.E. Pre- and post-European settlement fire history of red pine dominated forest ecosystems of Seney National Wildlife Refuge, Upper Michigan. Can. J. For. Res. 2008, 2497–2514. [Google Scholar] [CrossRef]
- Meunier, J.; Holoubek, N.S.; Sebasky, M. Fire regime characteristics in relation to physiography at local and landscape scales in Lake States pine forest. For. Ecol. Manag. 2019, 454, 1–8. [Google Scholar] [CrossRef]
- Zhang, Q.; Pregitzer, K.S.; Reed, D.D. Catastrophic disturbance in the presettlement forests of the Upper Peninsula of Michigan. Can. J. For. Res. 1999, 106–114. [Google Scholar] [CrossRef]
- Chapman, K.A.; Dunevitz, V.L.; Kuhn, H.T. Vegetation and chemical analysis of a salt marsh in Clinton County, Michigan. Mich. Bot. 1985, 24, 135–144. [Google Scholar]
- Snyder, S.A. Cephalanthus occidentalis. In Fire Effects Information System; [Web Application]; U.S. Department of Agriculture, Forest Service, Rocky Mountain Research Station, Missoula Fire Sciences Laboratory: Missoula, MT, USA, 1991. Available online: https://www.feis-crs.org/feis/ (accessed on 20 November 2008).
- Wolf, J. A 200-year fire history in a remnant oak savanna in southeastern Wisconsin. Am. Midl. Nat. 2004, 152, 201–213. [Google Scholar] [CrossRef]
- Frelich, L.; Lorimer, C. Natural Disturbance Regimes in Hemlock-Hardwood Forests of the Upper Great Lakes Region. Ecol. Monogr. 1991, 61, 145–164. [Google Scholar] [CrossRef]
- Minnesota Department of Natural Resources (MNDNR). Field Guide to the Native Plant Communities of Minnesota: The Laurentian Mixed Forest Province; Ecological Land Classification Program, MNDNR, Minnesota County Biological Survey, and Natural Heritage and Nongame Research Program: Saint Paul, MN, USA, 2003. [Google Scholar]
- Davis, A.M. Wetland succession, fire and the pollen record: A Midwestern example. Am. Midl. Nat. 1979, 102, 86–94. [Google Scholar] [CrossRef]
- Faber-Langendoen, D.; Davis, M.A. Effects of fire frequency on tree canopy cover at Allison Savanna, eastcentral Minnesota, USA. Nat. Areas J. 1995, 15, 319–328. [Google Scholar]
- Kost, M.A.; Hyde, D.A. Exploring the Prairie Fen Wetlands of Michigan; Extension Bulletin E-3045; Michigan Natural Features Inventory, Michigan State University Extension: East Lansing, MI, USA, 2019. [Google Scholar]
- Zhang, Q.; Pregitzer, K.S.; Reed, D.D. Historical changes in the forests of the Luce District of the Upper Peninsula of Michigan. Am. Midl. Nat. 2000, 143, 94–110. [Google Scholar] [CrossRef]


| Cover Type | Natural Community Type | Scale of Fire Dependence | Fire Frequency Range |
|---|---|---|---|
| Warm Season Grass | Dry-Mesic Prairie | Extremely Fire Dependent | 1–5 Years |
| Oak Types | Oak-Pine Barrens | Very Fire Dependent | 5–20 Years |
| Mixed Oak Forest | Dry-Mesic Southern Forest | Fire Dependent | 10–20 Years |
| Fen | Prairie Fen | Fire Dependent | 20–100 Years |
| Mixed Pine Forest | Dry-Mesic Northern Forest | Fire Dependent | 100–300 Years |
| Lowland Shrub | Bog | Fire Sensitive | 100–500 Years |
| Lowland Maple | Floodplain Forest | Fire Neutral | 500–1000 Years |
| Emergent Wetland | Emergent Marsh | Fire Neutral | 500–1000 Years |
| Lowland Cedar | Rich Conifer Swamp | Extremely Fire Sensitive | >1000 Years |
| Mixed Northern Hardwoods | Mesic Northern Forest | Extremely Fire Sensitive | >1000 Years |
| Sugar Maple Association | Mesic Southern Forest | Extremely Fire Sensitive | >1000 Years |
| Fire Frequency Range | Fire Needs Score | Rule |
|---|---|---|
| >1000 Years | 0 | If Fire Frequency Range ≥ 1000 Years, THEN + 0 |
| Not Applicable | 0 | If Fire Frequency Range = Not Applicable, THEN + 0 |
| 80–300 Years | 1 | If Fire Frequency Range = 80–300 Years, THEN + 1 |
| 50–100 Years | 2 | If Fire Frequency Range = 50–100 Years, THEN + 2 |
| 20–100 Years | 3 | If Fire Frequency Range = 20–100 Years, THEN + 3 |
| 10–80 Years | 4 | If Fire Frequency Range = 10–80 Years, THEN + 4 |
| 1–20 Years | 5 | If Fire Frequency Range = 1–20 Years, THEN + 5 |
| Scientific Name | Common Name | Fire Tolerant | Fire Dependent | Fire-Dependent Habitat | Fire Needs Score |
|---|---|---|---|---|---|
| Ambystoma opacum | Marbled salamander | No | No | No | −5 |
| Ammodramus savannarum | Grasshopper sparrow | Yes | No | Yes | 3 |
| Amorpha canescens | Leadplant | No | No | Yes | 5 |
| Asclepia sullivantii | Sullivant’s milkweed | No | No | Yes | 3 |
| Atrytonopsis hianna | Dusted skipper | No | No | Yes | 5 * |
| Botaurus lentiginosus | American bittern | Yes | No | No | 0 |
| Scientific Name | Common Name | Category of Species | Fire Needs Score |
|---|---|---|---|
| Fraxinus nigra | Black ash | Fire-sensitive desirable native | −5 |
| Ailanthus altissima | Tree-of-Heaven | Fire-tolerant invasive | −1 |
| Acer rubrum | Red maple | Undesirable native | −5 * |
| Ligustrum vulgare | Common privet | Fire-sensitive invasive | 5 |
| Quercus macrocarpa | Bur oak | Fire-tolerant and fire dependent native | 5 |
| Lupinus perennis | Wild lupine | Fire-dependent native | 5 |
| Elaegnus umbellata | Autumn olive | Somewhat fire-sensitive invasive | 0 |
| Extent | Mean Fire Needs Score (Excluding Zero Values) | Standard Deviation (Excluding Zero Values) | Sample Size (Excluding Zero Values) | Number of Fires from 2007 to 2020 | Average Area Burned from 2016 to 2020 (Excluding 2020) |
|---|---|---|---|---|---|
| Michigan | 0.97 (2.32) | 1.28 (0.89) | 178,471 (74,743) | 849 | 2233 ha (2791 ha) |
| SW Region | 1.96 (3.47)) | 1.89 (1.06) | 10,744 (6089) | 248 | 586 ha (732 ha) |
| SE Region | 1.64 (3.01) | 1.73 (1.16) | 7909 (4294) | 219 | 579 ha (723 ha) |
| NLP Region | 1.07 (2.25) | 1.23 (0.72) | 91,080 (43,340) | 281 | 839 ha (1049 ha) |
| EUP Region | 0.72 (2.08) | 1.08 (0.74) | 36,297 (12,656) | 52 | 134 ha (168 ha) |
| WUP Region | 0.49 (1.91) | 0.91 (0.69) | 32,441 (8364) | 49 | 95 ha (118 ha) |
| Allegan SGA | 2.79 (3.80) | 1.84 (0.87) | 2260 (1660) | 140 | 204 ha (255 ha) |
| Port Huron SGA | 1.01 (2.74) | 1.47 (1.07) | 346 (127) | 1 | 5 ha (5 ha) |
| Gwinn FMU | 0.52 (1.92) | 0.93 (0.71) | 11,203 (3048) | 17 | 5 ha (5 ha) |
| Extent | Highest | Very High | High | Moderate | Low | None |
|---|---|---|---|---|---|---|
| Michigan | 4359 ha (0.2%) | 74,309 ha (4%) | 205,632 ha (11%) | 285,585 ha (16%) | 122,068 ha (7%) | 1,118,211 ha (62%) |
| SW Region | 2777 ha (3%) | 34,582 ha (41%) | 2393 ha (3%) | 3457 ha (4%) | 5024 ha (6%) | 36,106 ha (43%) |
| SE Region | 1493 ha (1.8%) | 14,346 ha (17%) | 5796 ha (7%) | 4759 ha (6%) | 12,050 ha (14%) | 44,364 ha (54%) |
| NLP Region | 89 ha (0.01%) | 23,594 ha (2.8%) | 147,180 ha (17%) | 165,666 ha (20%) | 48,540 ha (6%) | 459,928 ha (54%) |
| EUP Region | 0 ha (0%) | 787 ha (0.18%) | 38,726 ha (9%) | 64,681 ha (15%) | 37,705 ha (9%) | 293,401 ha (67%) |
| WUP Region | 0 ha (0%) | 1000 ha (0.3%) | 11,537 ha (3%) | 47,022 ha (13%) | 18,748 ha (5%) | 284,413 ha (79%) |
| Management Area | Management Region | Number of Prescribed Fires | Number of Prescribed Fires by Area | Mean Fire Needs Score |
|---|---|---|---|---|
| Allegan SGA | SW | 140 | 3.83 | 2.79 |
| Brownstown Prairie SWA | SE | 0 | 0 | 3.76 |
| Davisburg SGA | SE | 0 | 0 | 3.22 |
| Escanaba FMU | WUP | 18 | 0.48 | 0.56 |
| Gagetown SGA | SE | 11 | 16.21 | 0.84 |
| Gaylord FMU | NLP | 24 | 0.35 | 0.58 |
| Goose Lake SGA | SE | 0 | 0 | 2.63 |
| Gwinn FMU | WUP | 17 | 0.26 | 0.52 |
| Haymarsh Lake SGA | SW | 13 | 10.28 | 0.77 |
| Langston SGA | SW | 0 | 0 | 2.73 |
| Newberry FMU | EUP | 12 | 0.87 | 0.87 |
| Petersburg SGA | SE | 25 | 56.93 | 3.02 |
| Pigeon River FMU | NLP | 12 | 0.68 | 0.94 |
| Port Huron SGA | SE | 1 | 0.53 | 1.01 |
| Saranac-Lowell SGA | SW | 0 | 0 | 2.70 |
| Sault Sainte Marie FMU | EUP | 16 | 0.26 | 0.37 |
| Shingleton FMU | EUP | 24 | 0.17 | 0.87 |
| Traverse City FMU | NLP | 43 | 0.33 | 0.89 |
| Verona SGA | SE | 43 | 15.86 | 0.75 |
Publisher’s Note: MDPI stays neutral with regard to jurisdictional claims in published maps and institutional affiliations. |
© 2021 by the authors. Licensee MDPI, Basel, Switzerland. This article is an open access article distributed under the terms and conditions of the Creative Commons Attribution (CC BY) license (http://creativecommons.org/licenses/by/4.0/).
Share and Cite
Cohen, J.G.; Wilton, C.M.; Enander, H.D.; Bassett, T.J. Assessing the Ecological Need for Prescribed Fire in Michigan Using GIS-Based Multicriteria Decision Analysis: Igniting Fire Gaps. Diversity 2021, 13, 100. https://0-doi-org.brum.beds.ac.uk/10.3390/d13030100
Cohen JG, Wilton CM, Enander HD, Bassett TJ. Assessing the Ecological Need for Prescribed Fire in Michigan Using GIS-Based Multicriteria Decision Analysis: Igniting Fire Gaps. Diversity. 2021; 13(3):100. https://0-doi-org.brum.beds.ac.uk/10.3390/d13030100
Chicago/Turabian StyleCohen, Joshua G., Clay M. Wilton, Helen D. Enander, and Tyler J. Bassett. 2021. "Assessing the Ecological Need for Prescribed Fire in Michigan Using GIS-Based Multicriteria Decision Analysis: Igniting Fire Gaps" Diversity 13, no. 3: 100. https://0-doi-org.brum.beds.ac.uk/10.3390/d13030100