Article

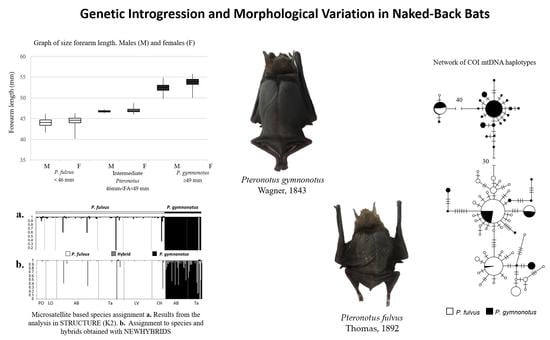
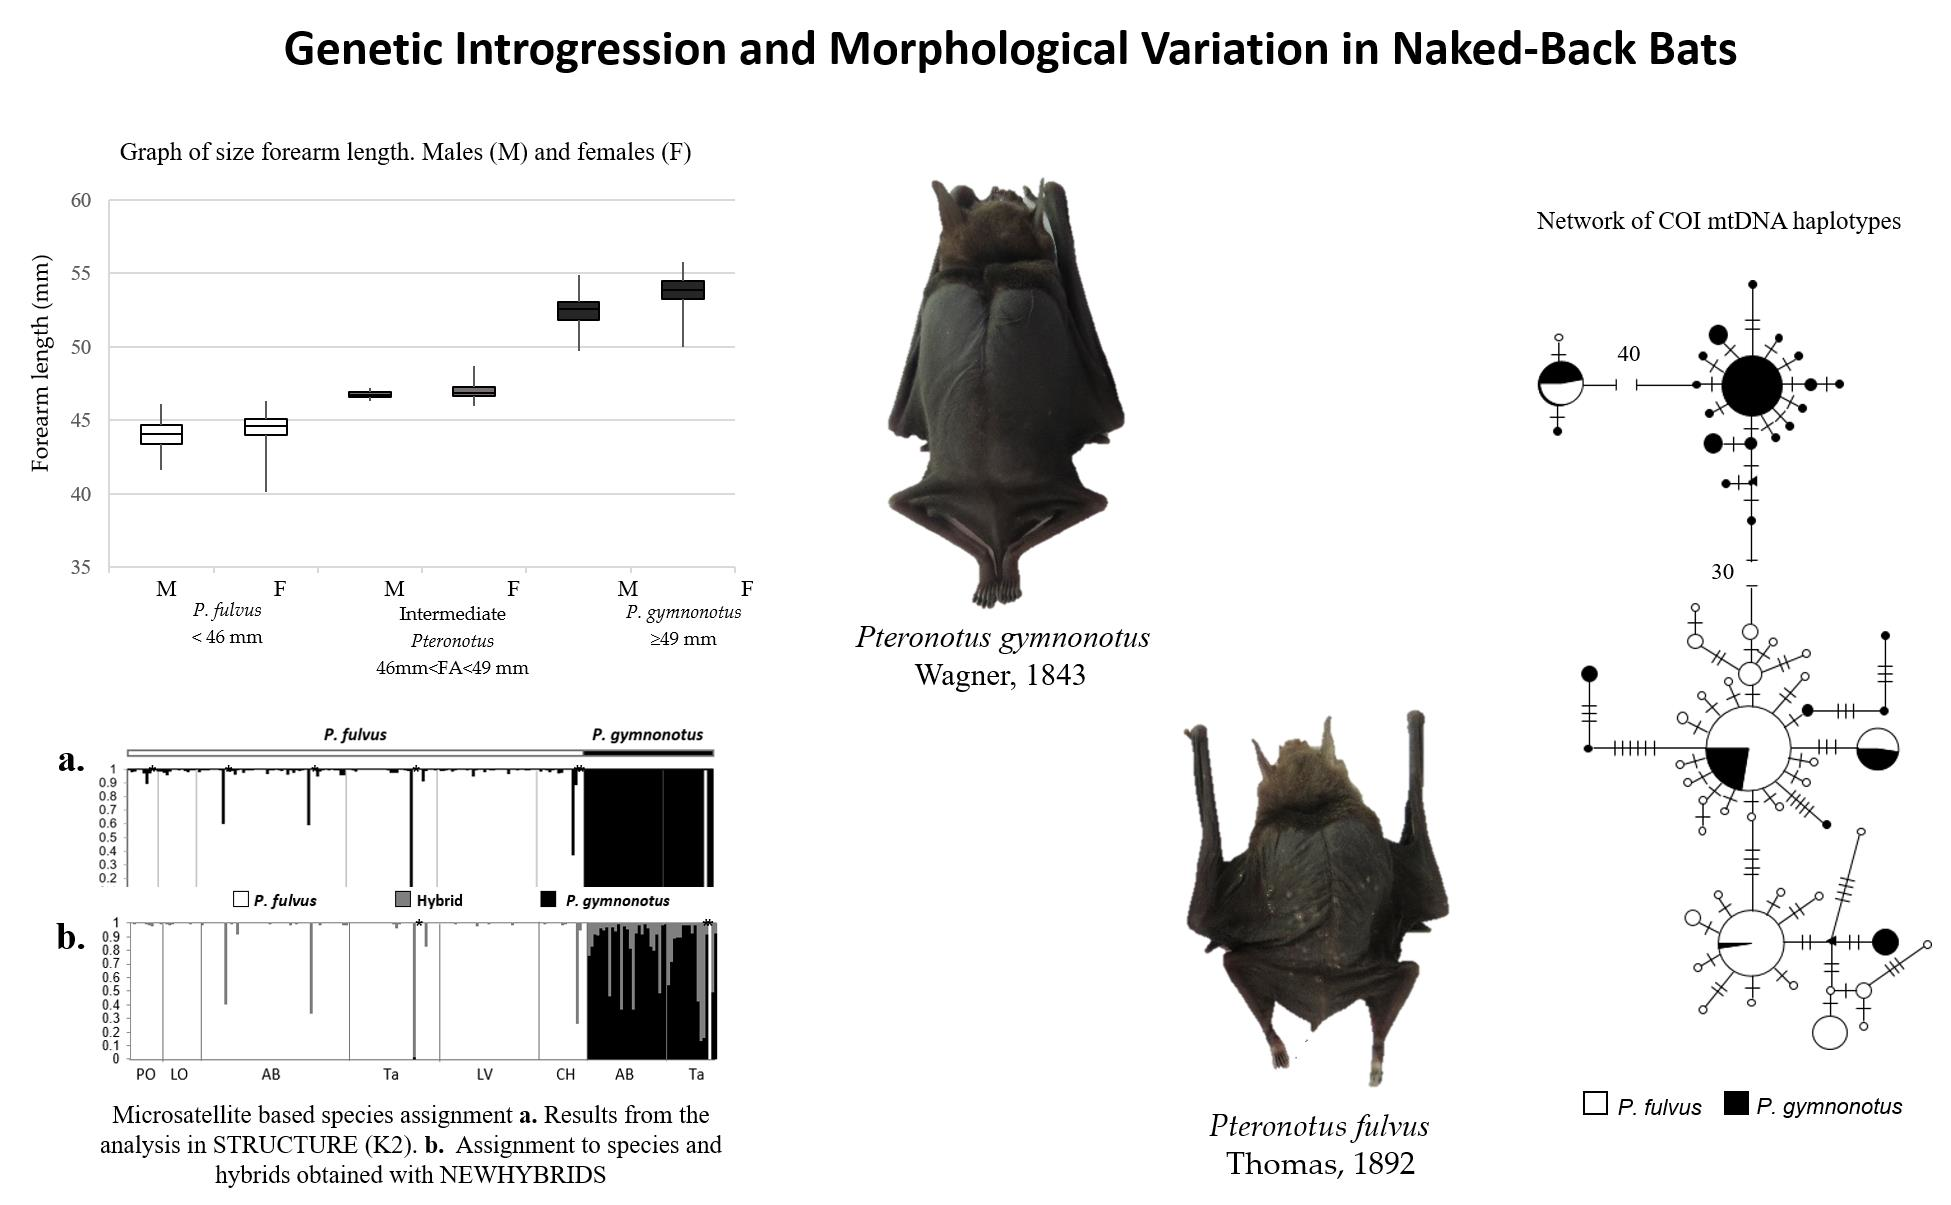
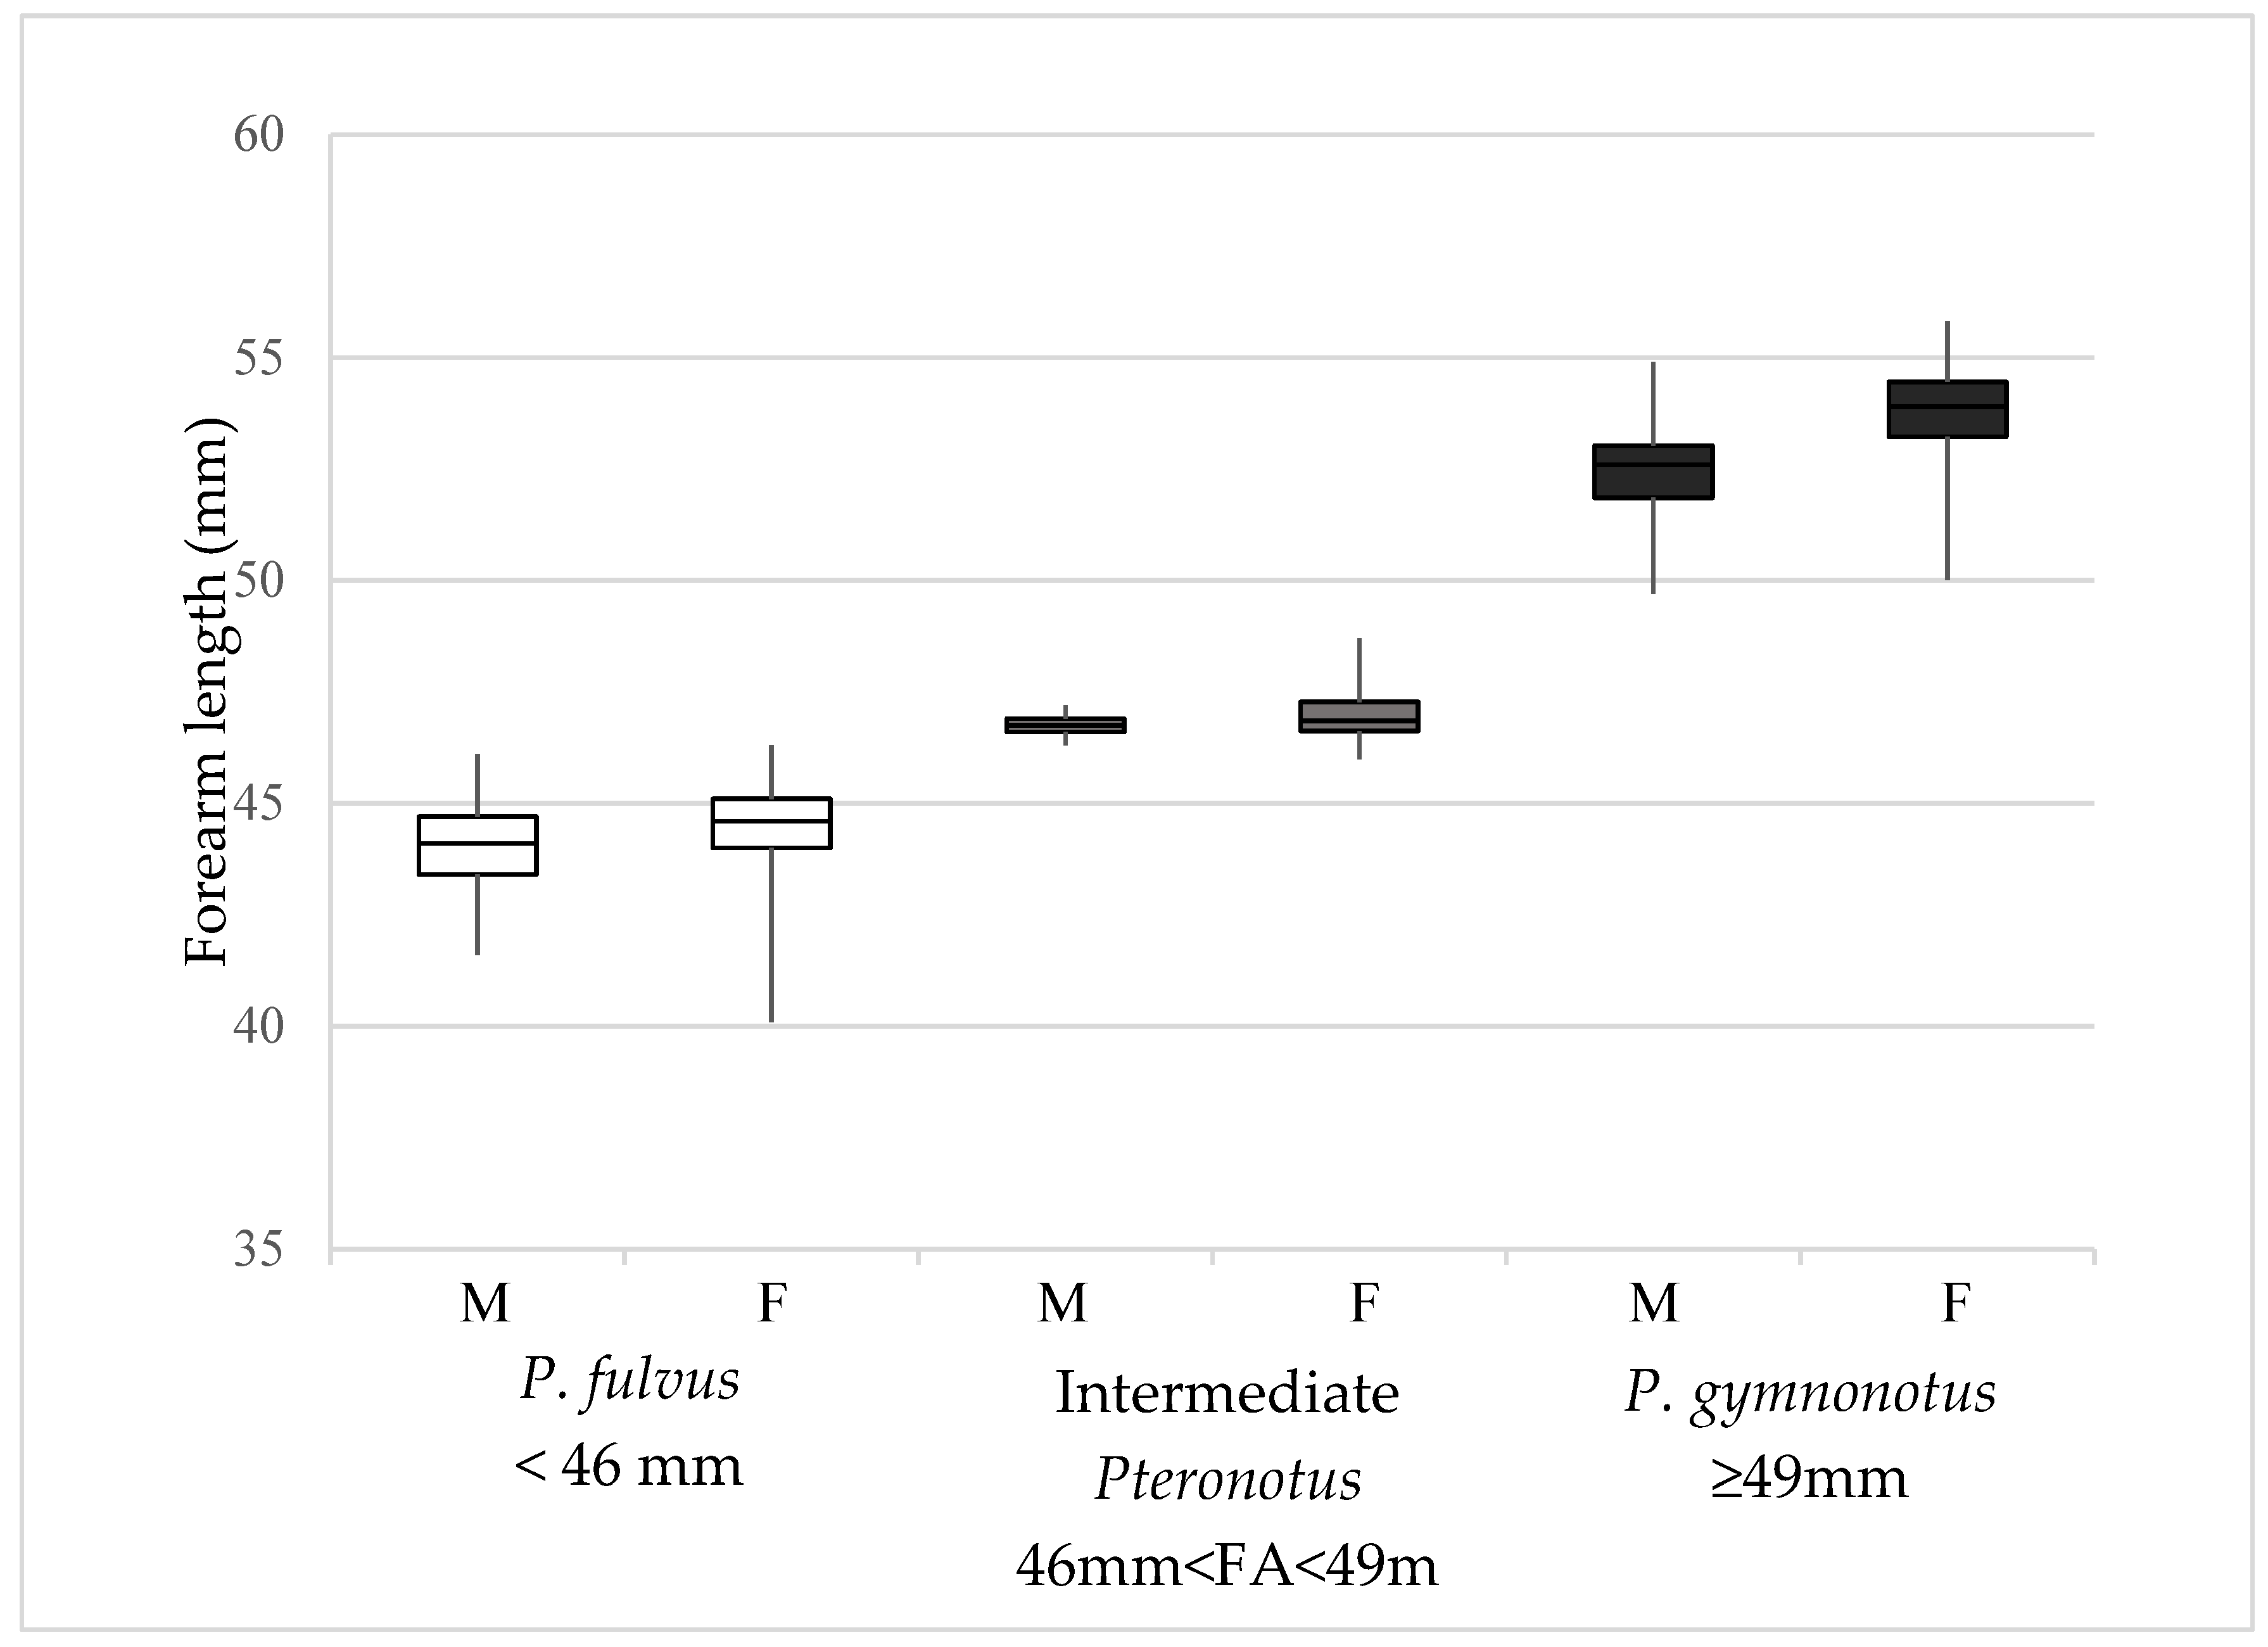
Genetic Introgression and Morphological Variation in Naked-Back Bats (Chiroptera: Mormoopidae: Pteronotus Species) along Their Contact Zone in Central America

by
Aline Méndez-Rodríguez
1,
Javier Juste
2,3,*,
Alejandro Centeno-Cuadros
4,
Flor Rodríguez-Gómez
5,
Alejandra Serrato-Díaz
6,
Juan Luis García-Mudarra
2,
Luis Manuel Guevara-Chumacero
1 and
Ricardo López-Wilchis
1,*
1
Departamento de Biología, Universidad Autónoma Metropolitana-Iztapalapa, Av. San Rafael Atlixco 186, Col. Vicentina, Ciudad de Mexico 09340, Mexico
2
Estación Biológica de Doñana, C.S.I.C., Avda. Américo Vespucio 26, 41092 Sevilla, Spain
3
CIBER de Epidemiología y Salud Pública, CIBERESP, 28220 Madrid, Spain
4
INMAR, Facultad de Ciencias del Mar y Ambientales, Biomedicina, Biotecnologia y Salud Pública, Universidad de Cádiz, 11510 Cádiz, Spain
5
Centro Universitario de Ciencias Exactas e Ingenierías, Departamento de Ciencias Computacionales, Universidad de Guadalajara, Blvd. Gral., Marcelino García Barragán 1421, Olímpica, Guadalajara 44430, Mexico
6
Departamento de Hidrobiología, Universidad Autónoma Metropolitana-Iztapalapa, Av. San Rafael Atlixco 186, Col. Vicentina, Ciudad de Mexico 09340, Mexico
*
Authors to whom correspondence should be addressed.
Submission received: 30 March 2021 / Revised: 24 April 2021 / Accepted: 26 April 2021 / Published: 30 April 2021
(This article belongs to the Special Issue Diversity Aspects in Bats: Genetics, Morphology, Community Structure)

Abstract

:
Two sibling bare-backed bat species (Pteronotus fulvus and P. gymnonotus) have been traditionally differentiated by their size. However, intermediate specimens between the two species have been found in sympatric populations along southern Mexico and it has been suggested that they may be the outcome of a hybridization process between the two species. We used one mitochondrial (COI), three nuclear markers (PRKCL, STAT5A and RAG2) and 13 microsatellites to explore the evolutionary relationships between these two species and elucidate whether the intermediate morphotypes correspond to hybrid individuals. These markers have been analyzed in sympatric and allopatric populations of the two species plus the closely related species Pteronotus davyi. We confirmed the species-level differentiation of the three lineages (P. fulvus, P. davyi and P. gymnonotus), but the phylogenetic hypotheses suggested by the nuclear and mitochondrial markers were discordant. We confirm that the discordance between markers is due to genetic introgression through the mitochondrial capture of P. fulvus in P. gymnonotus populations. Such introgression was found in all P. gymnonotus specimens across its sympatric distribution range (Mexico to Costa Rica) and is related to expansion/retraction species distribution pulses associated with changes in forest distribution during the Quaternary climate cycles. Microsatellite analyses showed contemporary genetic contact between the two sympatric species and 3.0% of the samples studied were identified as hybrids. In conclusion, we found a historical and asymmetric genetic introgression (through mitochondrial capture) of P. fulvus into P. gymnonotus in Mexico and Central America and a limited contemporary gene exchange between the two species. However, no relationship was found between hybridization and the intermediate-sized specimens from southern Mexico, which might likely result from a clinal variation with latitude. These results confirm the need for caution when using forearm size to identify these species in the field and when differentiating them in the laboratory based on mitochondrial DNA alone.

Graphical Abstract

1. Introduction

Molecular methods have contributed to understanding evolutionary patterns and obtaining more accurate inferences about the relationships between lineages, bringing in major changes in the recognition and delimitation of biological species. These methods have been particularly useful in groups in which criteria used for species delimitation do not correspond to clearly discernable morphological differences, which have traditionally been the main tools for recognizing and setting the boundaries between species [1,2].
Elucidating evolutionary history is basic for establishing taxonomic boundaries between taxa, understanding speciation processes and estimating the actual diversity of evolutionary lineages to formulate suitable conservation strategies [3]. Comparing phylogenetic patterns across lineages through comparative studies of genetic diversity, gene flow, phylogenetic relationships, diversification events and others [4] helps to elucidate whether taxa share a common history.
The use of molecular tools has led to an increased number of known species but also to clump species unto just one [3,5,6]. However, analyses of different molecular markers frequently lead to different taxonomic units or contrasting genealogical relationships between the taxa studied [7,8]. Such discordance between markers may be due either to an incomplete lineage sorting of ancestral polymorphism or to genetic introgression, among other processes [9,10], which pose additional challenges for phylogenetic studies [11].
Genetic introgression is an exchange of genetic material (hybridization) in which part of the gene pool of one lineage is mixed and becomes fixed in another evolutionary lineage [10]. This process is particularly interesting in systematic studies, given its confounding effect in phylogenetic inferences and its potential role in speciation processes, particularly through adaptive radiation [3]. For a genetic introgression to become fixed in a population, it is necessary that the hybrid offspring backcross with one of its parent species, thus leading to the permanent incorporation of the new genes from another lineage [10]. When genetic material is shared, the direction and degree of hybridization, as well as its evolutionary consequences, generally depend on factors such as the degree of overlap of the geographic ranges of the parent species, compatibility of genomes, breeding strategies, dispersal, social structure patterns and selective pressures, among others [12,13].
Hybrids found at the limits of the distribution ranges of parent species are particularly interesting for the interaction of intrinsic and extrinsic elements that determine the temporal and geographic distribution of the species [14]. Contact zones where morphological or genetic characteristics vary gradually are called clinal zones [15]. A higher proportion of hybrid individuals can be found in clinal zones mainly because they have a selective advantage over the parent species [15,16]. Clines pose additional challenges to the delimitation of species, particularly in species that show phenotypic plasticity and in which their differentiation is based upon morphological diagnosis [17].
Bats are an interesting model for studying introgression processes due to their high vagility, wide-ranging distribution and phenotypic plasticity. Species delimitation is frequently challenging: while some species can be readily recognized based on morphometric measurements [18,19], many others have been delimited only through molecular techniques due to the morphological conservatism found in species complexes occurring in several families such as Hipposideridae, Rhinolophidae, Miniopteridae, Vespertilionidae and others. [20,21,22] In addition, the use of more integrative approaches like IOTUs have recently been suggested [23].
The family Mormoopidae includes insectivorous bats of Neotropical distribution ranging from southern Texas to Brazil, including the Antilles [24,25]. The family has a complex taxonomic history that has led to repeated re-descriptions of taxa and taxonomic rearrangements [24,25,26]. The distributional boundaries between some species are still unclear, particularly for mainland species. The family had been traditionally considered to include two genera: Mormoops Leach, 1821 [27] with three species and Pteronotus Gray 1838 [28] with seven species subdivided into three subgenera [24,29]. Recently, however, a new taxonomic arrangement was proposed for Pteronotus [30,31,32,33], which elevates most of the subspecies to the species level, bringing the total number of species to 16 subdivided into the subgenera Pteronotus, Chilonycteris and Phyllodia [31]. The subgenus Pteronotus is characterized by wing membranes fused on the back, giving them a distinctive bare-back appearance. The main morphological difference between species refers to size, particularly forearm length (FA) [24]. Pavan and Marroig [31] recognized one large species, P. gymnonotus (FA ≥ 49 mm) and two visibly smaller species, P. fulvus and P. davyi (FA < 49 mm). The smaller species overlap in forearm length, but various studies have confirmed that, despite being considered as co-specific until recently, they do correspond to clearly differentiated evolutionary lineages at the species level [24,34,35]. The three species show very close phylogenetic relationships, having differentiated 2.5 million years (My) ago [31].
There is a sympatric zone between P. fulvus and P. gymnonotus in southeast Mexico, which also coincides with the distribution limit of P. gymnonotus (Figure 1b,d). Individuals with forearm length (FA = 46.1, 46.5 and 48.3 mm) close to both the upper limit of P. fulvus and the lower limit of P. gymnonotus [36,37] have been recorded in this area. These intermediate-sized individuals have been proposed as another P. davyi subspecies (cf. P. fulvus) [36,37]. The size variation observed in the subgenus Pteronotus has also been explained as part of a latitudinal gradient [24]. Pavan and Marroig [31] suggested a possible introgression of mitochondrial DNA (mtDNA) from P. fulvus into P. gymnonotus. Although these lineages represent phylogenetically close species [31,35] and share refuges (caves) [38], the occurrence of (current or past) hybridization between them in the sympatric zone has not been directly evaluated yet.
Based on an intensive sampling conducted in allopatric and sympatric localities of P. fulvus and P. gymnonotus, this study pursued the following objectives: (1) evaluate whether forearm length and latitude are correlated; (2) discern the taxonomic composition of the subgenus Pteronotus; (3) determine whether hybridization between P. fulvus and P. gymnonotus has occurred and (4) confirm whether the intermediate-sized morphotypes correspond to hybrids between P. fulvus and P. gymnonotus.

2. Materials and Methods

We captured a total of 247 bats (187 P. fulvus and 60 P. gymnonotus) at 14 different localities in Mexico, Nicaragua, Costa Rica and Brazil. The specimens were captured between 2004 and 2019 using harp-traps and mist nets (Figure 1, Table 1). The bats were morphologically identified using the taxonomic keys by Medellín et al. [18] and Adams [39], using the forearm length as diagnostic characteristic and following the taxonomy proposed by Pavan and Marroig [31]. For each, specimens were measured the forearm, total length, weight and sexed recorded and a wing membrane biopsy of two mm diameter was collected with a biopsy punch (Fray Products Corp., Buffalo, New York, NY, USA). Most bats were released at the capture site, except for a few individuals that were kept as voucher specimens and deposited at the Universidad Autónoma Metropolitana, Iztapalapa Campus, under catalog entries RLW130901Pda11–RLW23072018Pgy2. Tissue samples were preserved in 70% ethanol. Ethical protocols set by the American Society of Mammalogists [40] and the División de Ciencias Biológicas y de la Salud (Division of Biological and Health Sciences) of Universidad Autónoma Metropolitana-Iztapalapa [41] were followed during the capture and handling of bats. Bat capture was carried out under the collection permits (see below) In addition, our own sampling, the genetic study, includes all the sequences available in GenBank (Table S1).

2.1. Morphological Analyses

A total of 199 bats captured in Mexico were classified into three groups according to size: P. fulvus (n = 136; FA < 46 mm), P. gymnonotus (n = 44; FA ≥ 49 mm) and putative hybrids (n = 19; 46 mm ≤ FA < 49 mm).

2.2. Correlation between Forearm Length and Latitude

The correlation between forearm length and latitude was evaluated separately for P. fulvus and P. gymnonotus using the Spearman’s rank correlation coefficient (rs) and the data were tested for normality using the D’Agostino Omnibus test NCSS v. 11 [42]. This analysis included data from the specimens captured and additional data reported in the literature [43,44,45,46,47,48,49,50,51]. The final dataset included a total of 201 female and 387 male P. fulvus and 39 female and 50 male P. gymnonotus, from localities in Mexico, Guatemala, Nicaragua, Costa Rica, Panama, Venezuela and Brazil.

2.3. Molecular Data

2.3.1. Sampling

These analyses included sequences from specimens collected in this study (N = 177), as well as 146 sequences available in GenBank [30,31,34,52,53,54,55] (Table S1). The final dataset included sequences from a total of 317 P. davyi, P. fulvus and P. gymnonotus bats from 16 different countries (Table 1).

2.3.2. DNA Extraction, Sequencing, Editing and Alignment

Genomic DNA was extracted using the standard saline method [56]. Three nuclear DNA (nDNA) and one mitochondrial (mtDNA) gene fragments were amplified with Polymerase Chain Reaction (PCR). The nDNA fragments were (a) 422 bp of the protein kinase C iota intron (PRKC1), (b) 475 bp of the signal transducer and activator of transcription 5A intron (STAT5A) and (c) 717 bp of the recombination activating gene 2 (RAG2). For the mtDNA, a 607 bp fragment of the gene Cytochrome Oxidase subunit I (COI) was amplified. The primers and conditions described by [57,58,59] were used for each of these fragments (Table S2). The amplification products were sequenced on an ABI PRISM 370X equipment and the sequences were manually edited and aligned using the Clustal W algorithm implemented in Geneious v. 5.6.4 [60,61] and uploaded to GenBank (Table S1).
Thirteen polymorphic microsatellite markers were selected for the two species (P. fulvus and P. gymnonotus); 12 of these markers had been previously designed and characterized for Wagner’s mustached bat (Pteronotus psilotis): Pps1, Pps3, Pps6, Pps7 [62], Pps10–Pps17 (this study, Table S3) and one was originally designed for Jamaican fruit bat (Artibeus jamaicensis): NAC8 [63]. Allele identification was carried out with the ABI PRISM 370xl equipment with LIZ (GeneScan™ 500® LIZ Size Standard) and the alleles’ size was determined with the software GeneMarker v. 2.4.2 (SoftGenetics, LLC, State College, PA, USA). The final microsatellite database is available at the Mendeley data depository (DOI: http://0-dx-doi-org.brum.beds.ac.uk/10.17632/ppvf77zr6s.1 (accessed on 19 May 2020)).

2.3.3. Species Tree

Seventy-four specimens (26 P. fulvus, 43 P. gymnonotus and 5 P. davyi) from localities representative of the distribution range of each species were selected to confirm and delimit taxonomic groups in the lineages studied of the subgenus Pteronotus. A species tree was constructed from the nDNA (RAG2, PRKC1 and STAT5A) and mtDNA (COI) data using the software *BEAST 2.4.8 [64] as available in the CIPRES webpage [65]; the resulting tree was visualized using the software FigTree 1.1.2 [66]. Three runs of 30,000,000 generations each were performed with the Bayesian and Maximum Likelihood phylogenetic inferences as initial hypotheses. A Yule speciation model was used with a 0.8 exponential mean (yule.birthRate), uncorrelated lognormal distribution, strict molecular clock and a substitution rate for each partition (ucld.mean) of 0.01 substitutions per site per million years (s/s/my) for PRKC1 and STAT5A, 0.005 s/s/my for RAG2 and 0.025 s/s/my for COI, as recommended by Pavan and Marroig [67]. Sequences from the species P. macleayii and P. quadridens (Table S1) were used as external groups.

2.3.4. Evolutionary Relationships

The same dataset used for constructing the species tree (see above) was used to reconstruct and compare the evolutionary history of P. fulvus, P. gymnonotus and P. davyi. nDNA and mtDNA phylogenies were constructed with Bayesian inference (BI) running for 10,000,000 generations with five Markov chains, using the software MrBayes v. 3.2 [68] and a Maximum likelihood (ML) analysis by means of a heuristic search with 1 000 bootstrap replicates with the software PAUP* v. 4.0b10 [69]. The evolutionary model most consistent with each locus was estimated with the software jModeltest v. 2.1.6, using the Akaike Information Criterion [70,71]. The models selected were HKY for PRKC1, GTR+G for STAT5A, TPM2uf+I for RAG2 and HKY+G for COI.
Divergence times of the main nodes of the mtDNA phylogeny were estimated with the software *BEAST 1.8.0 [72] as available in the CIPRES webpage [65]. Three runs of 30,000,000 generations each were performed with a Yule tree prior (yule.birthRate = 0.8), uncorrelated lognormal distribution, strict molecular clock and the same mutation rate used for the species tree; the results were visualized with the software FigTree 1.1.2 [66]. Haplotype networks for the different markers (PRCK1, STAT5A, RAG2 and COI) were built using the software Network v. 4.6.1.3 [73] to infer the relationships between individuals; loops were resolved as per the criteria recommended by Pfenninger and Posada [74]. Genetic distances between haplogroups were estimated with the software MEGA v. 5.0.5 [75] using the p-distance model for nDNA and the Kimura 2-parameter model (K2P) for mtDNA.

2.3.5. mtDNA Diversity and Structure

Genetic structure and variation in P. fulvus and P. gymnonotus were evaluated with the COI mtDNA marker. The sample size was increased to a total of 300 individuals (192 P. fulvus and 108 P. gymnonotus) from sympatric populations of Mexico, Guatemala, El Salvador, Honduras, Belize, Nicaragua and Costa Rica) and from allopatric populations from Mexico, Panama, Venezuela, Guyana, Suriname, Peru and Brazil (Table 1 and Table S1). For these populations, genetic variation and structure for the two species were estimated by means of pairwise FST values between species and localities, using the software Arlequin v. 3.5.1.2; significance was tested using 10,000 permutations [76]. The spatial distribution of haplotypes per locality and species was visualized on maps. Relationships between haplotypes were determined through parsimony network analyses using the Median-Joining method with the software Networks v. 4.6.1.3 [73]. Genetic distances (K2P) between haplogroups were calculated using the software MEGA v. 5.0.5 [75].

2.3.6. Microsatellinte Data Analyses

A total of 199 individuals (155 P. fulvus from six localities in Mexico and 44 P. gymnonotus from two localities in Mexico) were genotyped with the 13 microsatellites selected. The presence and frequency of null alleles on each locus were estimated with the software MICROCHECKER v. 2.2 [77] to determine the potential impact of null alleles on test results. FST values and genetic distances with and without ENA (estimation of null alleles) correction were estimated using the software FREENA [78]. Subsequently, the FST and genetic distance matrices were compared with a Mann–Whitney U test to test for significant differences between them, using the software NCSS v. 11 [42]. Deviation from Hardy–Weinberg equilibrium (HWE) and linkage disequilibrium (LD) tested with the software Arlequín v. 3.5.1.2 [76] and applying the Bonferroni’s sequential correction (p < 0.05) [79].

2.3.7. nDNA Genetic Population Structure

The genetic diversity of each species at each locality was evaluated by estimating the number of alleles (Na), number of private alleles (Np) and observed (HO) and expected heterozygosity (HE) with the software GenAlEx v. 6.3 [80] and allelic richness (AR) with the software FSTAT [81]. Genetic variation and differentiation were evaluated through FST and RST (gradual mutation model, SMM) values between species and pairwise RST values between species and localities, using the software Arlequin v. 3.5.1.2; significance was tested after 10,000 permutations [76].
Genetic structure was evaluated and potential hybrids at nuclear level were identified with the software STRUCTURE v. 2.2 [82]; were performed 107 MCMC iterations, 500,000 as burn-in with ten replicates for each genetic cluster (K), from K = 2 through K = 9. The most probable K value was determined based on the value of ∆K [83] estimated with the software Structure Harvester [84] and analyzing together the results from the ten replicates of each K value with the software CLUMPP v. 1.1.2 [85]. The software NEWHYBRIDS v.1.0 [86] was also used to detect hybrids, with a burn-in of 5 × 10⁴ iterations followed by 1,000,000 five-chain sweeps.
Hybrids identification was based on assignment methods using the software STRUCTURE [82] and NEWHYBRIDS [86]. According to STRUCTURE, were considered as hybrids those individuals that were not showing an assignment value of q < 0.90 to any of the two Pteronotus species. They were identified as hybrids in NEWHYBRIDS [86], to those individuals showing q > 0.75, according to the criterion number two of Burgarella et al. [87]; inconsistencies between the two analyses were resolved in favor of STRUCTURE, as recommended by these authors.

3. Results

3.1. Morphological Analysis

The putative hybrid specimens accounted for 9.5% of the bats captured in the localities LO, AB, Ta and LV, from the Mexican states of Colima, Tabasco and Oaxaca (Figure 2).

3.2. Correlation between Forearm Length and Latitude

The forearm data are not normal and the showed significant differences between sexes. No significant correlation was found between latitude and forearm length in P. fulvus females (rs = 0.1321, p = 0.8950). However, a significant negative correlation was observed in P. fulvus males (rs = 0.3271, p = 0.0205). In contrast, a positive correlation was found in P. gymnonotus females and males (rs = 2.8038, p = 0.0073; rs = 4.0997, p = 0.002, respectively) (Figure S1).

3.3. Molecular Analysis
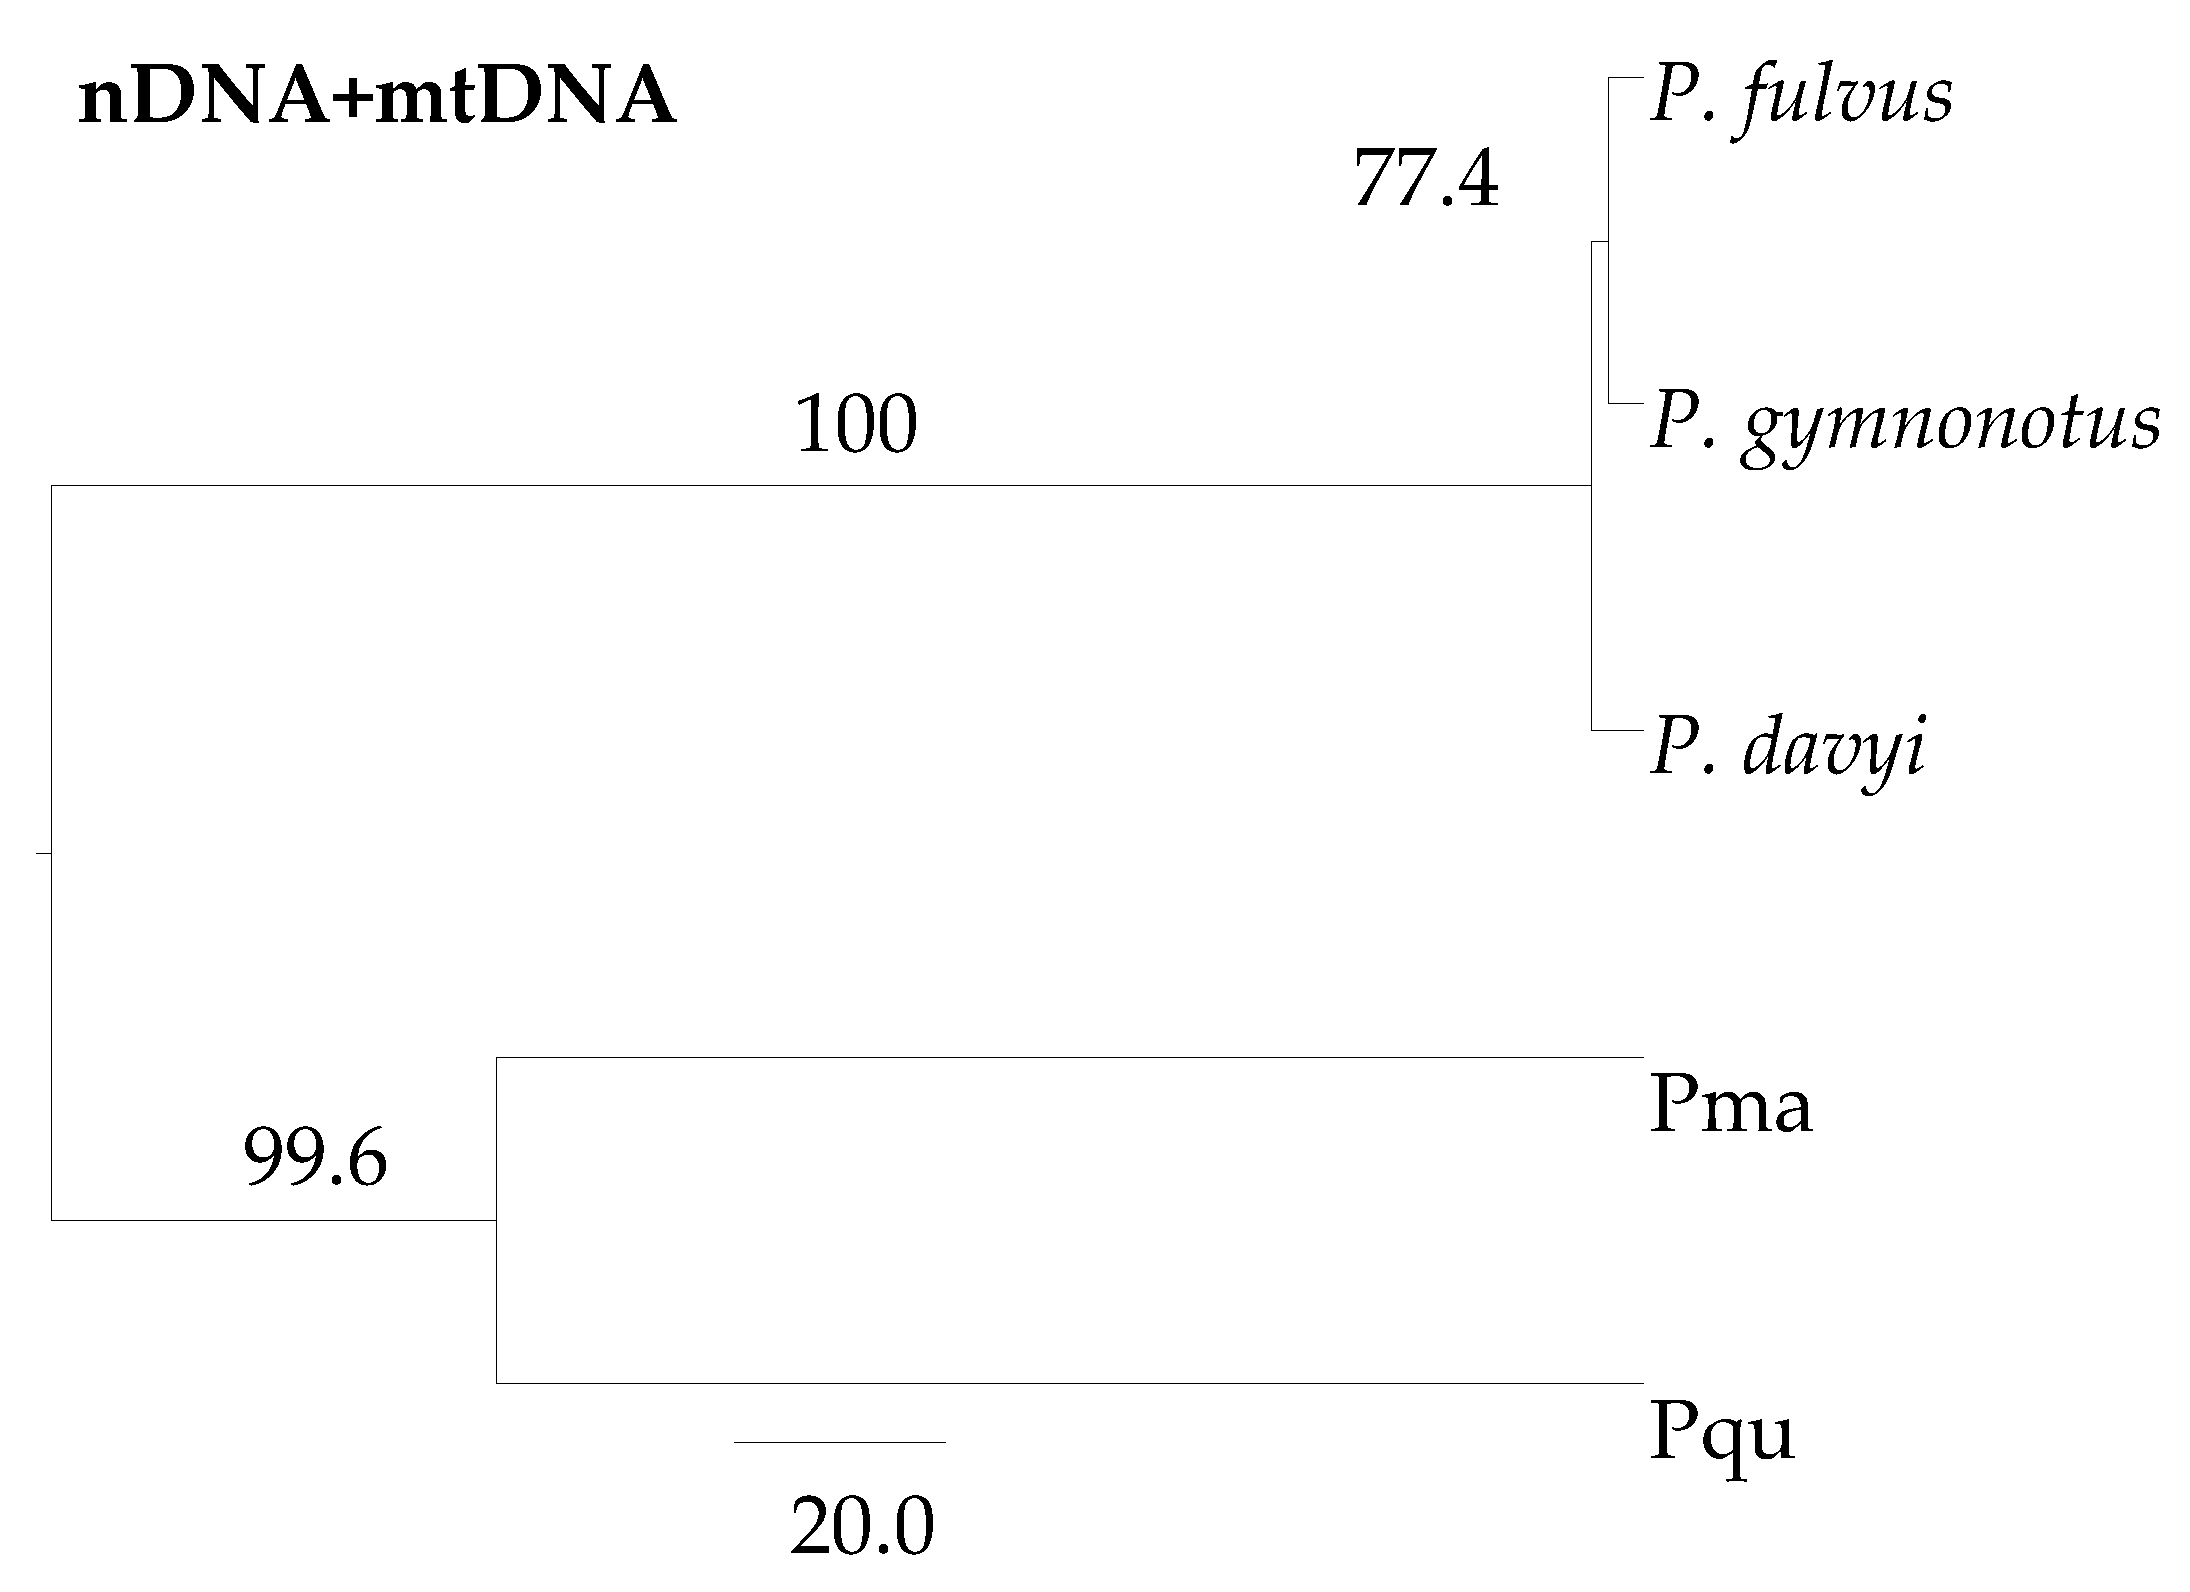
3.3.1. Species Tree

The species tree supported three lineages: P. davyi, P. fulvus and P. gymnonotus and suggesting with moderate support that P. fulvus is more closely related to P. gymnonotus than to its sibling species P. davyi (Figure 3).

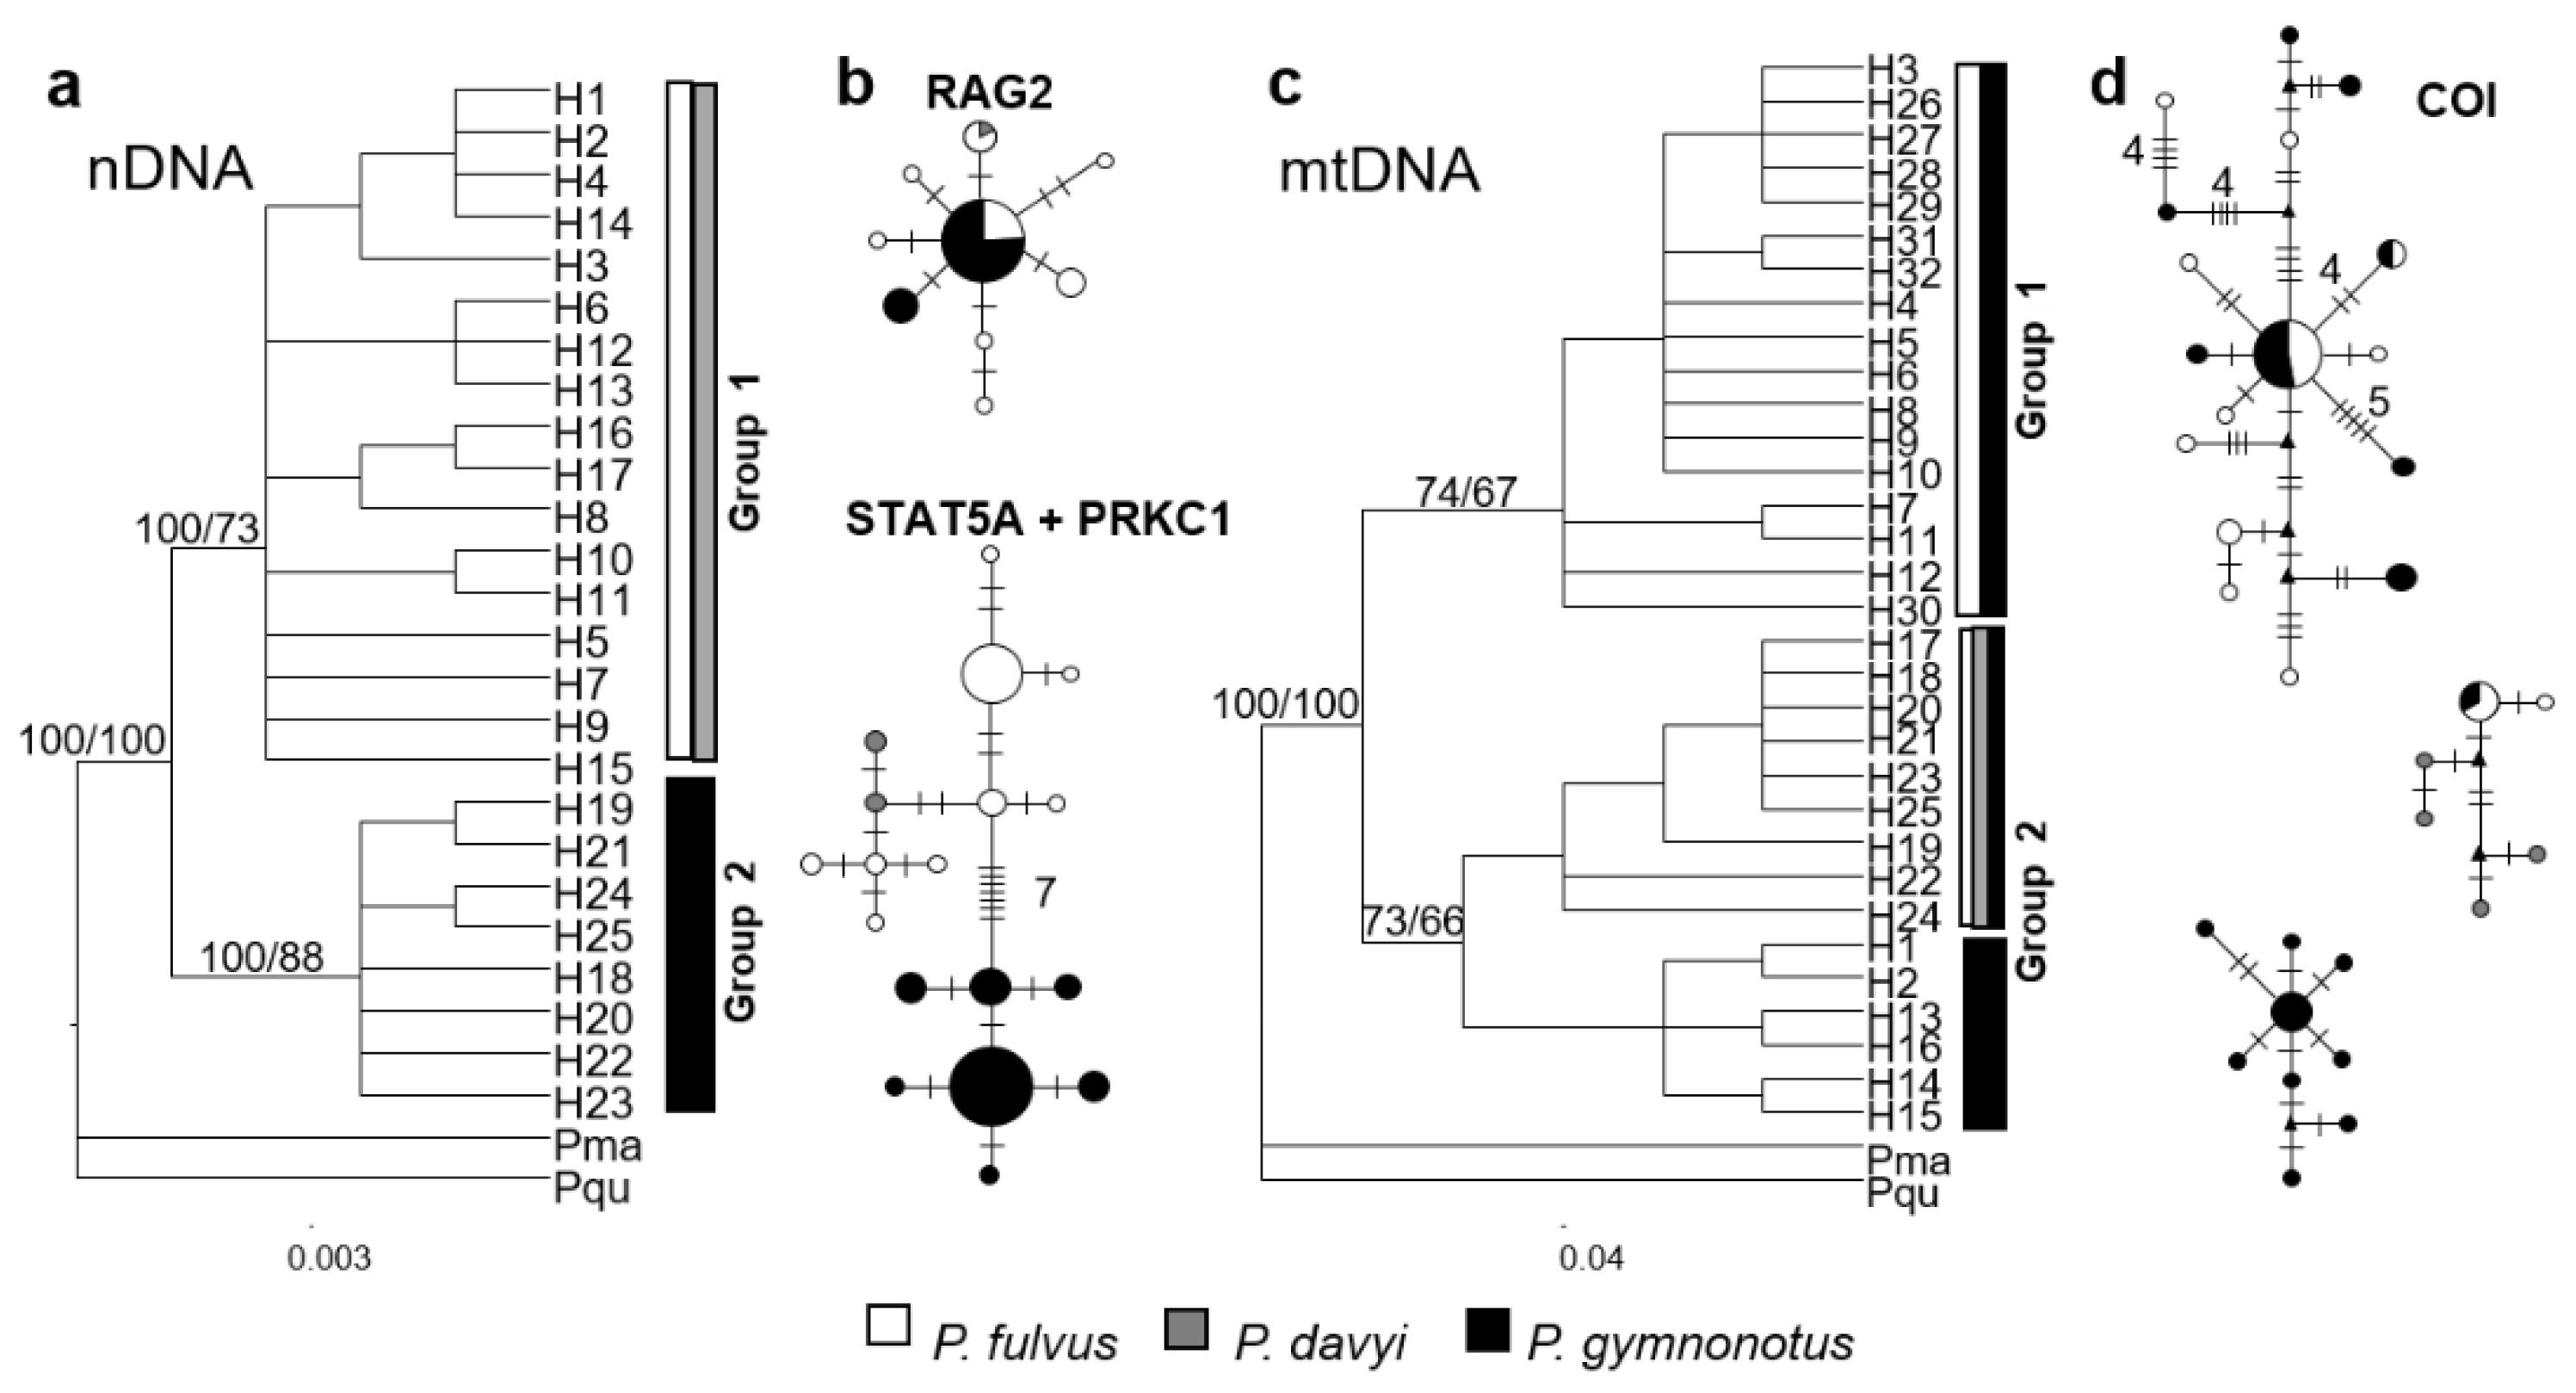
3.3.2. Evolutionary Relationships

The 74 sequences examined—corresponding to P. fulvus, P. davyi and P. gymnonotus—contained 18 haplotypes in the joint sequences of the PRKC1 and STAT5A introns (897 bp), nine haplotypes in RAG2 (717 bp) and 32 haplotypes in the 607 bp fragment of COI (Table S4).
The Bayesian inference and maximum likelihood criteria yielded similar phylogenies for both marker types. However, a marked discordance was observed between the hypotheses derived from each marker type (nuclear and mitochondrial). Nuclear topologies comprised two monophyletic clades, one including the species P. fulvus and P. davyi (Group I) and the other including P. gymnonotus (Group II), separated by a genetic distance (p-distance) of 0.8%. The haplotype network for the PRKC1 and STAT5A introns clearly showed unique haplotypes to each species, unlike the RAG2-based haplotype network, where all three species shared some haplotypes (Figure 4b).
On the other hand, the phylogenies based on the mitochondrial marker COI revealed two clusters (Figure 4c). A first cluster (Group I) included mainly P. fulvus haplotypes (n = 9), as well as haplotypes of P. gymnonotus (n = 6) from its northern distribution range (Mexico, Guatemala, Nicaragua and Costa Rica) and corresponding to the sympatric zone with P. fulvus. The second cluster (Group II) comprised two haplogroups: the first included P. davyi haplotypes (n = 4), one P. fulvus haplotype from Mexico (H1) and one haplotype (H2) shared by P. fulvus and P. gymnonotus from Mexico and Costa Rica. The second haplogroup—although weakly supported (Pp = 73/76)—included all P. gymnonotus haplotypes (n = 10) from the southern distribution range (Panama, Suriname, Peru and Brazil) of the species (Figure 4). The genetic distance between the two haplogroups was 3.7% (K2P). The inter-specific genetic distance was 6.8% between P. fulvus and P. davyi, 3.7% between P. fulvus and P. gymnonotus and 7.5% between P. davyi and P. gymnonotus (K2P). P. gymnonotus was the only species showing a well-marked intra-specific structure with two lineages, one corresponding to the northern end (Mexico–Nicaragua) and the other to the southern end (Panama–Brazil) of its distribution range.
The divergence time estimated between the southern lineage of P. gymnonotus and the other groups (P. davyi, P. fulvus and P. gymnonotus North) was 1.021 My (0.705–1.506); for P. fulvus/P. gymnonotus North vs. P. davyi, it was 0.833 My (0.565–1.177); and for P. fulvus vs. P. gymnonotus North, it was 0.243 My (0.127–0.458) (Figure S2).

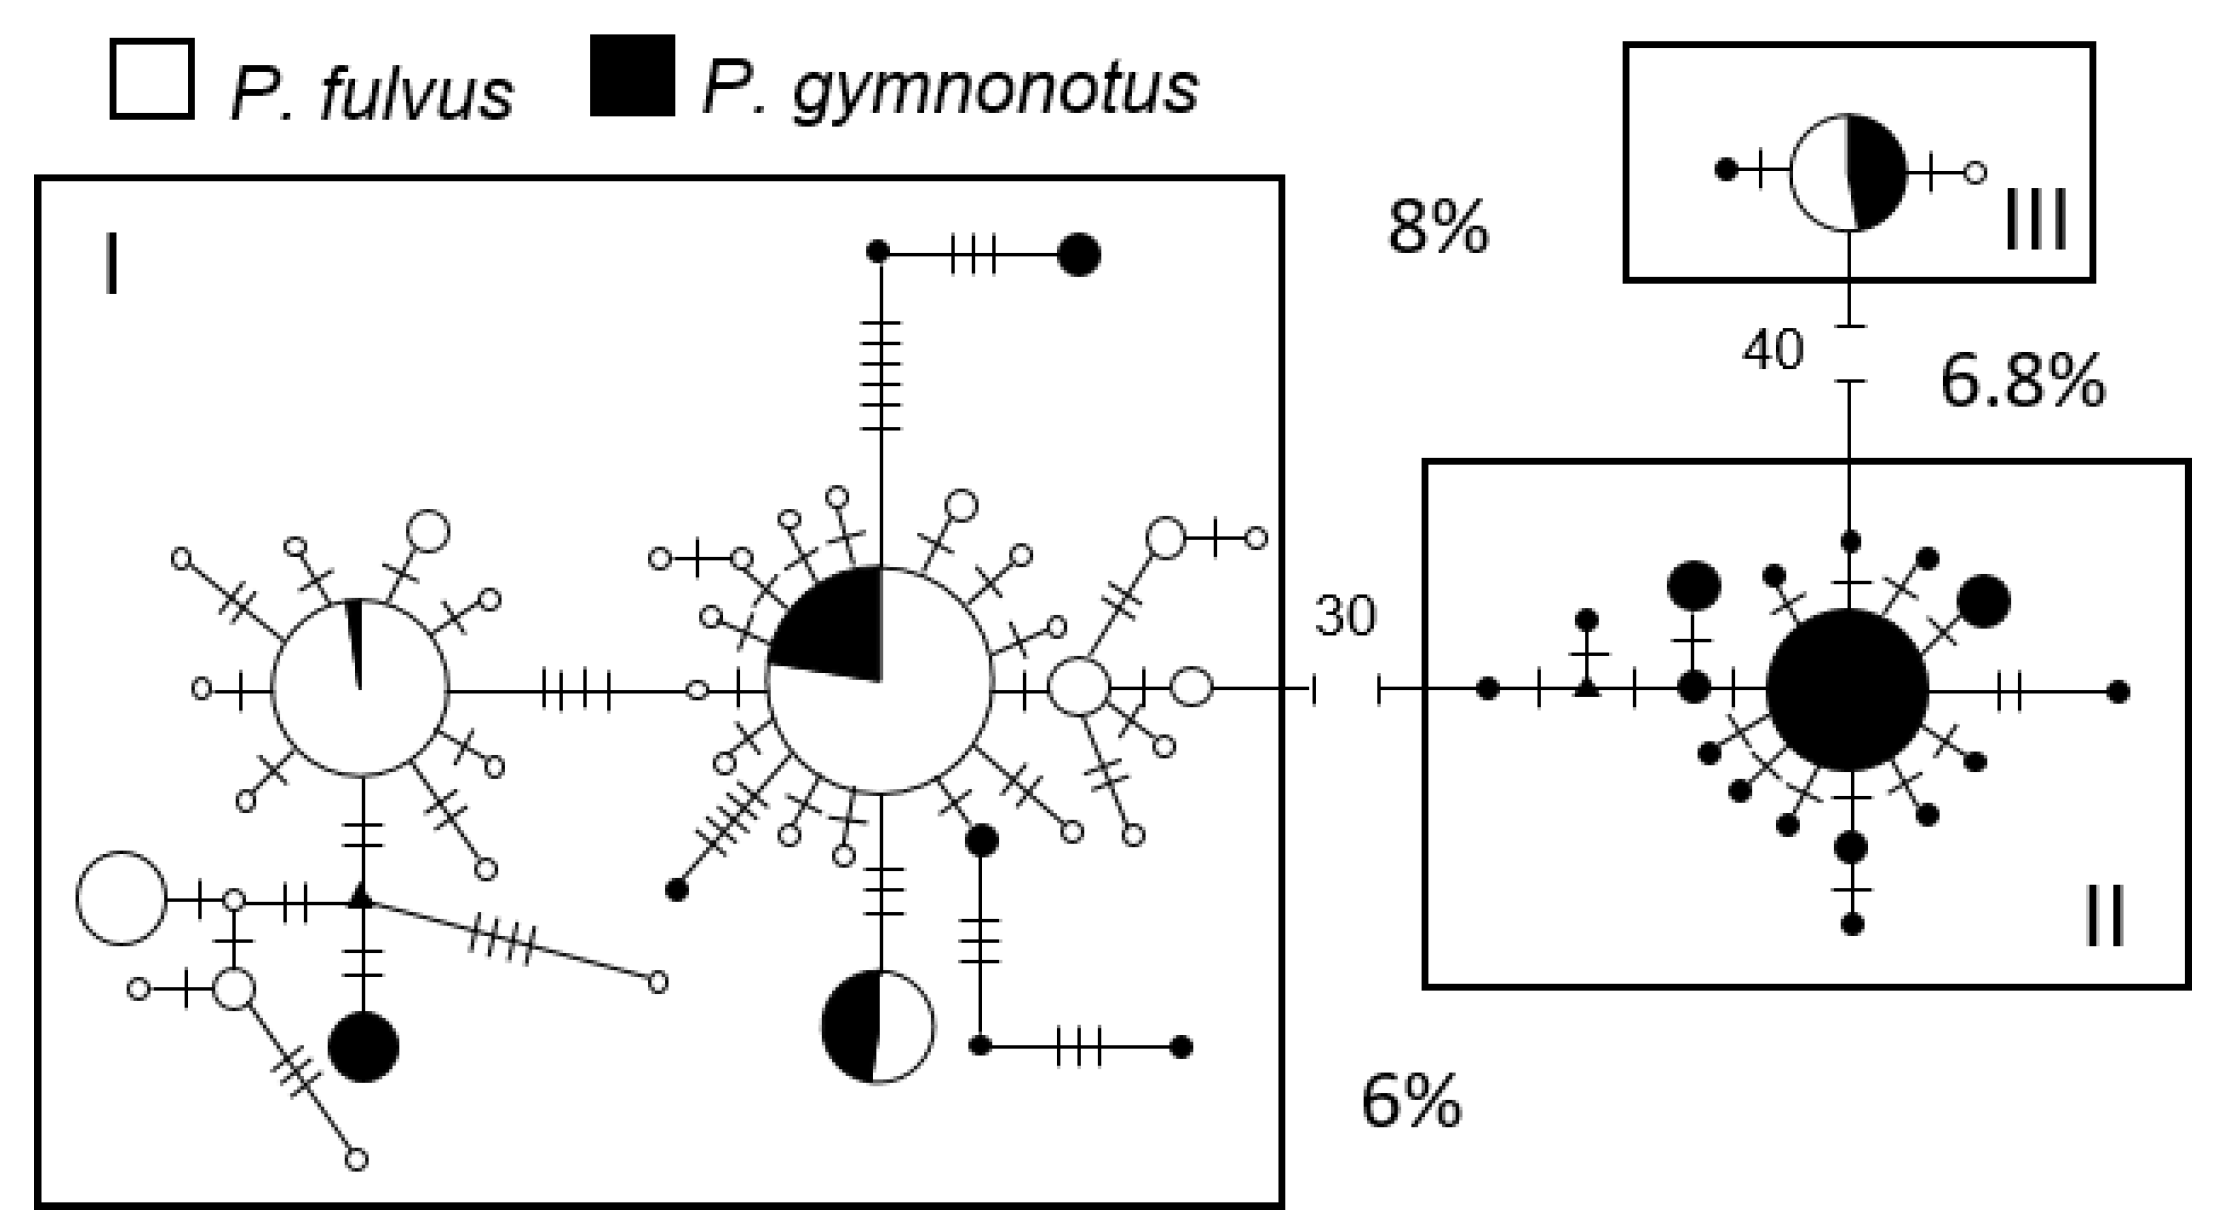
3.3.3. mtDNA Diversity and Structure

For the 133 specimens morphologically identified as P. fulvus (69.3%) and 39 identified as P. gymnonotus (36.1%) a total of 63 haplotypes were found in the two species; 34 haplotypes were unique to P. fulvus, 25 to P. gymnonotus and four haplotypes (H1, H2, H7 and H11) were shared. (Table S5). P. fulvus showed several haplotypes shared localities across the Gulf of Mexico and the Pacific regions. The largest number of shared haplotypes was found in localities of southern Mexico, while specimens from Central America showed unique haplotypes (Figure S3a). Haplotypes of the species P. gymnonotus grouped in two lineages with a clear geographic pattern, being the haplotype H2 recorded in almost all the localities of southern Mexico and Central America, while the haplotype H47 was found in most of the South American localities (Figure S3b).
The mtDNA haplotype network showed three clearly differentiated haplogroups with ≥30 mutational steps and genetic distances ≥6% (Figure 5). Haplogroup I included 43 haplotypes from 183 P. fulvus specimens from Mexico-Costa Rica and 47 P. gymnonotus specimens from Mexico, Guatemala, Nicaragua and Costa Rica (sympatric distribution) and one specimen from Panama. This suggesting a mitochondrial capture of all the P. gymnonotus from the northern distribution range. The first haplogroup also shows two main haplotypes in a star-like structure, suggesting population expansion. Haplogroup II included 17 haplotypes, all from the 52 P. gymnonotus specimens from the southern distribution range with samples from Panama-Brazil (allopatric distribution) and showing expansion. Finally, the haplogroup III included three haplotypes, one from a P. fulvus from Costa Rica, another haplotype from P. gymnonotus from Mexico and a third haplotype shared by eight P. fulvus from Mexico and Costa Rica and seven P. gymnonotus from Mexico; this haplogroup was separated from the others by a genetic distance ≥6.8% (Figure 5). Genetic differentiation was high between the two species, with FST = 0.665 (p < 0.001) and pairwise FST between localities of the different species showed higher values within P. fulvus than between P. gymnonotus (Table S7).

3.3.4. Microsatellinte Markers Checking

Null alleles were found in several loci in at least one locality. However, since the FST and genetic distance values calculated either with or without ENA correction did not change significantly (z < 0.0001, p = 1.0 and z = 0.4916, p = 0.6230, respectively) no locus had to be excluded from the analysis. Only eight loci (Pps1, Pps7, Pps10, Pps13, Pps14, Pps15, Pps16 and NAC8) showed evidence of HWE deviation in at least one locality, but with no discernable pattern. On the other hand, as LD was not detected consistently among the loci examined, no population or locus was ruled out.

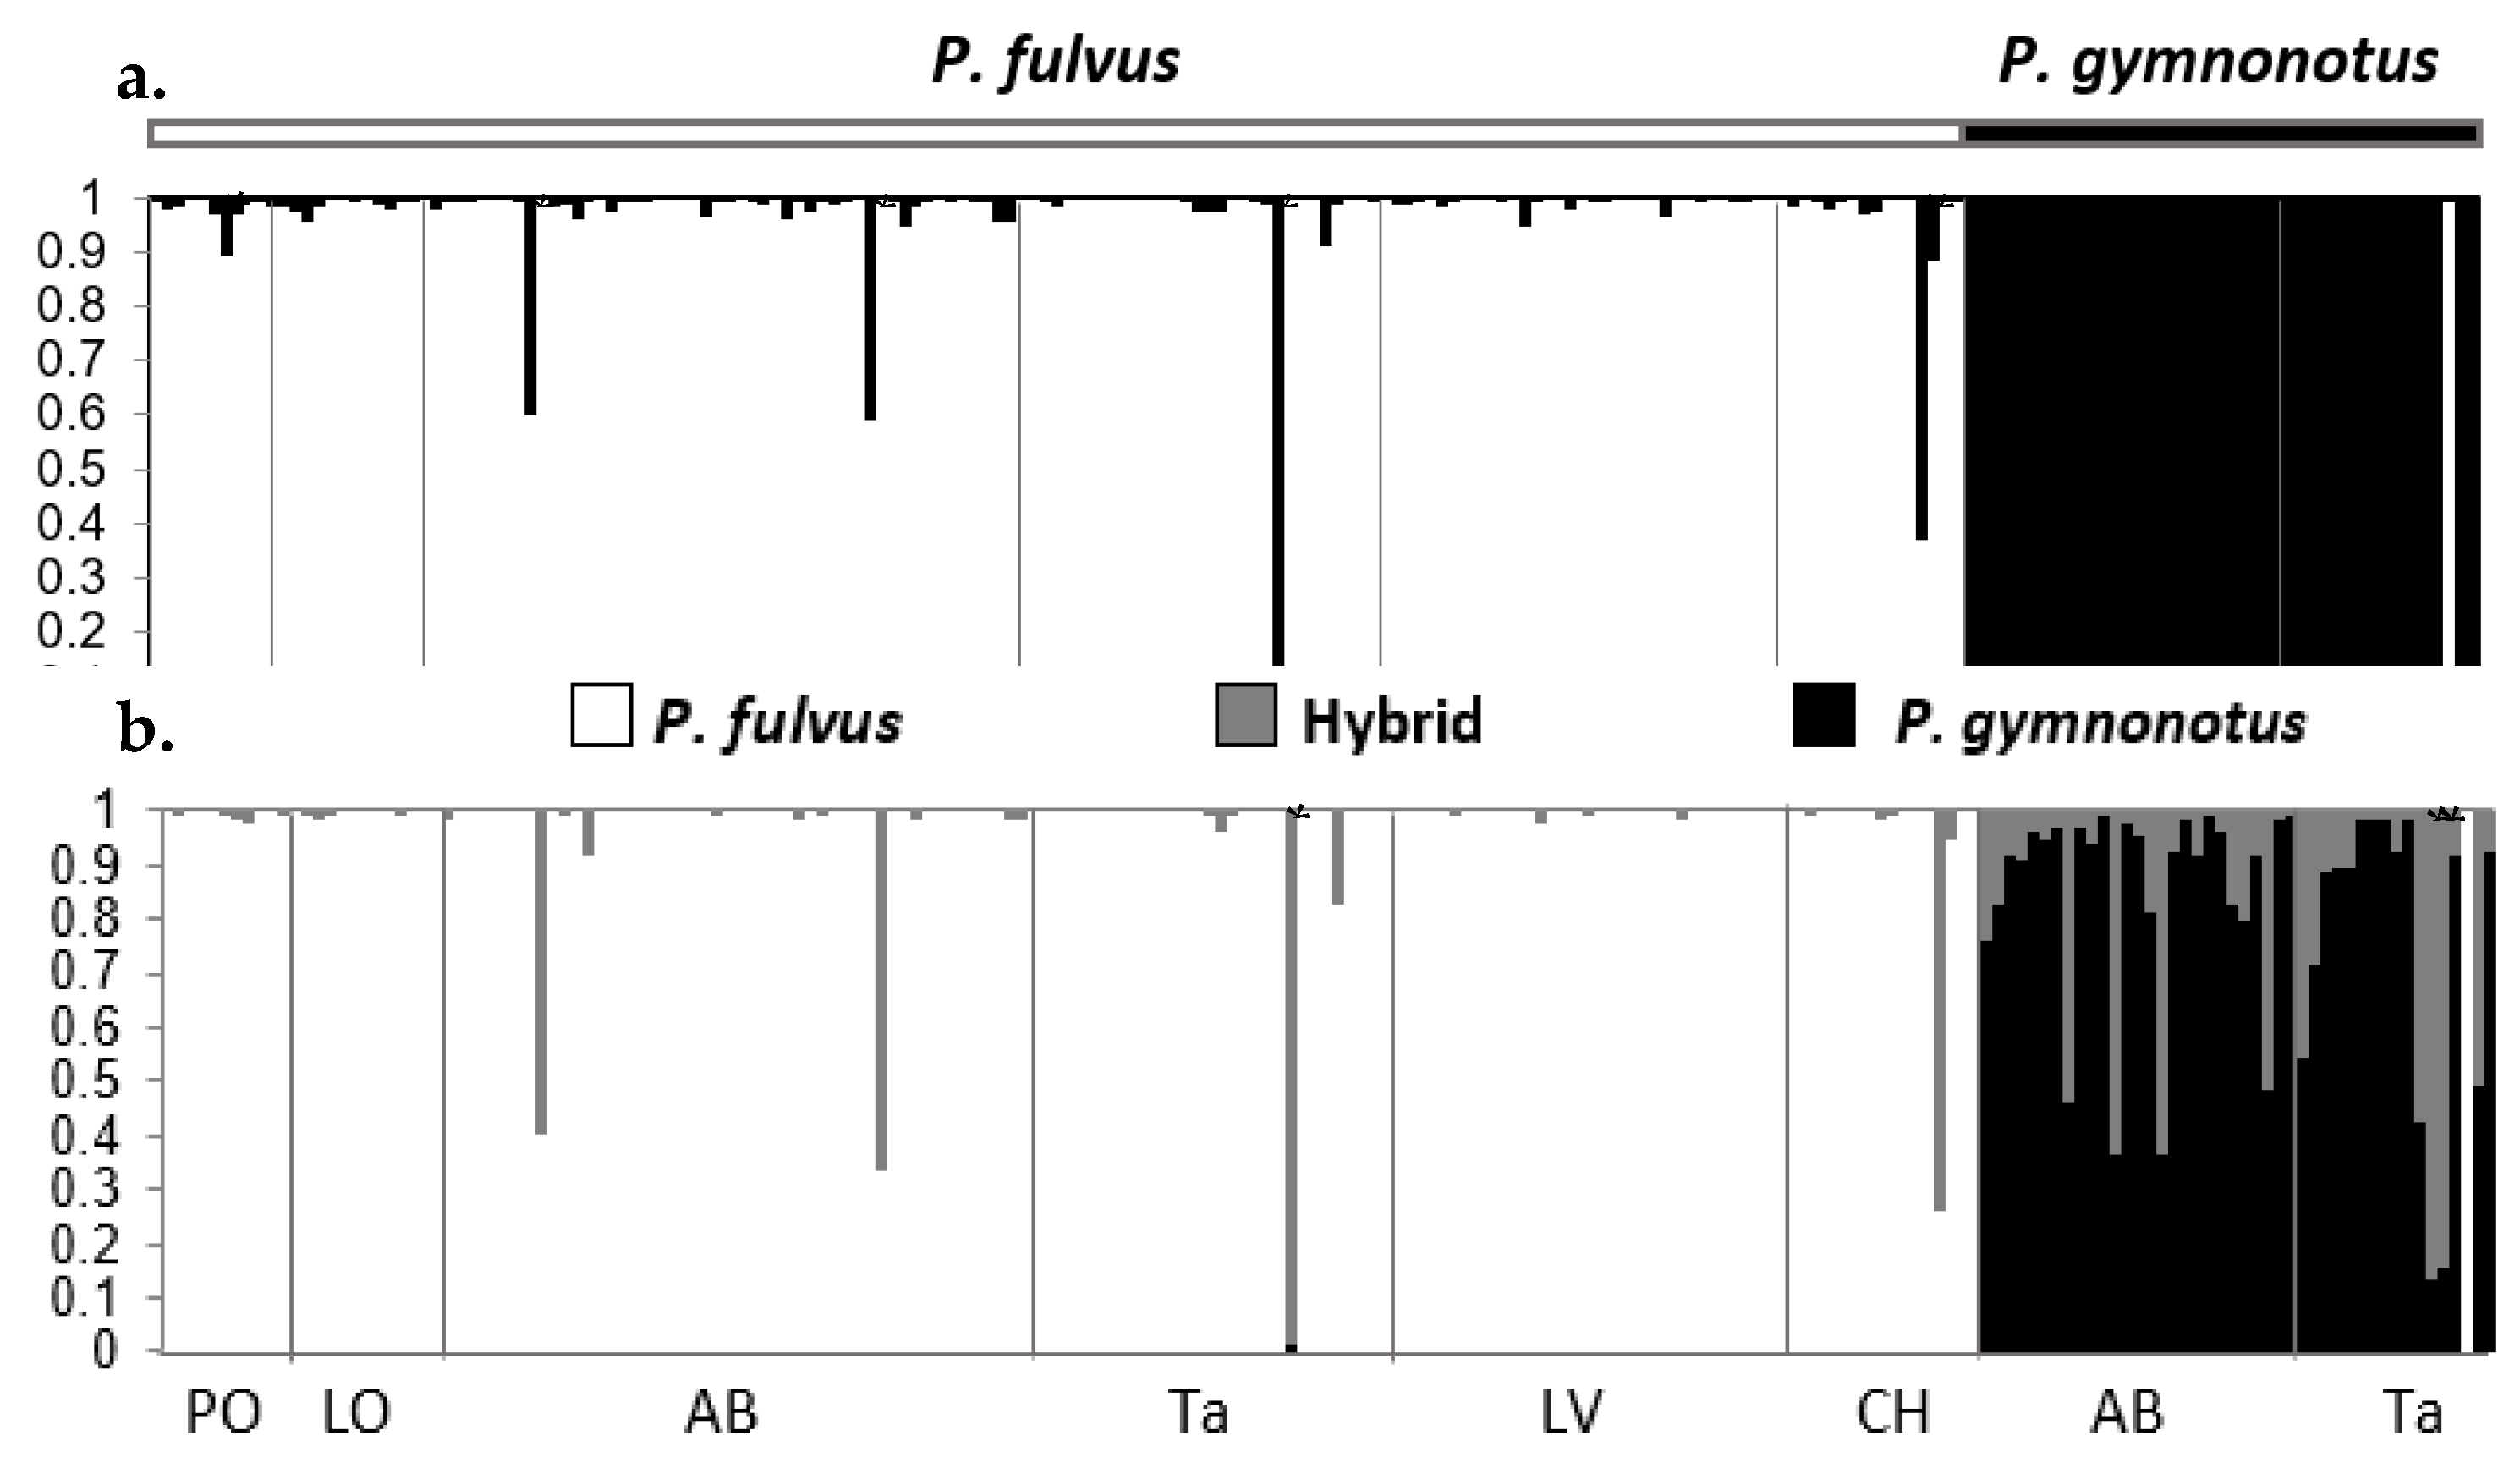
3.3.5. nDNA Genetic Population Structure

Considering all the loci, a total of 168 alleles were identified in 155 P. fulvus bats from six localities and 111 alleles in 44 P. gymnonotus bats from two localities. A total of 23 private alleles (Np) were also identified: ten in P. fulvus and 13 in P. gymnonotus, all of them with a low frequency (0.010–0.145). HO values. For P. fulvus ranged from 0.523 to 0.612, HE from 0.644 to 0.668 and the average AR from 4.208 to 4.333; the corresponding ranges for P. gymnonotus were HO: 0.549–0.574, HE: 0.568–0.622, average AR: 3.331–3.804 (Table S7). The between-species genetic differentiation value, RST = 0.089, was significantly (p < 0.001) and the pairwise analysis of RST between localities of the different species showed higher intraspecific RST values (Table S7).
The results from the Bayesian analysis carried out with STRUCTURE supported the split of the individuals into two groups (K = 2, Figure 6) corresponding to the species P. fulvus and P. gymnonotus; additionally, six P. fulvus specimens from the Mexican states of Colima, Tabasco and Oaxaca were classified as hybrids. Following the criterion 2 of Burgarella et al. [78], NEWHYBRIDS identified three individuals as hybrid, one in P. fulvus and two in P. gymnonotus from the Mexican state of Tabasco. In addition, NEWHYBRIDS left 11 P. fulvus individuals as unclassified, three of which can also be considered as hybrids based on the probability values in STRUCTURE. One other bat from Tabasco that was identified morphologically as P. gymnonotus was classified as P. fulvus by STRUCTURE and NEWHYBRIDS (Figure 6). In summary, 92.96% and 96.98% of the 199 individuals analyzed with STRUCTURE and NEWHYBRIDS, respectively, were classified consistently with the species assignment based on morphological traits but according to the combined results of the two analyses, six individuals (3.01%) were regarded as hybrids (Table S8).
The intermediate-sized P. fulvus specimens (forearm length ≥ 46 mm) did not correspond with any of the individuals identified as hybrids, either by mitochondrial capture or based on microsatellites. This shows that there is no relationship between putative hybrids identified based on forearm length and those identified by the phylogenetic analysis or genotypic assignment from microsatellites.

4. Discussion

Morphometric differences have been traditionally used for differentiating species in the family Mormoopidae; particularly, forearm length is commonly used for distinguishing between species in the subgenus Pteronotus [24]. However, individuals with intermediate forearms have been recorded in the zone of sympatry of P. fulvus and P. gymnonotus, which have been either described as a separate subspecies or reported as the result of hybridization between the two species [36,37,88]. Our study shows that bats with intermediate forearms (46 mm ≤ forearm length < 49 mm) were classified as P. fulvus based on both the nuclear genes and the microsatellites. Apparently lacking a genetic basis, the clinal variation in size (measured in terms of FA) observed in both species may be due –the result of phenotypic plasticity processes associated with environmental gradients The is suggested by the significant correlation found between size and latitude in this study and also reported by Smith [24], who found that the body size of P. fulvus increases from north to south across its distribution range, while the size of P. gymnonotus decreases from north to south.
The recognition of three evolutionary lineages corresponding to the species P. davyi, P. fulvus and P. gymnonotus, as identified by Pavan and Marroig [31] and Clare et al. [30] is supported also by the results of the species tree. However, the geographic delimitation of these lineages in Central America is still unclear and requires further detailed sampling. Although it seems clear from our study that only P. fulvus and P. gymnonotus occur in sympatry in Mexico.
The phylogenetic relationships between these three lineages inferred from nuclear and mitochondrial markers were discordant, suggesting the action of genetic interactions between the three Pteronotus. The discordances in the relationships built from nuclear and mitochondrial markers might be attributed to an incomplete lineage sorting or a genetic introgression; since both processes yield similar genetic patterns, it is difficult to distinguish them [9,89]. The fact that we found that P. fulvus, P. gymnonotus and P. davyi share mtDNA haplotypes in a small clade that shows no discernable geographic structure (Costa Rica, Oaxaca and Tabasco in Mexico and the Lesser Antilles) suggests that this clade represents an ancestral polymorphism conserved in these lineages due to incomplete sorting since their separation 0.833 My ago. On the other hand, all the P. gymnonotus specimens from Mexico-Costa Rica are genetically closer to P. fulvus than to the South American P. gymnonotus according to the mtDNA-based analyses. This suggests that P. gymnonotus is polyphyletic with respect to this marker, as opposed to the monophyletic groping observed in all P. gymnonotus with the nuclear markers. This explains why the genetic distance (based on the mtDNA marker, COI) intraspecific are higher than interspecific.
Pteronotus gymnonotus and P. fulvus from or near the sympatric zone (Mexico-Panama) have very similar or identical mitochondrial haplotypes. Both the topologies and the network suggest that these two species have had several contacts and finally, completing a mtDNA capture process, as Pavan [88] suggested based in one specimen from Guatemala. The results of this study show that bats from the northern population of P. gymnonotus have replaced their mtDNA with that of the resident species P. fulvus. According to our dating, this process could have occurred during the interglacial periods, when this species could advance northward following the formation of new tropical environments along Central America and the Pacific and Atlantic coasts of Mexico. This mitochondrial capture is also shown by the paired FST between localities of the same species, with higher FST values between some localities of P. fulvus than between P. fulvus and P. gymnonotus. The fact that two of the three P. gymnonotus bats from Panama showed the mtDNA corresponding to the South American lineage while the other showed the captured mtDNA suggests that the boundary of this genetic exchange is located around this latitude in Central America.
The genetic exchange observed in the mtDNA was not detected at the nuclear level, where we found a total differentiation between the sequences of the two species, as expected [90] and as observed in other vertebrates [91]. This differential pattern in mtDNA and nDNA has been extensively documented and explained by various mechanisms [6,91,92,93,94,95]. Overall, mitochondrial replacement is a hybridization mechanism widely recorded in mammals [96] and particularly in bats, including species of similar size (e.g., Myotis myotis and M. blythii [97]) and, as in this case, species differing in size (e.g., Eptesicus serotinus and E. nilsonii [98,99]).
Theoretical models predict this type of exchange to be usually asymmetric and characteristic of species that have undergone abrupt expansion [90]. The asymmetry is mainly explained by demographic differences between the resident (donor) and the colonizing species (undergoing demographic expansion), which usually receives and fixes the new genetic material (Hubbs’ or neutral model) [92,100]. These demographic differences are still observed in Mexico, where the sympatric caves typically harbor large populations of P. fulvus and only few individuals of P. gymnonotus [55]. This genetic capture process does not necessarily involve selective forces, although it seems they may be relevant in some cases [96,101].
In fact, an alternative or supplementary scenario cannot be ruled out, in which selective forces might have favored the movement of local “advantageous” genes from P. fulvus to P. gymnonotus to improve the adaptation to the local environment [102,103]. Some studies have suggested adaptive selection in mitochondrial genes in mammals [104,105], recognizing that mitochondrial metabolism is highly sensitive to environmental conditions, especially variations in temperature [101]. According to our dating (1.021–0.243 Ma), these lineages diverged recently in the Pliocene-Pleistocene (Figure S2), periods when drastic changes in the distribution of tropical forests in Central America and the north of South America took place following the successive glacial-interglacial cycles and fluctuations in sea level that led to the alternating expansion and retraction of the fauna associated with those biomes [106]. These environmental changes, driven by glacial-interglacial cycles, have affected the patterns of gene flow between populations and created similar genetic patterns in markedly different species [106,107] and may have promoted the diversification of the subgenus Pteronotus in this region [67].
The values of genetic differentiation (FST = 0.150 and RST = 0.089) between P. gymnonotus and P. fulvus are generally higher than the differentiation reported for other bat species [97,108,109], even within the same genus (e.g., Pteronotus alitonus and P. rubiginosus) [110]. These results confirm that, although both species currently, share shelters in the sympatric zone and their reproductive cycles partly overlap [39,111,112,113], they remain differentiated as independent evolutionary lineages and as clearly distinct species usually recognizable morphologically by their different size [24,31]. As demonstrated by microsatellites, this does not imply that their gene pools are necessarily isolated. In fact, our results identified six hybrid individuals (3.01% of the total sample). This relatively low hybridization level may be related to differences in the phenology of their reproductive cycles, or to morphological or acoustic differentiation, as reported in other Pteronotus species that share shelters and where asymmetric hybridization has also been detected [101].

5. Conclusions

This study examines size variation and evaluated historical and current hybridization between two sympatric species. Phylogenetic analyses have suggested that both species were in contact and exchanged gene material on several occasions, resulting in a capture of P. fulvus mtDNA by all the P. gymnonotus individuals across the sympatric distribution range (Mexico-Costa Rica), related to pulses of population expansion/retraction in P. gymnonotus associated with Quaternary climatic changes. Such mitochondrial capture might have also been influenced by an evolutionary advantage; a hypothesis that deserves further research. Our microsatellite analyses revealed the existence of ongoing genetic contact between the two species in sympatry, identifying that 3.01% of the specimens sampled are hybrids. No relationship was found between hybridization and the intermediate bats from southern Mexico. However, forearm length was found to be correlated with latitudinal gradients, indicating a possible plasticity response to environmental gradients and the need to be cautious when using forearm length as a diagnostic between these two species, particularly in the sympatric zone.
The results from this study demonstrate that genetic exchange between sympatric, evolutionarily close bat species is an evolutionary phenomenon that may be more common than currently recognized. These results also confirm, once again, the importance of combining multiple molecular markers when studying the identity of lineages and reconstructing evolutionary relationships between species. Therefore, molecular identification results based only on mtDNA must be interpreted with caution; nuclear genetic data, as well as morphological and ecological evidence [7], need to be taken into consideration to ensure the accuracy of any systematic conclusions. Finally, and from a conservation standpoint, the introgression presented in this study does not seem to imply any problem to the genetic make-up and species identity for any of the two involved species. However, conservation concern may rise in relation to the Mexican lineage of P. gymnonotus which is much rare than the relatively common P. fulvus and which population clearly represents a different evolutionary lineage from the nominal species. Therefore, this Mexican lineage needs to be considered as a conservation unit by itself that probably deserves taxonomic recognition.

Supplementary Materials

The following are available online at https://0-www-mdpi-com.brum.beds.ac.uk/article/10.3390/d13050194/s1, Figure S1. Correlation of forearm sizes and latitude of P. fulvus and P. gymnonotus. Figure S2. Bayesian reconstruction with divergence time for nDNA+mtDNA in BEAST. Bars show the 95% interval for the high posterior density (HPD). Divergence time value above each branch, time in millions of years ago. Figure S3. Distribution haplotype for a. P. fulvus and b. P. gymnonotus. Table S1: Study localities, type of amplified marker (B = COI; C = PRKC1; D = STAT5A; F = RAG2; M = Microsatellites) and GenBank access number. Table S2. Primers used for the amplification of fragments of RAG2, intrones (PRKC1 and STAT5A) and COI. Table S3. New microsatellite loci [114,115,116,117]. Table S4. Haplotypes list from P. fulvus, P. davyi and P. gymnonotus for PRKC1 + STAT5A, RAG2 and COI. The number of haplotypes, the studied site and the number of individuals corresponding to each locality are shown in parenthesis. Table S5. Haplotype list for COI marker used for Pteronotus fulvus and P. gymnonotus. The number of haplotypes, the studied site and the number of individuals corresponding to each locality are shown in parenthesis. Table S6. Genetic diversity statistics of microsatellites for each study site of P. fulvus and P. gymnonotus. Samples number (N); summary and mean of the alleles per locus (Na); exclusive alleles (Np); observed heterozygosity (HO), expected heterozygosity (HE); summary and mean of allelic richness (AR). Study localities abbreviations correspond to the locations presented in Table S1. Table S7. Calculation of FST up with COI and RST down with microsatellites. *Significant. Table S8. Number of individuals identified as pure P. fulvus puro (Pfu); P. gymnonotus (Pgy); unclassified hybrids (SC); and hybrids according to STRUCTURE and NEWHYBRIDS with to criterion 2 of Burgarella et al. [87]. The percentage of the total number of individuals sampled by locality is included in parenthesis.

Author Contributions

Conceptualization, A.M.-R., R.L.-W., J.J.; methodology, J.J., A.S.-D., J.L.G.-M.; formal analysis, A.M.-R., F.R.-G., A.C.-C.; investigation, A.M.-R., R.L.-W., J.J., L.M.G.-C.; resources, R.L.-W., J.J., L.M.G.-C.; data curation, R.L.-W.; writing—original draft preparation, A.M.-R., J.J.; writing—review and editing A.M.-R., J.J., F.R.-G., A.S.-D., A.C.-C., J.L.G.-M.; visualization, J.J; supervision, R.L.-W., J.J., project administration, R.L.-W., J.J., L.M.G.-C.; funding acquisition, R.L.-W., J.J., L.M.G.-C. All authors have read and agreed to the published version of the manuscript.

Funding

The work was supported by the Consejo Nacional de Ciencia y Tecnología research grants: R.L.-W. (CB-2009-01/128459). L.M.G.CH. (CB-2014-01/243138), J.A.C./L.O.S.(CONACYT/CNPq263301), J.J. by the Spanish project (SAF2017-89355-P) and fellowship A.M.-R. (no. 790195).

Institutional Review Board Statement

Not applicable.

Informed Consent Statement

Not applicable.

Data Availability Statement

The data presented in this study, are available in the supplementary material.

Acknowledgments

This work was developed in the Divisional Laboratory of Molecular Biology at the Universidad Autónoma Metropolitana-Iztapalapa, Mexico and the Laboratory of Molecular Biology at the Estación Biológica de Doñana, España. In addition, special thanks to the The Southwestern Association of Naturalists (SWAN) and Luis Guillermo Constante-Pérez, Laboratory of fish, Department of Biology, Universidad Autónoma Metropolitana-Iztapalapa, Mexico; Fernando Salgado-Mejia, Departament of Biology, Universidad Autónoma Metropolitana-Iztapalapa, Mexico; M. A. Del Rio-Portilla, Centro de Investigacion Científica y de Educación Superior de Ensenada, Mexico; Arnulfo Medina-Fitoria, Universidad Centroamericana (UCA), Nicaragua; Leandro O. Salles, Departamento de Vertebrados (Mastozoologia), Museu Nacional, Universidad Federal Rio de Janeiro, Rio de Janeiro, Brazil. Pedro Alonso and Amanda Vicente-Santos, Emory University, Costa Rica Collection permits SGPA/DGVS Nos. 09131/14, 05853/13, 9377/19, DGB-IC-058-2017, M-P-SINAC-PNI-ACAT-035-2018 and CC 08450/92; UAM-PTC-449-PROMEP.

Conflicts of Interest

The authors declare no conflict of interest. The funders had no role in the design of the study; in the collection, analyses, or interpretation of data; in the writing of the manuscript, or in the decision to publish the results.

References

  1. Avise, J.C.; Arnold, J.; Ball, R.M.; Bermingham, E.; Lamb, T.; Neigel, J.E.; Reeb, C.A.; Saunders, N.C. Intraspecific phylogeography the mitochondrial DNA bridge between population genetics and systematics. Ann. Rev. Ecol. Syst. 1987, 18, 489–522. [Google Scholar] [CrossRef]
  2. Bickford, D.; Lohman, D.J.; Sodhi, N.S.; Ng, P.K.L.; Meier, R.; Winker, K.; Ingram, K.K.; Das, I. Cryptic species as a window on diversity and conservation. Trends Ecol. Evolut. 2007, 22, 148–155. [Google Scholar] [CrossRef]
  3. Mao, X.; Thong, V.D.; Bates, P.J.J.; Jones, G.; Zhang, S.; Rossiter, S.J. Multiple cases of asymmetric introgression among horseshoe bats detected by phylogenetic conflicts across loci. Biol. J. Linn. Soc. 2013, 110, 346–361. [Google Scholar] [CrossRef] [Green Version]
  4. Gutiérrez-García, T.A.; Vázquez-Domínguez, E. Comparative phylogeography: Designing studies while surviving the process. BioScience 2011, 61, 857–868. [Google Scholar] [CrossRef] [Green Version]
  5. Solari, S.; Martínez-Arias, V. Cambios recientes en la sistemática y taxonomía de murciélagos Neotropicales (Mammalia: Chiroptera). Therya 2014, 5, 167–196. [Google Scholar] [CrossRef]
  6. Mori, E.; Nerva, L.; Lovari, S. Reclassification of the serows and gorals: The end of a neverending story? Mammal. Rev. 2019, 49, 256–262. [Google Scholar] [CrossRef]
  7. Newbound, C.N.; Hisheh, S.; Suyanto, A.; How, R.A.; Schmitt, L.H. Markedly discordant mitochondrial DNA and allozyme phylogenies of tube-nosed fruit bats, Nyctimene, at the Australian–Oriental biogeographical interface. Biol. J. Linn. Soc. 2008, 93, 589–602. [Google Scholar] [CrossRef] [Green Version]
  8. Nesi, N.; Nakouné, E.; Cruaud, C.; Hassanin, A. DNA barcoding of African fruit bats (Mammalia, Pteropodidae). The mitochondrial genome does not provide a reliable discrimination between Epomophorus gambianus and Micropteropus pusillus. Comptes Rendus Biol. 2011, 334, 544–554. [Google Scholar] [CrossRef]
  9. Buckley, T.R.; Cordeiro, M.; Marshall, D.C.; Simon, C. Differentiating between Hypotheses of Lineage Sorting and Introgression in New Zealand Alpine Cicadas (Maoricicada dugdale). Syst. Biol. 2006, 5, 411–425. [Google Scholar] [CrossRef] [PubMed] [Green Version]
  10. Mallet, J. Hybridization as an invasion of the genome. Trends Ecol. Evol. 2005, 20, 229–237. [Google Scholar] [CrossRef]
  11. Pease, J.B.; Hahn, M.W. Detection and polarization of introgression in a five-taxon phylogeny. Syst. Biol. 2015, 64, 651–662. [Google Scholar] [CrossRef] [PubMed] [Green Version]
  12. Arnold, M.L. Natural hybridization as an evolutionary forcé. Annu. Rev. Ecol. Syst. 1992, 23, 237–261. [Google Scholar] [CrossRef]
  13. Mao, X.; Zhang, J.; Zhang, S.; Rossiter, S.J. Historical male-mediated introgression in horseshoe bats revealed by multilocus DNA sequence data. Mol. Ecol. 2010, 19, 1352–1366. [Google Scholar] [CrossRef] [PubMed]
  14. McQuillan, M.A.; Rice, A.M. Differential effects of climate and species interactions on range limits at a hybrid zone: Potential direct and indirect impacts of climate change. Ecol. Evol. 2015, 5, 5120–5137. [Google Scholar] [CrossRef] [Green Version]
  15. Endler, J.A. Geographic Variation, Speciation, and Clines; Monographs in Population Biology 10; Princeton University Press: Princeton, NJ, USA, 1977; p. 246. [Google Scholar]
  16. Moore, W.S. An evaluation of narrow hybrid zones in vertebrates. Q. Rev. Biol. 1997, 52, 263–277. [Google Scholar] [CrossRef] [Green Version]
  17. Moratelli, R.; Peracchi, A.L.; Dias, D.; De Oliveira, J.A. Geographic variation in South American populations of Myotis nigricans (Schinz, 1821) (Chiroptera, Vespertilionidae), with the description of two new species. Mamm. Biol. 2011, 76, 592–607. [Google Scholar] [CrossRef]
  18. Medellín, R.A.; Arita, H.T.; Sánchez, O. Identificación de los Murciélagos de México, Clave de Campo, 2nd ed.; Instituto de Ecología: Mexico City, Mexico, 2008; p. 79. [Google Scholar]
  19. Álvarez-Castañeda, S.T.; Álvarez, T.; González-Ruiz, N. Keys for Identifying Mammals of Mexico in the Field and in the Laboratory; Johns Hopkins University Press: Baltimore, MD, USA, 2017; p. 522. [Google Scholar]
  20. Murray, S.W.; Campbell, P.; Kingston, T.; Zubaid, A.; Francis, C.M.; Kunz, T.H. Molecular phylogeny of hipposiderid bats from Southeast Asia and evidence of cryptic diversity. Mol. Phylogenet. Evol. 2012, 62, 597–611. [Google Scholar] [CrossRef] [PubMed]
  21. Puechmaille, S.J.; Allegrini, B.; Benda, P.; Gürün, K.; Šrámek, J.; Ibañez, C.; Juste, J.; Bilgin, R. A new species of the Miniopterus schreibersii species complex (Chiroptera: Miniopteridae) from the Maghreb Region, North Africa. Zootaxa 2014, 3794, 108–124. [Google Scholar] [CrossRef] [PubMed]
  22. Juste, J.; Ruedi, M.; Puechmaille, S.J.; Salicini, I.; Ibáñez, C. Two new cryptic bat species within the Myotis nattereri species complex (Vespertilionidae, Chiroptera) from the Western Palaearctic. Acta Chiropt. 2018, 20, 285–300. [Google Scholar] [CrossRef] [Green Version]
  23. Galimberti, A.; Spada, M.; Russo, D.; Mucedda, M.; Agnelli, P.; Crottini, A.; Ferri, E.; Martinoli, A.; Casiraghi, M. Integrated Operational Taxonomic Units (IOTUs) in echolocating bats: A bridge between molecular and traditional taxonomy. PLoS ONE 2012, 7, e40122. [Google Scholar]
  24. Smith, J.D. Systematics of the chiropteran family Mormoopidae. Misc. Publ. Univ. Kans. Mus. Nat. Hist. 1972, 56, 1–132. [Google Scholar]
  25. Simmons, N.B.; Conway, T.M. Phylogenetic relationships of mormoopids bats (Chiroptera: Mormoopidae) based on morphological data. Bull. Am. Mus. Nat. Hist. 2001, 258, 1–97. [Google Scholar] [CrossRef] [Green Version]
  26. Pavan, A.C. Family Mormoopidae. Ghost-faced Bats, Naked-backed Bats and Mustached Bats. In Handbook of the Mammals of the World; Wilson, D.E., Mittermeier, R.A., Eds.; Lynx Edicions: Barcelona, España, 2019; Volume 9, pp. 424–443. [Google Scholar]
  27. Leach, W.E. The characters of seven genera of bats with foliaceous appendages to the nose. Trans. Linn. Soc. Lond. 1821, 13, 73–82. [Google Scholar] [CrossRef]
  28. Gray, J.E. A revision of the genera of bats (Vespertilionidae), and the description of some new genera and species. Mag. Zool. Bot. 1838, 2, 483–505. [Google Scholar]
  29. Simmons, N.B. Order Chiroptera. In Mammal Species of the World: A Taxonomic and Geographic, 3rd ed.; Wilson, D.E., Reeder, D.M., Eds.; John Hopkins University Press: Baltimore, MA, USA, 2005; pp. 312–529. [Google Scholar]
  30. Clare, E.L.; Lim, B.K.; Fenton, M.B.; Hebert, P.D.N. Neotropical Bats: Estimating Species Diversity with DNA Barcodes. PLoS ONE 2011, 6, e22648. [Google Scholar]
  31. Pavan, A.C.; Marroig, G. Integrating multiple evidences in taxonomy: Species diversity and phylogeny of mustached bats (Mormoopidae: Pteronotus). Mol. Phylogenet. Evol. 2016, 103, 184–198. [Google Scholar] [CrossRef]
  32. López-Wilchis, R.; Flores-Romero, M.; Guevara-Chumacero, L.M.; Serrato-Díaz, A.; Díaz-Larrea, J.; Salgado-Mejia, F.; Ibañez, C.; Salles, L.O.; Juste, J. Evolutionary scenarios associated with the Pteronotus parnellii cryptic species-complex (Chiroptera: Mormoopidae). Acta Chiropt. 2016, 18, 91–116. [Google Scholar] [CrossRef] [Green Version]
  33. Zárate-Martínez, D.G.; López-Wilchis, R.; Ruiz-Ortíz, J.D.; Barriga-Sosa, I.L.A.; Serrato, D.A.; Ibáñez, C.; Juste, J.; Guevara-Chumacero, L.M. Intraspecific evolutionary relationships and diversification patterns of the Wagner’s mustached bat, Pteronotus personatus (Chiroptera: Mormoopidae). Acta Chiropt. 2018, 20, 51–58. [Google Scholar] [CrossRef]
  34. Lewis-Oritt, N.; Porter, C.A.; Baker, R.J. Molecular Systematics of the Family Mormoopidae (Chiroptera) based on cytochrome b and recombination activating gene 2 sequences. Mol. Phylogenet. Evol. 2001, 20, 426–436. [Google Scholar] [CrossRef]
  35. Dávalos, L.M. The geography of diversification in the mormoopids (Chiroptera: Mormoopidae). Biol. J. Linn. Soc. 2006, 88, 101–118. [Google Scholar] [CrossRef] [Green Version]
  36. Goodwin, G.G.; Macdougall, T.B.; Marcus, J.R. Two new mammals from Mexico. Am. Mus. Novit. 1958, 1871, 1–3. [Google Scholar]
  37. Álvarez, T.; Álvarez-Castañeda, S.T. Notas sobre el estado taxonómico de Pteronotus davyi en Chiapas y de Hylonycteris en México (Mammalia: Chiroptera). An. Esc. Nac. Cien. Biol. 1991, 34, 223–229. [Google Scholar]
  38. Ortega, R.J.; Arita, H.T. Pteronous gymnonotus. In Los mamíferos Silvestres de México; Ceballos, G., Oliva, G., Eds.; Comisión Nacional para el Conocimiento y Uso de la Biodiversidad: Distrito Federal, Mexico, 2005; p. 747. [Google Scholar]
  39. Adams, J.K. Pteronotus davyi. Mamm. Species 1989, 346, 1–5. [Google Scholar] [CrossRef]
  40. Sikes, R.S. Animal Care and Use Committee of the American Society of Mammalogists. Guidelines of the American Society of Mammalogists for the use of wild mammals in research and education. J. Mamm. 2016, 97, 663–688. [Google Scholar] [CrossRef] [PubMed]
  41. Anonymous. Lineamientos para la Conducción Ética de la Investigación, la Docencia y la Difusión de la División de Ciencias Biológicas y de la Salud; Universidad Autónoma Metropolitana: Iztapalapa, Mexico, 2010; p. 39. [Google Scholar]
  42. Hintze, J. 2011 PASS 11; NCSS; LLC: Kaysville, UT, USA, 2011; Available online: www.ncss.com (accessed on 19 May 2020).
  43. Ochoa, J.G.; Castellanos, H.; Ibañez, C. Records of bats and rodents from Venezuela. Mammalian 1988, 52, 175–180. [Google Scholar] [CrossRef] [Green Version]
  44. Gonçalves, E.; Gregorin, R. Quirópteros da Estação Ecológica da Serra das Araras, Mato Grosso, Brasil, com o primeiro registro de Artibeus gnomus e A. anderseni para o cerrado. Lundiana 2004, 5, 143–149. [Google Scholar]
  45. Da Rocha, P.A.; Feijó, J.A.; Mikalauskas, J.S.; Ferrari, S.F. First records of mormoopid bats (Chiroptera, Mormoopidae) from the Brazilian Atlantic Forest. Mammalia 2011, 75, 295–299. [Google Scholar] [CrossRef]
  46. Pérez, C.S.G. 2016a USAC Mammals Collection. Version 8.1. Museo de Historia Natural de la USAC MUSHNAT. Occurrence Dataset https://0-doi-org.brum.beds.ac.uk/10.15468/16fwgc accessed via GBIF.org. Available online: https://www.gbif.org/occurrence/859263445 (accessed on 19 May 2020).
  47. Pérez, C.S.G. 2016b USAC Mammals Collection. Version 8.1. Museo de Historia Natural de la USAC MUSHNAT. Occurrence Dataset https://0-doi-org.brum.beds.ac.uk/10.15468/16fwgc accessed via GBIF.org. Available online: https://www.gbif.org/occurrence/859263507 (accessed on 19 May 2020).
  48. Feijó, A.; Da Rocha, P.A. Morcegos da Estação Ecológica Aiuaba, Ceará, nordeste do Brasil: Uma unidade de proteção integral na Caatinga. Mastozool. Neotrop. 2017, 24, 333–351. [Google Scholar]
  49. Cook, J. 2020a MSB Mammal Collection (Arctos). Version 35.37. Museum of Southwestern Biology. Occurrence Dataset https://0-doi-org.brum.beds.ac.uk/10.15468/oirgxw accessed via GBIF.org. Available online: https://www.gbif.org/occurrence/2303054715 (accessed on 19 May 2020).
  50. Cook, J. 2020b MSB Mammal Collection (Arctos). Version 35.37. Museum of Southwestern Biology. Occurrence Dataset https://0-doi-org.brum.beds.ac.uk/10.15468/oirgxw accessed via GBIF.org. Available online: https://www.gbif.org/occurrence/1828901377 (accessed on 19 May 2020).
  51. López-Wilchis, R.; (Universidad Autónoma Metropolitana, Mexico City, Mexico). Personal Communication, 2020.
  52. Borisenko, A.V.; Lim, B.K.; Ivanova, N.V.; Hanner, R.H.; Hebert, P.D. DNA barcoding in surveys of small mammal communities: A field study in Suriname. Mol. Ecol. Resour. 2008, 8, 471–479. [Google Scholar] [CrossRef]
  53. Khan, F.A.A.; Phillips, C.D.; Baker, R.J. Timeframes of speciation, reticulation, and hybridization in the bulldog bat explained through phylogenetic analyses of all genetic transmission elements. Syst. Biol. 2013, 63, 96–110. [Google Scholar] [CrossRef] [Green Version]
  54. Engstrom, M.D.; Lim, B.K.; Eger, J.L.; Borisenko, A.V. ROM Mammals—Southern Central America (Unpublished).
  55. López-Wilchis, R.; Méndez-Rodríguez, A.; Juste, J.; García-Mudarra, J.L.; Salgado-Mejia, F.; Guevara-Chumacero, L.M. The Big Naked-backed Bat, Pteronotus gymnonotus (J. A. Wagner, 1843), Chiroptera, Mormoopidae, in its northernmost geographic distribution range. Therya 2021, 12, 1–11. [Google Scholar]
  56. Lopera-Barrero, N.M.; Povh, J.A.; Ribeiro, R.P.; Gomes, P.C.; Jacometo, C.B.; Silva Lopes, T.D. Comparación de protocolos de extracción de ADN con muestras de aleta y larva de peces: Extracción modificada con cloruro de sodio. Cienc. Investig. Agrar. 2008, 35, 77–86. [Google Scholar] [CrossRef] [Green Version]
  57. Baker, R.C.; Porter, J.P.; Van Den, R.B. Systematics of Bats of the Family Phillostomidae Based on RAG2 DNA Sequences. Occas. Pap. Mus. Tex. Tech. Univ. 2000, 202, 1–16. [Google Scholar]
  58. Ivanova, N.V.; Dewaard, J.R.; Hebert, P.D.N. An inexpensive, automation- friendly protocol for recovering high-quality DNA. Mol. Ecol. Notes 2006, 6, 998–1002. [Google Scholar] [CrossRef]
  59. Eick, G.N.; Jacobs, D.S.; Matthee, C.A. A nuclear DNA phylogenetic perspective on the evolution of echolocation and historical biogeography of extant bats (Chiroptera). Mol. Biol. Evol. 2005, 22, 1869–1886. [Google Scholar] [CrossRef] [PubMed] [Green Version]
  60. Drummond, A.J.; Ashton, B.; Buxton, S.; Cheung, M.; Cooper, A.; Duran, C.; Field, M.; Heled, J.; Kearse, M.; Markowitz, S.; et al. Geneious v 5.6.4 Created by Biomatters. 2012. Available online: http://www.geneious.com (accessed on 19 May 2020).
  61. Kearse, M.; Moir, R.; Wilson, A.; Stones-Havas, S.; Cheung, M.; Sturrock, S.; Buxton, S.; Cooper, A.; Markowitz, S.; Duran, C.; et al. Geneious Basic: An integrated and extendable desktop software platform for the organization and analysis of sequence data. Bioinformatics 2012, 28, 647–1649. [Google Scholar] [CrossRef] [PubMed]
  62. Méndez-Rodríguez, A.; López-Wilchis, R.; Díaz, A.S.; Del Río-Portilla, M.A.; Guevara-Chumacero, L.M. Isolation and characterization of microsatellite marker loci in the Wagner’s mustached bat Pteronotus psilotis (Chiroptera: Mormoopidae) and cross-amplification in other related species. J. Genet. 2018, 97, 1179–1183. [Google Scholar] [CrossRef] [Green Version]
  63. Ortega, J.; Maldonado, J.E.; Arita, H.T.; Wilkinson, G.S.; Fleischer, R.C. Characterization of microsatellite loci in the Jamaican fruit-eating bat Artibeus jamaicensis and cross-species amplification. Mol. Ecol. Notes 2002, 2, 462–464. [Google Scholar] [CrossRef] [Green Version]
  64. Bouckaert, R.; Heled, J.; Kühnert, D.; Vaughan, T.; Wu, C.-H.; Xie, D.; Suchard, M.A.; Rambaut, A.; Drummond, A.J. A Software Platform for Bayesian Evolutionary Analysis. BEAST 2. PLoS Comput. Biol. 2014, 10. [Google Scholar] [CrossRef] [PubMed] [Green Version]
  65. Miller, M.A.; Pfeiffer, W.; Schwartz, T. Creating the CIPRES Science Gateway for Inference of Large Phylogenetic Trees in Proceedings of the Gateway Computing Environments; Workshop (GCE): New Orleans, LA, USA, 2010; pp. 1–8. [Google Scholar]
  66. Rambaut, A.; Drummond, A. Figtree v 1.1.2; Institute of Evolutionary Biology, University of Edinburgh: Edinburgh, UK, 2008. [Google Scholar]
  67. Pavan, A.C.; Marroig, G. Timing and patterns of diversification in the Neotropical bat genus Pteronotus (Mormoopidae). Mol. Phylogenet. Evol. 2017, 108, 61–69. [Google Scholar] [CrossRef]
  68. Ronquist, F.; Teslenko, M.; Van Der Mark, P.; Ayres, D.L.; Darling, A.; Höhna, S.; Larget, B.; Liu, L.; Sucard, M.A.; Huelsenbeck, J.P. MrBayes 3.2: Efficient Bayesian phylogenetic inference and model choice across a large model space. Syst. Biol. 2012, 61, 539–542. [Google Scholar] [CrossRef] [PubMed] [Green Version]
  69. Swofford, D.L. Paup*: Phylogenetic Analysis Using Parsimony (*and Other Methods), Version 4.0b10; Sinauer Associates, Inc., Publishers: Sunderland, MA, USA, 2002. [Google Scholar]
  70. Posada, D. jModelTest: Phylogenetic Model Averaging. Mol. Biol. Evol. 2008, 25, 1253–1256. [Google Scholar] [CrossRef] [PubMed]
  71. Alfaro, M.E.; Huelsenbeck, J.P. Comparative performance of Bayesian and AIC-based measures of phylogenetic model uncertainty. Syst. Biol. 2006, 55, 89–96. [Google Scholar] [CrossRef]
  72. Drummond, A.J.; Rambaut, A. BEAST: Bayesian evolutionary analysis by Sampling trees. BMC Evol. Biol. 2007, 7, 214. [Google Scholar] [CrossRef] [PubMed] [Green Version]
  73. Bandelt, H.-J.; Forster, P.; Röhl, A. Median-joining networks for inferring intraspecific phylogenies. Mol. Biol. Evol. 1999, 16, 37–48. [Google Scholar] [CrossRef] [PubMed]
  74. Pfenninger, M.; Posada, D. Phylogeographic history of the land snail Candidula unifasciata (Helicellinae, Stylommatophora): Fragmentation, corridor migration, and secondary contact. Evolution 2002, 56, 1776–1788. [Google Scholar] [CrossRef]
  75. Tamura, K.; Peterson, D.; Peterson, N.; Stecher, G.; Nei, M.; Kumar, S. MEGA5: Molecular evolutionary genetics analysis using maximum likelihood, evolutionary distance, and maximum parsimony methods. Mol. Biol. Evol. 2011, 28, 2731–2739. [Google Scholar] [CrossRef] [Green Version]
  76. Excoffier, L.; Laval, G.; Schneider, S. Arlequín ver 3.0: An integrated software package for population genetics data analysis. Evol. Bioinform. Online 2005, 1, 47–50. [Google Scholar] [CrossRef] [Green Version]
  77. Van Oosterhout, C.; Hutchinson, W.F.; Wills, D.P.M.; Shipley, P. Microchecker: Software for identifying and correcting genotyping errors in microsatellite data. Mol. Ecol. Notes 2004, 4, 535–538. [Google Scholar] [CrossRef]
  78. Chapuis, M.-P.; Estoup, A. Microsatellite null alleles and estimation of population differentiation. Mol. Biol. Evol. 2007, 24, 621–631. [Google Scholar] [CrossRef] [Green Version]
  79. Rice, W.R. Analyzing tables of statistical tests. Evolution 1989, 43, 223–225. [Google Scholar] [CrossRef] [PubMed]
  80. Peakall, R.; Smouse, P.E. GENALEX 6: Genetic analysis in Excel. Population genetic software for teaching and research. Mol. Ecol. Notes 2006, 6, 288–295. [Google Scholar] [CrossRef]
  81. Goudet, J. 2001 FSTAT, a Program to Estimate and Test Gene Diversities and Fixation Indices (Version 2.9.3). Available online: http://www.unil.ch/izea/softwares/fstat.html (accessed on 19 May 2020).
  82. Pritchard, J.K.; Stephens, M.; Donelly, P. Inference of population structure using multilocus genotype data. Genetic 2000, 155, 945–995. [Google Scholar] [CrossRef]
  83. Evanno, G.; Regnaut, S.; Goudet, J. Detecting the number of clusters of individuals using the software Structure: A simulation study. Mol. Ecol. 2005, 14, 2611–2620. [Google Scholar] [CrossRef] [PubMed] [Green Version]
  84. Earl, D.A.; Vonholdt, B.M. Structure Harvester: A website and program for visualizing STRUCTURE output and implementing the Evanno method. Conserv. Genet. Resour. 2012, 4, 359–361. [Google Scholar] [CrossRef]
  85. Jakobsson, M.; Rosenberg, N.A. CLUMPP: A cluster matching and permutation program for dealing with label switching and multimodality in analysis of population structure. Bioinformatics 2007, 23, 1801–1806. [Google Scholar] [CrossRef] [Green Version]
  86. Anderson, E.C.; Thompson, E.A. A model-based method for identifying species hybrids using multilocus genetic data. Genetics 2002, 160, 1217–1229. [Google Scholar] [CrossRef]
  87. Burgarella, C.; Lorenzo, Z.; Jabbour-Zahab, R.; Lumaret, R.; Guichoux, E.; Petit, R.J.; Soto, Á.; Gil, L. Detection of hybrids in nature: Application to oaks (Quercus suber and Q. ilex). Heredity 2009, 102, 442–452. [Google Scholar] [CrossRef] [Green Version]
  88. Pavan, A.C. Sistemática e História Evolutiva do Gênero de Morcegos Notropical Pteronotus (Chiroptera: Mormoopidae); Doctorate-Instituto de Biociêncies da Universidade de São Paulo, Departamento de Genética e Biologia Evolutiva: São Paulo, Brazil, 2014. [Google Scholar]
  89. Avise, J.C. Molecular Markers, Natural History and Evolution; Sinauer: Sunderland, MA, USA, 2004; p. 684. [Google Scholar]
  90. Currat, M.; Ruedi, M.; Petit, R.J.; Excoffier, L. The hidden side of invasions: Massive introgression by local genes. Evolution 2008, 62, 1908–1920. [Google Scholar] [CrossRef]
  91. Chen, W.; Bi, K.; Fu, J.K. Frequent mitochondrial gene introgression among high elevation Tibetan megophryid frogs revealed by conflicting gene genealogies. Mol. Ecol. 2009, 18, 2856–2876. [Google Scholar] [CrossRef]
  92. Mao, X.; He, G.; Hua, P.; Jones, G.; Zhang, S.; Rossiter, S.J. Historical introgression and the persistence of ghost alleles in the intermediate horseshoe bat (Rhinolophus affinis). Mol. Ecol. 2012, 22, 1035–1050. [Google Scholar] [CrossRef] [PubMed]
  93. Kuo, H.C.; Chen, S.F.; Fang, Y.P.; Cotton, J.A.; Parker, J.D.; Csorba, G.; Lim, B.K.; Eger, J.L.; Chen, C.H.; Chuo, C.H.; et al. Speciation processes in putative island endemic sister bat species: False impressions from mitochondrial DNA and microsatellite data. Mol. Ecol. 2015, 24, 5910–5926. [Google Scholar] [CrossRef] [PubMed]
  94. Gompert, Z.; Forister, M.L.; Fordyce, J.A.; Nice, C.C. Widespread mito-nuclear discordance with evidence for introgressive hybridization and selective sweeps in Lycaeides. Mol. Ecol. 2008, 17, 5231–5244. [Google Scholar] [CrossRef] [PubMed]
  95. Chan, K.M.A.; Levin, S.A. Leaky prezygotic isolation and porous genomes: Rapid introgression of maternally inherited DNA. Evolution 2005, 59, 720–729. [Google Scholar] [CrossRef] [PubMed]
  96. Melo-Ferreira, J.; Boursot, P.; Randi, E.; Kryukov, A.; Suchentrunk, F.; Ferrand, N.; Alves, P.C. The rise and fall of the mountain hare (Lepus timidus) during Pleistocene glaciations: Expansion and retreat with hybridization in the Iberian Peninsula. Mol. Ecol. 2007, 16, 605–618. [Google Scholar] [CrossRef] [PubMed]
  97. Berthier, P.; Excoffier, L.; Ruedi, M. Recurrent replacement of mtDNA and cryptic hybridization between two sibling bat species Myotis myotis and Myotis blythii. Proc. R. Soc. Lond. B Biol. Sci. 2006, 273, 3101–3123. [Google Scholar] [CrossRef] [PubMed] [Green Version]
  98. Artyushin, I.V.; Bannikova, A.A.; Lebedev, V.S.; Kruskop, S.V. Mitochondrial DNA relationships among North Palaearctic Eptesicus (Vespertilionidae, Chiroptera) and past hybridization between common Serotine and Northern bat. Zootaxa 2009, 2262, 40–52. [Google Scholar]
  99. Juste, J.; Benda, P.; Garcia-Mudarra, J.L.; Ibanez, C. Phylogeny and systematics of Old W orld serotine bats (genus Eptesicus, Vespertilionidae, Chiroptera): An integrative approach. Zool. Scr. 2013, 42, 441–457. [Google Scholar] [CrossRef] [Green Version]
  100. Petit, R.J.; Excoffier, L. Gene flow and species delimitation. Trends Ecol. Evol. 2009, 24, 386–393. [Google Scholar] [CrossRef]
  101. Dong, J.; Mao, X.; Sun, H.; Irwin, D.M.; Zhang, S.; Hua, P. Introgression of mitochondrial DNA promoted by natural selection in the Japanese pipistrelle bat (Pipistrellus abramus). Genetica 2014, 142, 483–494. [Google Scholar] [CrossRef]
  102. Bachtrog, D.; Thornton, K.; Clark, A.; Andolfatto, P. Extensive introgression of mitochondrial DNA relative to nuclear genes in the Drosophila yakuba species group. Evolution 2006, 60, 292–302. [Google Scholar] [CrossRef] [PubMed]
  103. Mao, X.; He, G.; Zhang, J.; Rossiter, S.J.; Zhang, S. Lineage divergence and historical gene flow in the Chinese horseshoe bat (Rhinolophus sinicus). PLoS ONE 2013, 8, e56786. [Google Scholar] [CrossRef] [PubMed] [Green Version]
  104. Stewart, J.B.; Freyer, C.; Elson, J.L.; Wredenberg, A.; Cansu, Z.; Trifunovic, A.; Larsson, N.G. Strong purifying selection in transmission of mammalian mitochondrial DNA. PLoS Biol. 2008, 6, 63–71. [Google Scholar] [CrossRef] [PubMed]
  105. Mao, X.; Zhu, G.; Zhang, L.; Zhang, S.; Rossiter, S.J. Differential introgression among loci across a hybrid zone of the intermediate horseshoe bat (Rhinolophus affinis). BMC Evol. Biol. 2014, 14, 154. [Google Scholar] [CrossRef] [Green Version]
  106. Bagley, J.C.; Johnson, J.B. Phylogeography and biogeography of the lower Central American Neotropics: Diversification between two continents and between two seas. Biol Rev. 2014, 89, 767–790. [Google Scholar] [CrossRef]
  107. Wang, I.J.; Crawford, A.J.; Bermingham, E. Phylogeography of the Pygmy Rain Frog (Pristimantis ridens) across the lowland wet forests of isthmian Central America. Mol. Phylogenet. Evol. 2008, 47, 992–1004. [Google Scholar] [CrossRef] [PubMed]
  108. Bogdanowicz, W.; Piksa, K.; Tereba, A. Hybridization hotspots at bat swarming sites. PLoS ONE 2012, 7, 1–10. [Google Scholar] [CrossRef] [Green Version]
  109. Centeno-Cuadros, A.; Razgour, O.; Garcia-Mudarra, J.L.; Mingo-Casas, P.; Sandonís, V.; Redondo, A.; Ibáñez, C.; de Paz, O.; Martinez-Alós, S.; Pérez, S.G.; et al. Comparative phylogeography and asymmetric hybridization between cryptic bat species. J. Zool. Syst. Evol. Res. 2019, 57, 1004–1010. [Google Scholar] [CrossRef] [Green Version]
  110. Filippi-Codaccioni, O.; Beugin, M.P.; De Vienne, D.M.; Portanier, E.; Fouchet, D.; Kaerle, C.; Muselet, L.; Queney, G.; Petit, E.J.; Regis, C.; et al. Coexistence of two sympatric cryptic bat species in French Guiana: Insights from genetic, acoustic and ecological data. BMC Evol. Biol. 2018, 18, 175. [Google Scholar] [CrossRef]
  111. Nowak, R.M. Walker’s Bats of the World, 5th ed; The Johns Hopkins University Press: Baltimore, MA, USA, 1991; p. 288. [Google Scholar]
  112. Wilson, D.E. Reproduction in Neotropical bats. Period Biol. 1973, 75, 215–217. [Google Scholar]
  113. Hayssen, V.; Van Tienhoven, A.; Van Tienhoven, A. Asdell’s Patterns of Mammalian Reproduction: A Compendium of Species-Specific Data, 2nd ed.; Cornell University Press: Ithaca, NY, USA, 1993; p. 1023. [Google Scholar]
  114. Aljanabi, S.M.; Martinez, I. Universal and rapid salt-extraction of high quality genomic DNA for PCR-based techniques. Nucleic Acids Res. 1997, 25, 4692–4693. [Google Scholar] [CrossRef] [PubMed]
  115. Fisher, S.; Barry, A.; Abreu, J.; Minie, B.; Nolan, J.; Delorey, T.M.; Young, G.; Fennell, T.J.; Allen, A.; Ambrogio, L. A scalable, fully automated process for construction of sequence-ready human exome targeted capture libraries. Genome Biol. 2011, 12, R1. [Google Scholar] [CrossRef] [PubMed] [Green Version]
  116. Faircloth, B.C.; Glenn, T.C. Not all sequence tags are created equal: Designing and validating sequence identification tags robust to indels. PLoS ONE 2012, 7, e42543. [Google Scholar] [CrossRef] [PubMed]
  117. Castoe, T.A.; Poole, A.W.; De Koning, A.P.J.; Jones, K.L.; Tomback, D.F.; Oyler-McCance, S.J.; Fike, J.A.; Lance, S.L.; Streicher, J.W.; Smith, E.N.; et al. Rapid microsatellite identification from Illumina paired-end genomic sequencing in two birds and a snake. PLoS ONE 2012, 7, e30953. [Google Scholar] [CrossRef] [PubMed] [Green Version]
Figure 1. (a). Study localities and distribution of the three Pteronotus species: (b). P. fulvus, (c). P. davyi and (d). P. gymnonotus following [31].
Diversity 13 00194 g001
Figure 2. Forearm length (mm) of Pteronotus fulvus (white; FA < 46 mm) and P. gymnonotus (black; FA ≥ 49 mm) and the intermediate individuals considered as putative hybrids (gray; 46 mm ≤ FA < 49 mm). Males (M) and females (F).
Diversity 13 00194 g002
Figure 3. Species tree generated in *BEAST with nDNA and DNAmt. Support values (Pp) are given for each clade. P. macleayii (Pma) and P. quadridens (Pqu) were used as outgroups. See text for details of the analysis.
Diversity 13 00194 g003
Figure 4. (a). Phylogenetic reconstruction based on nDNA (PRKC1+STAT5A+RAG2) with Posterior probability (IB)/Bootstrap (ML) support on the nodes and using P. macleayi (Pma) and P. quadridens (Pqu) as outgroups. (b) Haplotype Networks for nuclear markers RAG2 and STAT5A+PRKC1. Colors indicate species: white for P. fulvus, gray for P. davyi and black for P. gymnonotus. Smaller lines that connect each haplotype indicate mutational steps between them. Black-small triangle represent hypothetical haplotypes and the size of each circle represents the frequency of different haplotypes. (c). Phylogenetic reconstruction of mtDNA (COI). (d). COI haplotype network.
Diversity 13 00194 g004
Figure 5. mtDNA haplotype networks for Pteronotus fulvus and P. gymnonotus indicating the three haplogroups (I, II and III). Small lines connecting haplotypes denote the mutational steps between them. Black, small triangles represent hypothetical haplotypes and the size of each circle represents the frequency of different haplotypes. Percentage values indicate genetic distance among haplotype groups.
Diversity 13 00194 g005
Figure 6. Microsatellite based species assignment of Pteronotus fulvus and P. gymnonotus samples by location (a). Results from the analysis in STRUCTURE (K2). (b). Assignment to species and hybrids obtained with NEWHYBRIDS. Each individual is represented by a vertical bar, in asterisks the individuals treated hybrids for each program and the abbreviations correspond to the locations presented in Table 1.
Diversity 13 00194 g006
Table 1. Study localities. The allopatric and sympatric localities of P. fulvus and P. gymnonotus are mentioned.
AcronymSympatric/AllopatricStudy LocalitiesCountrySpecies
LEAllopatricLaguna Encantada, VeracruzMexicoP. fulvus
CHSympatricCerro Huatulco, OaxacaMexicoP. fulvus
LVSympatricLa Venta, OaxacaMexicoP. fulvus
MTSympatricMartínez de la Torre, OaxacaMexicoP. gymnonotus
TaSympatricTapijulapa, TabascoMexicoP. fulvus
P. gymnonotus
ABSympatricAgua Blanca, TabascoMexicoP. fulvus
P. gymnonotus
LOAllopatricLos Ortices, ColimaMexicoP. fulvus
POAllopatricPlaya de Oro, ColimaMexicoP. fulvus
JaAllopatricJaliscoMexicoP. fulvus
CaSympatricCampecheMexicoP. fulvus
ChSympatricChiapasMexicoP. fulvus
Gu1SympatricTikal, El PeténGuatemalaP. fulvus
Gu2SympatricLanquin Caves, Alta VerapazGuatemalaP. fulvus
P. gymnonotus
ESSympatricEl Refugio, AhuachapanEl SalvadorP. fulvus
HoSympatricColónHondurasP. fulvus
BeSympatricGallon Jug, Distrito de Orange WalkBelizeP. fulvus
NiSympatricNidiri, Masaya Volcano ParkNicaraguaP. fulvus
P. gymnonotus
CRSympatricBarra Honda National ParkCosta RicaP. fulvus
P. gymnonotus
PaAllopatricAltos de Campana National ParkPanamaP. gymnonotus
VeAllopatricHato la Florida, BolivarVenezuelaP. gymnonotus
Do-St. JosephDominicaP. davyi
TT-Arena Reserve, NarivaTrinidad and TobagoP. davyi
SL-CastriesSanta LuciaP. davyi
GyAllopatricIwokrama Reserve, Potaro-SiparuniGuyanaP. gymnonotus
Su1AllopatricBrokopodoSurinamP. gymnonotus
Su2AllopatricBakhuis, SipaliwiniSurinamP. gymnonotus
PeAllopatricHuánucoPeruP. gymnonotus
GoAllopatricCaverna do Bigode, GoiásBrazilP. gymnonotus
Br1AllopatricBarro Alto, GoiásBrazilP. gymnonotus
Br2AllopatricTapirapé-Aquiri, Marabá, ParáBrazilP. gymnonotus
Br3AllopatricCarajás, Parauapebas, ParáBrazilP. gymnonotus
Br4AllopatricCanaã dos Carajás, ParáBrazilP. gymnonotus
Br5AllopatricChapada Diamantina, BahíaBrazilP. gymnonotus
Br6AllopatricUsina Serra Grande, AlagoasBrazilP. gymnonotus
Br7AllopatricItabaina, SergipeBrazilP. gymnonotus
Br8AllopatricAiuba, Ceará, BrazilBrazilP. gymnonotus
Br9AllopatricJangada, Mato GrossoBrazilP. gymnonotus
Publisher’s Note: MDPI stays neutral with regard to jurisdictional claims in published maps and institutional affiliations.

