
On the Use of Stable Hydrogen Isotope Measurements (δ2H) to Discern Trophic Level in Avian Terrestrial Food Webs


1
Van Wijk Eco Research, Bagsværddal 7, st tv, 2880 Bagsværd, Denmark
2
Yahkat Barshep, A. P. Leventis Ornithological Research Institute, Laminga, Jos East 930001, Plateau State, Nigeria
3
Environment and Climate Change Canada, 11 Innovation Blvd., Saskatoon, SK S7N 3H5, Canada
4
Department of Biology, University of Western Ontario, London, ON N6A 5B7, Canada
*
Author to whom correspondence should be addressed.
Diversity 2021, 13(5), 202; https://0-doi-org.brum.beds.ac.uk/10.3390/d13050202
Submission received: 30 March 2021
/
Revised: 3 May 2021
/
Accepted: 7 May 2021
/
Published: 12 May 2021
(This article belongs to the Collection Stable Isotope Ecology)
Abstract
:The measurement of stable hydrogen isotope ratios (δ2H) in animal tissues is a popular means of inferring spatial origins and migratory connections. However, the use of this isotope to infer diet and potentially trophic position remains poorly understood, especially in non-aquatic terrestrial ecosystems. In many animal communities, tissue δ15N values are strongly associated with trophic position. Correlations between tissue δ2H and δ15N are expected, then, if δ2H is affected by trophic enrichment of 2H. In addition, within sites, we would expect higher tissue δ2H values in insectivorous species compared to granivores or nectarivores. We tested these hypotheses for two resident avian communities in Nigeria consisting of 30 species representing a range of dietary guilds (granivores, frugivores, nectarivores, omnivores, insectivores) by comparing feather δ2H, δ15N and δ13C values. We found considerable isotopic overlap among all guilds except granivores, with no clear pattern of enrichment in 2H with trophic position. However, at one of our sites (open scrubland), feather δ2H was positively correlated with feather δ15N (R2 = 0.30) compared to a closed canopy forest site (R2 = 0.09). Our results indicate weak evidence for predictable trophic enrichment in 2H in terrestrial environments and indicate that controlled studies are now required to definitively elucidate the behavior of H isotopes in terrestrial food webs.
1. Introduction
The measurement of naturally occurring stable isotope ratios of several elements in food webs has provided a wealth of ecological information over the last decades. Overwhelmingly, isotopic applications to date have been used in ecological studies to trace origins of primary production and consumer trophic position. Such approaches, in turn, have largely depended on the use of stable carbon (δ13C) and nitrogen (δ15N) isotope measurements based on key isotopic differences in photosynthetic pathways (C3, C4, CAM) and isotopic pools, as well as on the generally systematic increase in δ15N with trophic level ([1], but see [2,3,4,5]). More recently, the use of stable hydrogen isotope (δ2H) measurements in plant and animal tissues has increased, especially as a tool to evaluate geographic origins of migratory animals [6] or as a forensic tool to evaluate authenticity of origin of several materials [7]. However, there remains great interest in using δ2H measurements to also glean information on energy fluxes within ecosystems as well as a potential indicator of trophic position of consumers in terrestrial and aquatic food webs [8]. Interest in using δ2H measurements as a trophic indicator stems from studies showing a weak correlation between δ2H and δ15N values in food webs [9,10,11]. However, such trophic enrichment in δ2H can derive from exchange with ambient waters in aquatic food webs, causing a so-called apparent trophic enrichment [12], and processes that can lead to metabolic trophic enrichment in terrestrial food webs per se are by no means clear. In fact, there seems to be almost no experimental support for metabolic processes as a mechanism for changes in δ2H values in terrestrial and aquatic consumers once other mechanisms are considered [12,13,14,15,16]. Nonetheless, data from bone collagen δ2H measurements [9,11] appear to reflect trophic level, such that δ2H values of carnivores are higher relative to those of other trophic groups.
Birchall et al. [9] is a much-quoted study reporting a trophic effect in δ2H in food webs. However, much of the uncertainty in that report was based in the fact that their analyses mixed aquatic and terrestrial organisms, and the methodology for the δ2H measurements did not account for exchangeable H in the collagen samples. Another study involving H isotopes in a controlled laboratory plant–insect system also found a significant trophic enrichment between plant and moth tissues in larvae and adults [17], which contradicts the findings of a separate controlled study that observed a negligible diet-tissue discrimination between monarch butterflies and host milkweed [14]. As noted by Vander Zanden et al. [8], it is still unknown whether the reported trophic enrichment occurs broadly in terrestrial organisms, and, if so, whether the mechanism is similar to the apparent trophic compounding effect found in aquatic organisms. Surprisingly, there are few published data corresponding to tissue δ2H values within local food webs that span trophic levels. Clearly, more data are needed to evaluate just how and when consumer tissue δ2H values can be used to infer trophic position.
Here, we examined feathers of resident terrestrial avian species known to have grown their feathers within a confined region of Nigeria, Africa. These species represented a range of trophic positions from granivores through to insectivores. In addition to measuring feather δ2H values, we also measured feather δ13C and δ15N values to evaluate possible trophic enrichment. We anticipated a positive relationship between feather δ2H and δ15N values and highest δ2H values in insectivores if hydrogen isotopes were indeed linked to trophic level.
2. Materials and Methods
This study was conducted on the Jos Plateau (c. 1240 m a.s.l), within the northern Guinea savannah vegetation zone of north-central Nigeria. The general vegetation patterns in the savannah zone consist of predominantly tall grasses, shrubs, lianas and dry woodlands. Shrubs and trees such as Rhus longipes, R. natalensis, Ochna schweinfurthiana, Isoberlinea doka, Parkia biglobosa, Uapaca somon, Vitex doniana, Olea capensis, Thesium leucanthum, and evergreen trees such as Syzyguim guineense, Ficus spp., Keetia venosa and Berlinea spp. are abundant in this area. The area experiences between 30 and 1200 mm of rainfall in the wet season (May–October), with average daily temperatures ranging between 17 and 32 °C.
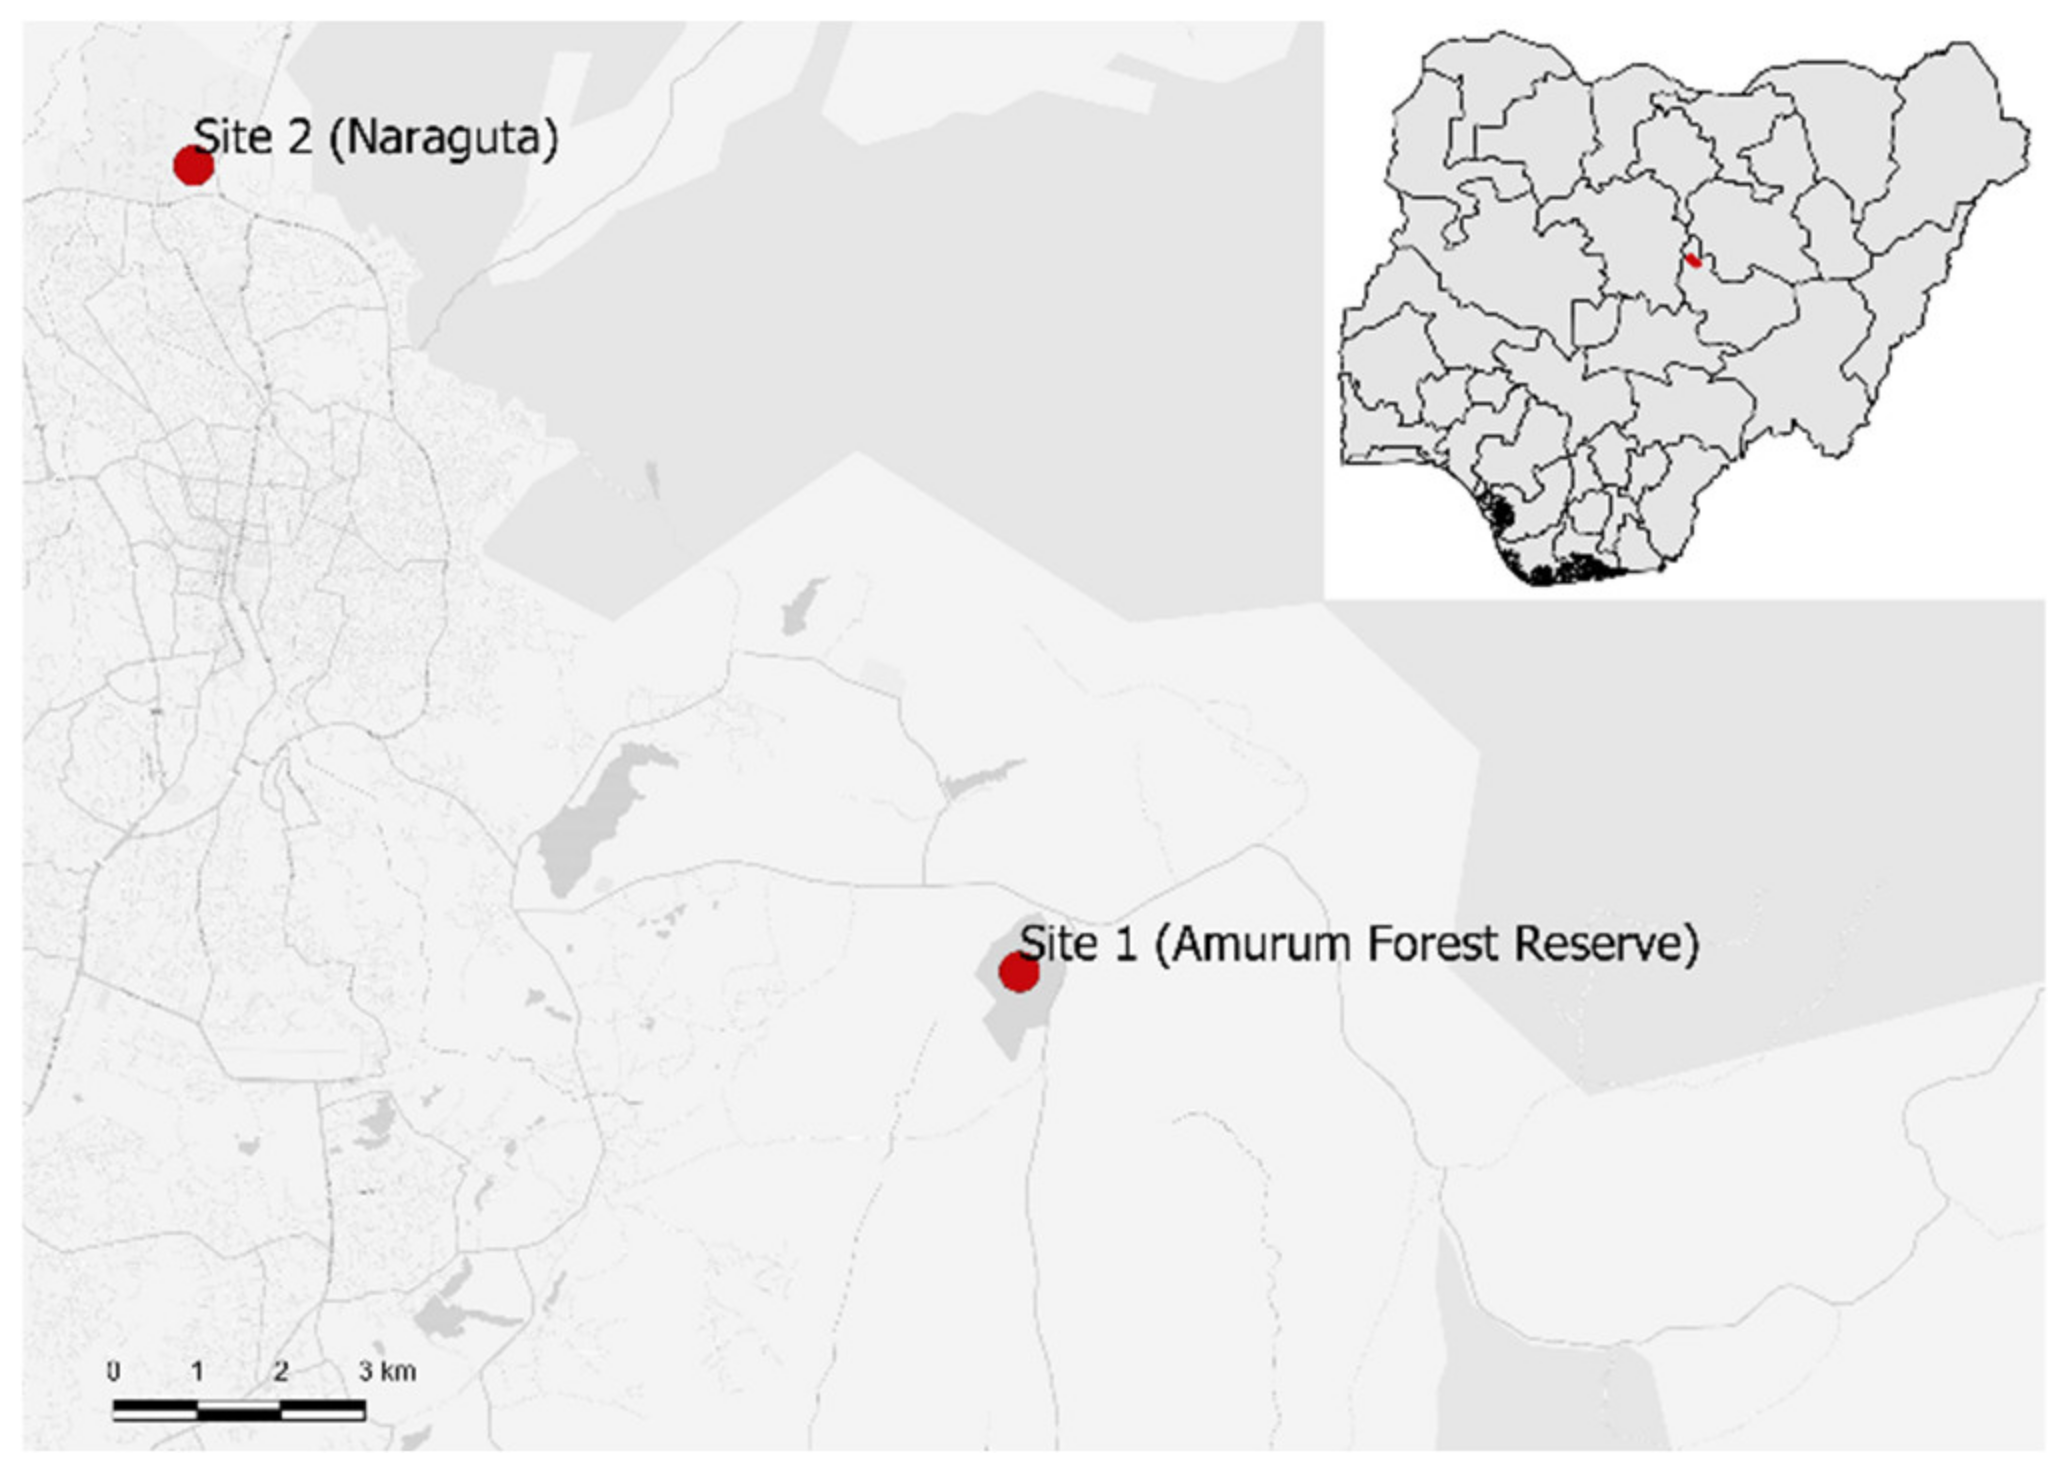
Feather sampling took place at two sites: the Amurum Forest Reserve (Site 1) and Naraguta (Site 2) (Figure 1). Amurum Forest Reserve (08°57′0′′ E, 09°51′0′′ N) is a 115 ha protected woodland interspersed by grassland and inselbergs. This area harbors over 300 different bird species, over 75 arthropod families, some mammals, reptiles and amphibians [18]. Amurum was previously a sacred community forest before being officially designated as a protected site. In the past seven years, however, there has been an increase in residential buildings and farmlands around the reserve. Naraguta (08°53′1′′ E, 09°58′1′′ N) is an unprotected site, characterized by short vegetation mainly made up of grass, shrubs and small bushes. This site has been influenced by many human activities, including grazing, mining and farming.
Birds were mistnetted at the two study sites between 23 February and 7 March 2016, between 06:00 h and 10:00 h. Birds were identified to species, aged, and various morphometric measurements taken, and three to four breast feathers were collected for isotopic analyses. Only resident species were used in this study. Birds were grouped into feeding guilds as nectarivores, frugivores, granivores, omnivores and insectivores (Supplementary Table S1).
Feathers were cleaned in a fumehood using an overnight soak in 2:1 chloroform:methanol solvent and then rinsed in clean solvent. Once thoroughly dried in the fumehood (24 h), we used the distal vane material for isotopic assays. For carbon and nitrogen isotope analyses, we weighed 1 mg of feathers into pre-combusted tin capsules. Encapsulated feathers were combusted at 1030 °C in a Carlo Erba NA1500 or Eurovector 3000 elemental analyzer. The resulting N2 and CO2 were separated chromatographically and introduced to an Elementar Isoprime or a Nu Instruments Horizon isotope ratio mass spectrometer (both in our laboratory). We used two reference materials to normalize the results to VPDB and AIR: BWBIII keratin (δ13C = −20.18, δ15N = +14.31‰, respectively) and PRCgel (δ13C = −13.64, δ15N = +5.07‰, respectively). Within-run (n = 5) precisions as determined from both reference and sample duplicate analyses were ±0.1‰ for both δ13C and δ15N.
For δ2H analyses, we weighed out 0.35 mg (±0.02 mg) of feathers into silver capsules. We used a Uni-Prep (Eurovector, Milan, Italy) temperature- and vacuum-controlled carousel set at 60 °C interfaced with a Eurovector 3000 elemental analyzer. Samples were combusted at 1350 °C on a glassy carbon reactor. Resultant H2 gas was analyzed on a Thermo Delta V Plus mass spectrometer in continuous flow mode. We calibrated unknown samples to the VSMOW-SLAP scale using two keratin reference materials (5 of each per analytical run; CBS: −197‰ and KHS: −54.1‰) following the comparative equilibration technique of Wassenaar and Hobson [19]. We estimated our measurement error to be ±2‰.
In order to investigate the variance in stable isotope values among guilds, we fitted linear mixed-effects models for each of the isotopes using individual as a random factor and then performed post-hoc Tukey tests using R’s build in TukeyHSD function from the stats package. We included all isotopes in the models because δ15N was expected to show a strong trophic effect and δ13C was expected to yield more clarification of any effects of diet or habitat, in addition to possible minor trophic effects. All numeric variables were rescaled for better comparison using the base function scale in R by centering values on the mean for each group of interest divided by the standard deviation. When the random effect of individual was found to be not relevant (i.e., variance of the estimate equal or close to 0), we fitted a maximal linear model including all explanatory variables (guild, site and their interaction, together with feather stable isotope values and their interaction (e.g., for δ2H, we included δ13C, δ15N and the interaction between δ13C and δ15N)). Subsequently, we ensured that the scaled residuals of this model were within acceptable limits using the simulateResiduals function from the DHARMa package in R [20]. To select the best model, we used the dredge function in R from the MuMIn package [21], which allowed us to compute all possible models and select the four best models based on their corrected Akaike’s Information Criterion (AICc). Lastly, we calculated the R2 value, and the relative amount of variance explained by each of the explanatory variables in the final model. If site of capture was kept in the final model, we redid the exercise described above with model selection on the data for each site separately to verify that our outcomes were consistent, regardless of capturing site.
We were interested in establishing isotopic niches to assist in understanding the relationships among the three stable isotope measurements. This was to examine possible trophic effects based on H and N but also to investigate evidence for microhabitat or diet effects using C. To visualize the isotopic niches of all the guilds, we created isotope biplots for all combinations: (δ2H vs. δ13C, δ2H vs. δ15N and δ13C vs. δ15N). As a measure of foraging niches for the different guilds, we calculated and plotted posterior ellipses using the functions siberMVN and plotSiberObjects from the SIBER package [22]. To calculate the posterior ellipses, we used 2 × 10⁶ iterations, a 1 × 10³ burning, thinned by 10 and over 3 chains. We used uninformed priors, as we had no prior knowledge of our expected results. We determined the size of the niche width of each guild for all three isotope combinations using Bayesian Standard Ellipse Areas (SEA), using the function siberEllipses. Subsequently, we calculated the relative percentage of niche overlap for the 40% ellipses (i.e., core niche areas) using bayesianOverlap for all guilds and each combination of isotopes.
3. Results
3.1. Model Selection
For the model evaluating variance in feather δ2H, the random effect of individual was not found to be relevant (variance ~ 0), so a linear model was fitted. Following model selection on our maximal linear model, guild, site and δ13C were included in all top models and these variables were significant in all but one model (p < 0.05, Table 1). Overall, about 35% of the variance found in the data was explained by our explanatory variables (Table 1). Of this, 45% was explained by guild, 52% by residuals and the rest by site, δ13C and δ15N following the relative sum of squares in the best model. The best model for Site 1 retained δ13C and guild (the next best model also included δ15N, delta AICc 1.1), whereas Site 2 retained δ15N and guild (the next best model also included δ13C, delta AICc 0.9).
We found clear differences in δ2H among guilds, with insectivores being most enriched while granivores were most depleted (Table 2). Omnivores were also more enriched in 2H compared to granivores, but there was no statistical difference between omnivores and insectivores (Table 2). For the model evaluating variance in feather δ13C, the random effect of individual was not found to be relevant (variance ~ 0), so a linear model was fitted. Following model selection on our maximal linear model, values of δ2H and δ15N and their interaction were included in all top models (Table 1). Overall, these models explained about 48% of the variance found in the data (Table 1). There was also a near significant effect of guild and site included in some of the top models (p > 0.05, Table 1). The variance was mostly explained by guild (79%) followed by residuals (20%).
Frugivores were most enriched in 15N together with nectarivores, significantly more so than all other guilds, with granivores showing the highest δ13C values (p < 0.001, Table 2). For the model evaluating variance in feather δ15N, the random effect of individual was not found to be relevant (variance ~ 0), so a linear model was fitted. Site and δ13C were included in all top models (Table 1). Overall, these models explained about 40% of the variance found in the data (Table 1). Variance was mostly explained by residuals (59%), but also to a lesser degree by δ13C (16%) and δ2H (15%). The best model for Site 1 retained δ2H, whereas for site 2, δ2H and δ13C were retained. Nectarivores and frugivores were most enriched in 15N, with granivores being most depleted, significantly so compared to all other guilds (p < 0.001, Table 2 and Table 3).
3.2. Trophic Enrichment
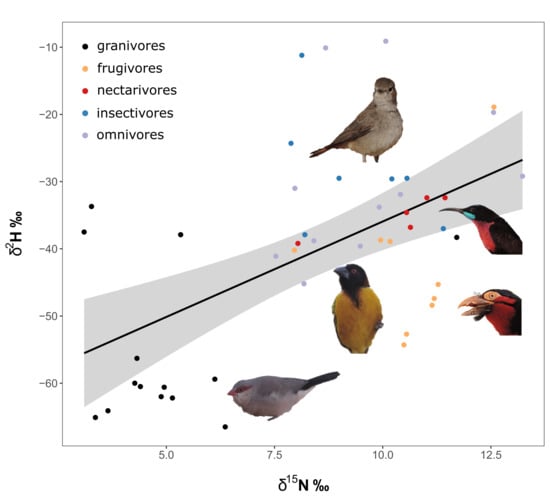
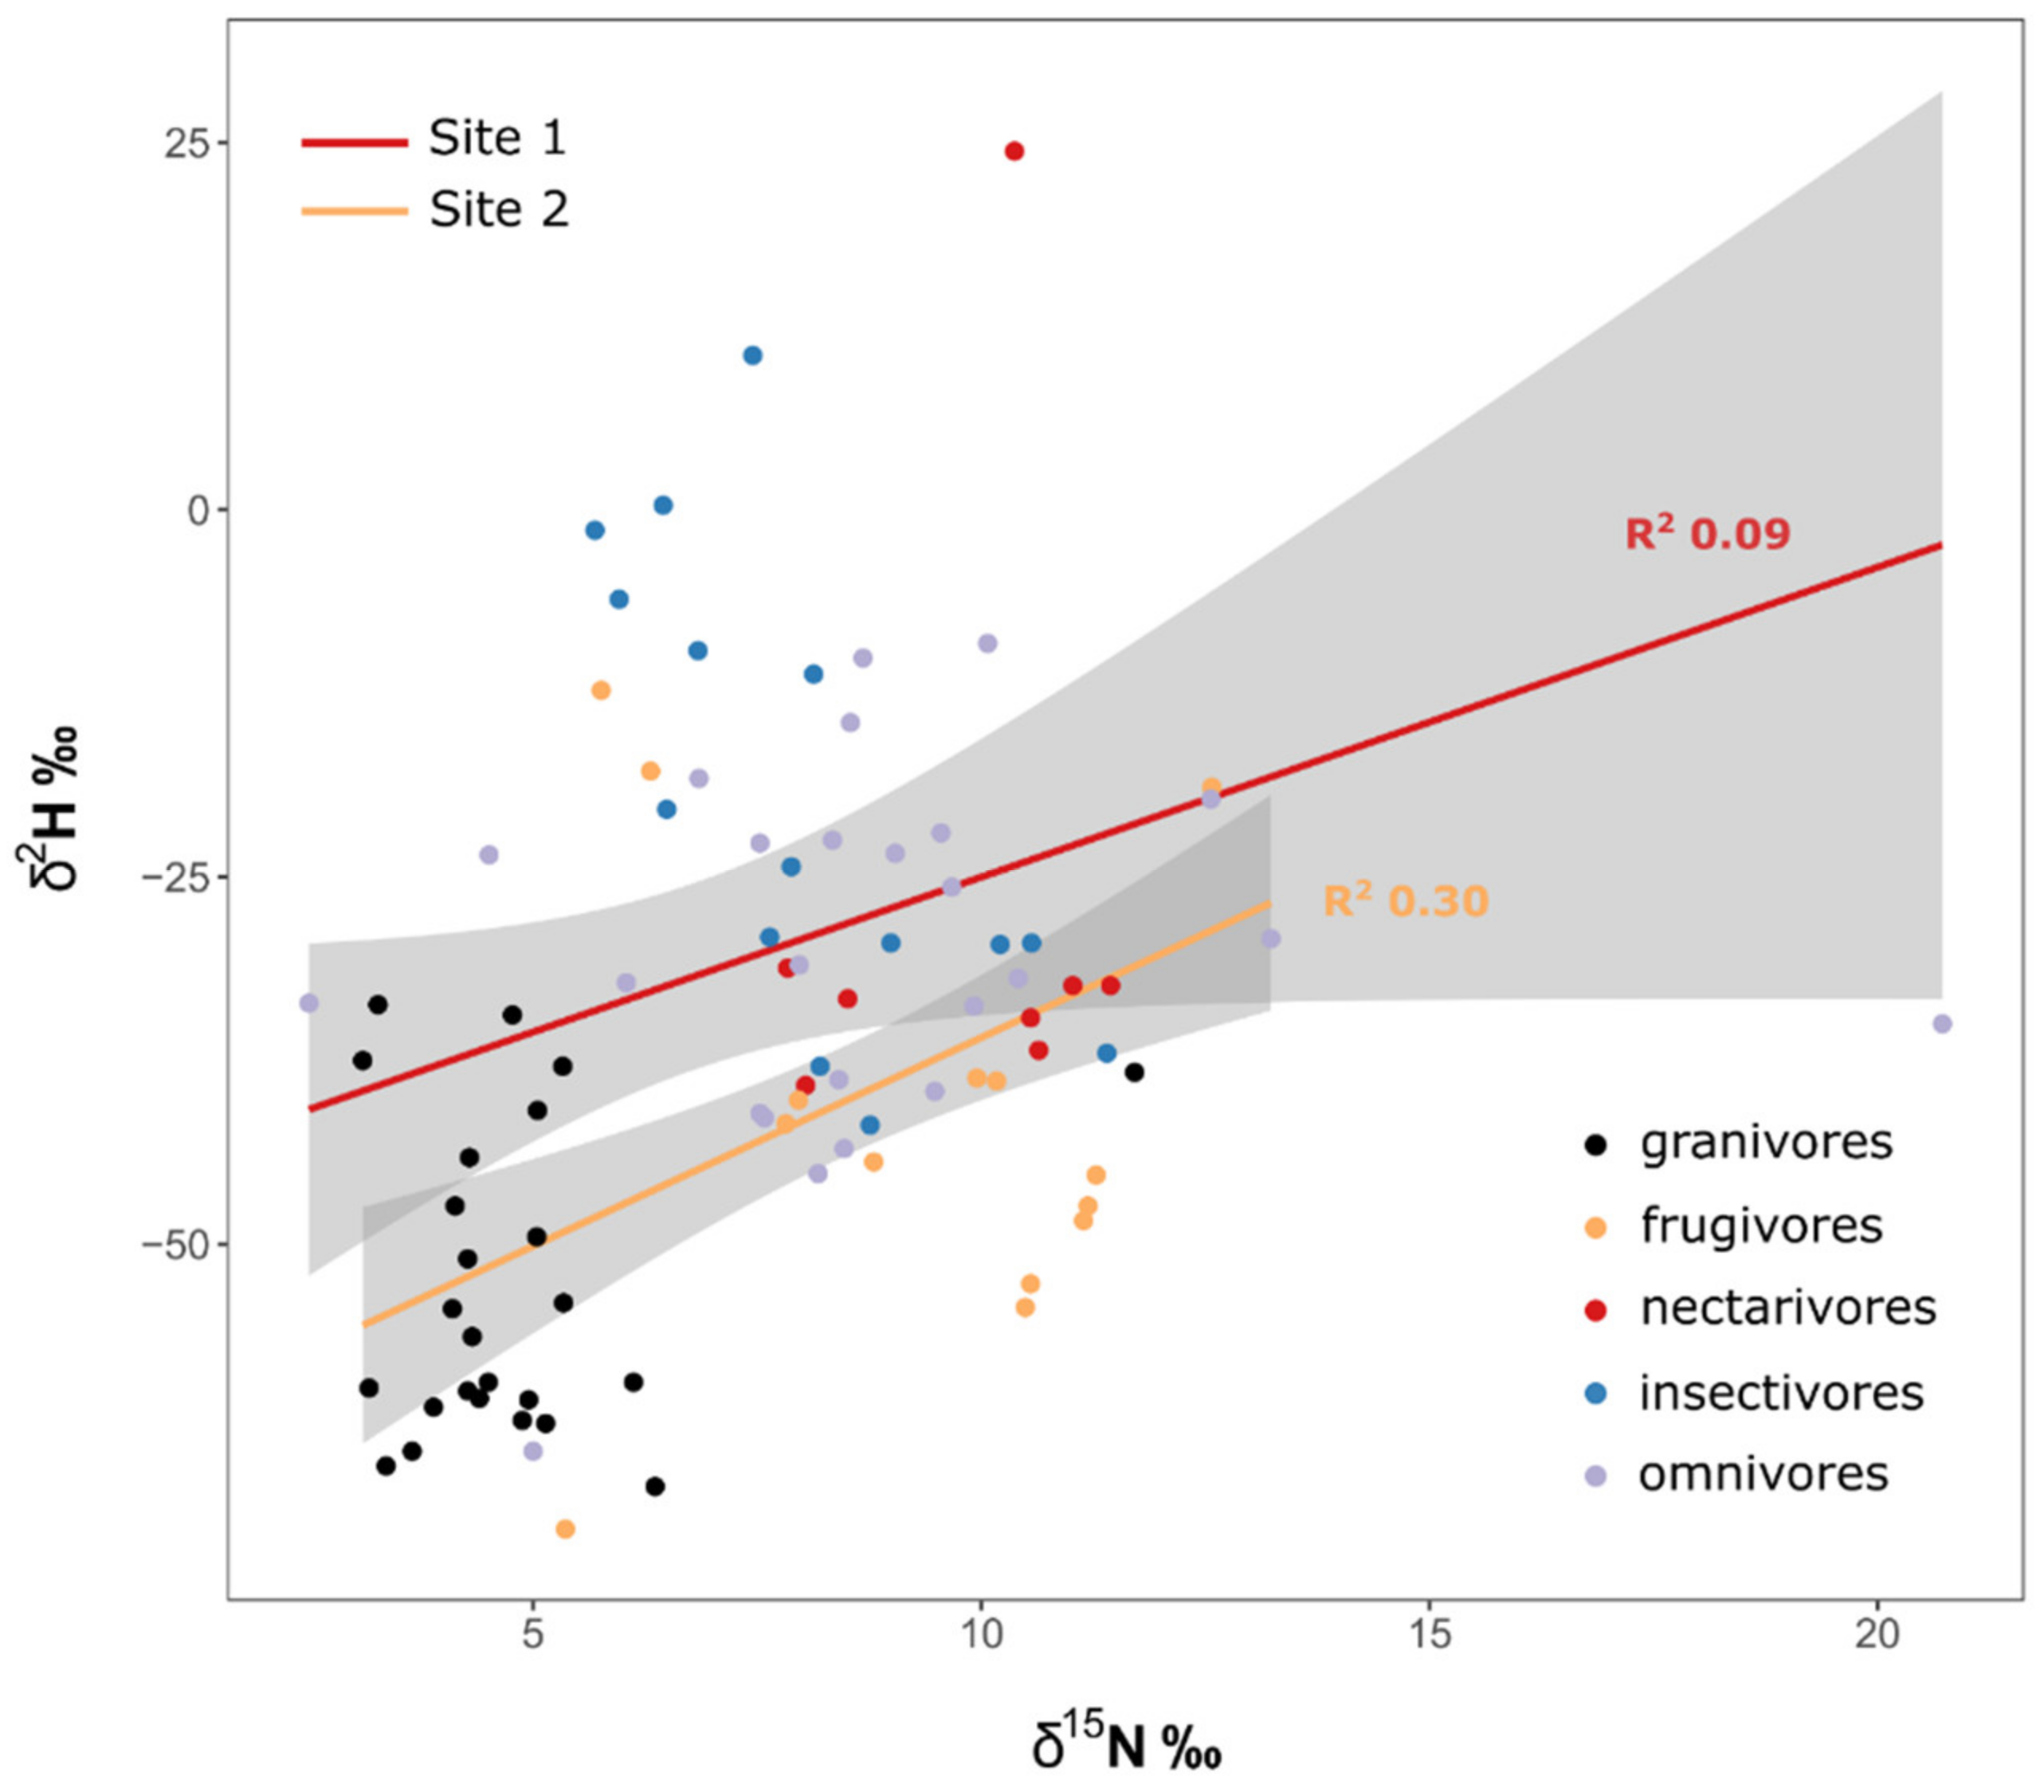
Since site was retained in most models, we analyzed the linear regression between δ15N and δ2H separately for Site 1 and Site 2. We found only a weak regression for Site 1 (R2 = 0.09), whereas Site 2 showed clearer signs of trophic enrichment (R2 = 0.30, Figure 2).
3.3. Isotopic Niches
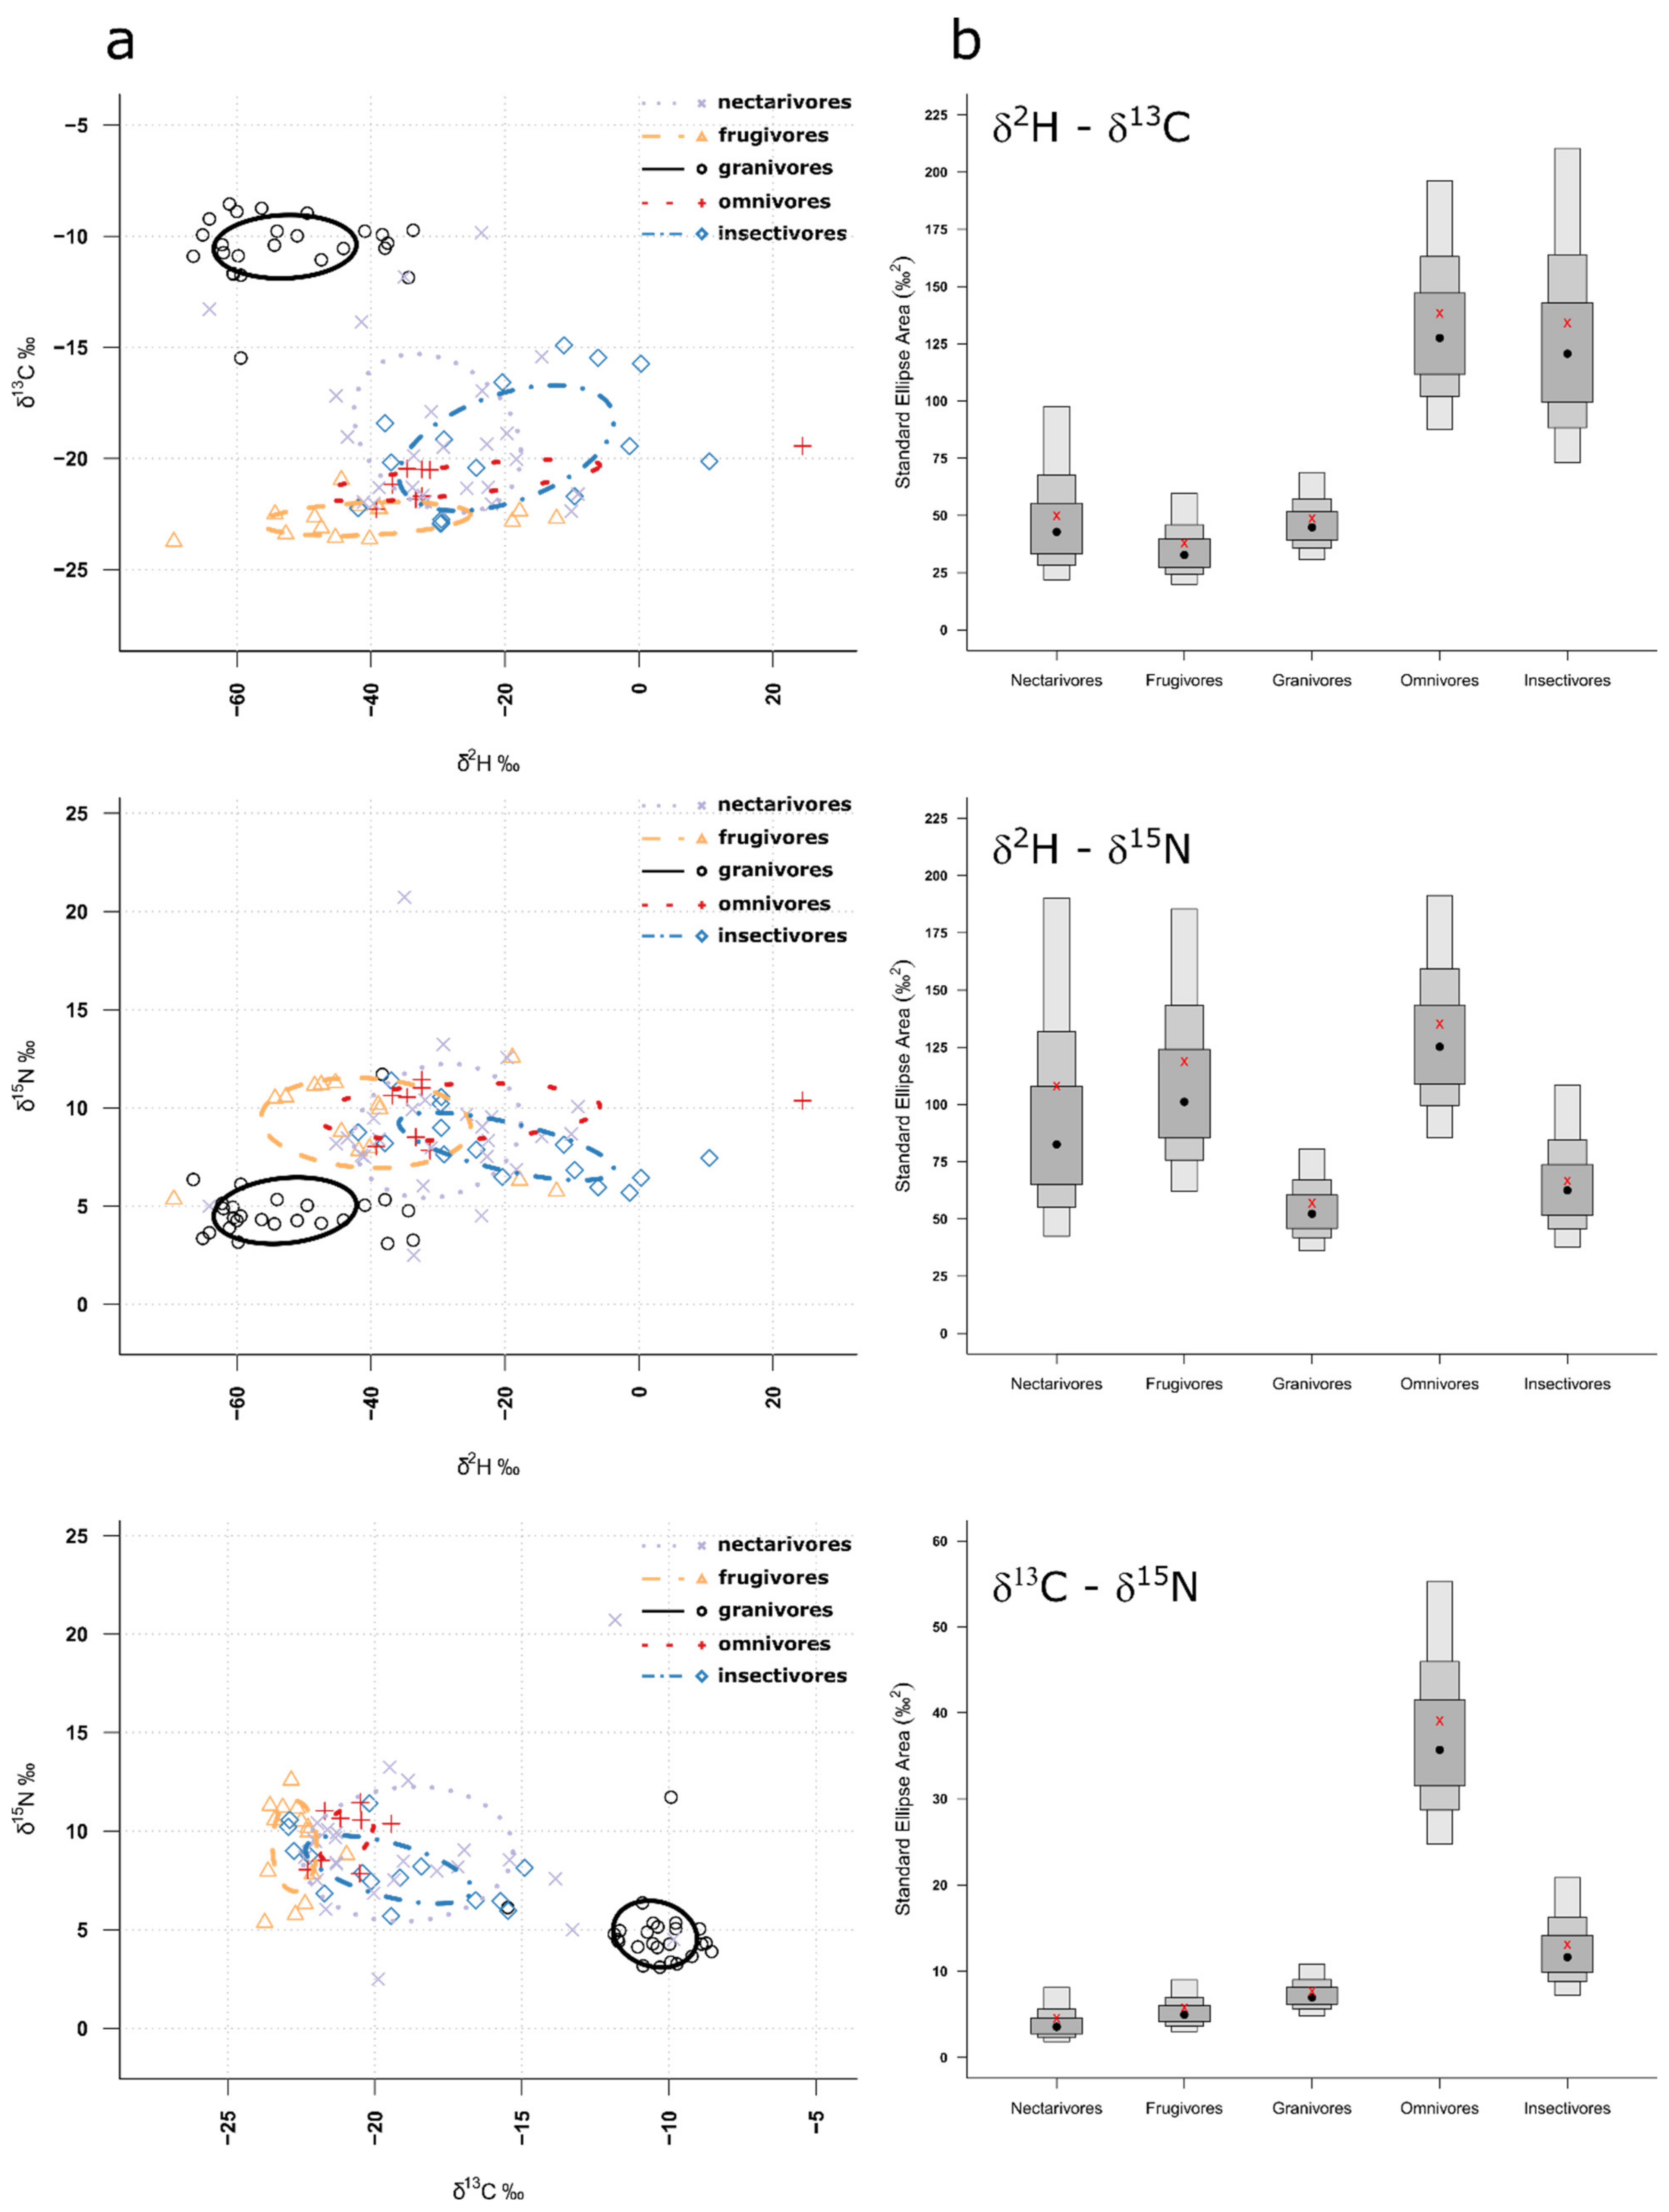
The Bayesian Estimate 40% Prediction Ellipse Area (i.e., core niche area) overlap analyses confirmed that granivores were clearly segregated from the other guilds for all isotopic niches (Figure 3a, Supplementary Table S2), and this finding was consistent across both sites (Supplementary Figures S1 and S2). Based on the size of the standard ellipse areas for the different isotopic niches and guilds, we can infer how specialized the different guilds are, with smaller SEAs representing more specialized guilds. For δ2H vs. δ13C, nectarivores, frugivores and granivores had the most specialized trophic niche, for δ2H vs. δ15N, granivores and insectivores were most specialized in their trophic niche and, finally, for δ13C vs. δ15N, again, nectarivores, frugivores and granivores had the smallest Bayesian Standard Ellipse Area (Figure 3b). Interestingly, in Site 1, granivores had the most specialized trophic niches across all isotopic niches, apart from δ13C vs. δ15N, where all but the omnivores seemed to be specialized (Supplementary Figure S1). In Site 2, these were nectarivores and frugivores, except for δ2H vs. δ15N, where nectarivores were most specialized (Supplementary Figure S2).
4. Discussion
By examining diverse resident avian communities at two sites in Nigeria, we were able to explore isotopic segregation among foraging guilds. The strength of our approach was that birds occupied a range of trophic levels and dietary specializations, representing local non-migratory populations. Our analyses revealed important information on ecological segregation among groups, but also provided a rare opportunity to examine evidence for a trophic effect in feather δ2H measurements. There are at least two ways in which the multiple isotope data can be examined in this context. One is direct examination of the standardized isotopic ellipse areas and overlap, and the other is to see if there is a positive relationship between feather δ2H and δ15N, indicating that δ2H mirrors the trophic relationships captured in δ15N. Except for granivores, there was considerable overlap among all guilds for all binary isotope plots. That suggests low support for a strong trophic effect for any isotope. Granivore δ13C values were clearly indicative of C4 sources. However, granivores also had among the lowest δ2H values, potentially suggesting the use of irrigated crops. For the canopied forest site (Site 1), we found an extremely weak relationship (R2 = 0.09) between feather δ2H and δ15N, but the relationship was stronger and significant (R2 = 0.30) for the bird community occupying the more open Site 2. That finding suggests the possibility of trophic enrichment occurring in δ2H at the open site, an effect that might be associated with a simpler food web at that site. However, our results underline the fact that feather isotope values were clearly influenced by factors other than trophic level and suggest that key information is required from any given community before one can conclude a trophic driver in tissue δ2H. Clearly, feather δ2H can be strongly influenced by local microclimate, water source and the ways in which different food web components are influenced by evapotranspiration [8]. We also note that feather δ2H values can be derived from both diet and drinking water and speculate that frugivore and nectarivore δ2H may be influenced by the high water content of their diets compared to granivores and insectivores. Differential effects of evapotranspiration in the food web could result in nectarivores and frugivores having higher feather δ2H than expected from trophic level per se. Similarly, even within a single site, prey δ15N values can vary depending on whether or not plant N is fixed (as in the case of legumes) or reliant on symbiosis [23]. Regardless, our study emphasizes that, for food web applications, interpretation of feather δ2H in avian communities, especially in the tropics, requires significant ground-truthing of individual species’ responses in concert with the use of a multi-isotope approach. Our study does not preclude the trophic effect in δ2H as postulated by Birchall et al. [9] but does reveal that each system will need to be examined individually in this respect, and a universal trophic enrichment factor for hydrogen isotopes in food webs is likely unrealistic [8].
As with all field studies, there are important caveats to our study. First, precise timing of body feather molt is unknown for most of the species we examined. It is possible, then, that the period of integration for each isotope differed among species. Any such differences in timing of molt might be a factor, especially in highly seasonal environments such as those studied here and could influence feather carbon and nitrogen isotopes in addition to those of hydrogen. Related to this point is the fact that it is often difficult to impossible to predict the precipitation hydrogen that is driving the food web or diets of interest. Again, it is possible that differential precipitation periods of hydrogen integration leading to subsequent differences in δ2H values of seeds, insects, fruits and so on, could contribute to misinterpretation of overlap in feather δ2H values among guilds and sites. Hydrogen in bird feathers can be derived from diet and drinking water, whereas nitrogen is exclusively mediated through dietary proteins. This can introduce an additional complicating factor in understanding the isotopic behavior of hydrogen in systems involving diverse metabolic pathways. Future studies should test the occurrence of a trophic effect in δ2H using a system already demonstrating a strong trophic effect based on δ15N. Experimental studies that also control water and dietary δ2H values across trophic levels are clearly needed to evaluate trophic effects with δ2H in terrestrial food webs.
Supplementary Materials
The following are available online at https://0-www-mdpi-com.brum.beds.ac.uk/article/10.3390/d13050202/s1, Table S1: Study species and corresponding information, Table S2: 40% SEA overlap analysis per site, Figure S1: Core niche areas for the different guilds in Site 1, Figure S2: Core niche areas for the different guilds in Site 2.
Author Contributions
Conceptualization, R.E.v.W. and K.A.H.; methodology, R.E.v.W. and K.A.H.; isotope analyses K.A.H.; software, R.E.v.W.; validation, R.E.v.W., Y.B. and K.A.H.; formal analysis, R.E.v.W.; investigation, R.E.v.W.; resources, K.A.H.; data curation, K.A.H.; writing—original draft preparation, R.E.v.W. and K.A.H.; writing—review and editing, R.E.v.W., Y.B. and K.A.H.; visualization, R.E.v.W.; supervision, K.A.H.; project administration, K.A.H.; funding acquisition, K.A.H. All authors have read and agreed to the published version of the manuscript.
Funding
This work was supported by an NSERC Discovery grant to K.A.H. (2017–04430).
Institutional Review Board Statement
Ethical guidelines regarding the capturing and handling of birds were followed in accordance with the guidelines set by the South African Ringing Scheme (SAFRING) which covered the ringing licenses needed for the study.
Informed Consent Statement
Not applicable.
Data Availability Statement
The data presented in this study will be made available as supplementary material.
Acknowledgments
We thank staff at the A. P. Leventis Ornithological Research Institute for help in the field capturing and sampling the individual birds, Jonathan Azi in particular. We acknowledge the role of the Migrant Landbird Study Group (MLSG) in facilitating the collaboration that resulted in this publication.
Conflicts of Interest
The authors declare no conflict of interest.
References
- Hobson, K.A.; Welch, H.E. Determination of trophic relationships within a high Arctic marine food web using δ13C and δ15N analysis. Mar. Ecol. Progr. Ser. 1992, 84, 9–18. [Google Scholar] [CrossRef]
- Caut, S.; Angulo, E.; Courchamp, F. Variation in discrimination factors (Δ15N and Δ13C): The effect of diet isotopic values and applications for diet reconstruction. J. Appl. Ecol. 2009, 46, 443–453. [Google Scholar] [CrossRef]
- Hobson, K.A.; Clark, R.G. Assessing avian diets using stable isotopes II: Factors influencing diet-tissue fractionation. Condor 1992, 94, 189–197. [Google Scholar] [CrossRef]
- McCutchan, J.H.; Lewis, W.M.; Kendall, C.; McGrath, C.C. Variation in trophic shift for stable isotope ratios of carbon, nitrogen, and sulfur. Oikos 2003, 102, 378–390. [Google Scholar] [CrossRef]
- Robbins, C.T.; Felicetti, L.; Sponheimer, M. The effect of dietary protein quality on nitrogen isotope discrimination in mammals and birds. Oecologia 2005, 144, 534–540. [Google Scholar] [CrossRef] [PubMed]
- Hobson, K.A.; Wassenaar, L.I. Tracking Animal Migration with Stable Isotopes, 2nd ed.; Academic Press: Cambridge, MA, USA, 2019. [Google Scholar]
- Meier-Augenstein, W.; Hobson, K.A.; Wassenaar, L.I. Critique: Measuring hydrogen stable isotope abundance of proteins to infer origins of wildlife, food and people. Bioanalysis 2013, 5, 751–767. [Google Scholar] [CrossRef] [PubMed]
- Vander Zanden, H.; Soto, D.; Bowen, G.; Hobson, K.A. Expanding the isotopic toolbox: Applications of hydrogen and oxygen stable isotope ratios to food web studies. Front. Ecol. Evol. 2016, 4, 20. [Google Scholar] [CrossRef] [Green Version]
- Birchall, J.; O’Connell, T.C.; Heaton, T.H.E.; Hedges, R.E.M. Hydrogen isotope ratios in animal body protein reflect trophic level. J. Anim. Ecol. 2005, 74, 877–881. [Google Scholar] [CrossRef]
- Soto, D.X.; Wassenaar, L.I.; Hobson, K.A.; Catalan, J. Effects of size and diet on stable hydrogen isotope values (δD) in fish: Implications for tracing origins of individuals and their food sources. Can. J. Fish. Aquat. Sci. 2011, 68, 2011–2019. [Google Scholar] [CrossRef]
- Topalov, K.; Schimmelmann, A.; David Polly, P.; Sauer, P.E.; Lowry, M. Environmental, trophic, and ecological factors influencing bone collagen δ2H. Geochim. Cosmochim. Acta 2013, 111, 88–104. [Google Scholar] [CrossRef]
- Soto, D.X.; Wassenaar, L.I.; Hobson, K.A. Stable hydrogen and oxygen isotopes in aquatic food webs are tracers of diet and provenance. Funct. Ecol. 2013, 27, 535–543. [Google Scholar] [CrossRef]
- Ehleringer, J.R.; Bowen, G.J.; Chesson, L.A.; West, A.G.; Podlesak, D.W.; Cerling, T.E. Hydrogen and oxygen isotope ratios in human hair are related to geography. Proc. Nat. Acad. Sci. USA 2008, 105, 2788–2793. [Google Scholar] [CrossRef] [PubMed] [Green Version]
- Hobson, K.A.; Wassenaar, L.I.; Taylor, O.R. Stable Isotopes (ΔD and δ13C) Are Geographic Indicators of Natal Origins of Monarch Butterflies in Eastern North America. Oecologia 1999, 120, 397–404. [Google Scholar] [CrossRef] [PubMed]
- Myers, D.J.; Whitledge, G.W.; Whiles, M.R. 2012 Evaluation of δD and δ18O as natural markers of invertebrate source environment and dispersal in the middle Mississippi River-floodplain ecosystem. River Res. Applic. 2012, 28, 135–142. [Google Scholar] [CrossRef] [Green Version]
- Solomon, C.T.; Cole, J.J.; Doucett, R.R.; Pace, M.L.; Preston, N.D.; Smith, L.E.; Weidel, B.C. The influence of environmental water on the hydrogen stable isotope ratio in aquatic consumers. Oecologia 2009, 161, 313–324. [Google Scholar] [CrossRef] [PubMed]
- Peters, J.M.; Wolf, N.; Stricker, C.A.; Collier, T.R.; Martínez del Rio, C. Effects of trophic level and metamorphosis on discrimination of hydrogen isotopes in a plant-herbivore system. PLoS ONE 2012, 7, e32744. [Google Scholar] [CrossRef] [PubMed] [Green Version]
- Ezealor, A.U. Nigeria. In Important Bird Areas in Africa and Associated Islands: Priority Sites for Conservation, 1st ed.; Fishpool, L.D.C., Evans, M.I., Eds.; Pisces Publications & BirdLife International: Newbury/Cambridge, UK, 2001; pp. 673–692. [Google Scholar]
- Wassenaar, L.I.; Hobson, K.A. Comparative equilibration and online technique for determination of non-exchangeable hydrogen of keratins for use in animal migration studies. Isot. Environ. Health Stud. 2003, 39, 211–217. [Google Scholar] [CrossRef] [PubMed]
- Hartig, F. DHARMa: Residual Diagnostics for Hierarchical (Multi-Level/Mixed) Regression Models. R Package Version 0.3.3.0. 2020. Available online: https://CRAN.R-project.org/package=DHARMa (accessed on 25 February 2021).
- Barton, K. MuMIn: Multi-Model Inference. R Package Version 1.43.17. 2020. Available online: https://CRAN.R-project.org/package=MuMIn (accessed on 25 February 2021).
- Jackson, A.L.; Parnell, A.C.; Inger, R.; Bearhop, S. Comparing isotopic niche widths among and within communities: SIBER—Stable Isotope Bayesian Ellipses in R. J. Anim. Ecol. 2011, 80, 595–602. [Google Scholar] [CrossRef] [PubMed]
- Pardo, L.H.; Nadelhoffer, K.J. Using nitrogen isotope ratios to assess terrestrial ecosystems at regional and global scales. In Isoscapes: Understanding Movement, Pattern, and Process on Earth through Isotope Mapping, 2nd ed.; West, J.B., Bowen, G.J., Dawson, T.E., Tu, K.P., Eds.; Springer: London, UK, 2010; pp. 221–249. [Google Scholar]
Figure 1.
Locations of the study sites within Nigeria (top right insert): Site 1 = Amurum Forest Reserve, Site 2 = Naraguta.
Figure 1.
Locations of the study sites within Nigeria (top right insert): Site 1 = Amurum Forest Reserve, Site 2 = Naraguta.

Figure 2.
Regression between δ2H vs. δ15N by site, with colors representing different guilds. Regression lines are indicated in shaded grey, with the 95% confidence band of the regression estimate and its corresponding R2 values.
Figure 2.
Regression between δ2H vs. δ15N by site, with colors representing different guilds. Regression lines are indicated in shaded grey, with the 95% confidence band of the regression estimate and its corresponding R2 values.

Figure 3.
(a) Independent calculated ellipses containing 40% of the isotopic data for the five different guilds for all combinations of isotopes. (b) Posterior distributions of isotopic niche size (Bayesian Standard Ellipse Areas) for the five different feeding guilds for all combinations of isotopes. Grey boxes represent 40% (dark shading), 75% (medium shading) and 95% (light shading) credible intervals, with red crosses designating the model values and black dots the median.


Table 1.
Model selection for the various isotopes showing the best four models following the dredge function and their respective R squared and corrected Akaike’s Information Criterion (AICc). Explanatory variables in bold were significant in the model, with asterisks representing the following p-values: * < 0.05, ** < 0.01, *** < 0.001.
| Model | R2 | Overall AICc |
|---|---|---|
| δ2H | ||
| trophic level ** + site ** + delta_13C * + delta_15N | 0.37 | 219.2 |
| trophic level ** + site ** + delta_13C *** | 0.34 | 220.6 |
| trophic level ** + site ** + delta_13C ** + delta_15N ** + delta_13C x delta_15N *** | 0.37 | 221.5 |
| trophic level + site + delta_13C ** + delta_15N + trophic level x site | 0.37 | 221.5 |
| δ13C | ||
| trophic level + delta_D * + delta_15N *** + delta_D x delta_15N ** | 0.45 | 203.1 |
| delta_D * + delta_15N ** + delta_D x delta_15N *** | 0.47 | 204.0 |
| trophic level + site + delta_D ** + delta_15N *** + delta_D x delta_15N *** | 0.48 | 204.6 |
| trophic level + site + delta_D * + delta_15N *** + delta_D x delta_15N *** + trophic level x site | 0.49 | 204.9 |
| δ15N | ||
| site ** + delta_D + delta_13C ** + delta_D x delta_13C | 0.41 | 212.4 |
| site ** + delta_D + delta_13C *** | 0.39 | 213.7 |
| trophic level + site ** + delta_D * + delta_13C ** + delta_D x delta_13C | 0.42 | 214.4 |
| site * + delta_13C *** | 0.37 | 214.8 |
Table 2.
Median and interquartile ranges for the various isotopes by guild. The second panel summarizes between-group differences based on Tukey post-hoc tests, highlighting between-group differences in bold (see text).
Table 2.
Median and interquartile ranges for the various isotopes by guild. The second panel summarizes between-group differences based on Tukey post-hoc tests, highlighting between-group differences in bold (see text).
| Guild | N | δ2H (‰) | δ13C (‰) | δ15N (‰) |
|---|---|---|---|---|
| Nectarivores | 8 | −32.85 (−35.2–−32.1) | −20.84 (−21.7–−20.5) | 10.46 (8.4–10.7) |
| Frugivores | 14 | −43.10 (−48.2–−38.8) | −22.67 (−23.3–−22.3) | 10.06 (7.9–11.0) |
| Granivores | 25 | −56.30 (−60.6–−44.1) | −10.38 (−10.9–−9.8) | 4.40 (4.1–5.1) |
| Omnivores | 25 | −31.00 (−38.8–−22.5) | −19.88 (−21.6–−17.2) | 8.47 (7.5–9.7) |
| Insectivores | 15 | −24.30 (−29.6–−7.9) | −20.13 (−22.0–−17.5) | 7.88 (6.7–8.9) |
Table 3.
Between-guild differences in isotopes based on Tukey post-hoc tests, highlighting between-guild differences in bold (see text).
Table 3.
Between-guild differences in isotopes based on Tukey post-hoc tests, highlighting between-guild differences in bold (see text).
| Guild | δ2H (‰) | δ13C (‰) | δ15N (‰) |
|---|---|---|---|
| Nectarivores–Frugivores | n.s. | n.s. | n.s. |
| Nectarivores–Granivores | p < 0.001 | p < 0.001 | p < 0.001 |
| Nectarivores–Omnivores | n.s. | n.s. | n.s. |
| Nectarivores–Insectivores | n.s. | n.s. | n.s. |
| Frugivores–Granivores | n.s. | p < 0.001 | p < 0.001 |
| Frugivores–Omnivores | n.s. | p < 0.001 | n.s. |
| Frugivores–Insectivores | p < 0.01 | p < 0.01 | n.s. |
| Granivores–Omnivores | p < 0.001 | p < 0.001 | p < 0.001 |
| Granivores–Insectivores | p < 0.001 | p < 0.001 | p < 0.001 |
| Omnivores–Insectivores | n.s. | n.s. | n.s. |
Publisher’s Note: MDPI stays neutral with regard to jurisdictional claims in published maps and institutional affiliations. |
© 2021 by the authors. Licensee MDPI, Basel, Switzerland. This article is an open access article distributed under the terms and conditions of the Creative Commons Attribution (CC BY) license (https://creativecommons.org/licenses/by/4.0/).
Share and Cite
MDPI and ACS Style
van Wijk, R.E.; Barshep, Y.; Hobson, K.A. On the Use of Stable Hydrogen Isotope Measurements (δ2H) to Discern Trophic Level in Avian Terrestrial Food Webs. Diversity 2021, 13, 202. https://0-doi-org.brum.beds.ac.uk/10.3390/d13050202
AMA Style
van Wijk RE, Barshep Y, Hobson KA. On the Use of Stable Hydrogen Isotope Measurements (δ2H) to Discern Trophic Level in Avian Terrestrial Food Webs. Diversity. 2021; 13(5):202. https://0-doi-org.brum.beds.ac.uk/10.3390/d13050202
Chicago/Turabian Stylevan Wijk, Rien E., Yahkat Barshep, and Keith A. Hobson. 2021. "On the Use of Stable Hydrogen Isotope Measurements (δ2H) to Discern Trophic Level in Avian Terrestrial Food Webs" Diversity 13, no. 5: 202. https://0-doi-org.brum.beds.ac.uk/10.3390/d13050202
Note that from the first issue of 2016, this journal uses article numbers instead of page numbers. See further details here.