
Potential Distribution of Colonizing Nine-Banded Armadillos at Their Northern Range Edge

1
Cooperative Wildlife Research Laboratory, Southern Illinois University, Carbondale, IL 62901, USA
2
School of Biological Sciences, Southern Illinois University, Carbondale, IL 62901, USA
*
Author to whom correspondence should be addressed.
Diversity 2021, 13(6), 266; https://0-doi-org.brum.beds.ac.uk/10.3390/d13060266
Submission received: 27 May 2021
/
Revised: 9 June 2021
/
Accepted: 9 June 2021
/
Published: 13 June 2021
Abstract
:The nine-banded armadillo (Dasypus novemcinctus) has become a recent addition to the local fauna of Illinois as a response to habitat alteration and climate change. This range expansion has resulted in the presence of armadillos in areas not predicted by earlier models. Although these models have been revised, armadillos continue to move north and have reached areas of heavy agricultural use. We identified conditions that favor the presence of armadillos and potential corridors for dispersal. Identifying the distribution of the armadillo in Illinois is a vital step in anticipating their arrival in areas containing potentially sensitive wildlife populations and habitats. Armadillo locations (n = 37) collected during 2016–2020 were used to develop a map of the potential distribution of armadillos in southern Illinois. Environmental data layers included in the model were land cover type, distance to water, distance to forest edge, human modification, and climactic variables. Land cover type was the most important contributing variable to the model. Our results are consistent with the tenet that armadillo activity and dispersal corridors are centered around riparian areas, and that forested cover may provide corridors an agricultural mosaic.
1. Introduction
The nine-banded armadillo (Dasypus novemcinctus) has colonized much of the southern United States in less than 200 years [1]. The current distribution of armadillos now includes 15 states, and is expected to expand farther northeast [2,3]. This range expansion has led to management concern about which factors facilitated their colonization, and what will ultimately limit establishment. Although temperature and precipitation are thought to limit northern expansion to the 40th parallel north [3], armadillos have successfully adapted to a broader range of environmental conditions [4] and surpassed thresholds from previous models thought to be too cold to support the establishment of a new population, with records as far north as Nebraska and Indiana [3,5]. In Illinois, sightings have increased dramatically since the early 2000s, and breeding populations have become established in the state [3,6,7]. It is now believed that permanent sustaining populations of armadillos are limited to areas that receive yearly precipitation greater than 50 cm and have mean January temperatures above −8 °C [3]. Yet, to this date, there is no characterization of the realized habitats and dispersal corridors used by armadillos based on either empirical data or modelling using known attributes of both climate and terrain.
Armadillos have dispersed through vast areas of heavy agricultural use in Arkansas, Georgia, Oklahoma, and Texas [3,8]. Illinois is crossed by the 40th parallel, which is presumed to act as the northernmost limit for the dispersal. The southern half of Illinois is surrounded by the Mississippi and the Ohio Rivers and sustains a robust population of armadillos. This region of the state is covered with fragmented forest that connects the major river valleys with the corn belt. This heavy fragmentation of forested cover with agricultural land presents a unique opportunity to identify corridors that armadillos are using in their northward dispersion.
Armadillos may positively influence ecosystems by creating new habitats via burrows, increasing soil nutrients through the bioturbation of soil, and regulating insect pests [9]. However, wildlife managers are often concerned about armadillo colonization due to the introduction of pathogens (e.g., Trypanosoma cruzi, [10,11]; and Mycobacterium leprae, [12], adverse effects on native wildlife, and potential damage to crops and property [1,13,14,15]. For example, northern bobwhite (Colinus virginianus) are a species of concern, and have suffered considerable declines since the 1970s, presumably due to habitat fragmentation and genetic isolation of subpopulations [16,17,18]. Predation is a common cause of bobwhite nest failure, and armadillos have been identified as an important mammalian predator to bobwhites [19]. Staller et al. (2005) found mammals were responsible for 59% of bobwhite nest predations, with armadillos being second only to raccoons (Procyon lotor) in predation rates, and typically all eggs in the nest were consumed.
Wildlife managers are also interested in habitat use by colonizing armadillos, given the potential for overlap between armadillos and species of concern, such as northern bobwhites. Armadillos are thought to be closely affiliated with riparian habitat and hardwood hammocks [1,20,21], appear to avoid upland pine habitat, or show little habitat selection whatsoever [22]. Inbar and Mayer [23] found armadillo roadkills near dense woodlands in winter months, but in summer, roadkill locations were dependent more on traffic levels rather than land cover type. Armadillos also require deciduous forests associated with leaf litter and prey availability, especially in winter months [24,25].
Biologists, health officials, and wildlife managers can use knowledge of habitat preferences and other environmental factors to forecast areas of potential armadillo colonization using species distribution models (SDM) [26,27,28]. Species distribution modeling has been a useful research tool for a wide array of ecological issues, including management of invasive species [29], assessment of habitat connectivity for species of concern [28,30], prediction of parasite presence [11], and assessment of species richness [31]. Studies of the potential distribution of armadillos in Illinois can provide a unique insight into baseline habitat preferences of armadillos as they expand their range north, as habitat preference may change based on population characteristics such as density. Several species have generalized their habitat preferences as population densities increased [32,33,34]. The same phenomenon may be true for armadillos at their northern range edge, with populations altering habitat selection as preferred areas become overcrowded and unavailable. Modeling the potential distribution of armadillos is also important in anticipating disease spread and effects on other native wildlife.
We modeled the influence of several environmental variables on potential distribution of armadillos in southern Illinois. SDM have been previously used to predict armadillo colonization in the United States through the use of climatic variables and presence data [2]. However, environmental factors influence species distributions in a hierarchical manner, with certain factors holding greater importance depending on the spatial scale [35]. While climatic factors are relevant to species distribution at broad scales, land cover variables are likely to influence distribution at a finer scale [36,37,38]. We expected annual precipitation to be an important factor influencing potential distribution, as precipitation must be sufficient enough to provide varied prey items and porous soil [25]. Annual precipitation had high importance in previous models [2,3,25], but we did not expect it to be as strong of a contributor compared to large-scale models due to little variation of climate at a smaller scale [36,37]. We expected distance to forest cover and distance to water to be the most important factors influencing the potential distribution of armadillos. We anticipated distance to water to be of high importance because armadillos need access to fresh water and soft soils for foraging [1]. We also expected forest cover to be a strong influence because past findings have shown patches of forested cover, especially those close to watercourses, are important habitat for armadillos in agricultural matrices [39]. We predicted armadillo presence to be positively associated with forest, wetland, and open water cover types [1,20,39]. We predicted armadillos would occur in low to moderately developed areas and agricultural cover types due to the armadillo’s seemingly high tolerance to human disturbance [40], but would be negatively associated with highly developed or modified areas and agricultural fields with little adjacent forest cover [39]. We anticipated armadillo presence would increase with increased temperature of the wettest quarter and precipitation of the wettest quarter, as both temperature and precipitation limit colonization [2,3], but did not expect these climate variables to contribute to the model as much as annual precipitation, as annual precipitation has already been found to be of high importance in previous SDMs [2,3,25].
2. Materials and Methods
2.1. Study Area
We modeled potential armadillo distribution for the 51 Illinois counties below 40° N (63,994 km2). The climate of southern Illinois is temperate, with cold winters, wet springs, and hot, humid summers [41]. Elevation ranges from 88–324 m [42]. Mean annual temperature ranges from 14.7 °C in Pope County to as low as 11.1 °C in Moultrie County, and mean annual precipitation varies from 128 cm in Union County to 95 cm in Sangamon County [43]. Land cover is comprised of row-crop agriculture and pasture (65%), deciduous forest (21%), development (8%), wetland (3%), and open water (2%) [44]. Mean human density of the area is 25.4 persons per km2, with the highest density being 158.5 persons per km2 in St. Clair County, and the lowest 4.8 persons per km2 in Pope County [45].
2.2. Armadillo Presence
Armadillo presence locations (n = 361) were collected during 2016–2020. Reports of armadillos were solicited by creating a social media page and contacting local naturalist groups and county animal control offices. Records were confirmed as nine-banded armadillos either by photographs of reports, camera trap data, or driving to reports of roadkill. Localities were rarefied by 10 km to avoid spatial bias, resulting in 37 locations used for modeling. Out of 37 presences, 20 were roadkills and 17 were observations of a live animal. Two locations were collected in spring, 18 in summer, 13 in fall, and 4 in winter. Roadkills were salvaged and georeferenced; a fraction of them were deposited in the Illinois Natural History Survey Division of Mammalogy. Reports of live armadillos were georeferenced via Google Earth when coordinates were not provided.
2.3. Environmental Variables
We compiled 8 environmental data layers representing climate (n = 4 data layers), land cover (n = 1), global human modification (n = 1), and habitat-distance variables (n = 2) known to be important to armadillos [1,2,3,22]. Environmental data layers were raster-based and resampled to a 30 x 30 m cell size and geospatial analyses were performed using ArcGIS 10.7.1.
Climatic variables were downloaded from WorldClim (http://www.worldclim.org/, Table 1, accessed 8 April 2020). Land cover data were obtained from the National Land Cover Dataset [46] and were categorized into open water, development, forest (deciduous, evergreen, and mixed), herbaceous, pasture, crop, wetland (woody and emergent), and barren cover types [46]. Development was categorized into four levels of intensity based on percentage of impervious surface (open space [<20% impervious surface], low intensity development [20–49%], medium intensity development [50–79%], and high intensity development [80–100%]). Barren land was any area in which vegetation accounted for <15% of total cover, including glacial debris, sand dunes, strip mines, gravel pits, and other accumulations of earthen material [28,46]. The global human modification layer depicted the proportion of landscape modified by humans [47]. Thirteen anthropogenic stressors to biological diversity were grouped into five major classes, including human settlement, agriculture, transportation, mining and energy production, and infrastructure. A raster from the USGS GAP Analysis Project was used that included both interior and exterior buffers from forest edge [48]. Buffer distances both into and away from forest edge included 0, 30, 60, 120, 250, 500, 1000, 2000, 4000, and >4000 m. Water features were downloaded from the Natural Resources Conservation Service Geospatial Gateway [49]. Euclidean distance was used to form distance contours from water features. Variables were tested for correlation; highly correlated variables (Pearson’s R > 0.7) were removed [28,29] and included fifteen climatic variables from WorldClim.
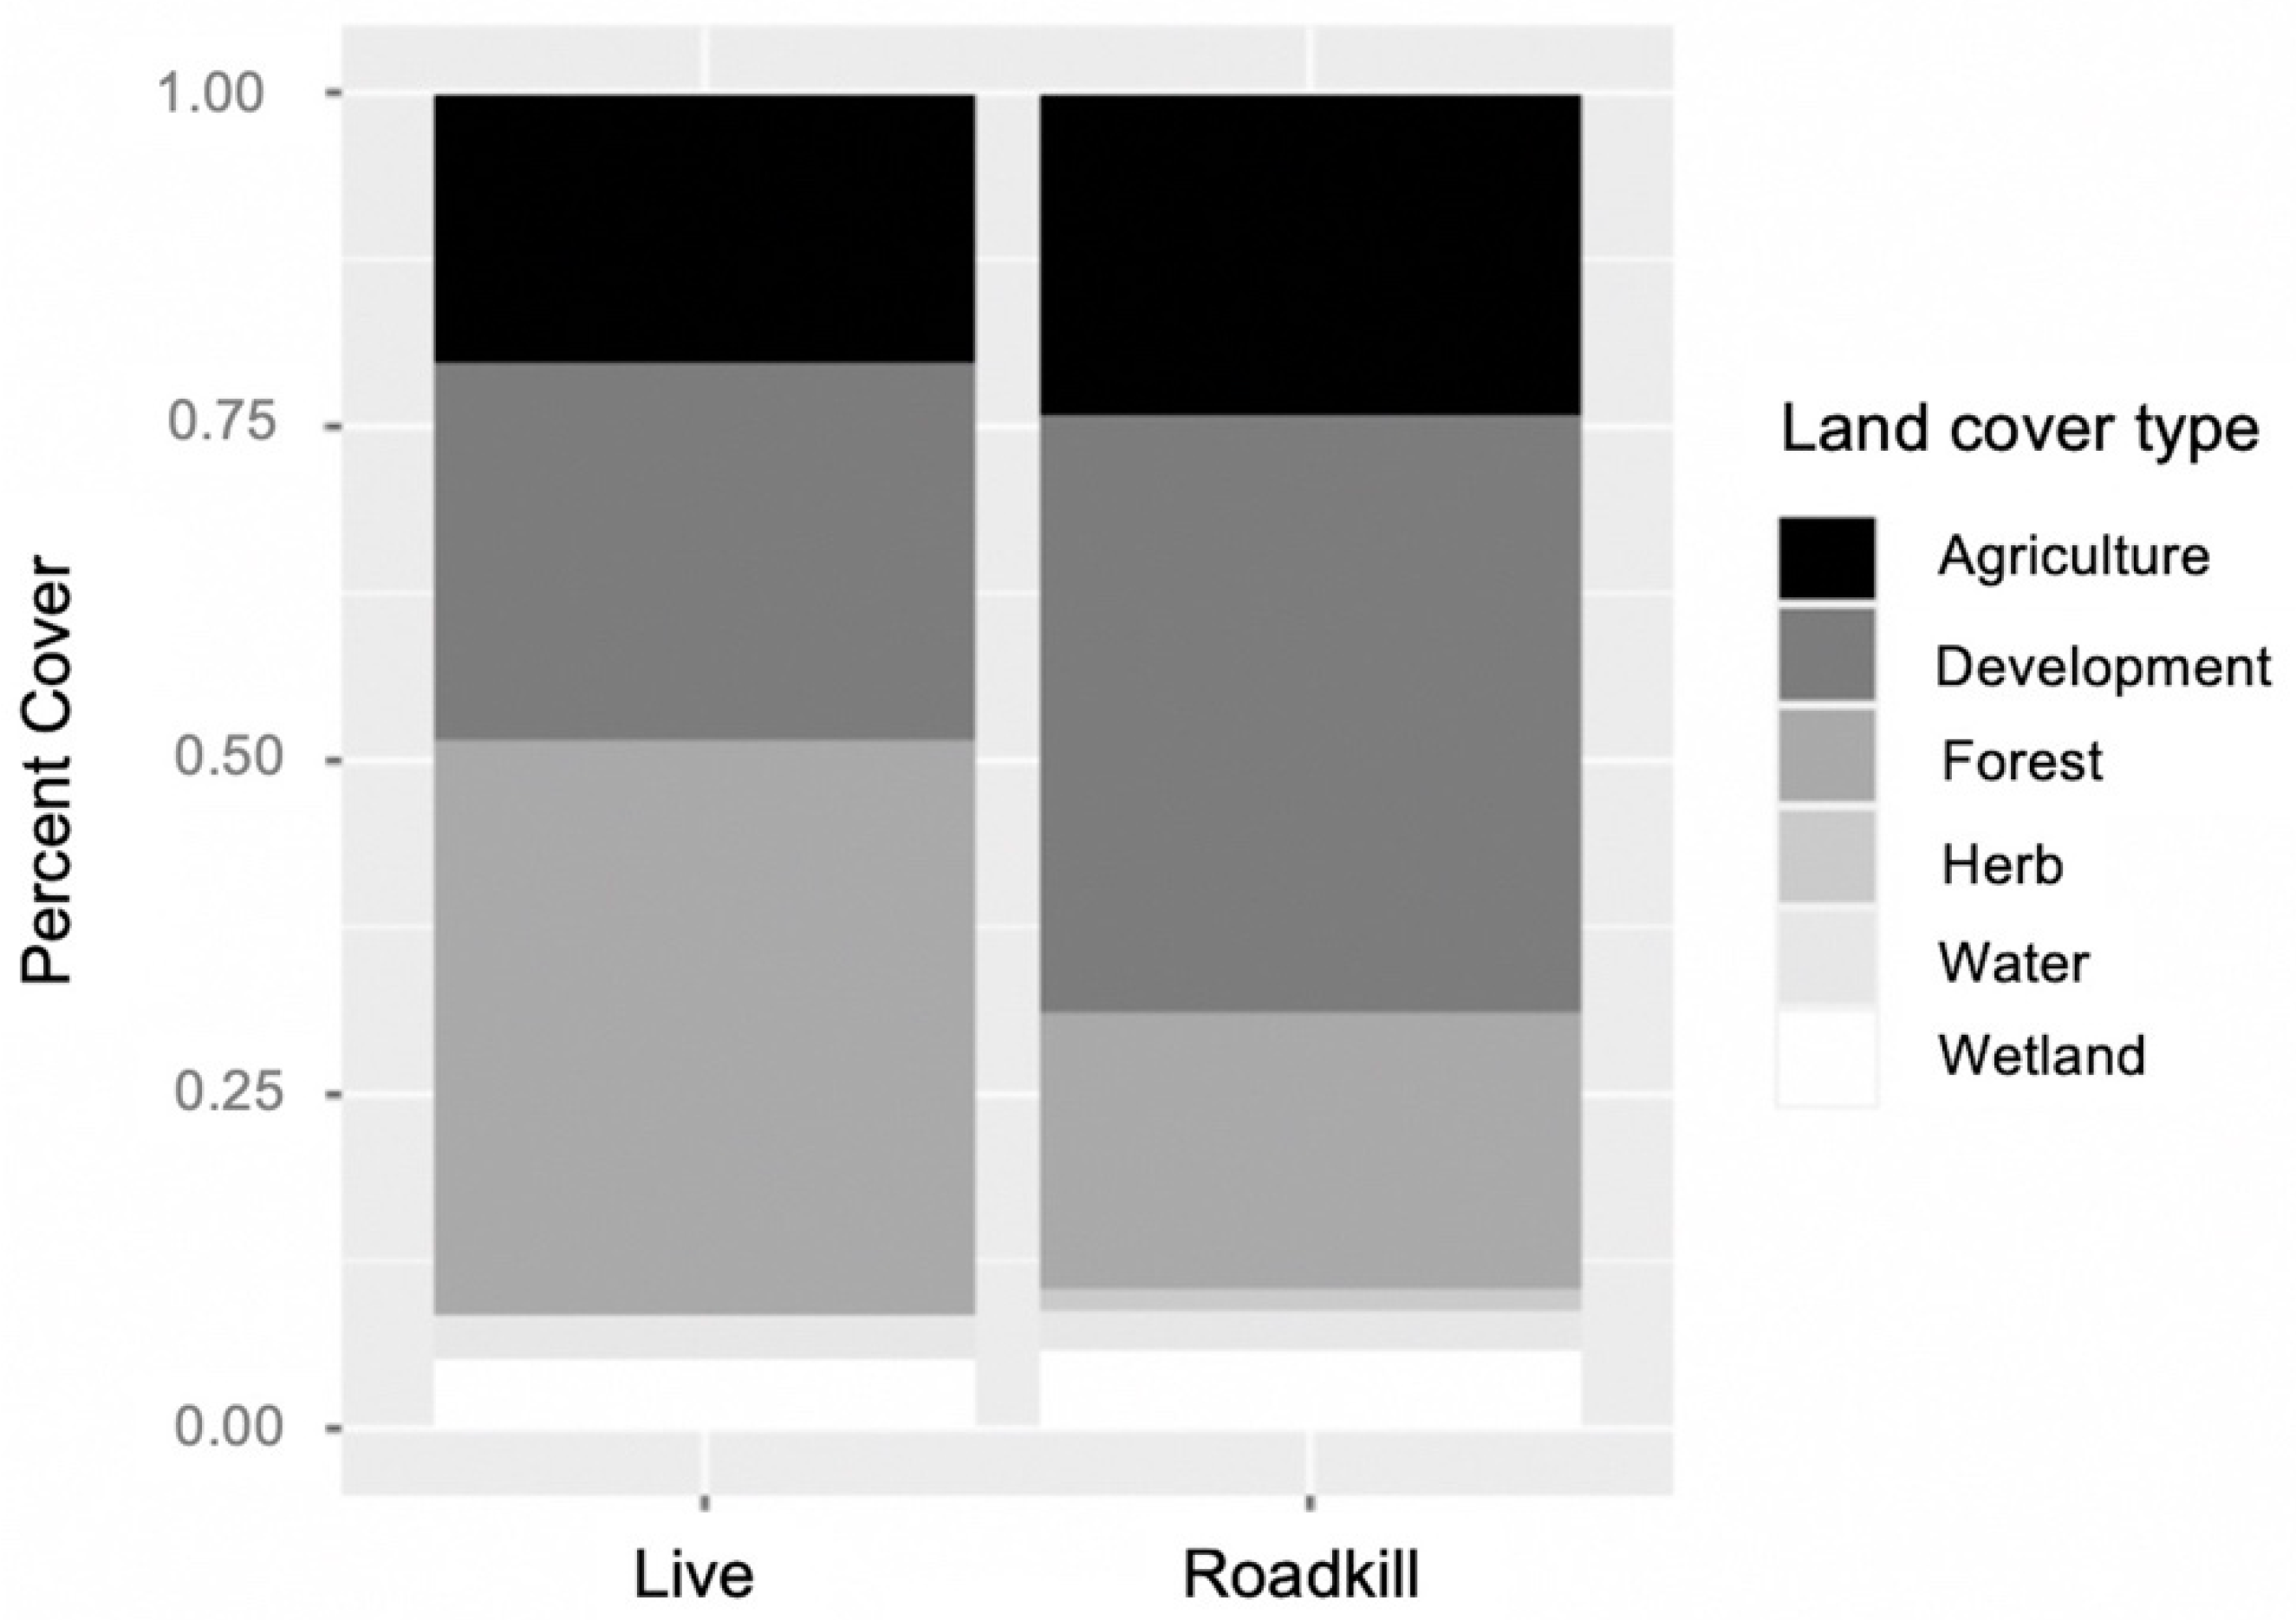
Because 54% of our armadillo presence dataset consisted of roadkills, we were concerned that the model would be biased towards roads and developed land cover types. To test for a difference in habitat surrounding roadkills vs. live presences, we developed a circular buffer equal to the mean home range size of an armadillo (8.7 ha; [22]) around each presence location and calculated percentages of land cover types (i.e., agriculture, development, forest, herbaceous, open water, wetland) within the buffer. We then used a chi-square test of independence (α = 0.05) to determine if land cover percentages differed near roadkill vs. live locations.
2.4. Potential Distribution
We modeled potential distribution of armadillos using MaxEnt [36], a program that utilizes a maximum entropy approach to predict the likelihood that a given species is present in a landscape based on presence locations and habitat data [50]. MaxEnt only requires a few presence locations (≥10) and is not as sensitive to spatial error as other presence-only modeling programs, making it ideal for modeling low-density populations [26,50,51].
Models were run with SDMToolbox 2.0, a GIS toolkit designed to simplify the process of spatial distribution modeling [52]. Measures were taken to avoid overfitting to presence points and generating further spatial bias. For example, presence locations were spatially segregated into groups using the spatial jacknife tool in SDMToolbox, rather than divided randomly, prior to k-fold cross-validation. This reduces the amount of environmental bias and allows for ease of detection of overfitting within groups by separating biases geographically [53].
Regularization multipliers and feature class settings were manually altered to tune the model and further reduce overfitting. Regularization limits model complexity by penalizing models that have many features or have features with strong weights [36,54]. Feature classes tested included linear, quadratic, hinge, product, and threshold and a series of regularization multipliers (1–5) when tuning the model. We applied a jackknife procedure to determine variable importance; the variable that produced the highest training gain when used in isolation and/or decreased the gain the most when omitted was determined to be the most useful to the model [26,51].
Response curves were utilized to determine how probability of presence changed in response to environmental variables [55]. Marginal response curves represented a model iteration in which a single environmental variable was varied while all other variables were kept at their mean value. When variables were correlated and marginal response curves were difficult to interpret, response curves representing a model iteration in which only one environmental variable was used were interpreted instead.
Model fit and performance [56] were assessed by the value of the Omission Error Rate (OER), followed by the area under the receiver operator curve (AUC). OER quantifies the proportion of presences that the model predicts as an absence. The ROC plots sensitivity vs. commission error. The best model would have the lowest OER and a high AUC on a scale from 0–1.
3. Results
Roadkill were found in areas with higher percentages of developed land cover, while live armadillos were observed in areas with higher percentages of forested cover (χ2 = 13.47, df = 5, p = 0.019, Figure 1). The model had an OER of 0.24, meaning it had a low false negative rate, and an AUC of 0.87, indicating a high sensitivity and specificity, or a high percentage of actual presences predicted and a low false positive rate [56,57]. The model used hinge as a feature class (i.e., parts of response curves were linear, while others were non-linear; [58]). The model used a regularization multiplier of 2.0 to best fit and smooth species response curves to environmental variables.
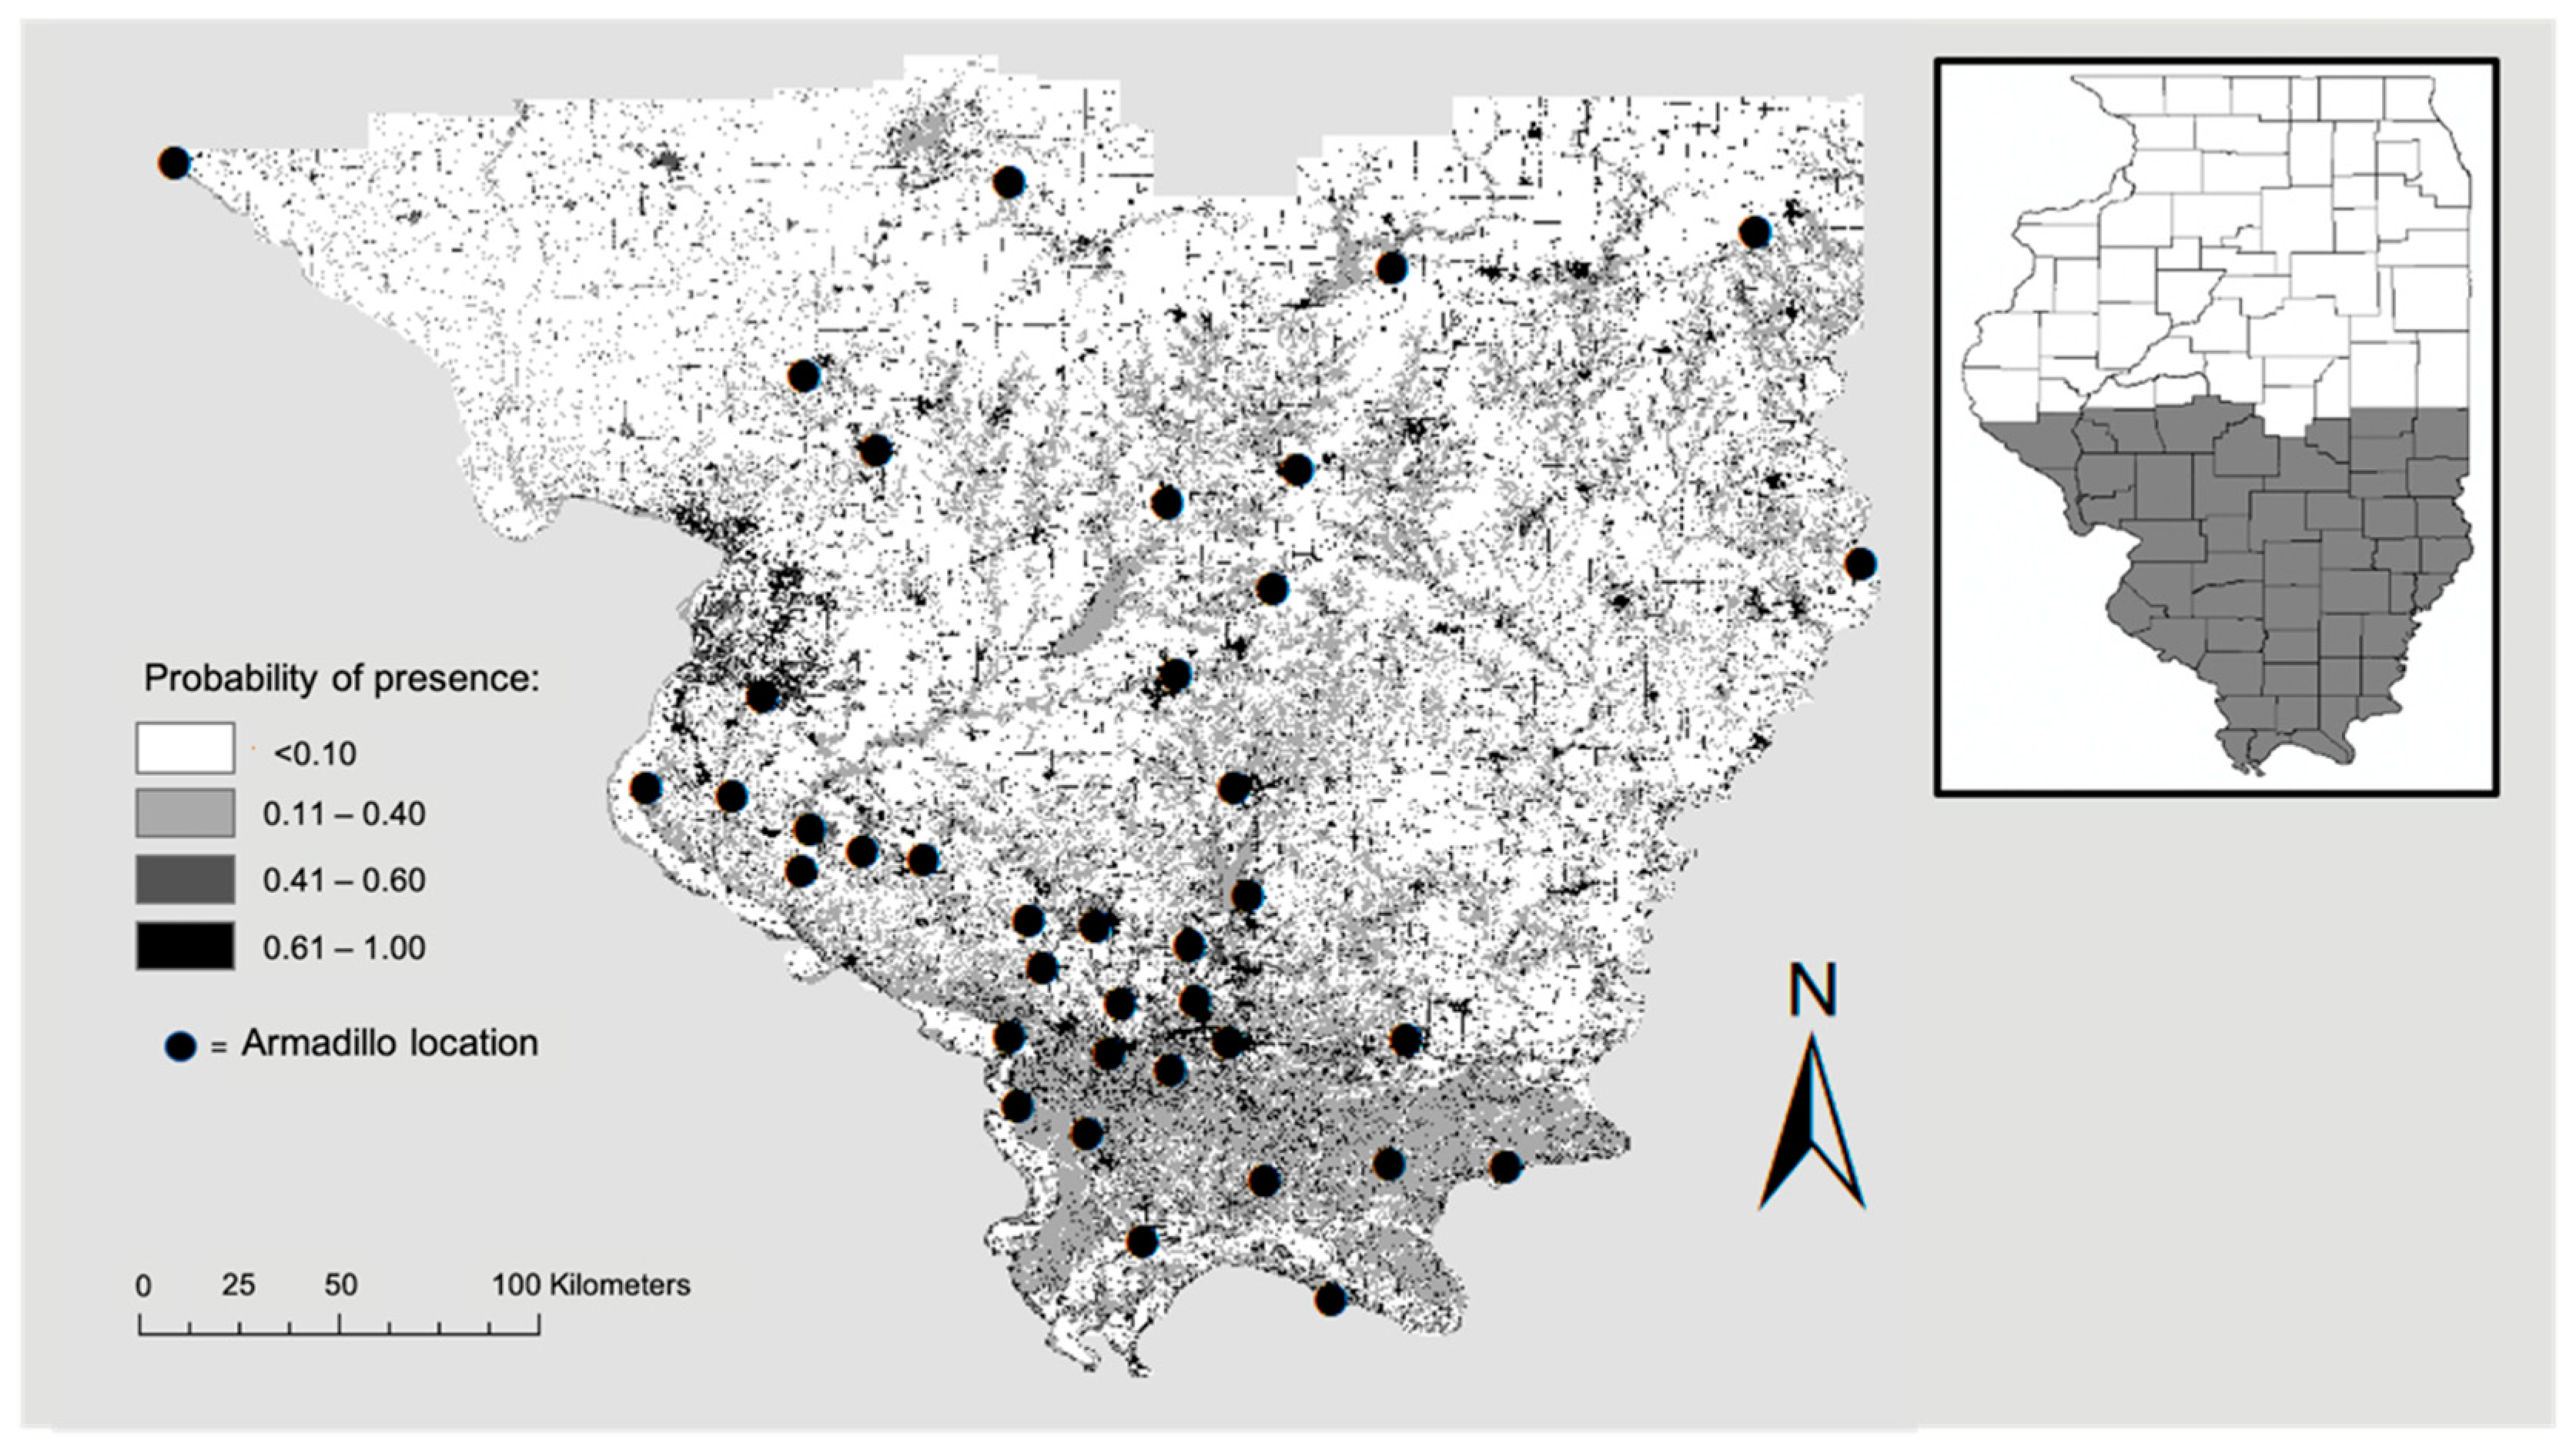
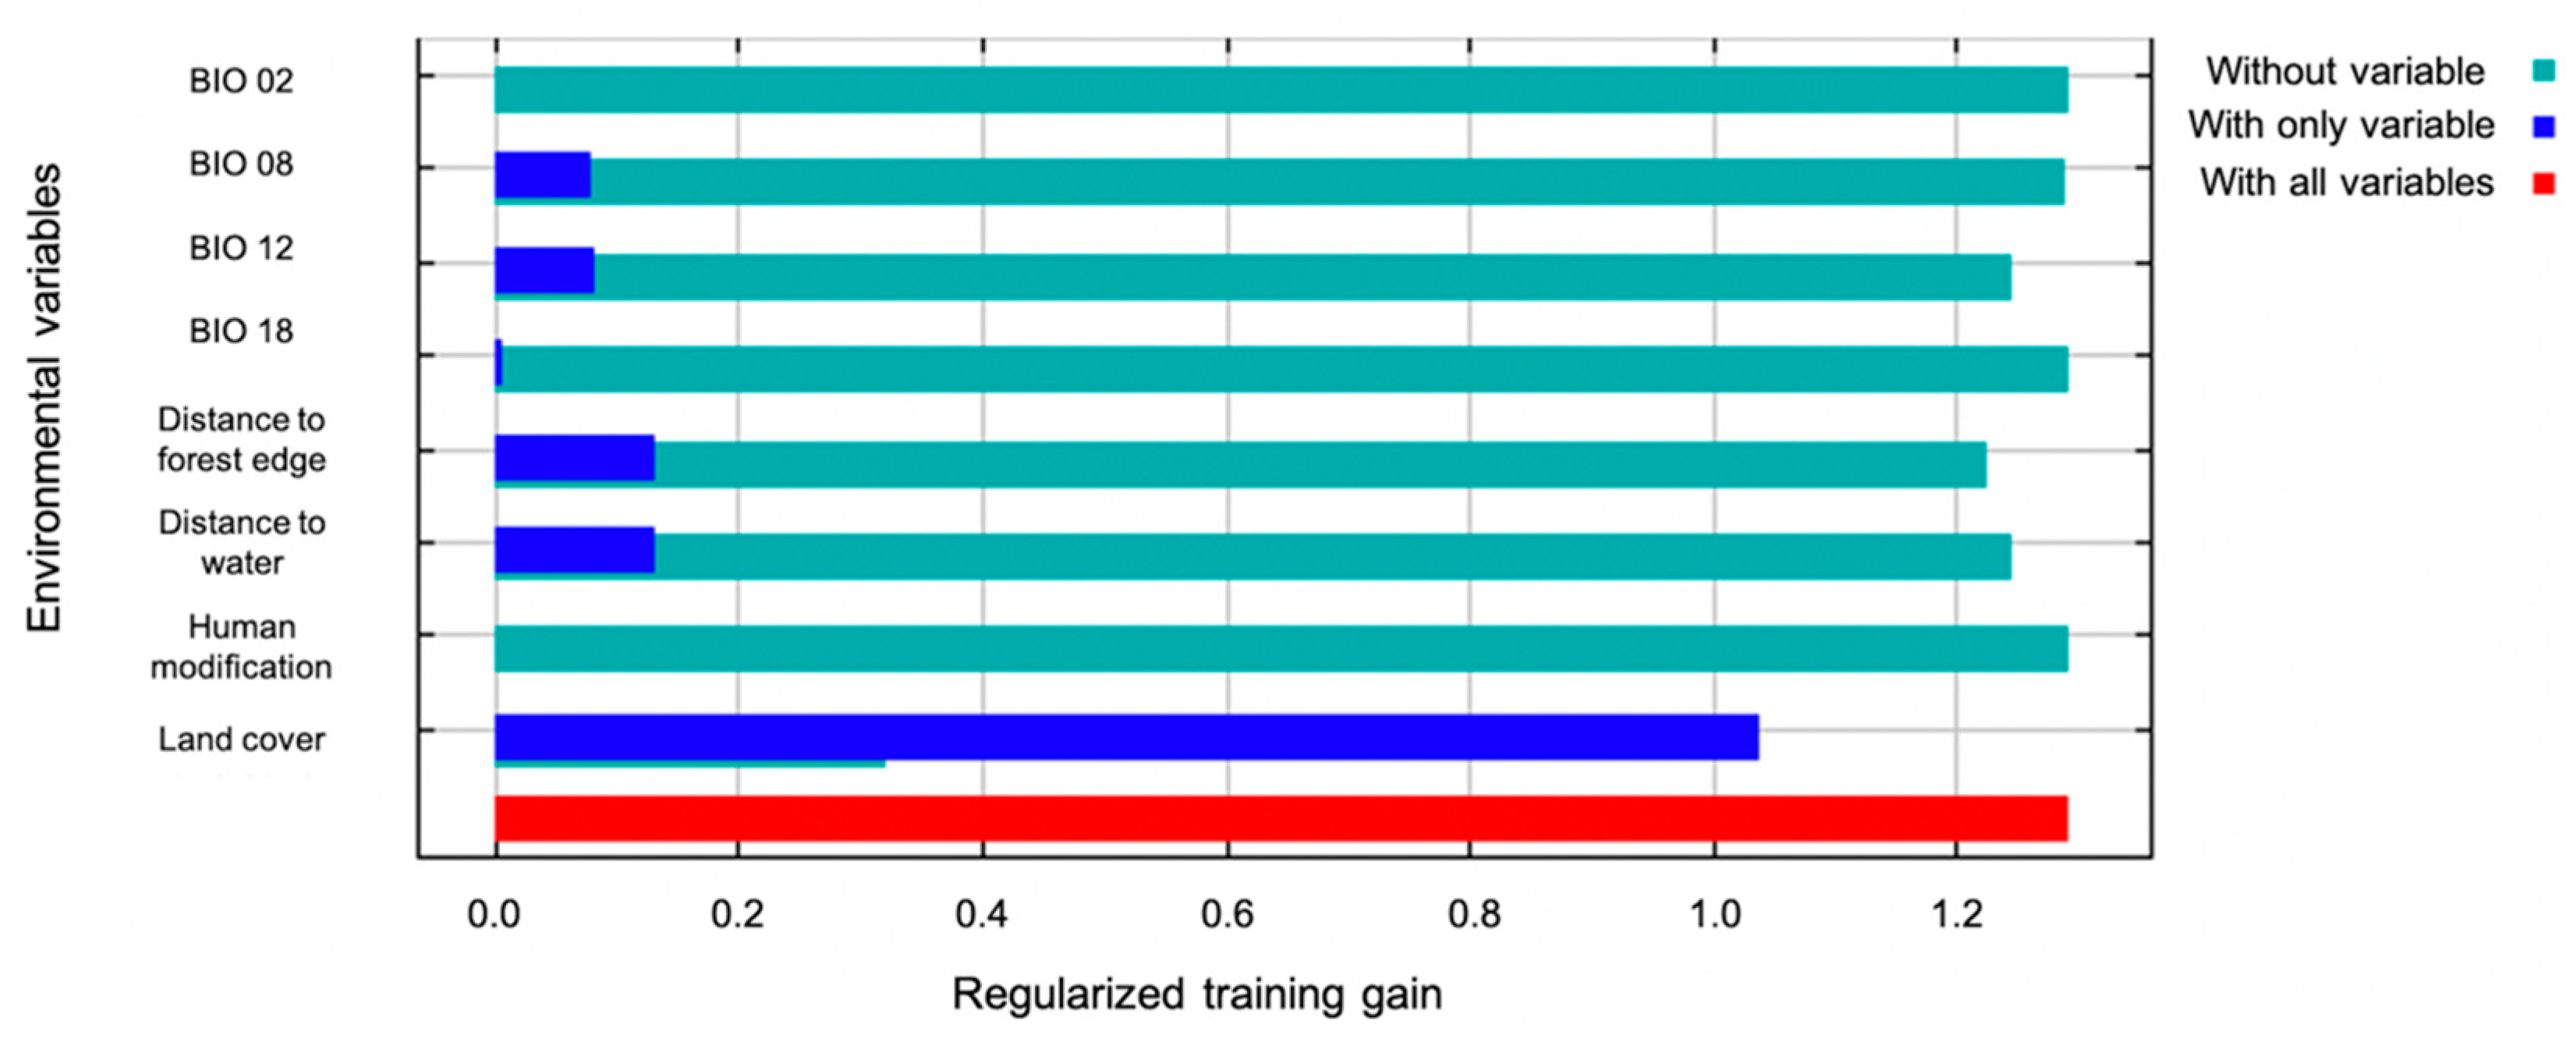
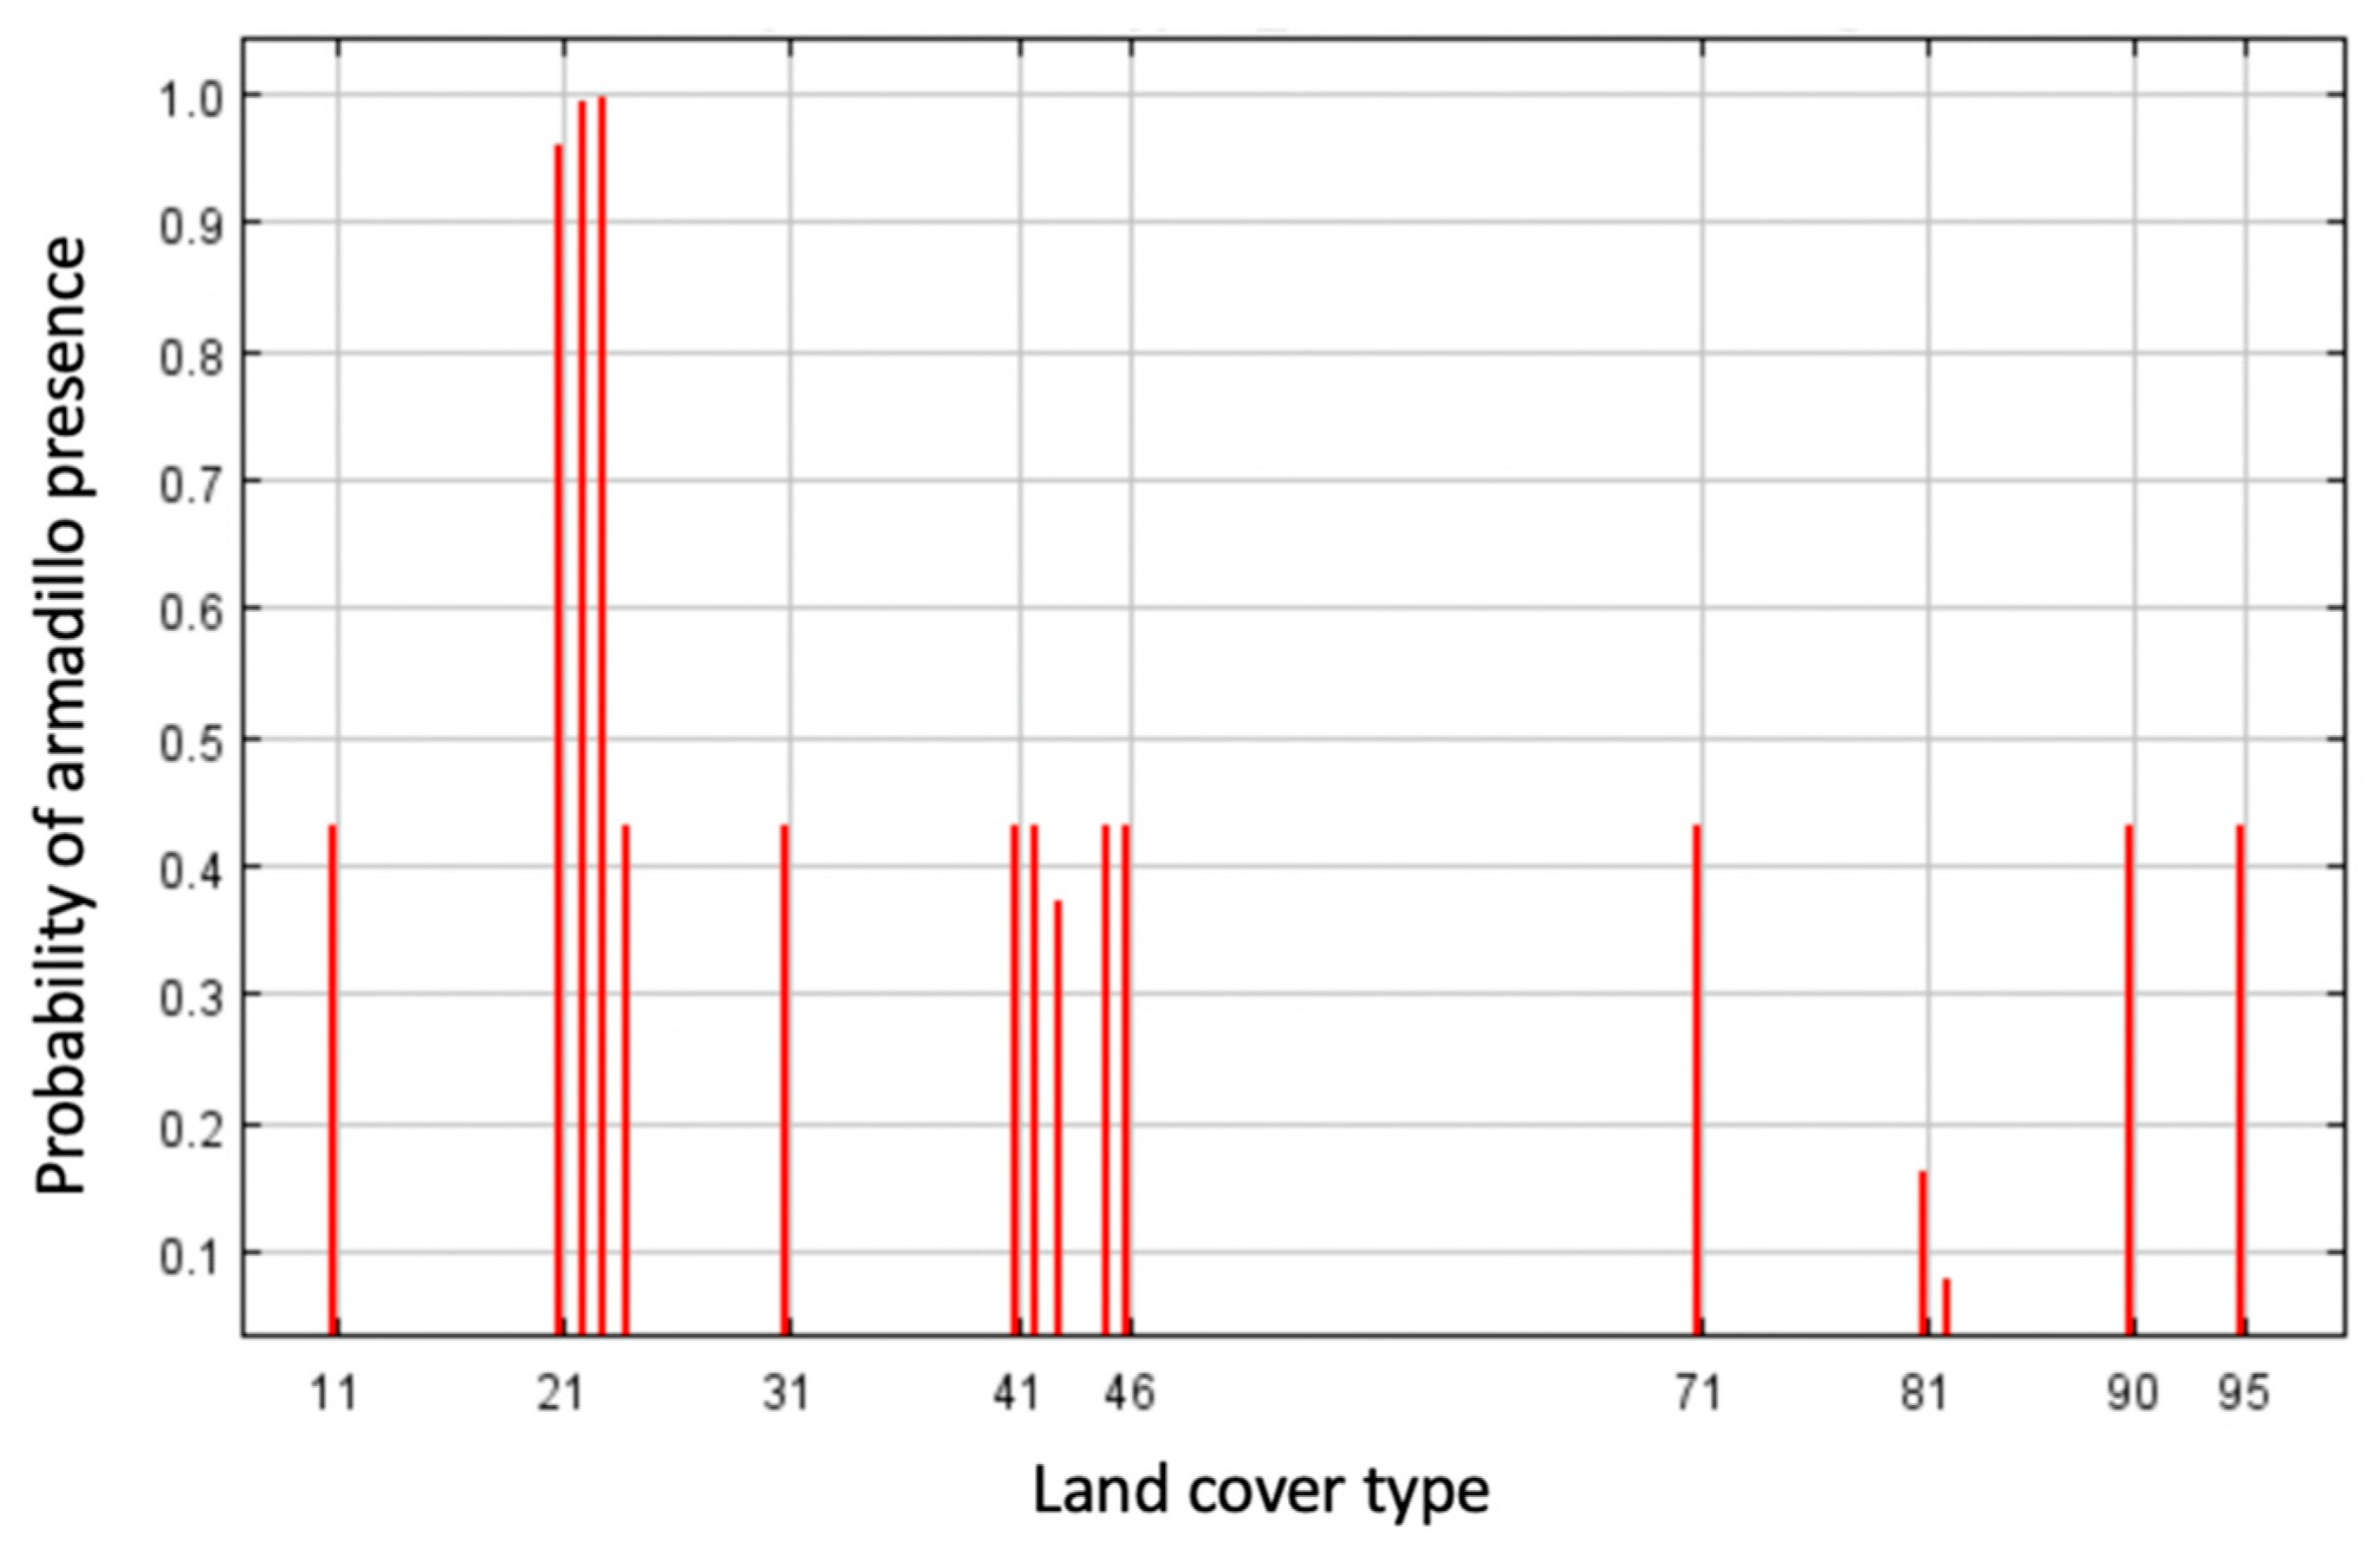
Highest probability of the presence of armadillos was in residential areas and along roadways, with the most contiguous area of potential armadillo presence in southernmost counties characterized by large, forested patches (Figure 2). In the northern portion of the study area, suitable habitat was concentrated around riparian areas (Figure 2). Land cover was the most important contributing variable to the model (83% contribution) and the most important variable in the jackknife of variable importance (Figure 3). Probability of armadillo presence was highest in open space development to medium development (Figure 4). Lowest probability of presence was in agricultural cover, with <20% probability for pasture, and <10% for cultivated crops (Figure 4). All other land cover types (open water, open space high development, barren land, forest, herbaceous, and wetland) had the same probability of presence, with about 43% probability of armadillo presence within each of these cover types.
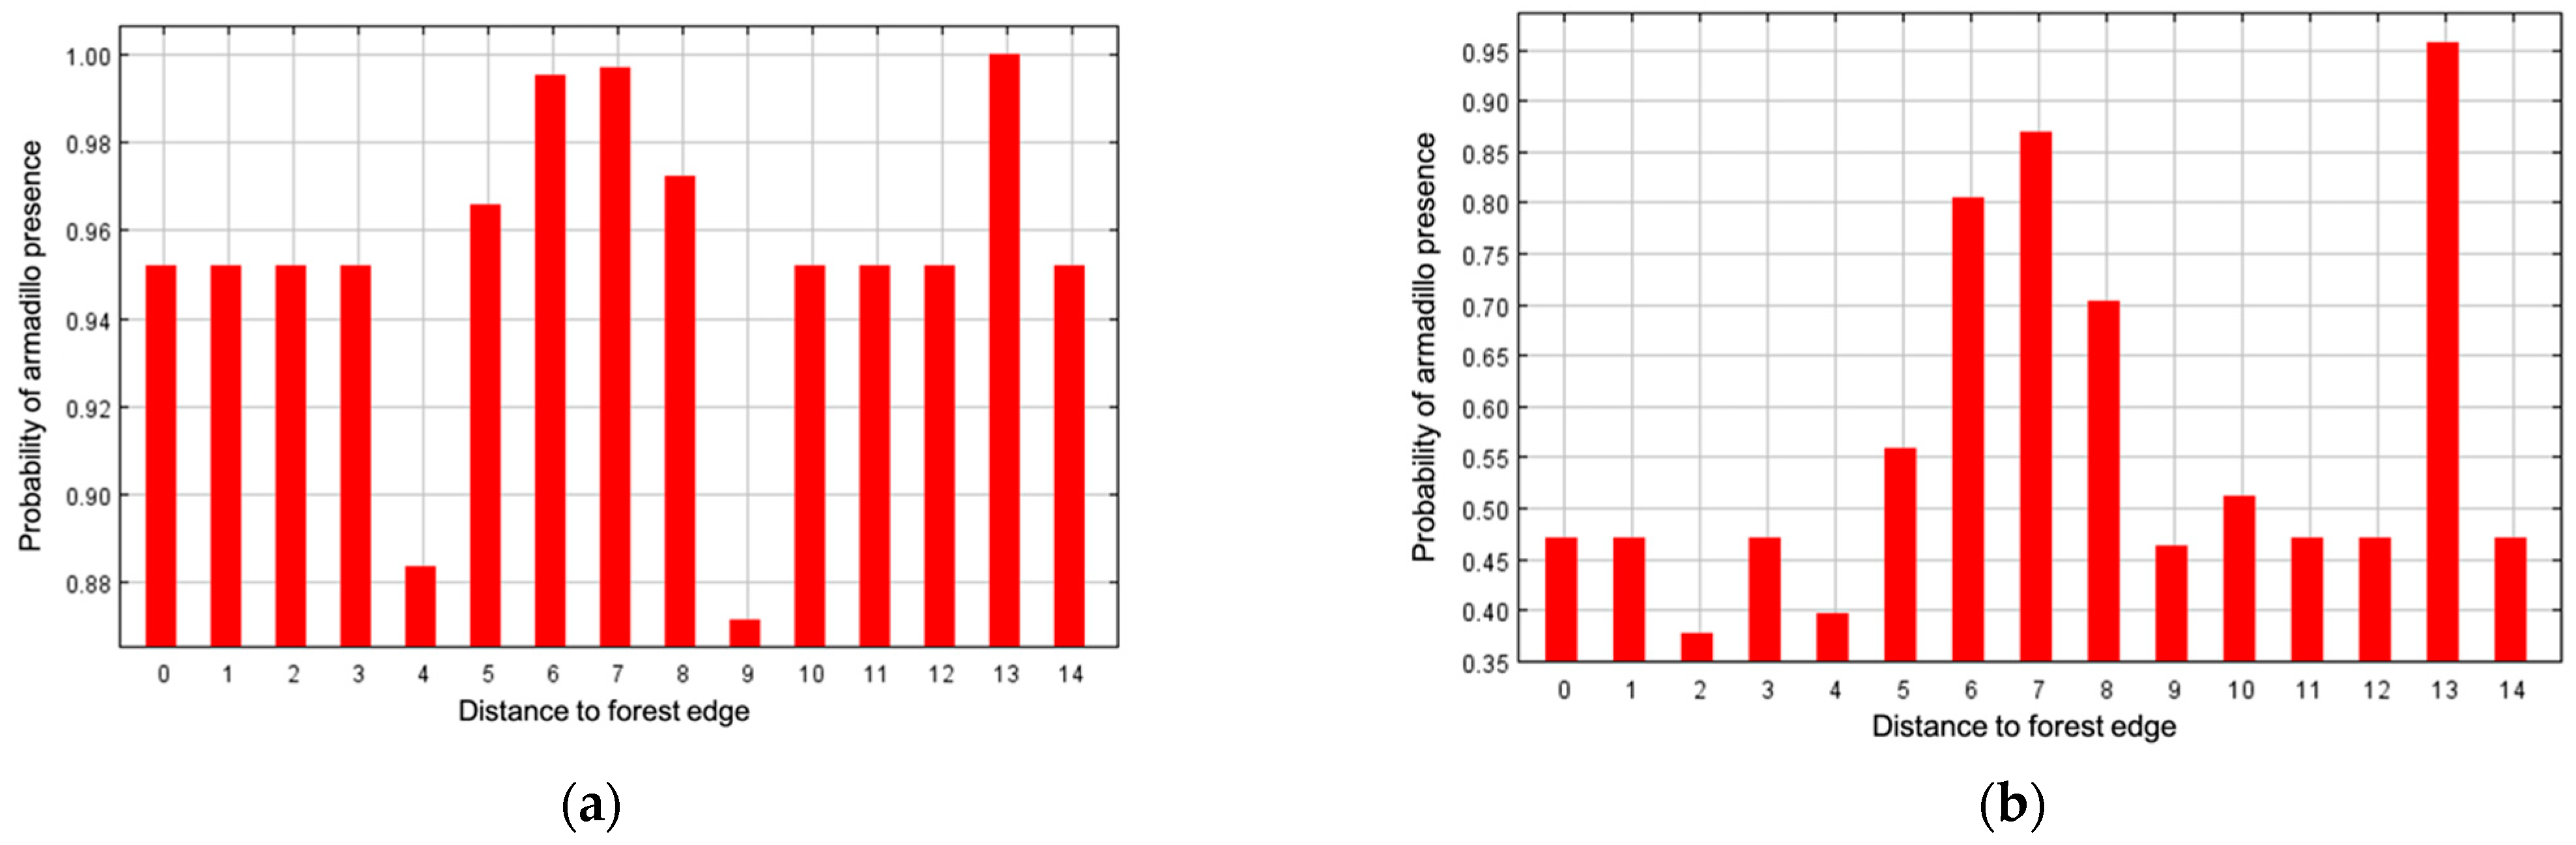
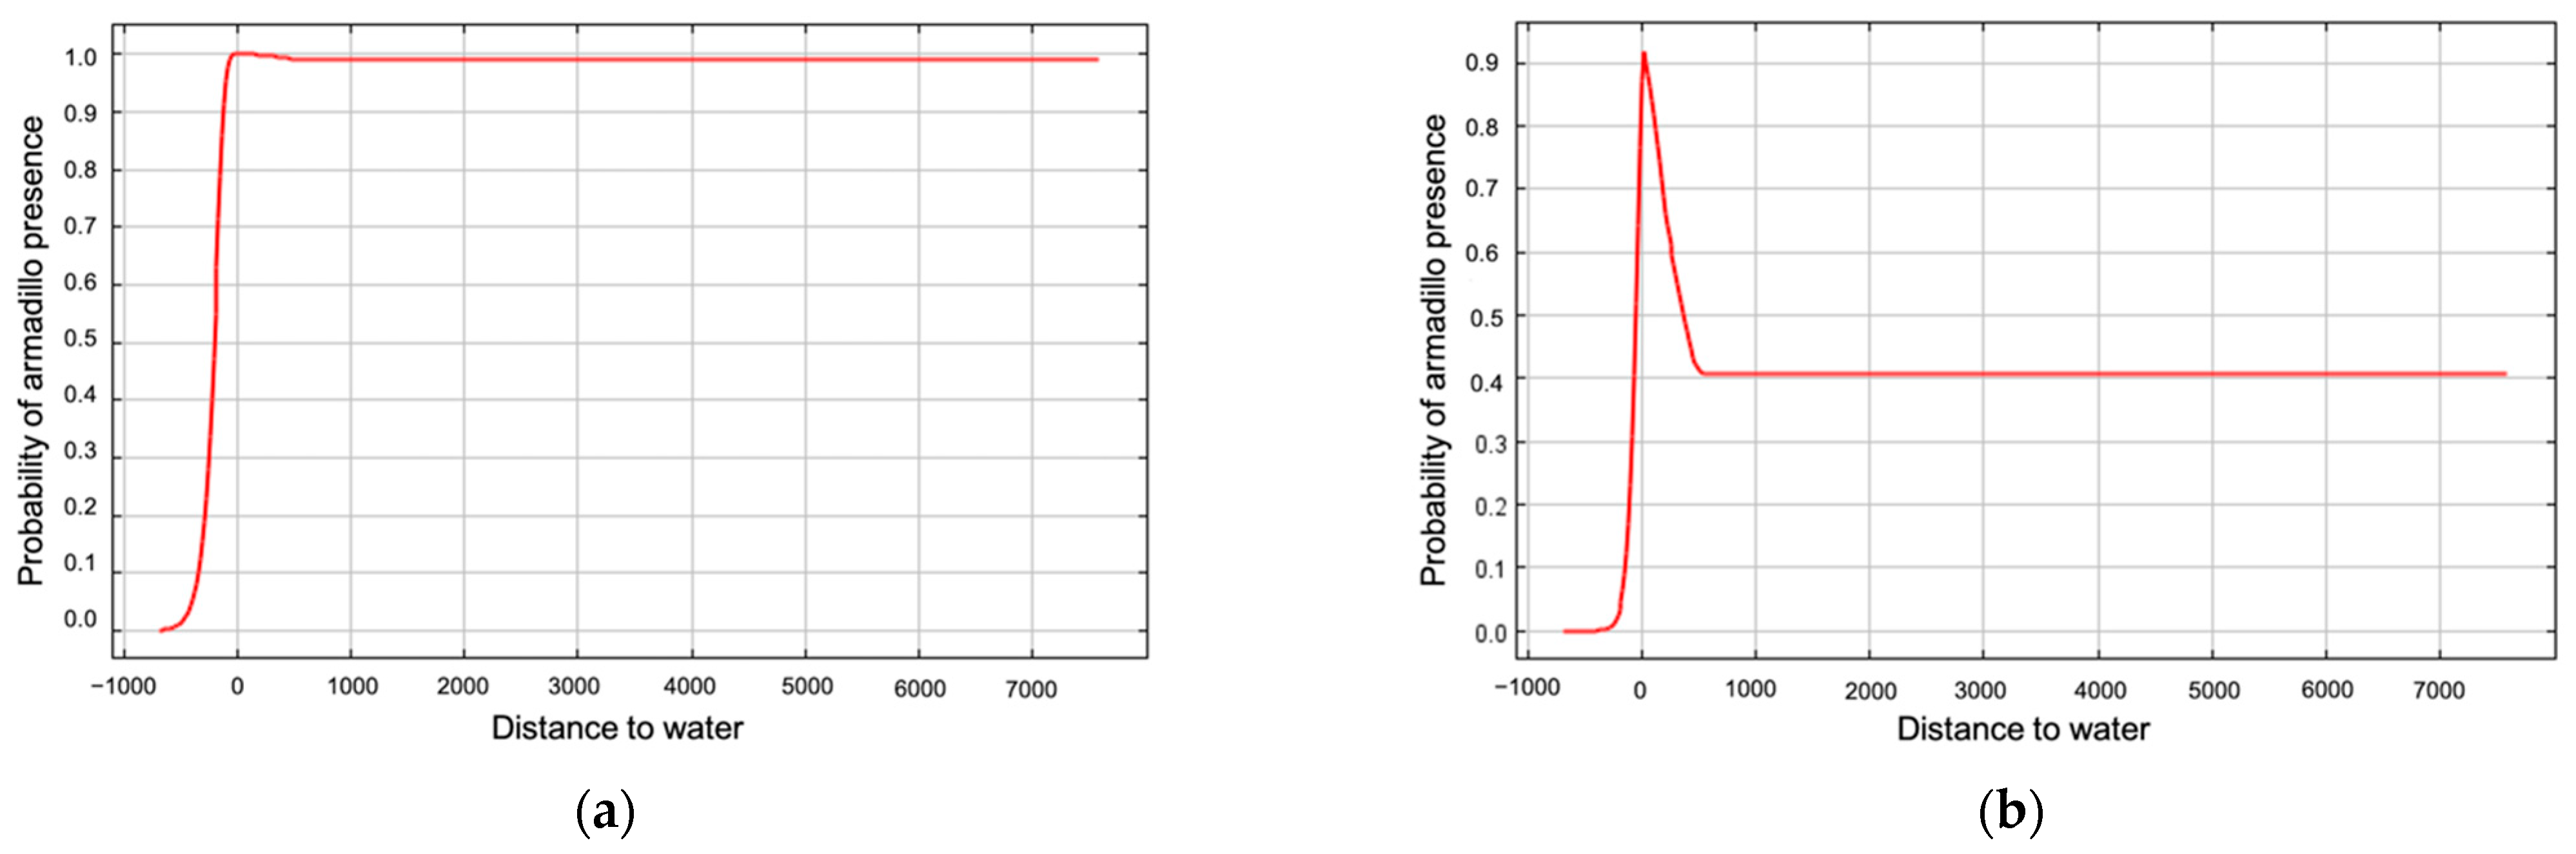
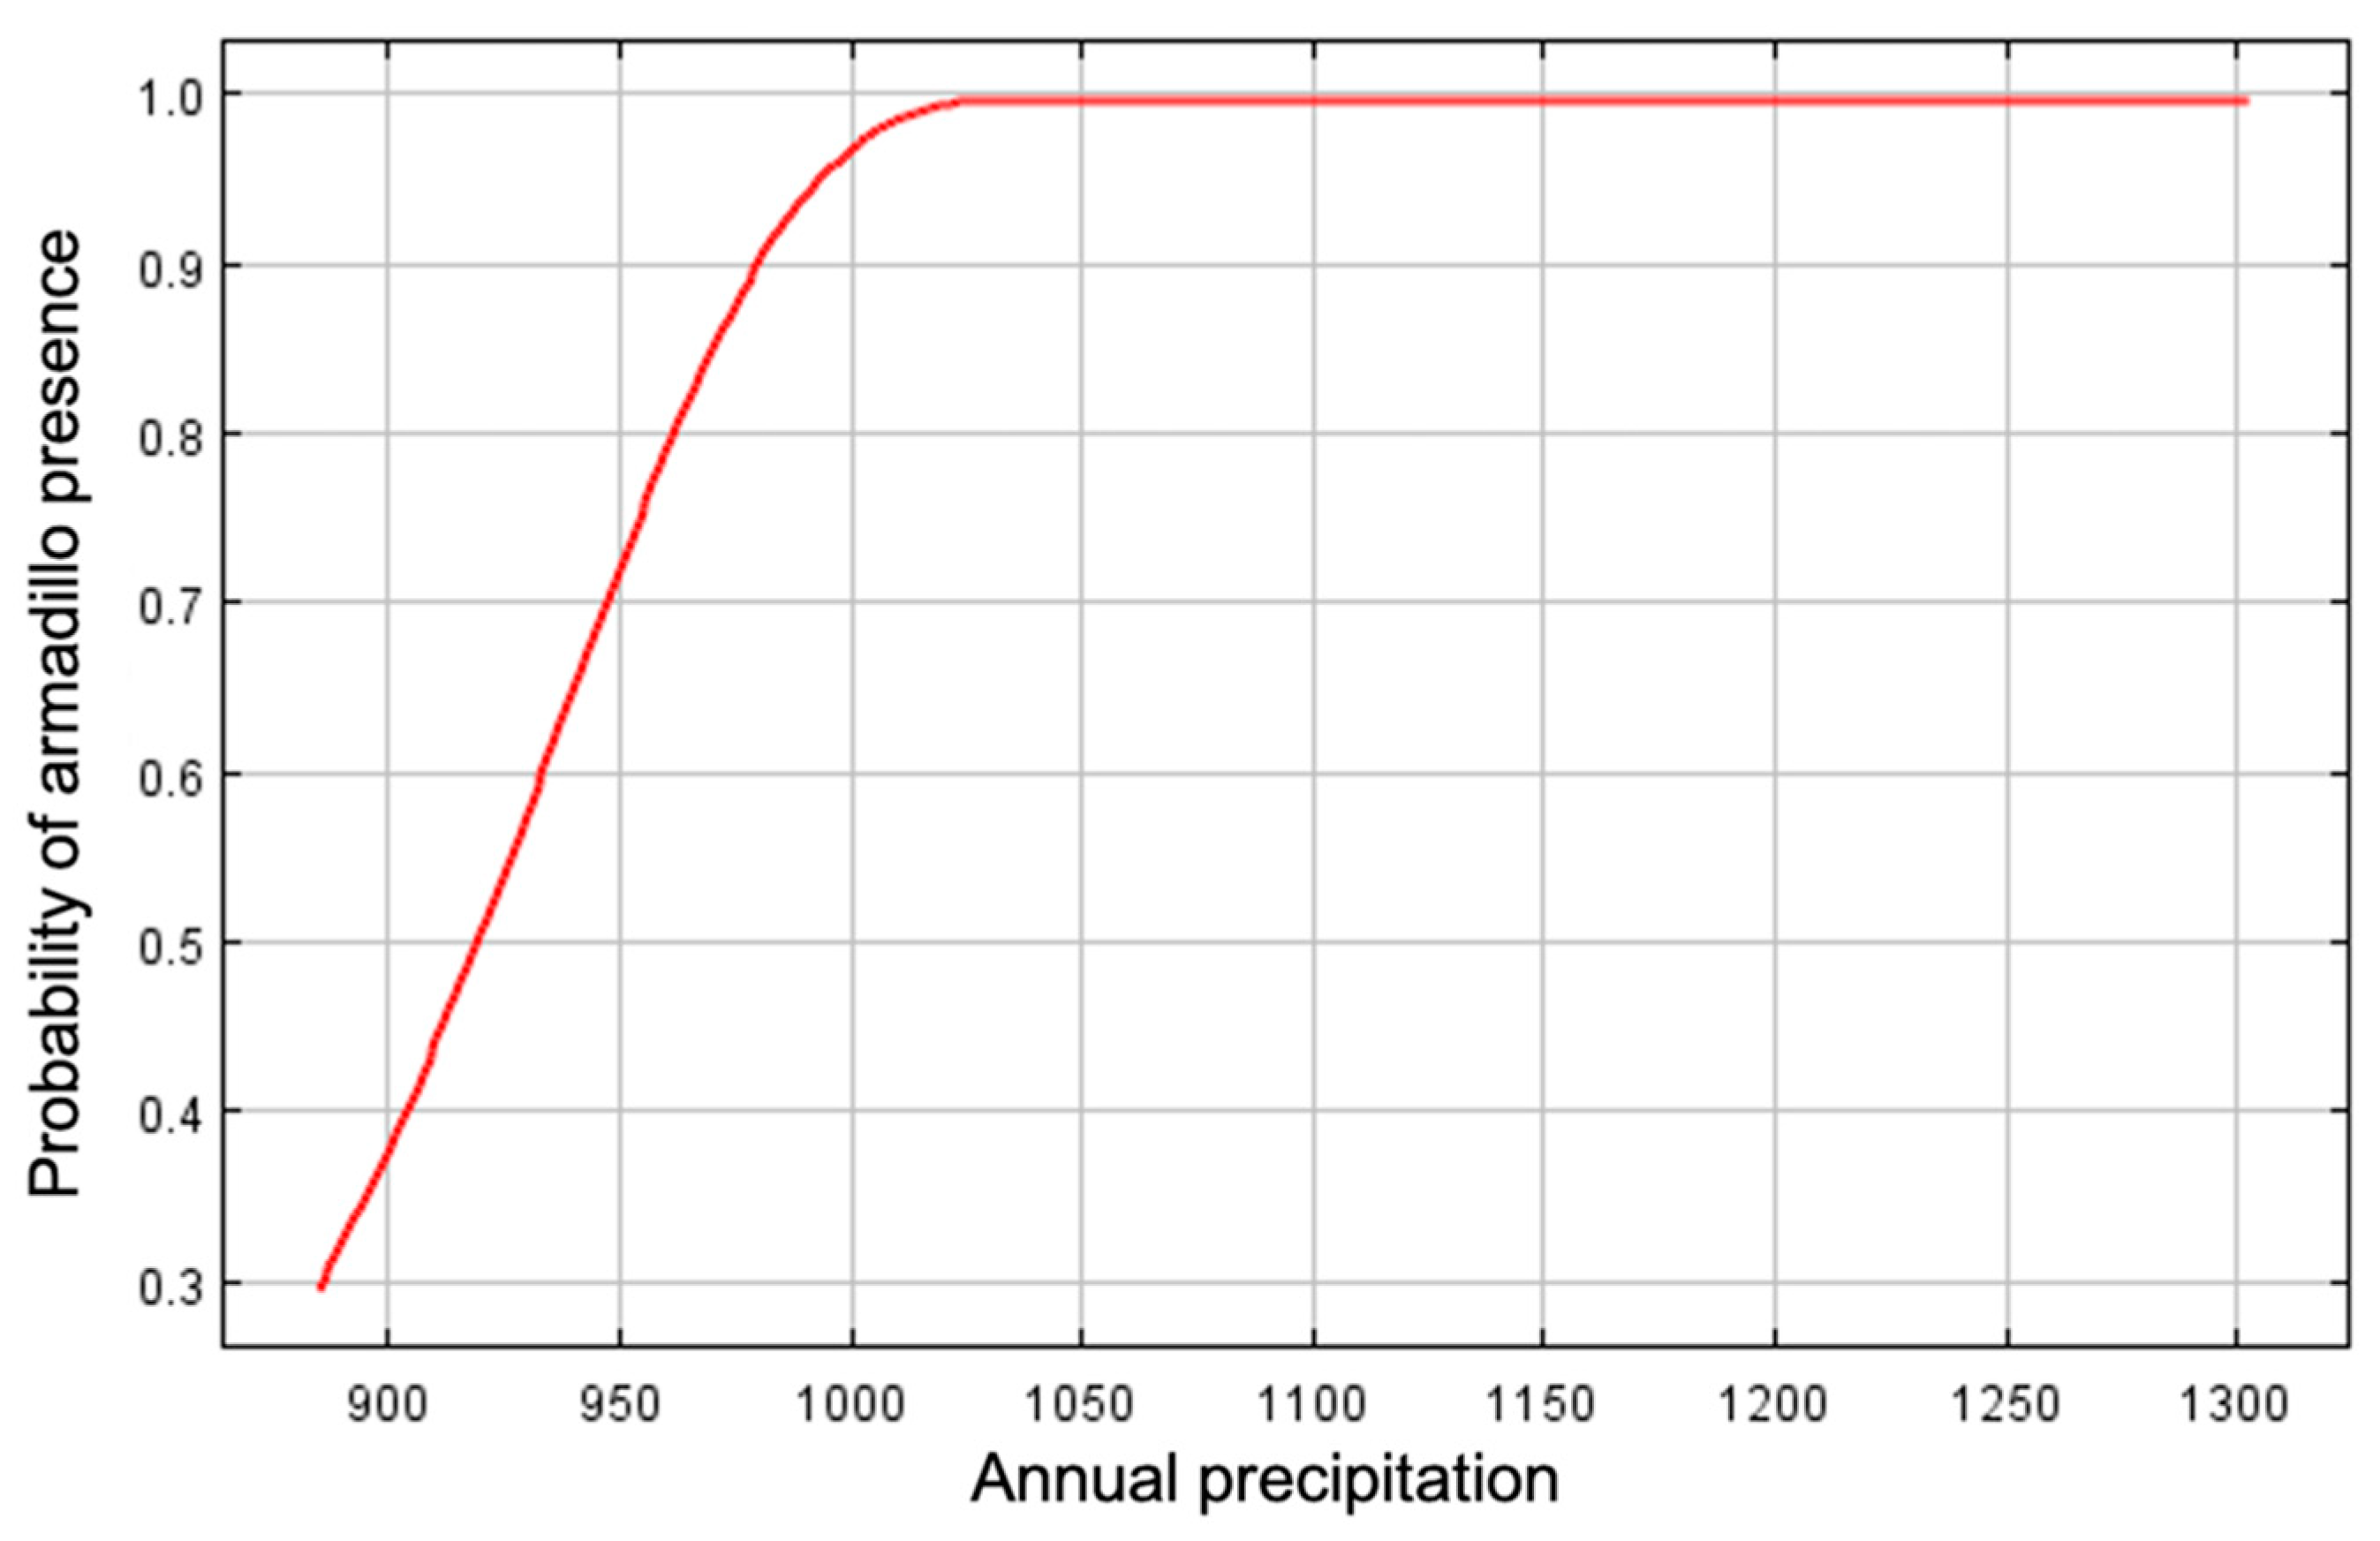
Annual precipitation (6.5%), distance to forest edge (5.9%), distance to water (4.1%), and mean temperature of the wettest quarter (0.4%) had little effect on armadillos’ presence, and all other variables had 0% contribution. Distance to forest and distance to water showed stronger relationships to probability of presence in response curves using only the corresponding variable than in marginal response curves. Probability of armadillo presence increased as distance to forest decreased, and within the forest interior, presence was highest 250–500 m from forest edge (Figure 5). Probability of presence also increased as distance to water decreased (Figure 6). Predicted presence was also positively correlated to annual precipitation (Figure 7).
4. Discussion
Our model of potential presence of colonizing armadillos in southern Illinois performed well, given the performance measures calculated [56]. Land cover was the most meaningful predictor of armadillo distribution, demonstrating that while climate may dictate broad distributional limits to armadillo populations [2,3], land cover type may be more important to determine the probability of armadillo presence at a fine scale. Variables that affect a species distribution are often influenced by the geographic extent of the model [36]. For example, climatic variables are important for global and meso-scales, while land cover variables influence species distributions for smaller scales [37]. Climate variables were generally uninformative in our analysis but were important to include given the proximity of the northern extent of likely armadillo expansion [2] to our study area.
Contrary to our prediction, the highest probability of armadillo presence was within open to medium intensity developed cover types, largely represented by roads and highways. This was likely because 54% of our presence dataset consisted of roadkill. Although this fact likely caused some bias in our model (as evidenced by roadkill locations occurring in areas of different habitat than for live armadillo locations), we believe it can still guide wildlife managers in predicting where armadillos may colonize in Illinois, as armadillos utilize areas with human disturbance and are even considered a pest, foraging on lawns and burrowing under man-made structures [1]. Additionally, roads may accelerate armadillo dispersal due to both accidental and purposeful human translocations. The expansion of transportation routes corresponded with the beginning of the armadillo’s range expansion in Texas, and human introductions lead to established populations in Florida [1,25]. Human introductions of armadillos have occurred numerous times throughout the southern United States, including the release or escape of armadillos into new regions, along with accidental transport on vehicles carrying livestock [13,25].
Consistent with our predictions, probability of presence was high in forested areas, such as the Shawnee National Forest and Kaskaskia, Big Muddy, and Little Wabash river systems. This is consistent with the idea that armadillo activity and dispersal corridors are centered around riparian areas [1]. McDonough et al. [20] reported that live armadillos and burrows were frequently sighted in hardwood hammocks and wetland areas, but burrows were never identified in open fields, such as pasture and cropland. Large, contiguous patches of forest cover in southernmost counties will provide quality habitat for armadillos that will likely serve as source populations. These areas are also characterized by low densities of roads, and therefore present a lower risk for pioneering individuals, as car collisions are a major source of mortality [1].
Contrary to our expectations, the land cover classes with the lowest probability of presence were pasture and cropland cover types. We did not anticipate agricultural areas to be the least important cover type, as armadillos use these areas to forage [1], and some even consider armadillos a nuisance to crops [13]. However, agricultural matrices may be able to support armadillo populations given the presence of forested riparian habitat [39]. This low probability of presence could be attributed to lower detection rates in pasture and crop fields, though McDonough et al. [20] also found that armadillos were seen less frequently than expected in fields.
In contrast to our prediction, distance to forest cover, distance to water, and annual precipitation had little contribution to the model. However, there was a clear positive correlation of annual precipitation and predicted presence, which concurs with other studies [2,3,24]. Armadillos are rarely found in arid regions, and rainfall impacts prey availability and foraging activity [1]. Without fresh water access, such as in periods of prolonged drought, armadillo mortality rates increase [59].
Our study can provide valuable information to wildlife managers in anticipating where armadillos may colonize in Illinois, and may serve as a guide for similar studies in other states. Confirmed localities near the northern edge of the study area in combination with predicted suitable habitat suggest that armadillos have the potential to colonize areas in central Illinois. Pioneering armadillos have been most successful in riparian habitat [24,60], and such may be true for Illinois [7] and for other parts of the nation as armadillos continue to expand their range. These riparian corridors may be used by armadillos to move through areas of heavy agricultural use characteristic of Illinois. Riparian systems that continue northward into central Illinois may serve as a marginal sink in which armadillos can survive temporarily but climatic conditions, such as harsh winters or drought, may not support long-term persistence [3,61]. Managers should monitor forested areas within agriculture-dominated regions that may serve as a refuge for armadillos, resulting in increased human-wildlife conflict such as crop damage or predation of poultry eggs [13,39].
Additionally, our study can serve as a guide for where armadillo range may overlap with sensitive species. For example, species active in leaf litter at night when armadillos are foraging, such as salamanders, may be particularly vulnerable to predation [62], although armadillos rarely consume amphibians and reptiles [13]. However, special attention should be paid to species that are threatened in the state, such as the Jefferson Salamander (Ambystoma jeffersonianum, [63]). Furthermore, armadillo habitat overlaps suitable bobwhite habitat in portions of Illinois [17]. However, there is evidence that hardwood removal and prescribed burning used to manage bobwhite habitat also affects armadillo populations negatively [21]. Managers should consider using these tactics to simultaneously reduce armadillo populations and improve bobwhite habitat in regions where these species overlap.
Author Contributions
Conceptualization, C.J.H., F.A.J. and C.K.N.; methodology, C.J.H.; formal analysis, C.J.H.; investigation, C.J.H.; resources, F.A.J. and C.K.N.; writing—original draft preparation, C.J.H.; writing—review and editing, F.A.J. and C.K.N.; visualization, C.J.H.; supervision, F.A.J. and C.K.N.; project administration, F.A.J. and C.K.N.; funding acquisition, F.A.J. and C.K.N. All authors have read and agreed to the published version of the manuscript.
Funding
This research was funded by the Illinois Department of Natural Resources via Federal Aid Project 135-R and the National Science Foundation via NSF-DUE 1564969.
Institutional Review Board Statement
This study was approved by Southern Illinois University Carbondale’s Institutional animal Care and Use Committee (protocol number 17–024, approved 17 September 2017).
Informed Consent Statement
Not applicable.
Data Availability Statement
Data available upon request from the corresponding author.
Acknowledgments
We would like to thank Southern Illinois University’s Cooperative Wildlife Research lab, University Farms, and Touch of Nature for their support of this project. We thank the Illinois Department of Natural Resources and the residents of southern Illinois for their cooperation and aid in data collection. We would also like to thank our field technicians, Anna Wilson and Michael Deutsch, for their assistance in data collection.
Conflicts of Interest
The authors declare no conflict of interest.
References
- Loughry, W.J.; McDonough, C.M. The Nine-Banded Armadillo: A Natural History; University of Oklahoma Press: Norman, Oklahoma, 2013. [Google Scholar]
- Feng, X.; Papeş, M. Ecological niche modelling confirms potential north-east range expansion of the nine-banded armadillo (Dasypus novemcinctus) in the USA. J. Biogeogr. 2015, 42, 803–807. [Google Scholar] [CrossRef]
- Taulman, J.F.; Robbins, L.W. Range expansion and distributional limits of the nine-banded armadillo in the United States: An update of Taulman & Robbins (1996). J. Biogeogr. 2014, 41, 1626–1630. [Google Scholar]
- Feijó, A.; Patterson, B.D.; Cordeiro-Estrela, P. Phenotypic variability and environmental tolerance shed light on nine-banded armadillo Nearctic invation. Biol. Invasions 2019, 22, 255–269. [Google Scholar] [CrossRef]
- Genoways, H.H.; Freeman, P.W. Recent northern records of the nine-banded armadillo (Dasypodidae) in Nebraska. Southwest. Nat. 1998, 43, 491–495. [Google Scholar]
- Hofmann, J.E. Records of nine-banded armadillos, Dasypus novemcinctus, in Illinois. Trans. Illinois State Acad. Sci. 2009, 102, 95–106. [Google Scholar]
- Van Deelen, T.R.; Parrish, J.D.; Heske, E.J. A nine-banded armadillo (Dasypus novemcinctus) from central Illinois. Southwest. Nat. 2002, 47, 489–491. [Google Scholar] [CrossRef]
- Mcbee, K.; Baker, R.J. Dasypus novemcinctus. Mamm. Species 1982, 162, 1–9. [Google Scholar] [CrossRef]
- Rodrigues, T.F.; Mantellatto, A.M.B.; Superina, M.; Chiarello, A.G. Ecosystem services provided by armadillos. Biol. Rev. 2020, 95, 1–21. [Google Scholar] [CrossRef]
- Yeo, M.; Acosta, N.; Llewellyn, M.; Sánchez, H.; Adamson, S.; Miles, G.A.J.; López, E.; González, N.; Patterson, J.S.; Gaunt, M.W.; et al. Origins of Chagas disease: Didelphis species are natural hosts of Trypanosoma cruzi I and armadillos hosts of Trypanosoma cruzi II, including hybrids. Int. J. Parasitol. 2005, 35, 225–233. [Google Scholar] [CrossRef]
- Hiestand, S.; Nielsen, C.K.; Jimenez, A.F. Modelling potential presence of metazoan endoparasites of bobcats (Lynx rufus) using verified records. Folia Parasitol. 2014, 61, 401–410. [Google Scholar] [CrossRef] [Green Version]
- Truman, R. Leprosy in wild armadillos. Lepr. Rev. 2005, 76, 198–208. [Google Scholar] [CrossRef]
- Fitch, H.S.; Goodrum, P.; Newman, C. The armadillo in the Southeastern United States. J. Mammal. 1952, 33, 21–37. [Google Scholar] [CrossRef]
- Loughry, W.J.; Truman, R.W.; McDonough, C.M.; Tilak, M.-K.; Garnier, S.; Delsuc, F. Is leprosy spreading among nine-banded armadillos in the southeastern United States? J. Wildl. Dis. 2009, 45, 144–152. [Google Scholar] [CrossRef] [Green Version]
- Staller, E.L.; Warnell, D.B.; Palmer, W.E.; Carroll, J.P.; Thornton, R.P.; Sisson, D.C. Identifying predators at northern bobwhite nests. J. Wildl. Manag. 2005, 69, 124–132. [Google Scholar] [CrossRef]
- Williams, M. Northern Bobwhite. In Endangered and Disappearing Birds of the Midwest; Indiana University Press: Bloomington, Indiana, 2018; pp. 4–7. [Google Scholar]
- Berkman, L.K.; Nielsen, C.K.; Roy, C.L.; Heist, E.J. Population genetic structure among bobwhite in an agriculturally modified landscape. J. Wildl. Manag. 2013, 77, 1472–1481. [Google Scholar] [CrossRef]
- Berkman, L.K.; Nielsen, C.K.; Roy, C.L.; Heist, E.J. Resistance is futile: Effects of landscape features on gene flow of the northern bobwhite. Conserv. Genet. 2013, 14, 323–332. [Google Scholar] [CrossRef]
- Rollins, D.; Carroll, J.P. Impacts of predation on northern bobwhite and scaled quail. Wildl. Soc. Bull. 2001, 29, 39–51. [Google Scholar]
- McDonough, C.M.; Delaney, M.A.; Le, P.Q.; Blackmore, M.S.; Loughry, W.J. Burrow characteristics and habitat associations of armadillos in Brazil and the United States of America. Rev. Biol. Trop. 2000, 48, 109–120. [Google Scholar]
- McDonough, C.M.; Loughry, W.J. Impacts of land management practices on a population of nine-banded armadillos in northern Florida. Wildl. Soc. Bull. 2005, 33, 1198–1209. [Google Scholar] [CrossRef]
- Gammons, D.J.; Mengak, M.T.; Conner, L.M. Armadillo habitat selection in southwestern Georgia. J. Mammal. 2009, 90, 356–362. [Google Scholar] [CrossRef]
- Inbar, M.; Mayer, R.T. Spatio-temporal trends in armadillo diurnal activity and road-kills in Central Florida. Wildl. Soc. Bull. 1999, 27, 865–872. [Google Scholar]
- Humphrey, S.R. Zoogeography of the nine-banded armadillo (Dasypus novemcinctus) in the United States. Bioscience 1974, 24, 457–462. [Google Scholar] [CrossRef]
- Taulman, J.F.; Robbins, L.W. Recent range expansion and distributional limits of the nine- banded armadillo (Dasypus novemcinctus) in the United States. J. Biogeogr. 1996, 23, 635–648. [Google Scholar] [CrossRef]
- Elith, J.; Phillips, S.J.; Hastie, T.; Dudík, M.; Chee, Y.E.; Yates, C.J. A statistical explanation of MaxEnt for ecologists. Divers. Distrib. 2011, 17, 43–57. [Google Scholar] [CrossRef]
- Pandey, R.; Papes, M. Changes in future potential distributions of apex predator and mesopredator mammals in North America. Reg. Environ. Chang. 2017, 18, 1223–1233. [Google Scholar] [CrossRef]
- Greenspan, E.; Nielsen, C.K.; Cassel, K.W. Potential distribution of coyotes (Canis latrans), Virginia opossums (Didelphis virginiana), striped skunks (Mephitis mephitis), and raccoons (Procyon lotor) in the Chicago Metropolitan Area. Urban Ecosyst. 2018, 21, 983–997. [Google Scholar] [CrossRef]
- Peterson, A.T.; Robins, C.R. Using ecological-niche modeling to predict barred owl invasions with implications for spotted owl conservation. Conserv. Biol. 2003, 17, 1161–1165. [Google Scholar] [CrossRef]
- Schank, C.J.; Cove, M.V.; Kelly, M.J.; Mendoza, E.; O’Farrill, G.; Reyna-Hurtado, R.; Meyer, N.; Jordan, C.A.; González-Maya, J.F.; Lizcano, D.J.; et al. Using a novel model approach to assess the distribution and conservation status of the endangered Baird’s tapir. Divers. Distrib. 2017, 23, 1459–1471. [Google Scholar] [CrossRef]
- Abba, A.M.; Tognelli, M.F.; Seitz, V.P.; Bender, J.B.; Vizcaíno, S.F. Distribution of extant xenarthrans (Mammalia: Xenarthra) in Argentina using species distribution models. Mammalia 2012, 76, 123–136. [Google Scholar] [CrossRef]
- Pietrek, A.G.; González-Roglich, M. Post-establishment changes in habitat selection by an invasive species: Beavers in the Patagonian steppe. Biol. Invasions 2015, 17, 3225–3235. [Google Scholar] [CrossRef]
- Perez-Barberia, F.J.; Hooper, R.J.; Gordon, I.J. Long-term density-dependent changes in habitat selection in red deer (Cervus elaphus). Oecologia 2013, 173, 837–847. [Google Scholar] [CrossRef]
- Robson, A.S.; van Aarde, R.J. Changes in elephant conservation management promote density-dependent habitat selection in the Kruger National Park. Anim. Conserv. 2018, 21, 302–312. [Google Scholar] [CrossRef] [Green Version]
- Pearson, R.G.; Dawson, T.P.; Berry, P.A. SPECIES: A spatial evaluation of climate impact on the envelope on a species. Ecol. Model. 2002, 154, 289–300. [Google Scholar] [CrossRef]
- Phillips, S.J.; Anderson, R.P.; Schapire, R.E. Maximum entropy modeling of species geographic distributions. Ecol. Model. 2006, 190, 231–259. [Google Scholar] [CrossRef] [Green Version]
- Mackey, B.G.; Lindenmayer, D.B. Towards a hierarchical framework for modelling the spatial distribution of animals. J. Biogeogr. 2001, 28, 1147–1166. [Google Scholar] [CrossRef]
- Pearson, R.G.; Dawson, T.P.; Liu, C. Modelling species distributions in Britain: A hierarchical integration of climate and land-cover data. Ecography 2004, 27, 285–298. [Google Scholar] [CrossRef]
- Ferreira, T.; Garcia, A. Native forests within and outside protected areas are key for nine-banded armadillo (Dasypus novemcinctus) occupancy in agricultural landscapes. Agric. Ecosyst. Environ. 2018, 266, 133–141. [Google Scholar]
- Loughry, W.J.; Perez-Heydrich, C.; McDonough, C.M.; Oli, M.K. Population dynamics and range expansion in nine-banded armadillos. PLoS ONE 2013, 8, e68311. [Google Scholar] [CrossRef] [Green Version]
- Changnon, S.A.; Angel, J.R.; Kunkel, K.E.; Lehmann, C.M. Climate Atlas of Illinois; Illinois State Water Survey: Champaign, IL, USA, 2004. [Google Scholar]
- Illinois State Geological Survey. Illinois State Geological Survey Illinois High and Low. Available online: https://www.isgs.illinois.edu/outreach/geology-resources/illinois-high-and-low (accessed on 8 April 2020).
- Illinois State Water Survey. Illinois Climate Normals–Illinois State Climatologist. Available online: https://stateclimatologist.web.illinois.edu/data/climate-data/ (accessed on 15 January 2020).
- Yang, L.; Jin, S.; Danielson, P.; Homer, C.; Gass, L.; Bender, S.M.; Case, A.; Costello, C.; Dewitz, J.; Fry, J.; et al. A new generation of the United States National Land Cover Database: Requirements, research priorities, design, and implementation strategies. ISPRS J. Photogramm. Remote Sens. 2018, 146, 108–123. [Google Scholar] [CrossRef]
- United States Census Bureau QuickFacts. Available online: https://www.census.gov/programs-surveys/sis/resources/data-tools/quickfacts.html (accessed on 8 April 2020).
- Homer, C.; Dewitz, J.; Jin, S.; Xian, G.; Costello, C.; Danielson, P.; Gass, L.; Funk, M.; Wickham, J.; Stehman, S.; et al. Conterminous United States land cover change patterns 2001–2016 from the 2016 National Land Cover Database. ISPRS J. Photogramm. Remote Sens. 2020, 162, 184–199. [Google Scholar] [CrossRef]
- Kennedy, C.M.; Oakleaf, J.R.; Theobald, D.M.; Baruch-Mordo, S.; Kiesecker, J. Managing the middle: A shift in conservation priorities based on the global human modification gradient. Glob. Chang. Biol. 2019, 25, 1–16. [Google Scholar] [CrossRef]
- United States Geological Survey. Core Science Analytics, Synthesis, and Library-GAP Analysis Project. Available online: https://www.usgs.gov/core-science-systems/science-analytics-and-synthesis/gap/data-tools (accessed on 21 August 2020).
- United States Department of Agriculture National Resources Conservation Service USDA NRCS Geospatial Data Gateway. Available online: https://datagateway.nrcs.usda.gov/ (accessed on 21 August 2020).
- Baldwin, R.A. Use of maximum entropy modeling in wildlife research. Entropy 2009, 11, 854–866. [Google Scholar] [CrossRef]
- Pearson, R.G.; Raxworthy, C.J.; Nakamura, M.; Townsend Peterson, A. Predicting species distributions from small numbers of occurrence records: A test case using cryptic geckos in Madagascar. J. Biogeogr. 2007, 34, 102–117. [Google Scholar] [CrossRef]
- Brown, J.L.; Bennett, J.R.; French, C.M. SDMtoolbox 2.0: The next generation Python-based GIS toolkit for landscape genetic, biogeographic and species distribution model analyses. PeerJ 2017, 5, e4095. [Google Scholar] [CrossRef] [PubMed] [Green Version]
- Radosavljevic, A.; Anderson, R.P. Making better Maxent models of species distributions: Complexity, overfitting and evaluation. J. Biogeogr. 2013, 41, 629–643. [Google Scholar] [CrossRef]
- Anderson, R.P.; Gonzalez, I. Species-specific tuning increases robustness to sampling bias in models of species distributions: An implementation with Maxent. Ecol. Model. 2011, 222, 2796–2811. [Google Scholar] [CrossRef]
- Brown, J.L. SDMtoolbox: A python-based GIS toolkit for landscape genetic, biogeographic and species distribution model analyses. Methods Ecol. Evol. 2014, 5, 694–700. [Google Scholar] [CrossRef]
- Peterson, A.T.; Soberón, J.; Pearson, R.G.; Anderson, R.P.; Martínez-Meyer, E.; Nakamura, M.; Araújo, M.B. Ecological Niches and Geographic Distributions; Princeton University Press: Princeton, NJ, USA, 2011. [Google Scholar]
- Swets, J.A. Measuring the accuracy of diagnostic systems. Science 1988, 240, 1285–1293. [Google Scholar] [CrossRef] [Green Version]
- Shcheglovitova, M.; Anderson, R.P. Estimating optimal complexity for ecological niche models: A jackknife approach for species with small sample sizes. Ecol. Model. 2013, 269, 9–17. [Google Scholar] [CrossRef]
- McDonough, C.M.; Loughry, W.J. Patterns of mortality in a population of nine-banded armadillos, Dasypus novemcinctus. Am. Midl. Nat. 1997, 138, 299–305. [Google Scholar] [CrossRef]
- Talmage, R.; Buchanan, G. The Armadillo (Dasypus novemcinctus). Rice Inst. Pam. 1954, 41, 1–135. [Google Scholar]
- Tomasek, B.J.; Williams, M.M.; Davis, A.S. Changes in field workability and drought risk from projected climate change drive spatially variable risks in Illinois cropping systems. PLoS ONE 2017, 12, e0172301. [Google Scholar] [CrossRef] [PubMed] [Green Version]
- Crane, A.L.; McGrane, C.E.; Mathis, A. Behavioral and physiological responses of Ozark zigzag salamanders to stimuli from an invasive predator: The armadillo. Int. J. Ecol. 2012, 2012, 1–7. [Google Scholar] [CrossRef]
- Mullin, S.J.; Klueh, S. Demographics of a geographically isolated population of a threatened salamander (Caudata: Ambystomatidae) in central Illinois. Herpetol. Conserv. Biol. 2009, 4, 261–269. [Google Scholar]
Figure 1.
Comparison of land cover types within 8.7 ha buffer of live versus roadkill presence locations for nine-banded armadillos in southern Illinois during 2016–2020. Locations of live animals were surrounded by a higher percentage of forest cover, while roadkill had a higher percentage of development.

Figure 2.
Potential distribution of nine-banded armadillos in southern Illinois during 2016–2020. Map shows probability of presence from low (0.0) to high (1.0) and armadillo presence locations used to develop the model. Probability of presence was higher in contiguous patches of forested land and around roads and waterways.

Figure 3.
Jackknife test of variable importance for the spatial distribution model of nine-banded armadillos in southern Illinois during 2016–2020. The variable with the highest gain when in isolation and the lowest decrease in gain when omitted was land cover.
Figure 3.
Jackknife test of variable importance for the spatial distribution model of nine-banded armadillos in southern Illinois during 2016–2020. The variable with the highest gain when in isolation and the lowest decrease in gain when omitted was land cover.

Figure 4.
Response curve for land cover type as an environmental predictor for presence of nine-banded armadillo in southern Illinois during 2016–2020. Land cover groups are represented as follows: open water (11), open space development (21), low development (22), medium development (23), high development (24), barren land (31), deciduous forest (41), evergreen forest (42), mixed forest (43), herbaceous (71), hay/pasture (81), cultivated crops (82), woody wetlands (90), and emergent herbaceous wetlands (95). Probability of armadillo presence was highest in open space to medium development, and lowest in agricultural cover.

Figure 5.
Marginal response curve (a) and response curve using only the corresponding variable (b) for distance to forest edge as an environmental predictor for presence of nine-banded armadillos in southern Illinois during 2016–2020. Numbers on x axis represent distance from forest edge. Distance from exterior: >4000 m (0), 4000 m (1), 1000 m (3), 500 m (4), 250 m (5), 120 m (6), 60 m (7), 30 m (8). Interior distance from forest edge: 30 m (9), 60 m (10), 120 m (11), 250 m (12), 500 m (13), 1000 m (14). Probability of armadillo presence was higher when closer to forest edge.

Figure 6.
Marginal response curve (a) and response curve using only the corresponding variable (b) for distance to water as an environmental predictor for presence of nine-banded armadillos in southern Illinois during 2016–2020. Probability of armadillo presence was higher when closer to water.
Figure 6.
Marginal response curve (a) and response curve using only the corresponding variable (b) for distance to water as an environmental predictor for presence of nine-banded armadillos in southern Illinois during 2016–2020. Probability of armadillo presence was higher when closer to water.

Figure 7.
Marginal response curve for mean annual precipitation (mm) as an environmental predictor for presence of nine-banded armadillos in southern Illinois during 2016–2020. Probability of armadillo presence increased with precipitation.
Figure 7.
Marginal response curve for mean annual precipitation (mm) as an environmental predictor for presence of nine-banded armadillos in southern Illinois during 2016–2020. Probability of armadillo presence increased with precipitation.


Table 1.
Climatic factors downloaded from WorldClim (www.worldclim.org/, accessed on 8 April 2020) and used to model potential distribution of nine-banded armadillos in southern Illinois during 2016–2020. Bioclimatic variables represented annual trends, seasonality, and extreme or limiting environmental factors.
| Climatic Factor Code | Title | Description |
|---|---|---|
| BIO 02 | Mean Diurnal Range | Mean of the monthly difference between maximum and minimum temperatures |
| BIO 08 | Mean Temperature of the Wettest Quarter | Mean temperature of the three-month period receiving the greatest amount of precipitation |
| BIO 12 | Annual Precipitation | Total precipitation in a year |
| BIO 18 | Precipitation of the Warmest Quarter | Total precipitation during the three-month period with the highest temperatures |
Publisher’s Note: MDPI stays neutral with regard to jurisdictional claims in published maps and institutional affiliations. |
© 2021 by the authors. Licensee MDPI, Basel, Switzerland. This article is an open access article distributed under the terms and conditions of the Creative Commons Attribution (CC BY) license (https://creativecommons.org/licenses/by/4.0/).
Share and Cite
MDPI and ACS Style
Haywood, C.J.; Nielsen, C.K.; Jiménez, F.A. Potential Distribution of Colonizing Nine-Banded Armadillos at Their Northern Range Edge. Diversity 2021, 13, 266. https://0-doi-org.brum.beds.ac.uk/10.3390/d13060266
AMA Style
Haywood CJ, Nielsen CK, Jiménez FA. Potential Distribution of Colonizing Nine-Banded Armadillos at Their Northern Range Edge. Diversity. 2021; 13(6):266. https://0-doi-org.brum.beds.ac.uk/10.3390/d13060266
Chicago/Turabian StyleHaywood, Carly J., Clayton K. Nielsen, and F. Agustín Jiménez. 2021. "Potential Distribution of Colonizing Nine-Banded Armadillos at Their Northern Range Edge" Diversity 13, no. 6: 266. https://0-doi-org.brum.beds.ac.uk/10.3390/d13060266
Note that from the first issue of 2016, this journal uses article numbers instead of page numbers. See further details here.