Article

Roadside Car Surveys: Methodological Constraints and Solutions for Estimating Parrot Abundances across the World

1
Department of Conservation Biology and Integrative Biology, Doñana Biological Station CSIC, 41092 Sevilla, Spain
2
Department of Physical, Chemical and Natural Processes, Universidad Pablo de Olavide, 41013 Sevilla, Spain
3
Department of Ecology, Biosciences Institute, University of São Paulo, 05508-220 São Paulo, Brazil
4
Department of Migration, Max Planck Institute of Animal Behavior, D-78315 Radolfzell, Germany
5
Biodiversity Research Institute (CSIC, UO, PA), Oviedo University, 33600 Mieres, Spain
6
Department of Evolutionary Ecology, Museo Nacional de Ciencias Naturales CSIC, 28006 Madrid, Spain
7
CLB Foundation, Santa Cruz de la Sierra 5030, Bolivia
8
Zoológico Municipal de Fauna Sudamericana, Santa Cruz de la Sierra 1026, Bolivia
9
Laboratorio de Biología y Genética, Universidad Nacional de San Cristóbal de Huamanga, Ayacucho 05001, Peru
10
Department of Health Sciences, Faculty of Biomedical and Health Sciences, Universidad Europea de Madrid, 28670 Madrid, Spain
11
Department of Applied Biology, Universidad Miguel Hernández, Elche, 03202 Alicante, Spain
*
Author to whom correspondence should be addressed.
Submission received: 10 May 2021 / Revised: 25 June 2021 / Accepted: 29 June 2021 / Published: 1 July 2021

Abstract

:
Parrots stand out among birds because of their poor conservation status and the lack of available information on their population sizes and trends. Estimating parrot abundance is complicated by the high mobility, gregariousness, patchy distributions, and rarity of many species. Roadside car surveys can be useful to cover large areas and increase the probability of detecting spatially aggregated species or those occurring at very low densities. However, such surveys may be biased due to their inability to handle differences in detectability among species and habitats. We conducted 98 roadside surveys, covering > 57,000 km across 20 countries and the main world biomes, recording ca. 120,000 parrots from 137 species. We found that larger and more gregarious species are more easily visually detected and at greater distances, with variations among biomes. However, raw estimates of relative parrot abundances (individuals/km) were strongly correlated (r = 0.86–0.93) with parrot densities (individuals/km2) estimated through distance sampling (DS) models, showing that variability in abundances among species (>40 orders of magnitude) overcomes any potential detectability bias. While both methods provide similar results, DS cannot be used to study parrot communities or monitor the population trends of all parrot species as it requires a minimum of encounters that are not reached for most species (64% in our case), mainly the rarest and more threatened. However, DS may be the most suitable choice for some species-specific studies of common species. We summarize the strengths and weaknesses of both methods to guide researchers in choosing the best–fitting option for their particular research hypotheses, characteristics of the species studied, and logistical constraints.

Graphical Abstract

1. Introduction

Parrots (Order Psittaciformes) stand out among birds because of their poor conservation status [1,2] and the lack of knowledge on their population sizes and trends. According to the most recent IUCN evaluation, almost 30% of the 402 extant parrot species are threatened with extinction, while accurate information on their population numbers and changes in abundances is lacking for most species [3]. The paucity of information on population sizes, densities, and changes in the abundance of parrots across the world was highlighted six years ago [4], calling for further development and application of monitoring methods to better understand how parrot populations are responding to the variety of threats they face [1]. In fact, a recent review relating conservation threats to population trends in the Neotropics, the realm with the highest richness of parrot species [1], revealed the scarcity of data on actual abundances and population trends [5]. The situation is similar for the other realms, even for the Afrotropics [6] where parrot species richness is the lowest [1].
Estimating parrot abundance is challenging because many species naturally occur at very low densities [4], while others have heavily patched distributions or very restricted ranges [3]. Moreover, widespread threats such as habitat loss, illegal trade, and persecution [7,8,9] may be drastically reducing parrot population sizes and ranges, making the design of monitoring programs even more difficult. Moreover, some parrot species are highly gregarious and aggregate in large communal roots, and thus estimates of overall population size can be obtained when all roosts are located and can be properly surveyed [10]. However, this is not feasible for most parrots species, as roost sites may often change [11], they can not be located in large, inaccessible areas, or simply because not all species gather in large communal roosts. Then, researchers are forced to use alternative methodologies such as point counts and line transects, traditionally used for many avian taxa, to obtain estimates of relative abundances and densities [10]. A recent review has compiled different sampling and analytical methods for estimating parrot abundances [10]. Although the efficiency of walk line transects and point counts to estimate parrot abundances may differ among studies [11,12,13], both methods are constrained by the small geographic scale at which they can be done. Therefore, they may not be logistically affordable for surveying parrot species that are patchily distributed and with very low densities, as a very large number of sampling sites (e.g., up to 2000) are required for surveying uncommon species [12]. Conversely, roadside car surveys allow the coverage of very large areas, thus accounting for the large home ranges and mobility of many common parrot species and increasing the probability of detecting individuals of species occurring at very low densities and/or those that are spatially aggregated [10].
Roadside car surveys have been largely used to survey conspicuous species (mostly raptors, e.g., [14,15,16]), providing an easy-to-obtain measure of relative abundance (number of individuals recorded/km surveyed). Recently, roadside car surveys have also been used to relate the relative abundances of parrot species to habitat changes [17,18], the role of parrots as seed dispersers [19,20] or their roles in other ecological functions [21], or to assess how parrots are selectively poached for their use as pets [22]. Their gregariousness and especially their loud vocalization behavior [10] makes this method even more appropriate for parrots because vocalizations facilitate their detection compared to other taxa such as raptors, which are mostly only visually detected and thus more difficult to record when perched hidden by the vegetation. The easier aural than visual detection of parrots was revealed by Lee & Marsden [23], showing that only 4% out of 2,681 parrot detections obtained through walk line transects were of silent, seen-only groups. However, as for point counts [24] and walk line transects [23], several parrot encounters correspond to aural-only detections, and thus the number of unobserved individuals cannot be recorded for estimating abundances [22,23,24]. A proposed solution for this problem, both for point counts, walking and car transects, is to substitute missing count data (i.e., aural-only encounters) with the average flock size obtained for the species during the survey [22,23,24]. However, there is no evaluation of how this methodological approach may affect the estimates of abundance. Another obvious problem for all three methods is that the probability of detection decreases with the distance of encountered birds from the observer and that this distance-dependent probability of detection may vary among species and habitats [10]. This problem is easily solved through distance sampling (DS) modeling, currently implemented in accessible statistical packages, which allows the calculation of probabilities of detection to estimate densities (individuals/km2) of the studied species [10]. However, this much more desirable approximation comes with the caveat that robust DS modeling requires a minimum of visual encounters [10], from which distance measurements can be taken to inform models, which in some cases could reach 40–50 contacts [13]. Unfortunately, this analytical constraint makes it impossible to estimate the abundances for rare parrot species occurring at very low densities [20,25] or those relatively abundant but highly gregarious species recorded in high numbers of individuals in a few very large flocks [26], with numbers of encounters that are insufficient for DS modeling. Nonetheless, recent work showed a strong correlation between distance-uncorrected relative parrot abundances obtained through roadside car surveys and distance-corrected densities for a sample of species with enough visual encounters needed for DS modeling [22] (see also unpublished results offered by [10]). These results support the idea that distance-uncorrected relative abundances of parrots obtained through roadside car surveys are good proxies of their actual abundances, especially when the high variability in abundance among species overcomes the main sources of sampling error, i.e., differences in detectability [22]. Nonetheless, further research embracing different parrot communities and biomes is needed before generalizing these conclusions.
Here, we take advantage of an unprecedented data set that compiles our roadside car surveys conducted over 10 years, covering 20 countries and all continents and biomes inhabited by parrots across the world. We first assessed sources of variability related to the percentage of aural-only encounters and the distance at which parrots were detected. We hypothesized that parrot detectability in roadside surveys is a function of species size and gregariousness, and the openness of the surveyed habitat. We predicted that larger and more gregarious species should be more easily detected visually and at greater distances, and that detection should also vary among biomes since they range from very open (e.g., Deserts and Xeric Scrublands) to highly concealing forested habitats (e.g., Tropical and Subtropical Broadleaf Moist Forests). We then correlated distance-uncorrected relative densities (individuals/km) with density estimates (individuals/km2) obtained through DS modeling, using different thresholds for a minimum of visual contacts. We evaluated how adding an estimation of the number of only heard (unseen) individuals [22,23,24] affects these correlations. We found a strong correlation between these estimates of parrot abundances and discuss the pros and cons of both methods, including the loss of whole surveys and the traits of species that are excluded when using DS and not reaching the minimum numbers of visual encounters needed for statistical modeling. We aim to guide researchers in choosing the best-suited methodology given their research objectives and study species.

2. Materials and Methods

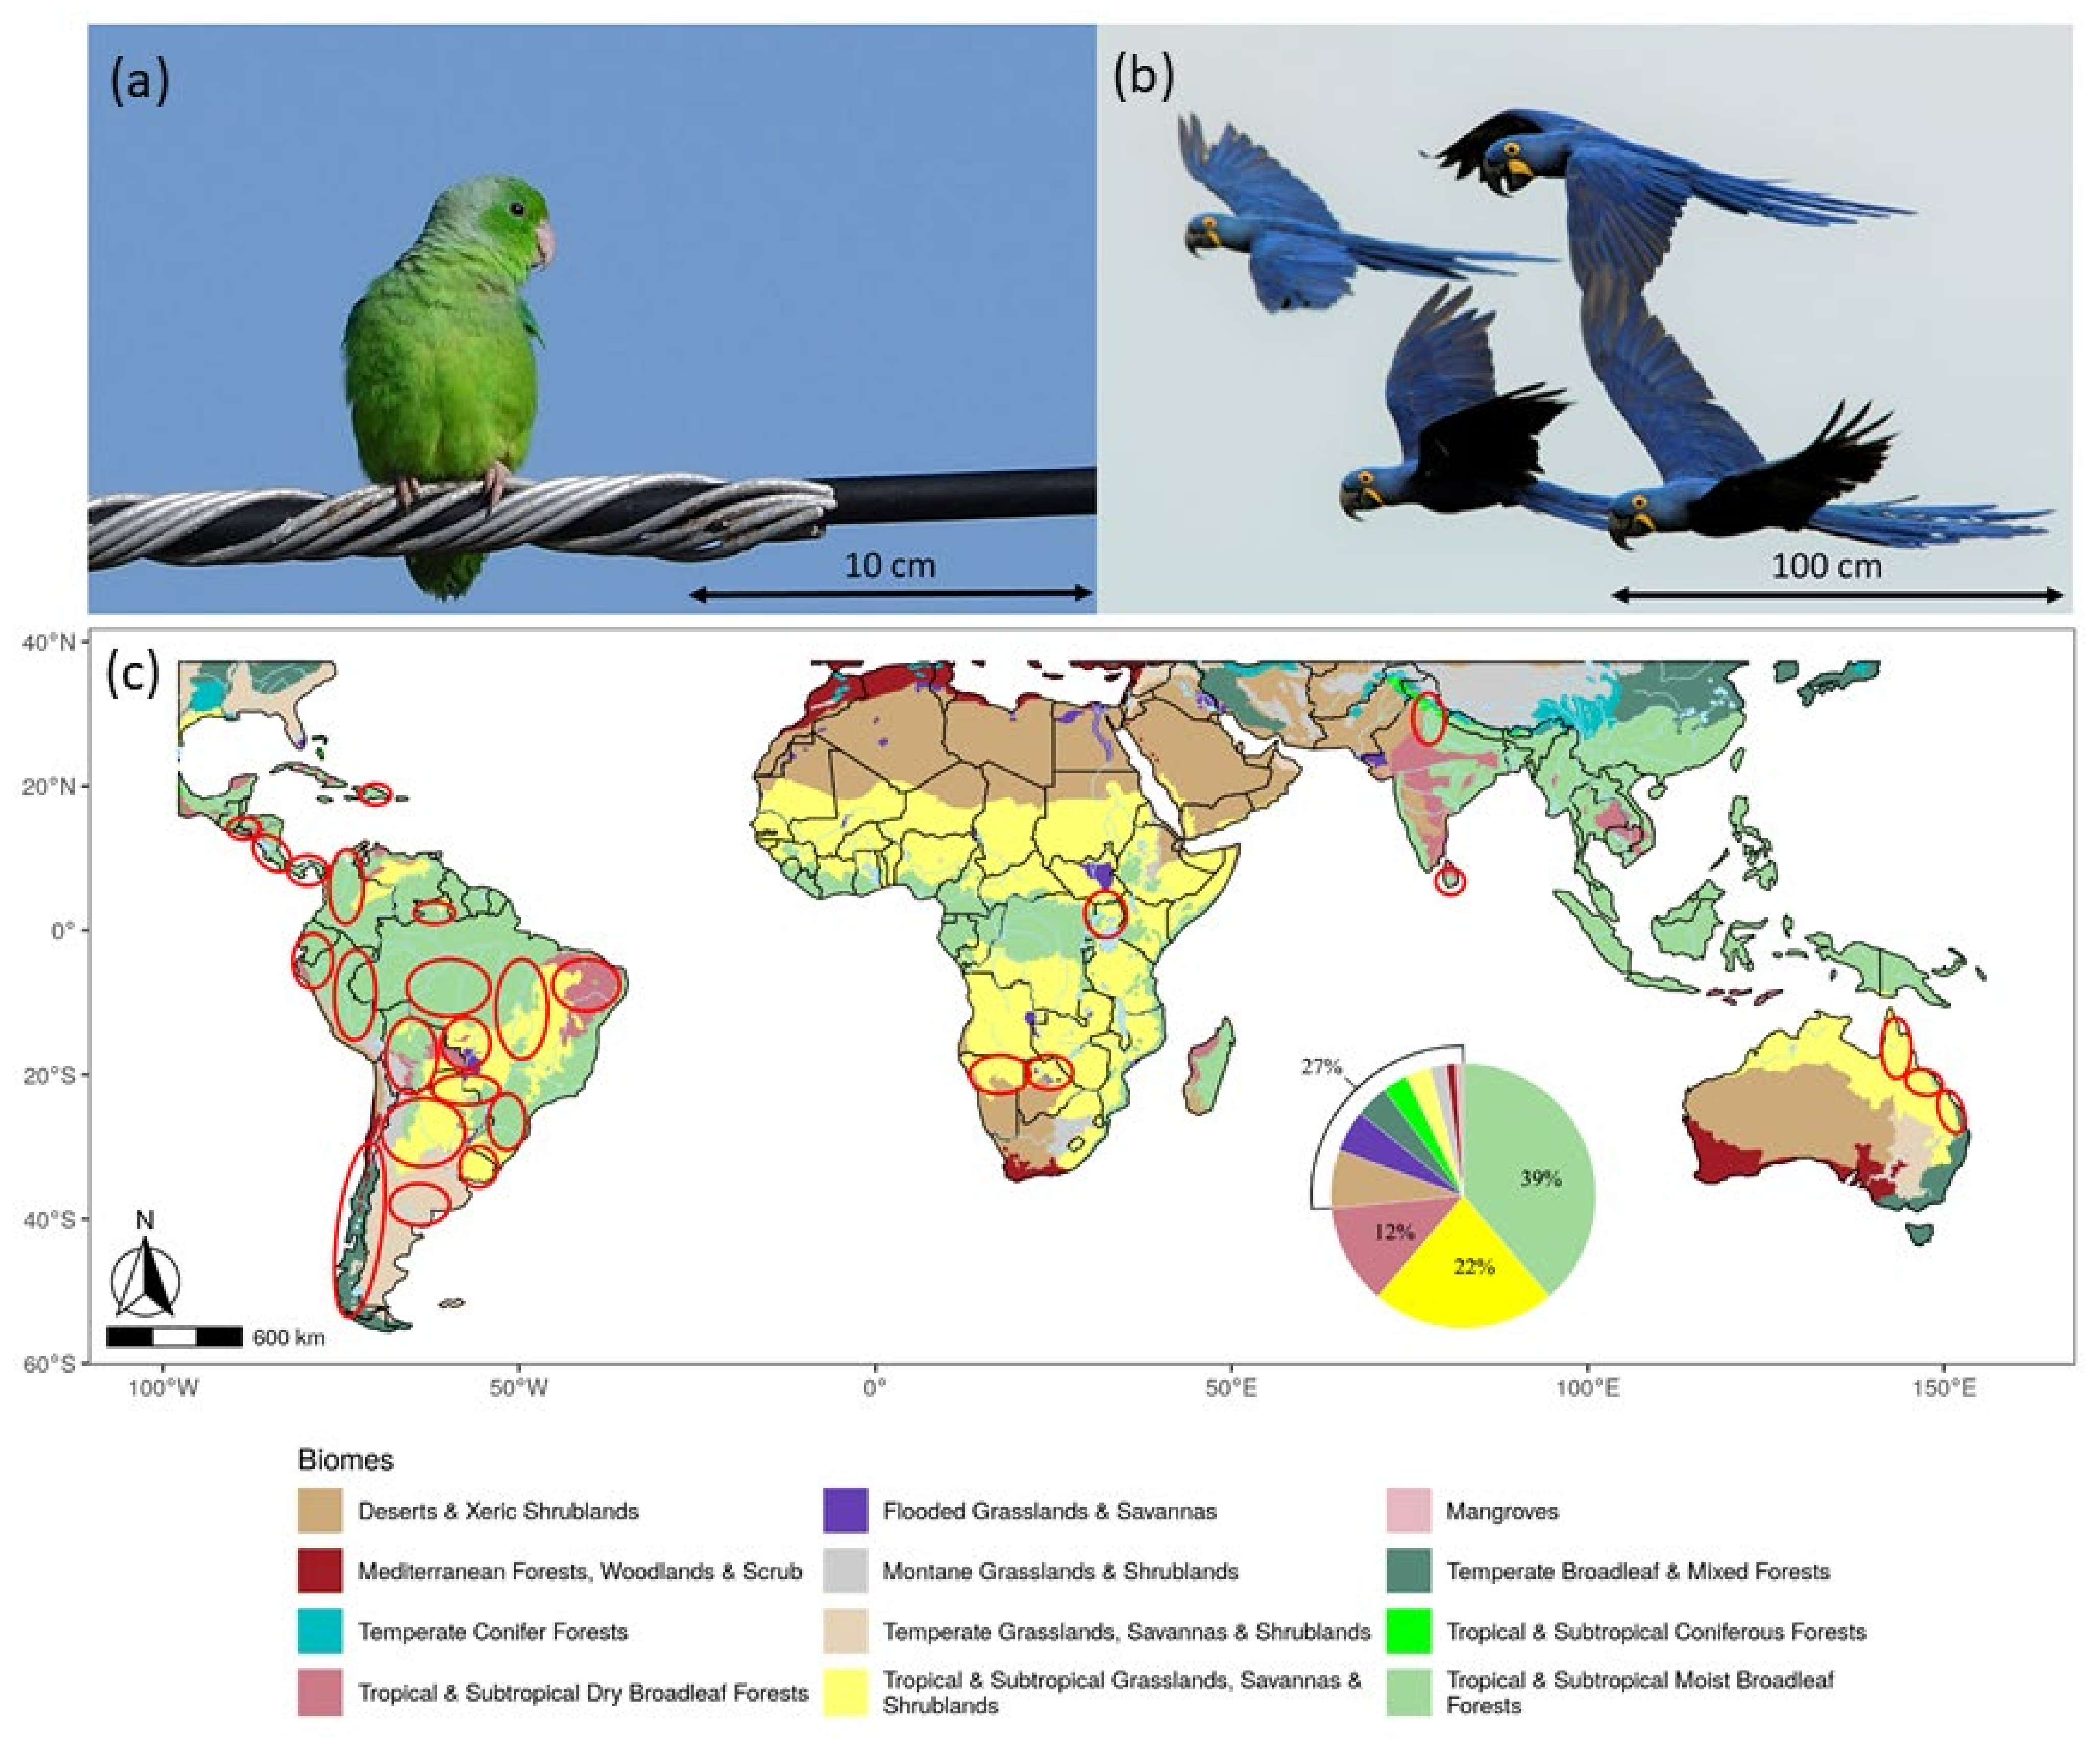
2.1. Study Areas and Field Work

We selected several countries from the main five parrot-inhabited realms (Neotropic, Afrotropic, Indomalayan, and Australasia). These regions represent the richest to the poorest parrot communities worldwide [1]. This work was embedded within different research projects, having all in common our need to estimate the relative abundance of each species within each parrot community. We used these estimates to answer different questions, such as those related to their relative contribution to ecological functions [19,20,21], assessing poaching pressure [22], or the effects of habitat transformations on parrot abundances [17,18]. Therefore, for each country, we designed road itineraries to cover the main biomes and ecoregions occupied by parrots (obtained from https://ecoregions2017.appspot.com/; accessed 15 January 2021) and the distribution of as many parrot species as possible (obtained from [3] and a variety of regional bird field guides). Using satellite maps, we selected unpaved and low-transit paved roads that crossed from pristine to highly humanized habitats (e.g., agricultural and urbanized areas), thus maximizing the chances of finding a variety of parrot species, from those intolerant to habitat transformations to those benefitting from anthropogenic changes (e.g., [17,18,27,28,29]).
Most of the fieldwork was done between 2011 and 2020 (Supplementary S1), through expeditions that typically lasted 3–5 weeks. Some small countries were well surveyed through a single expedition (e.g., Costa Rica), while some of the largest (e.g., Brazil) required many expeditions to cover the greater variety of biomes, ecoregions, and parrot communities. In such cases, results obtained from a single ecoregion/biome/country in different expeditions (usually conducted in different years) were pooled to increase sample sizes (number of km surveyed and number of parrots recorded) and thus better represent the whole parrot community and increase the precision of estimates [12]. Only Australia, Colombia, and India were partially surveyed due to logistical constraints (Supplementary S1). Surveys were conducted in different seasons and across the annual cycles of parrots. However, this should not be problematic for the objectives of this paper, since our analyses compare results of two parrot abundance estimates simultaneously obtained within each ecoregion/biome/country surveyed (see below). Rather, the large geographic and temporal scales of our surveys reinforced and allowed the generalization our results.

2.2. Roadside Surveys

Typically, and similarly to other roadside parrot surveys [17,18,19,20,21,22], the driver and two experienced observers drove a 4 × 4 vehicle at low speed (10–40 km/h) following previously designed itineraries from dawn to dusk, avoiding rainy and hot middays when parrot activity declines [30,31]. All parrots detected were recorded, briefly stopping when needed to identify species and/or count the number of individuals in flocks. Observers were familiar with the parrot species surveyed, as surveys were combined with behavioral and foraging studies across all study areas (see e.g., [32,33,34,35]), so they were able to visually and aurally identify them. Moreover, several authors participated in different surveys, and the first author participated in 91% of all surveys, so each survey included researchers with accumulated experience in identifying parrots. For a subsample of surveys (those conducted since 2018), we also recorded the mode of detection (i.e., whether parrots were first detected aurally, visually, or both) and their behavior at first detection (i.e., resting, feeding, or flying). Following previous recommendations [13] and studies [17,18,19,20,21,22], we considered both perched and flying individuals for estimating parrot abundances (see Discussion for pros and cons of including flying birds), thus also making distance-corrected and uncorrected estimates (see below) comparable. We paid special attention to the flying direction and group size of parrots in flight to avoid double counting of flocks [13].
Distances of detection (i.e., the perpendicular distance from parrots to the road when they were first detected) were recorded to compare two estimates of parrot abundance (see below). Detection distance was estimated visually for short distances or using a laser rangefinder incorporated into binoculars for large distances (Leica Geovid 10 × 42, range: 8–1500 m), measuring the distance to the closest tree for flying flocks. In the case of loose flocks, we measured the distance to the closest individual in the flock. In many instances, parrots were only heard and the species identified through their vocalizations because they were concealed by vegetation. Therefore, we could not record the distance of detection nor the number of individuals. Thus, we classified detections as aural (only heard) or visual (seen or both seen and heard).
Since 2018, all roadside surveys and parrot counts were recorded using the ObsMapp application for smartphones, which uploads the observations to the citizen science platform Observation (www.observation.org; accessed 15 January 2021). Therefore, all records, exact location, and associated information can be viewed and downloaded from this web platform (searching for the observers Pedro Romero-Vidal, Dailos Hernández-Brito, and José Luis Tella) by any researcher in the future.

2.3. Distance Sampling Modeling

Distance sampling (DS) models were fit for each combination of country, ecoregion, and species (henceforth study case). The maximum detection distance was fixed at 500 m for all species. While this value may not be optimal for some species and/or habitat types, it encompasses most of the detections (see Results Section 3.3.2). More importantly, having a single maximum distance allows straightforward comparisons among study cases. We restricted DS modeling to those study cases with at least 10 visual contacts within 500 m of distance. We conservatively used this encounter threshold as it was the minimum required for DS modeling in a previous whole-parrot community study [22], thus allowing us to include as many species and study cases as possible. In fact, a minimum of 10 contacts of the target species was suggested to obtain useful, if imprecise, parrot density estimates [4]. Nonetheless, we also tested how results could change by gradually increasing the threshold up to 50 visual contacts per species (see below). Because the number of individuals in a group can influence detection, we evaluated the potential correlation between group size and detection distance using Spearman correlation tests. We binned distance data for each study case to facilitate the fitting of detection functions, using breaks every 25 (a), 50 (b), and 100 (c) m (i.e., a: 0–25, 25–50,…, 475–500 m; b: 0–50, 50–100,…, 450–500 m; c: 0–100, 100–200,…, 400–500 m). For each binning setup (a, b, and c), we fitted DS models with a half-normal key function as previously recommended after visual inspection of the histograms of distances [36,37], but also using the hazard rate and the uniform key as alternative functions. We compared models with no adjustment terms and with cosine, Hermite polynomial, and simple polynomial adjustments, up to order 5. For models where group size was correlated with detection distances, we also fitted a DS model with group size as a covariate. Akaike’s Information Criterion (AIC) was used to compare models within a distance break set [38], but it cannot be used to compare models fit to data with different binning setups [36]. Thus, we performed chi-square goodness-of-fit tests to compare the best models from each binning setup and identify the best fitting model (highest chi-square test p-value) for each study case. To allow visual inspection of our DS models and chi-square tests, we provide, for each study case, a histogram of detection distances (with Sturges’s breaks), the plot of group size x detection distances (with Spearman correlation test p-value), and the estimated detection functions from the best DS models for each binning setup, overlaid on the histogram of detection distances with the respective distance breaks (Supplementary S3).
Detection probability (P) was obtained from the best model for each study case. Then, abundance (N) was calculated by dividing the number of observed individuals by the estimated P within 500 m maximum distance (or a 1 km-wide strip centered on the road). Density was calculated by dividing N by the length (in km) surveyed for each case, providing an estimate of individuals/km2 (the width surveyed was 1 km). Analyses were done in R using the “Distance” package [39,40].

2.4. Traits of Parrot Species

We obtained two measures of parrot size, body length (in cm) and body mass (in g), from [41]. As a proxy of the gregariousness of a species, we used our own data on flock sizes. For analyses based on study cases, we used the average flock size of the species recorded within each study case. For analyses at the species level, we used the overall average flock size after pooling data when a species was surveyed in more than one study case. Average flock sizes were unrelated to the body length (Spearman correlation, rs = −0.02, p = 0.84) and body mass (rs = −0.09, p = 0.28) of the 131 species visually recorded in our study. However, body length and body mass were strongly correlated (rs = 0.88, p < 0.001), so both variables were alternatively fitted in models accounting for the relationship between detectability and body size (see below). Results were nearly identical but the effect of body mass was always slightly stronger than that of body length, so the later results are not shown for simplicity. The global conservation status of each species was obtained from the 2020 IUCN Red List [3].

2.5. Statistical Analyses

We used Generalized Linear Models (GLM) to assess how the number of parrot encounters and the number of parrot species recorded (negative binomial error distribution, log link function) varied among realms and with the lengths of surveys. Moreover, we evaluated how the percentage of aural encounters, distances of detection, and probabilities of detection (P) (log-transformed; normal error distribution, identity link function) were affected by the body mass and flock size of the species and the biomes they occupied. For the proportion of aural encounters, we restricted analyses to species with at least 15 encounters to reduce error biases in the estimation of proportions [42].
The relationship between relative abundances (individuals observed/km; response variable) and densities of parrots (individuals estimated/km2) obtained through DS modeling was assessed with non-parametric Spearman correlation and linear regressions on raw and log-transformed data, respectively. As the robustness of DS models and thus the precision of their estimated densities may increase with sample sizes (i.e., number of contacts [12]), we performed five regressions by restricting data to cases with at least 10, 20, 30, 40, and 50 visual encounters at distances ≤ 500 m. Following previous recommendations to avoid the underestimation of secretive species [22,23,24], we also estimated relative abundances by summing to the number of observed individuals the estimation of those not observed (number of aural-only contacts × average flock size obtained in each study case), divided by the km surveyed, and repeated the same regression on densities obtained from DS models. Finally, we assessed whether these relationships are influenced by body mass, flock size, biome, and the number of visual encounters through a GLM (response variable: log-transformed relative abundance; normal error distribution, identity link function).
The characteristics of case studies and species (body mass, flock size, relative abundance, conservation status) not available for estimating their densities through DS modeling due to the low number of visual contacts were identified using GLMs (response variable: available/not available; binomial error distribution, logistic link function).
Our data set included species that were surveyed in different case studies (mean = 4.2, median = 2 case studies per species), thus providing replicates that allow for the testing of the relative contribution of species traits and biomes on detectability and abundance estimates through the multivariate models described above. These models would require controlling for species identity to account for pseudoreplication. However, models fitting species identity as random or fixed effects together with species traits confounded their individual effects as species had unique values of body size and almost-unique values of flock size. As our research goal was not to simply assess whether species differ among them but to know what species traits explain these differences, we show models including species traits without controlling for their identity. Models did not show data overdispersion, and the percentage of deviance explained by GLMs and adjusted R2 for linear regressions are provided to show the variability in the data captured by our models. Statistical analyses were performed using SPSS v. 27.

3. Results

3.1. Distribution of Surveys and Species Recorded

We conducted 98 surveys, covering a total of 57,241.44 km across 81 ecoregions, from 11 biomes and 20 countries belonging to the Neotropic (48,612.32 km), Afrotropic (6499.65 km), Indomalayan (1405.72 km), and Australasia (723.75) realms (Figure 1, Supplementary S1).
Surveys averaged 584.1 km in length (range: 35.88–6899.48 km, N = 98), and 75% of them were longer than 150 km (Supplementary S1). The number of parrot encounters varied between 0 and 1263 per survey (mean 162.1 + 199.4 SD, median 98, Supplementary S1), and a GLM revealed it was unrelated to survey length (χ2 = 1.58, p = 0.21) but varied among realms (χ2 = 64.44, p < 0.001), with no significant interaction between survey length and realm (χ2 = 2.07, p = 0.56). The average number of parrot encounters per survey decreased as follows: Neotropic > Indomalayan > Australasia > Afrotropic. The number of parrot species recorded per survey ranged from 0 to 25 (mean 5.87 + 5.27 SD, median 4 species, Supplementary S1). Similarly to the number of encounters, a GLM showed that the number of species recorded was unrelated to survey length (χ2 = 0.36, p = 0.85) and varied among realms (χ2 = 21.71, p < 0.001), with no significant interaction between survey length and realm (χ2 = 0.63, p = 0.89). The average number of species recorded per survey decreased as follows: Australasia > Neotropic > Indomalayan > Afrotropic (Supplementary S1).
As each of the 98 surveys covered different combinations of biomes, ecoregions, and countries (Supplementary S1), and up to 25 species were recorded per survey, we obtained a total of 575 estimates of species-specific parrot abundances (i.e., study cases).

3.2. Traits of the Species Recorded

Overall, we recorded 137 parrot species from 49 genera distributed among the Neotropic (110 spp), Afrotropic (6 spp), Indomalayan (6 spp), and Australasia (16 spp) realms (Supplementary S2). Species ranged in size from the smallest parrotlets (Forpus passerinus, body length 12.5 cm, body mass 23 g) to the largest macaws (Anodorhynchus hyacinthinus, body length 95 cm, body mass 1565 g; Figure 1). Species also greatly varied in gregariousness, as reflected by their average flock size that ranged from 1 to 106.4 individuals (mean = 8.37 ± 12.35 SD, median = 5). Regarding their conservation status, most of the species recorded were classified as Least Concern (66.4%), while 10.9% were Near Threatened, 12.4% Vulnerable, 7.3% Endangered, and 2.9% Critically Endangered according to the IUCN Red List. As we recorded from the rarest to the commonest species (Supplementary S2), the number of encounters per species ranged from 1 to 2127 (mean = 109.9 ± 278.9 SD, median = 14, N = 15,072).

3.3. Sources of Variation in the Detectability of Species

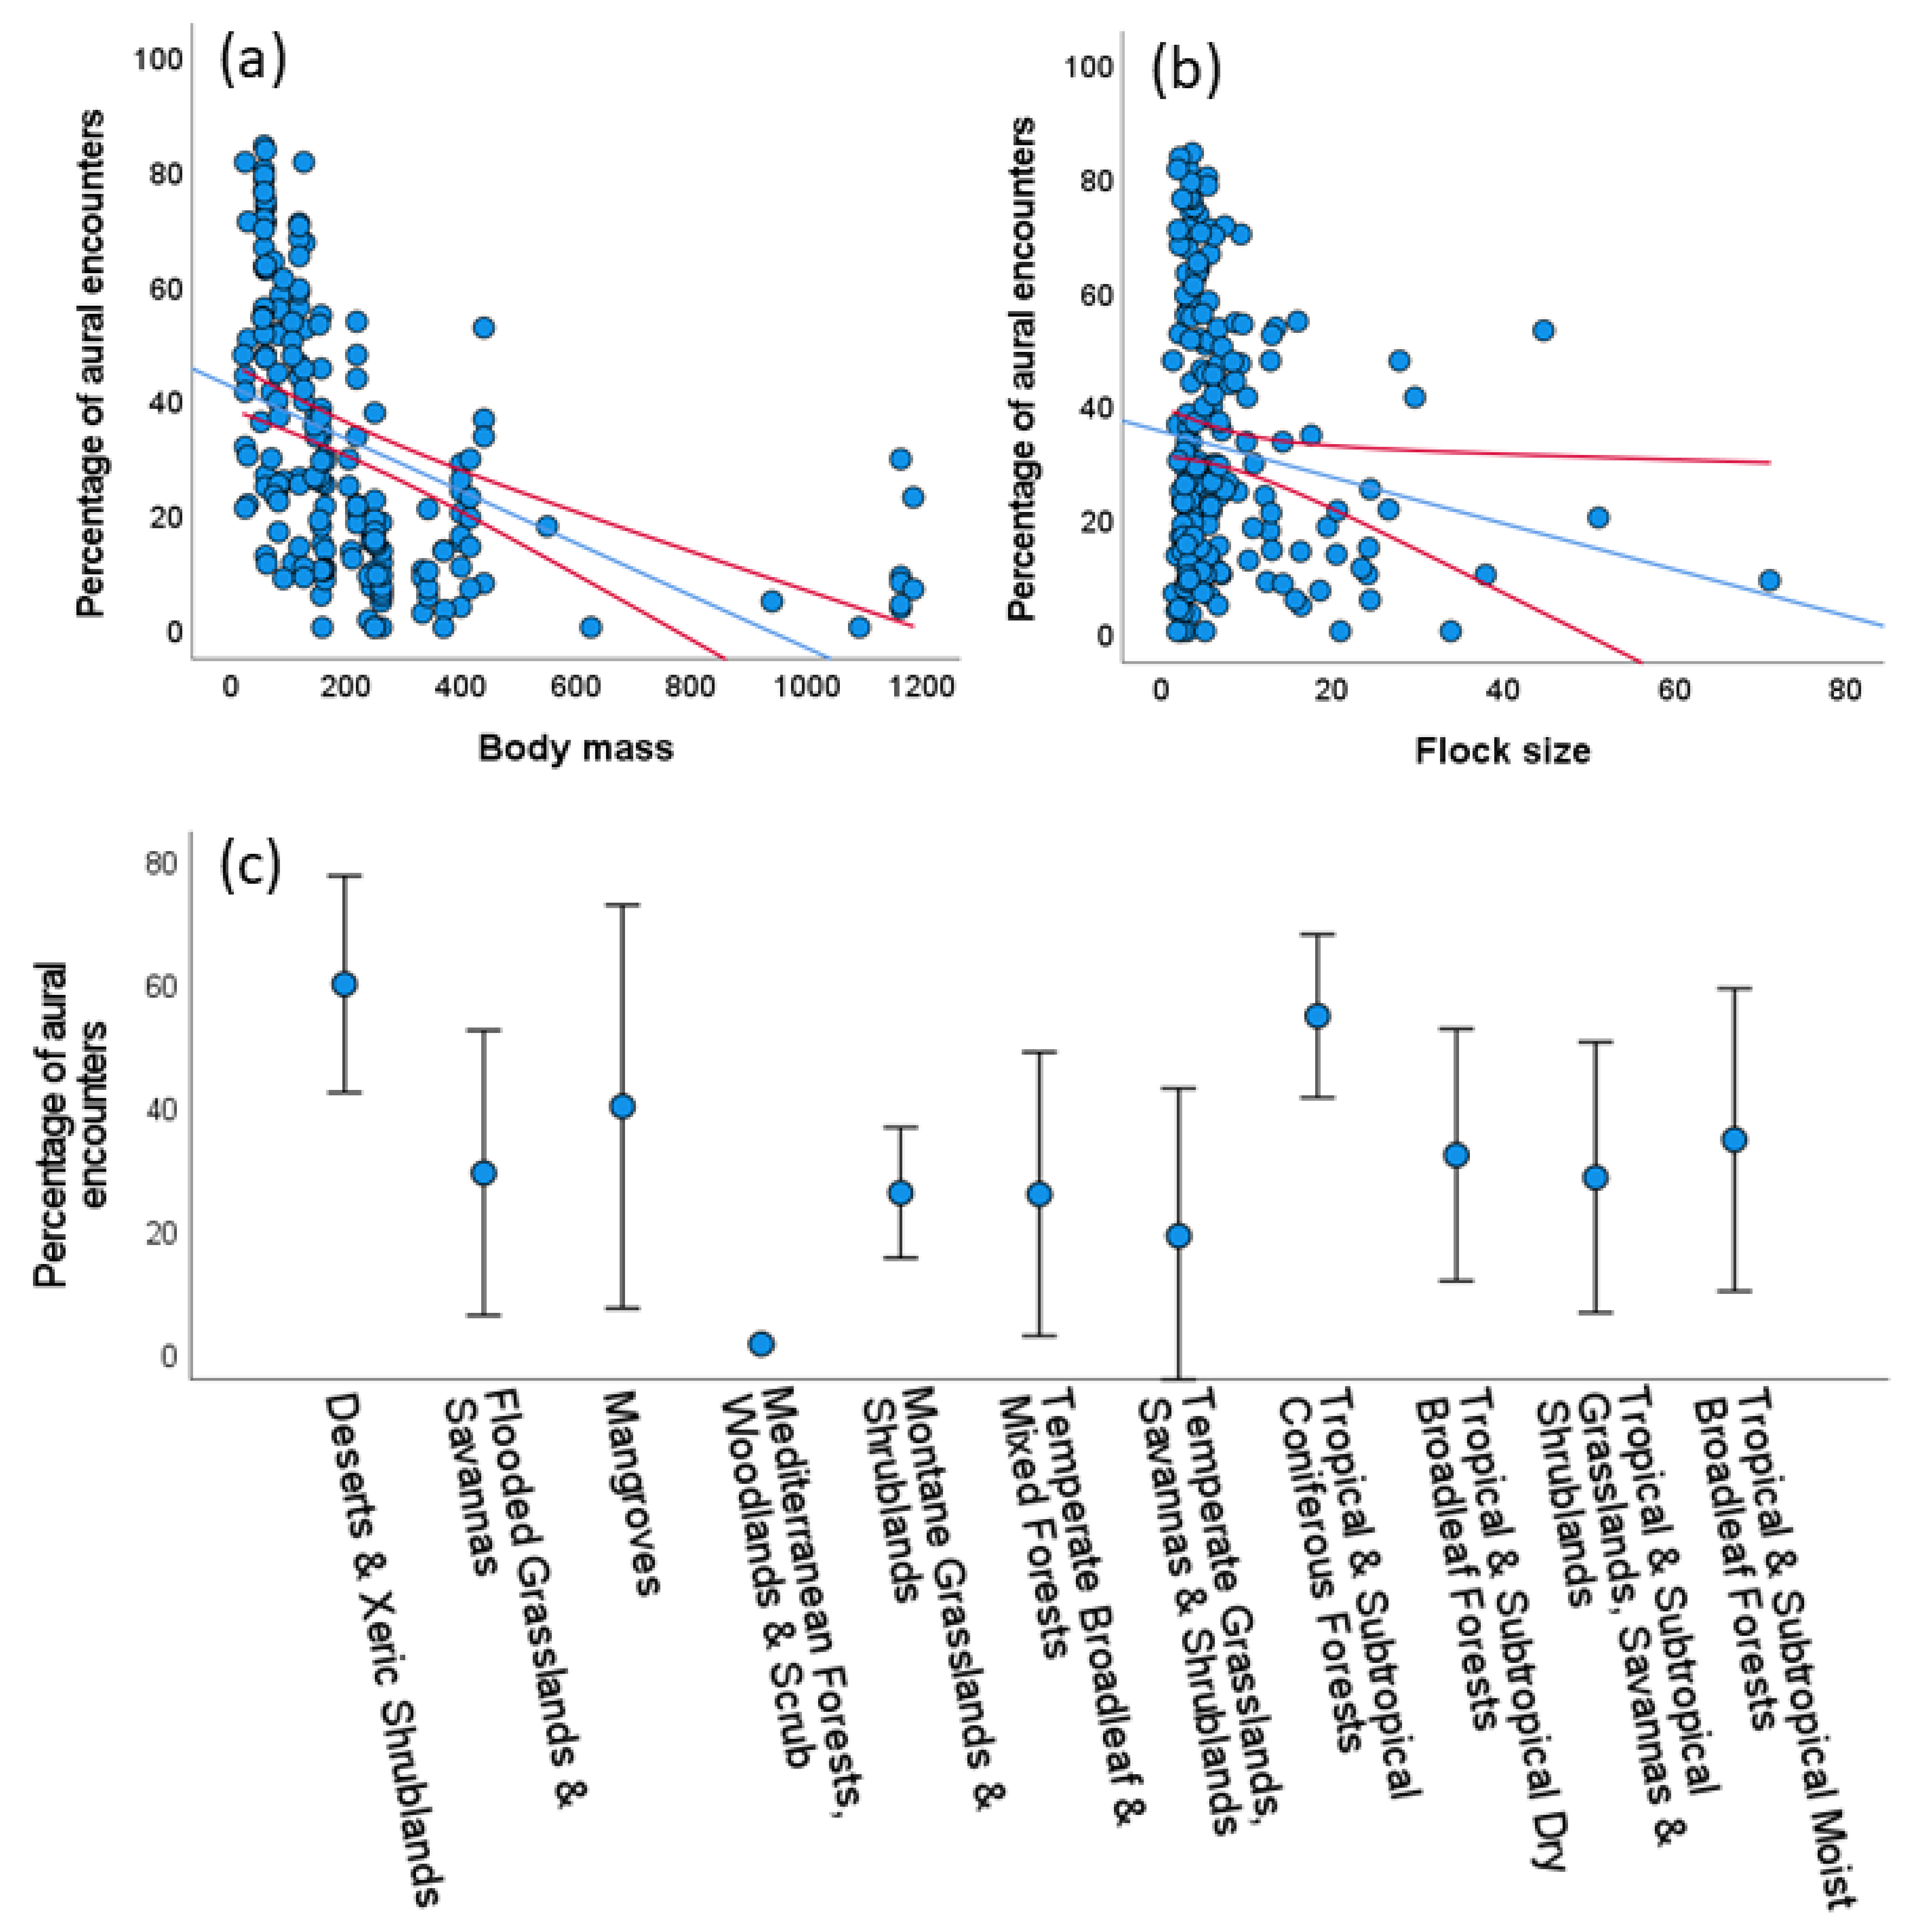
3.3.1. Aural and Visual Encounter Rates

Considering the smaller data set of parrot encounters in which we recorded the mode of detection (N = 9617 encounters), 15.6% were detected visually, 46% were detected aurally, and 38.4% were simultaneously seen and heard. Parrot detections summing those exclusively heard plus those heard and seen accounted for 84.4% of the encounters.
Using the whole data set, we recorded a total of 15,072 parrot encounters of which 5325 (35.33%) were only aural, thus allowing records of 119,797 observed individuals and an unknown number of unseen individuals identified to the species level through their vocalizations. The proportion of aural encounters differed among species, ranging from 0% to 100% (mean = 23.9%, median = 16.5%; 6 species were only aurally registered, see Supplementary S2). Considering those study cases with at least 15 encounters (N = 191), a GLM showed that the proportion of aural encounters decreased with body mass (χ2 = 69.04, p < 0.001, Figure 2a) and to a lesser extent with average flock size (χ2 = 6.09, p < 0.014, Figure 2b) of the species, meaning that the larger and more gregarious species were more easily recorded visually, with no statistically significant variation among biomes (χ2 = 17.58, p = 0.063, Figure 2c). This model explained 34.48% of the deviance.
As proposed in previous works, a method to avoid underestimating the number of parrots due to aural-only encounters is to multiply them by the average flock size recorded within each species-specific study case and summing this estimate of unseen (but heard) individuals to the number of visually recorded individuals, thus obtaining a more reliable estimate per species. By applying this factor of correction to our whole data set (575 study cases), the total number of parrots recorded increased by 22.6% (i.e., from 119,797 observed individuals to 154,759 estimated individuals). Importantly, this increment largely varied among species, ranging from 0 to 73.8% (mean = 20.4 + 19.8 SD, median = 14.3, N = 131 species; the increment could be not calculated for the six species that were only aurally encountered).

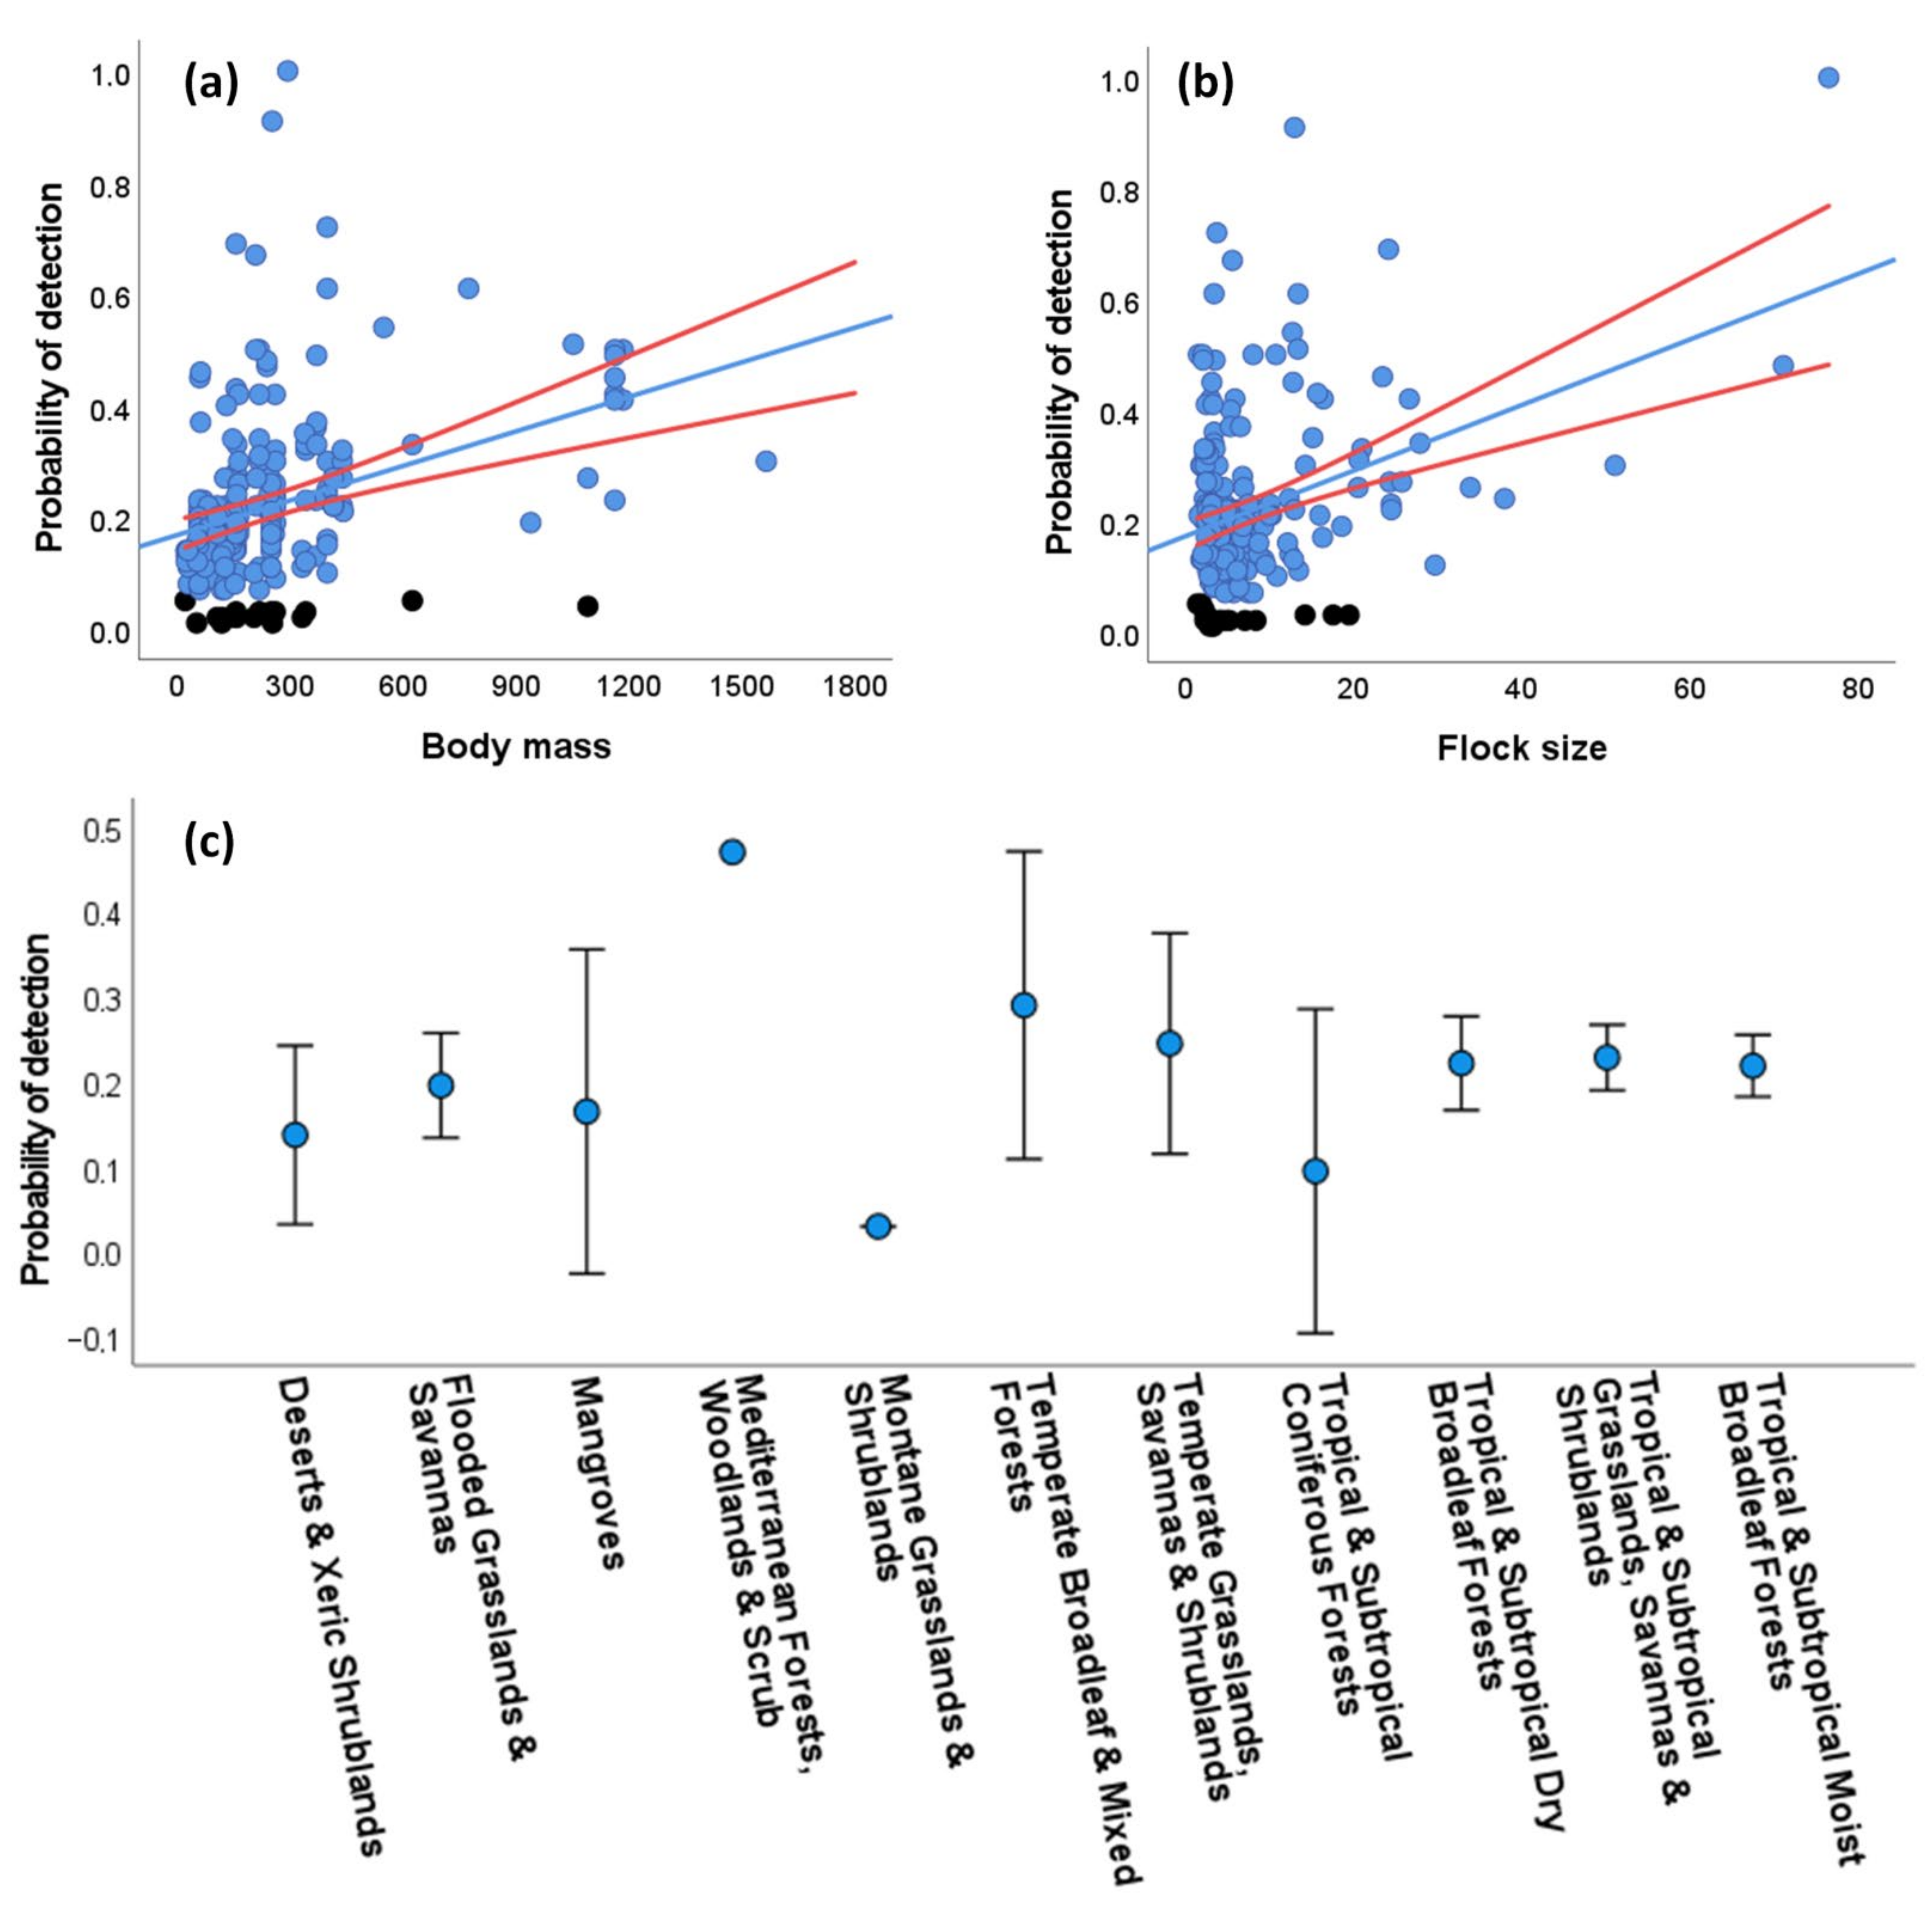
3.3.2. Distance-Dependent Detectability

The distance at which parrots were detected was influenced by several factors. When analyzing the smaller data set in which both the type of detection and behavior of birds were recorded, a GLM showed that distances (range 4–1400 m, mean = 89.8 ± 102.7 SD, median = 60.0, N = 4,783) were lower for aural than for visual detections (χ2 = 82.83, p < 0.001) and for perching than for flying birds (χ2 = 349.68, p < 0.0001), while they were larger for larger flocks (χ2 = 37.39, p < 0.001) and species with larger body mass (χ2 = 449.75, p < 0.0001), with significant variations among biomes (χ2 = 125.42, p < 0.0001) (deviance explained by the model: 22.24%). These and probably other unmeasured sources of variation suggest the need for modeling distance-dependent probabilities of detection for unbiased estimation of parrot abundances.
Using the whole data set, we could calculate distance-dependent probabilities of detection (P) through DS modeling for 208 study cases with at least 10 visual encounters within 500 m of the transect line per species. Distances ranged between 0 and 1498 m (mean = 76.1 ± 95.8 SD, median = 50, N = 8491), while 99.3% of the distances were ≤500 m. The half-normal key function was the detection function best fitting the data in most of the study cases (51.4%), followed by the hazard rate (42.8%) and the uniform (5.8%) functions. The best-fitted models included different cosine adjustments in 24 (11.5%) of the cases, and only in 10 cases (4.8%) included group size as a covariate. The resulting P ranged from 0.01 to 1 (mean: 0.22 ± 0.15 SD, median = 0.19). It is worth noting that the extremely low values of P (ranging from 0.01 to 0.05, in 18 study cases obtained through the hazard rate and in one case obtained through the half-normal functions) may be attributable to cases where parrots were attracted by feeding/nesting resources available close to the roads, thus violating a key assumption of DS modeling and making these values questionable (see Discussion Section 4.1).
A GLM showed that P was positively related to the body mass (χ2 = 25.02, p < 0.001, Figure 3a) and the average flock size (χ2 = 25.31, p < 0.001, Figure 3b) of the species, meaning that the larger and more gregarious species were detected farther from the road than the smaller and less gregarious species, with significant differences among biomes (χ2 = 30.38, p < 0.001) despite the large overlap shown by biomes in univariate plots (Figure 3c). This model explained 35.7% of the deviance. When excluding the 19 questionable P values (black dots in Figure 3a,b) from the GLM, the results were similar (body mass: χ2 = 62.68, p < 0.001; flock size: χ2 = 31.83, p < 0.001; biomes: χ2 = 27.19, p < 0.001; deviance explained by the model: 35.13%).

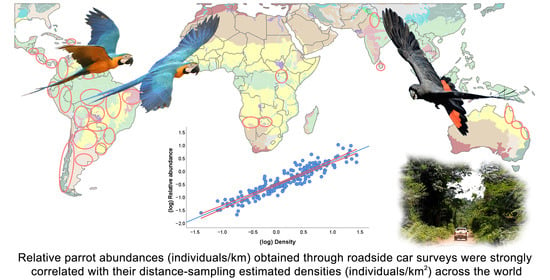
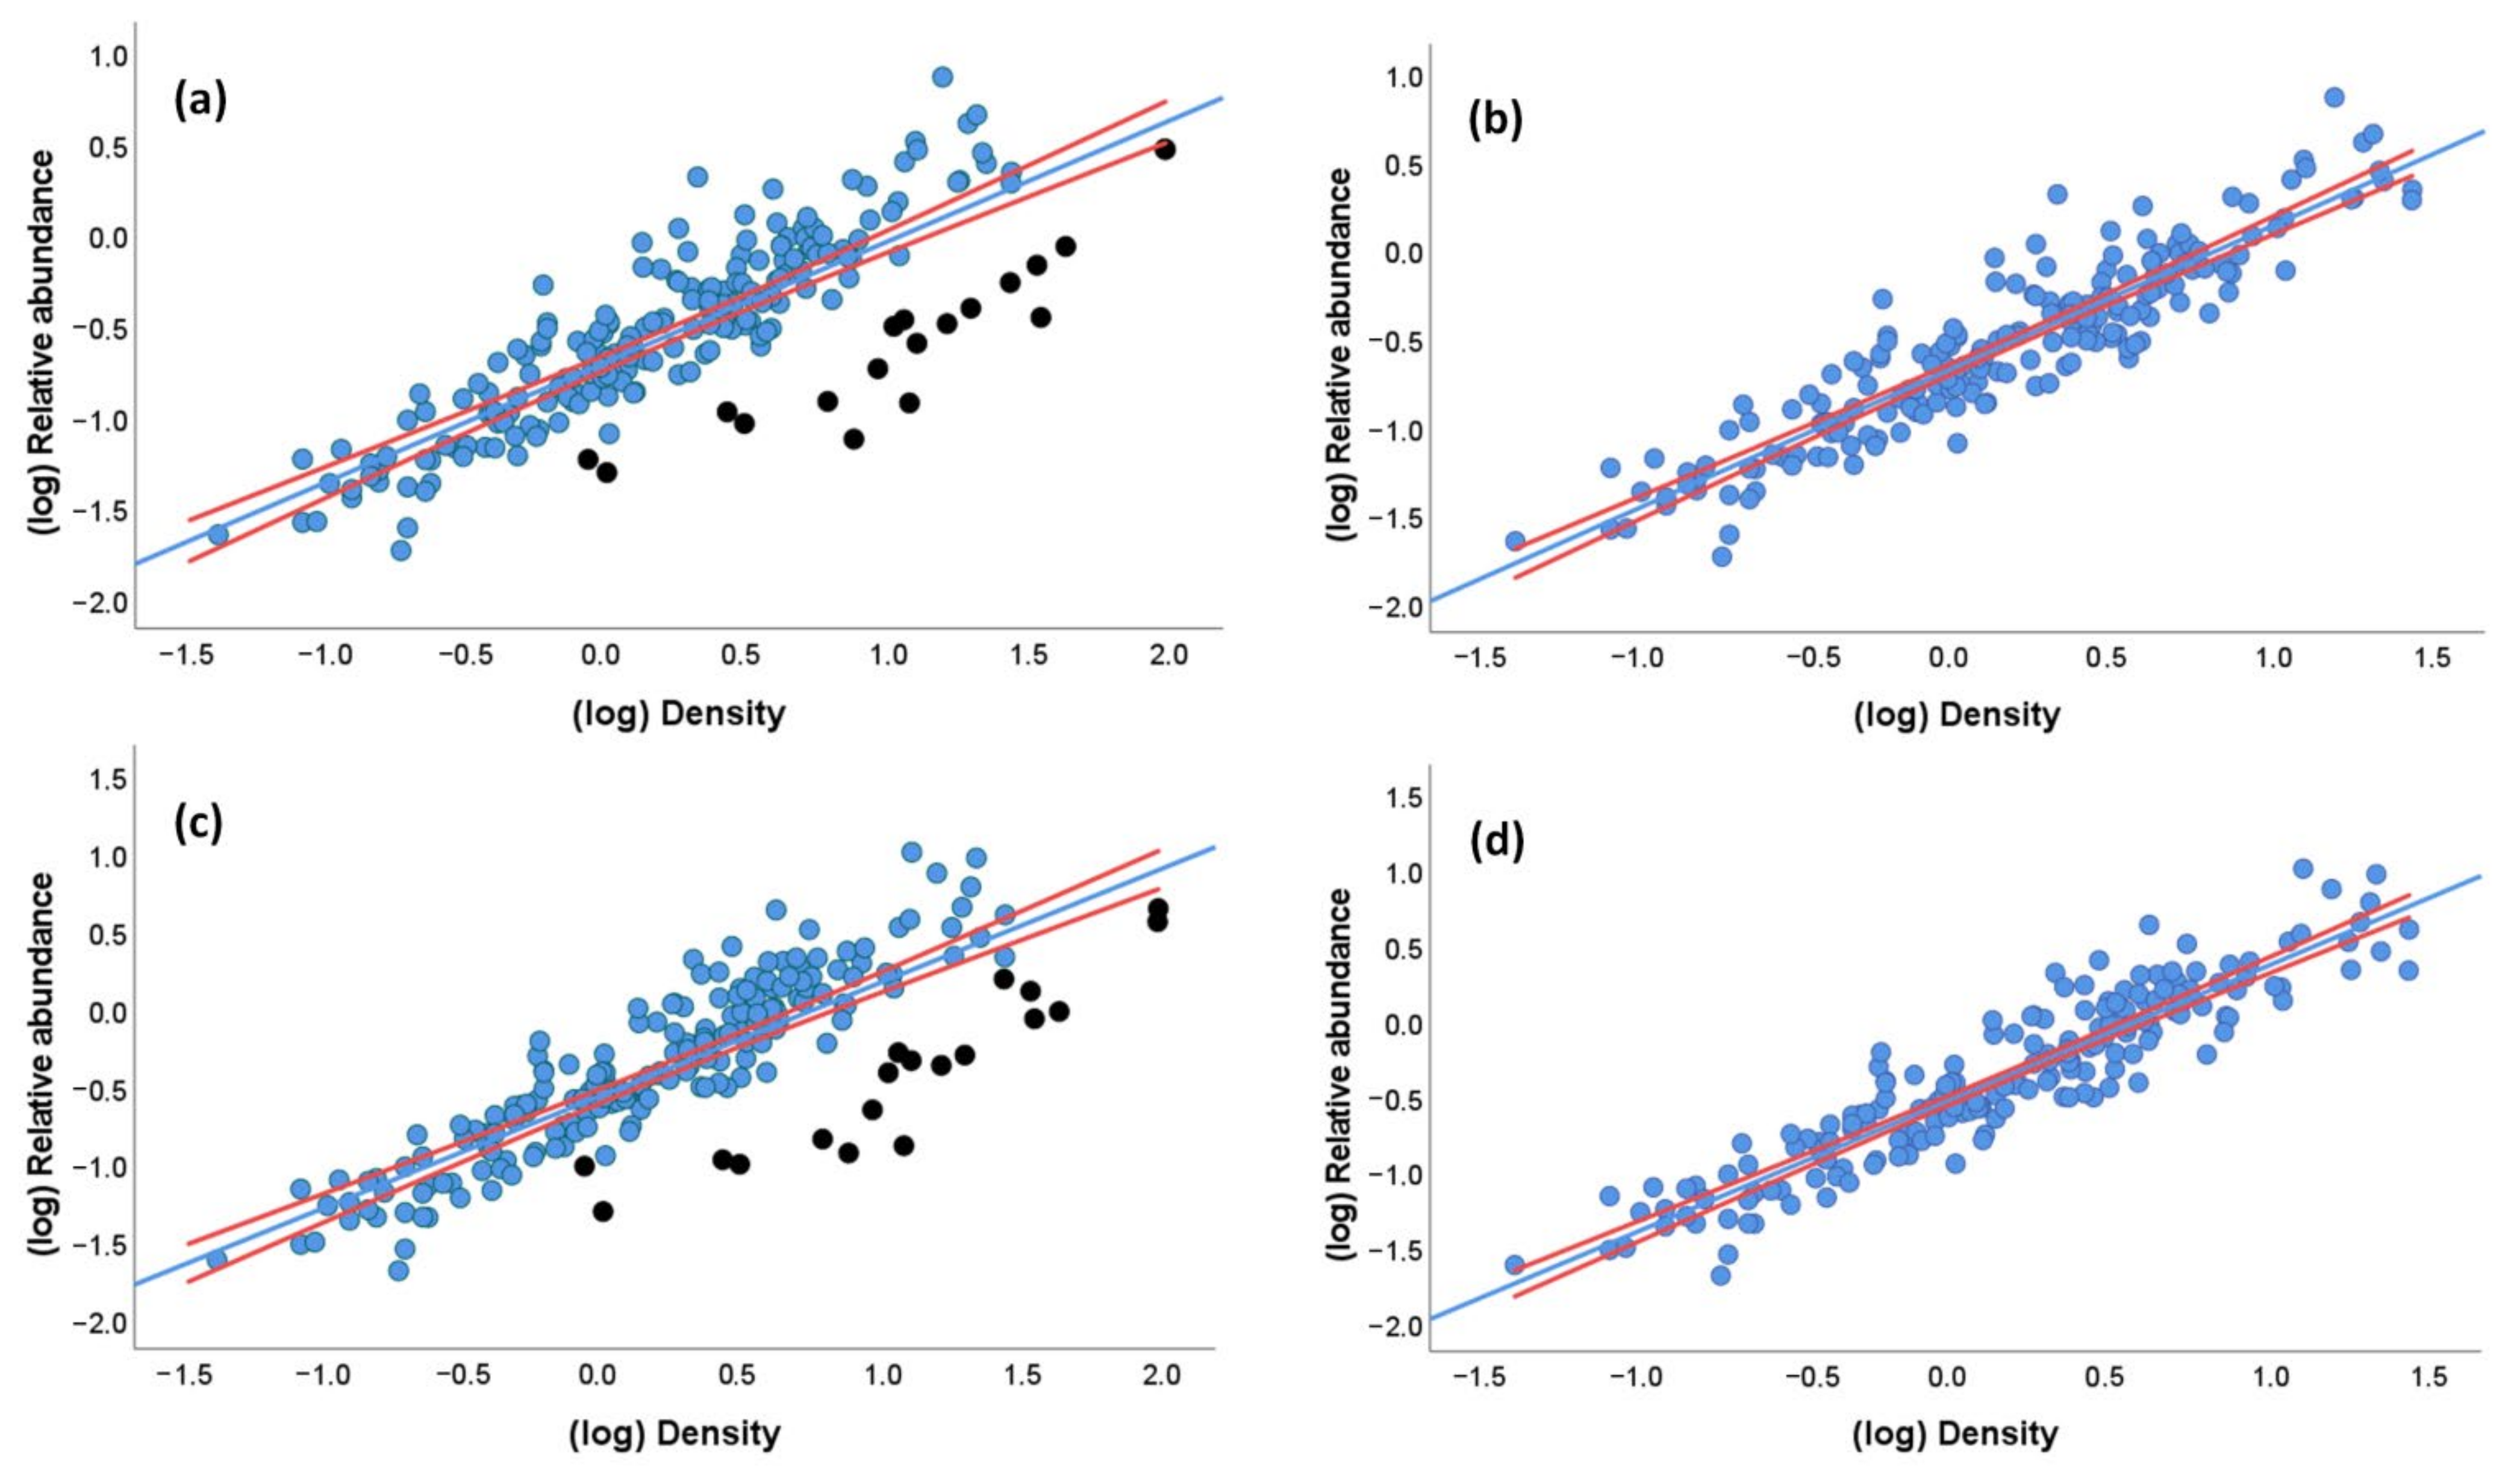
3.4. Relationships between Densities and Relative Abundances

Parrot densities (individuals estimated/km2) were obtained by correcting the number of individuals observed by their P obtained through DS modeling, for the 208 study cases with at least 10 visual encounters at distances < 500 m per parrot species. Densities ranged from 0.04 to 97.4 individuals/km2 (mean = 5.1 ± 11.2 SD, median = 1.8). We also calculated the relative abundances (number of observed individuals/km) for the same dataset, which ranged from 0.02 to 7.31 individuals/km (mean = 0.57 ± 0.86 SD, median = 0.30). The relative abundances of the species were uncorrelated to their probabilities of detection (Spearman correlation, rs = −0.10, p = 0.15, N = 208).
Despite the large differences in P among case studies, the fact that both densities and relative abundances of parrots varied within >40 orders of magnitude, leads to a strong positive correlation between these two estimates of abundance (Spearman correlation of raw data: rs = 0.83, p < 0.001; linear regression of log-transformed values: r = 0.83, estimate: 0.659 ± 0.031 SE, p < 0.001, adjusted-R2 = 0.69, N = 208; Figure 4a). This correlation becomes stronger when excluding the 19 densities obtained from the extremely low, questionable P values (linear regression of log-transformed values: r = 0.92, estimate: 0.799 + 0.025 SE, p < 0.001, adjusted-R2 = 0.84, N = 189; Figure 4b).
Nearly identical results were obtained when restricting the dataset to study cases with at least 20, 30, 40, and 50 visual encounters at distances < 500 m per species to increase the robustness of DS modeling (r = 0.86–0.91, all p < 0.001), despite the fact that study cases were reduced to 120, 74, 65, and 52, respectively. Therefore, estimates of parrot abundances are equivalent whether or not controlling for differences in detectability.
As suggested in previous works, a way to avoid the underestimation of parrot species with varying percentages of aural encounters is to estimate the number of unobserved individuals by multiplying them by the average flock size of the species obtained in the same survey. This estimated relative abundance index (i.e., (number of observed individuals + number of estimated heard individuals)/km) correlates equally well with densities obtained through DS modeling (linear regression of log-transformed values: r = 0.83, p < 0.001, estimate: 0.725 + 0.033 SE, adjusted-R2 = 0.70, N = 208; Figure 4c); thus, its use is recommended to avoid the underestimation of parrot numbers. As before, the correlation results stronger when excluding the 19 questionable desnities (r = 0.93, p < 0.001, estimate: 0.881 + 0.026 SE, adjusted-R2 = 0.86, N = 189; Figure 4d). This relationship remains similar in a GLM (estimate: 0.825 + 0.034 SE, χ2 = 565.89, p < 0.0001) when controlling for a much smaller effect of flock size (estimate: 0.006, SE: 0.002, χ2 = 14.28, p < 0.001), with no significant effects of body mass (χ2 = 0.05, p = 0.82), biomes (χ2 = 16.93, p = 0.06), and number of visual encounters (χ2 = 0.07, p = 0.79). This model explained 87.4% of the deviance.

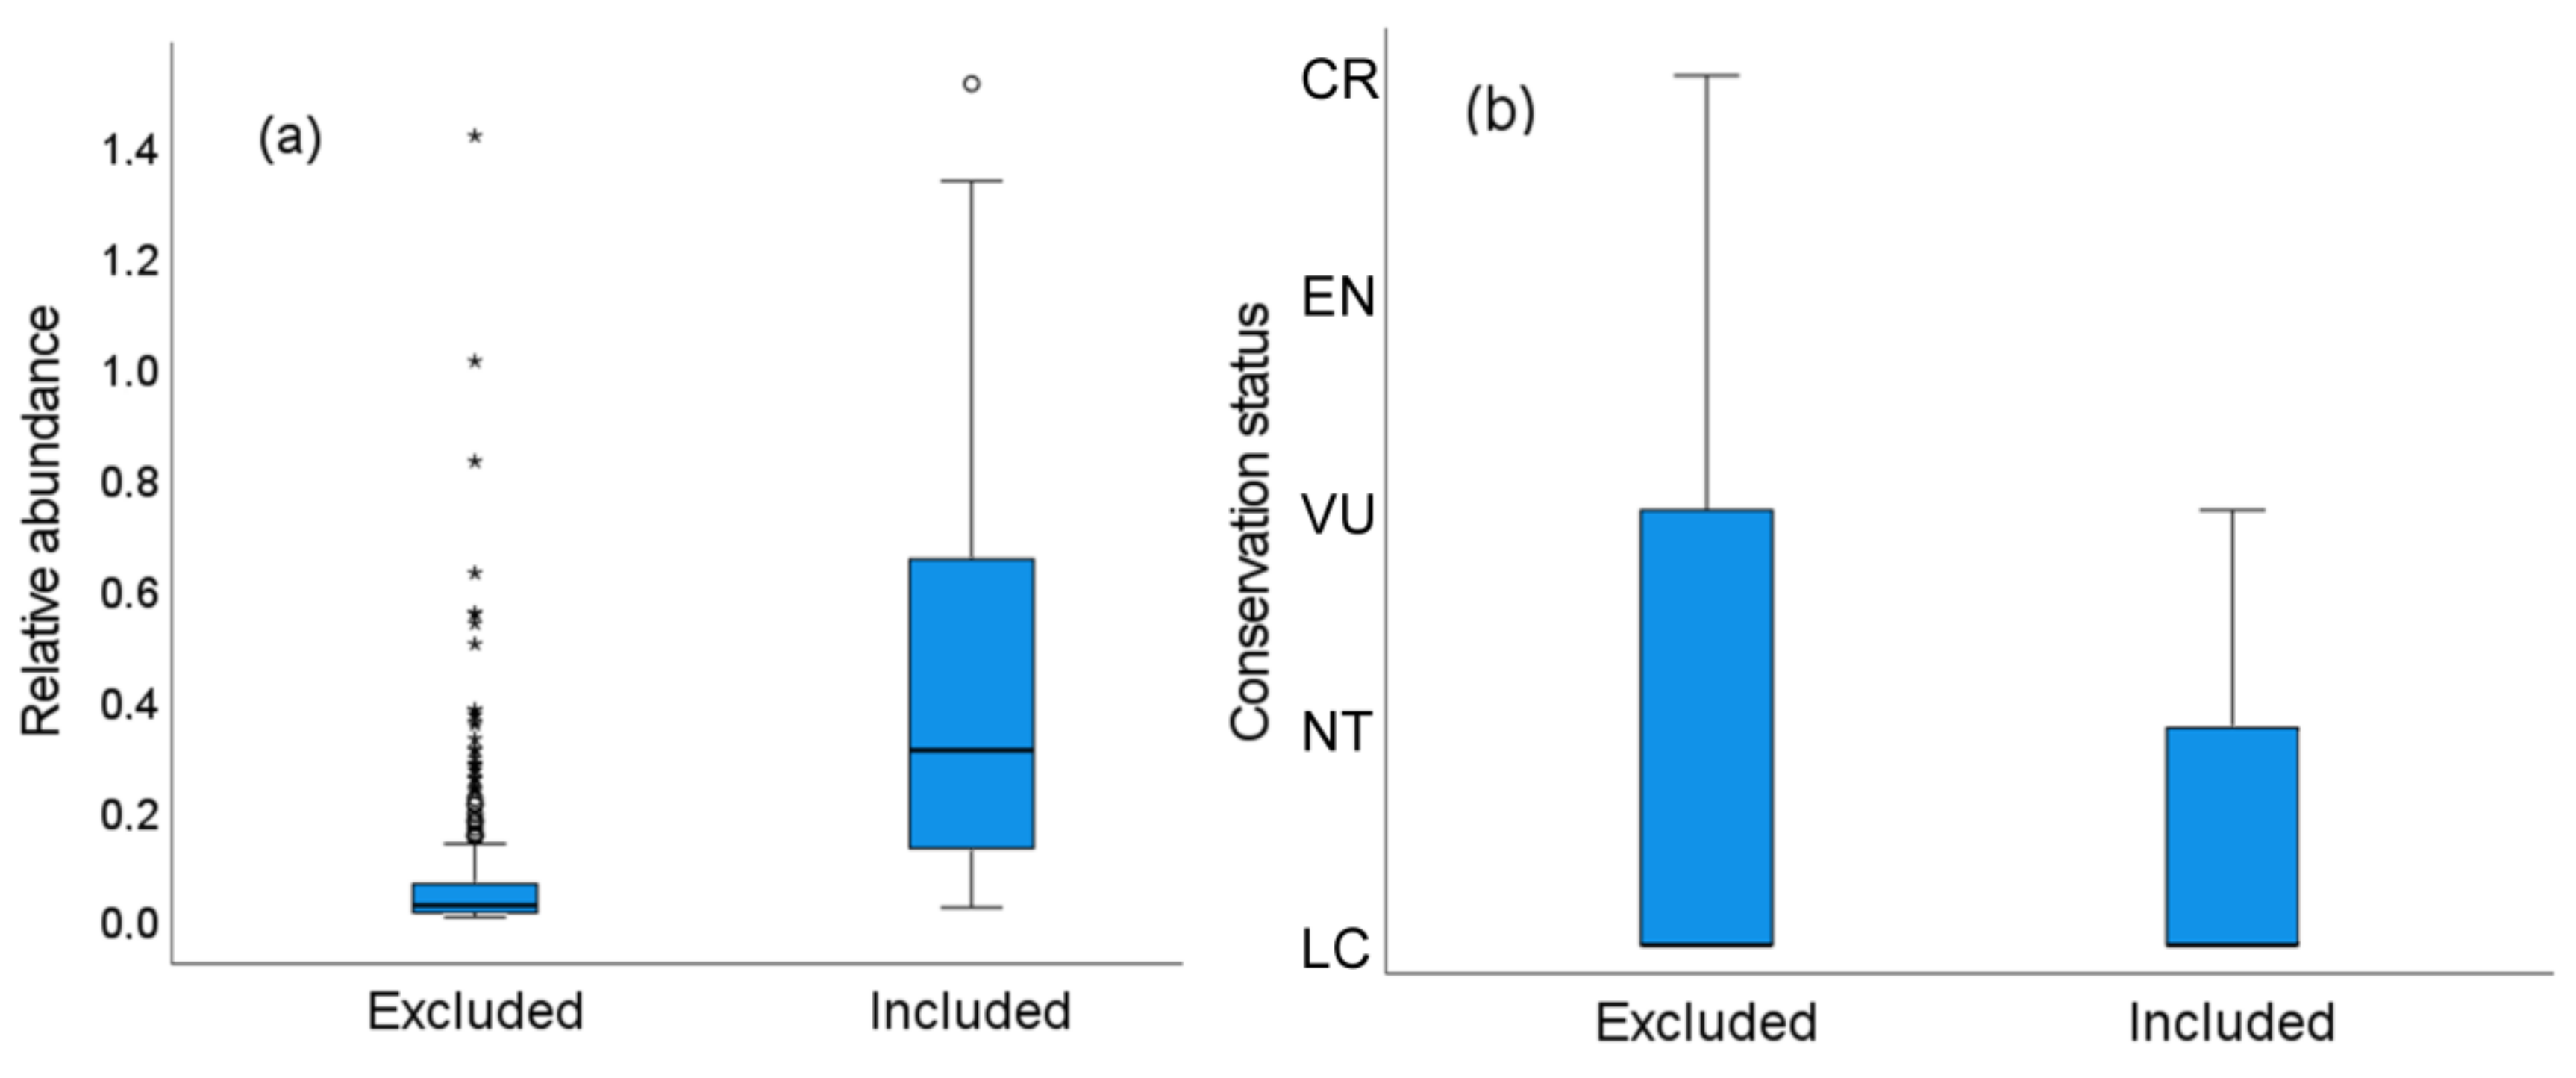
3.5. Characteristics of the Species and Surveys Lost When Using Distance Sampling

From the 575 study cases obtained, in 367 (63.8%) DS modeling was not possible because the number of visual contacts was <10. The number of study cases lost when using DS mostly corresponded to those showing lower relative abundances (individuals/km; χ2 = 82.13, p < 0.0001, Figure 5a), with a smaller positive effect of average flock size (χ2 = 20.80, p < 0.001). This may be explained by the fact that some common species are highly gregarious and thus can be recorded in high numbers (see large data dispersion in Figure 5a) but with a low number of flocks encountered, thus not allowing DS modeling. The loss of cases from DS modeling was unrelated to the body mass of the species (χ2 = 0.45, p = 0.50) (deviance explained by model: 30.35%).
DS modeling could not be applied to 64 (46.7%) of the 137 species surveyed even when pooling all surveys across world ecoregions together, as they did not reach a minimum of 10 visual encounters. The percentage of species excluded varied among realms, the highest being in the Afrotropics (100%, N = 6 species), followed by the Indomalayan (16.7%, N = 6 spp), Australasia (25%, N = 16 spp), and Neotropic (33.6%, N = 110 spp) realms. The species excluded from DS modeling significantly showed a poorer global conservation status (χ2 = 7.51, p < 0.01; 72.32% of deviance explained, Figure 5b).
DS modeling could be not applied for 34 (34.7%) of the 98 surveys conducted, as they did not include a single species reaching a minimum of 10 visual encounters. The percentage of surveys excluded for modeling varied among realms, with the highest being in the Afrotropics (100%, N = 16 surveys), followed by the Neotropic (23.3%, N = 73), Indomalayan (16.7%, N = 6), and Australasia (0%, N = 3) realms.

4. Discussion

Roadside car surveys have been largely recommended to estimate the abundances of large and conspicuous birds which occur at low densities, such as raptors [43]. Recently, this methodology has been applied to parrots, although there is no proper evaluation of its strengths and weaknesses [10]. After our experience conducting roadside raptor surveys in a variety of tropical biomes [15,16], we considered this method to be even more adequate for parrots given that their frequent and loudly vocal activity makes them more easily detectable than the more silent raptors. In fact, 85% of our parrot encounters were aurally detected. The loud behavior of parrots largely reduces the problems in detecting raptors in forested biomes [15]. Supporting this, we found that the proportion of aural detections was related to the body mass and gregariousness of the species but not to the biomes they inhabit, which included habitats largely differing in openness, from steppes to rainforests. Therefore, through our large-scale roadside surveys, we were able to record c. 35% of the extant parrot species across the world biomes, including the commonest to the rarest and even Critically Endangered species. The former species, as well as those common but highly gregarious or patchily distributed, are difficult to survey through walked line transects and point counts because of their low encounter rates [10]. Moreover, we have demonstrated that distance-uncorrected estimates of parrot abundances are strongly correlated to those obtained when using DS modeling, thus providing a good proxy of the actual relative densities of the species. Nonetheless, roadside parrot surveys have several limitations regarding the design and length of surveys and the detectability of the species, which can be addressed as discussed below.

4.1. Roadside Parrot Surveys: Caveats, Solutions, and Prospects

As for raptors and other avian taxa [15,43], parrot abundances obtained through roadside surveys can be biased by the spatial distribution of roads and the response of the species to them. Recent studies have shown that coexisting bird species may differentially respond to roads, some decreasing but others increasing their abundances close to them, also differing in their responses between major and minor roads [44,45]. As some scavengers and birds of prey may be attracted by roadkills and the larger availability of prey and perching sites (e.g., power lines, poles) close to roads [15,46], some parrots can also be attracted by feeding resources, large trees and perching sites available close to roads. In fact, we could confirm that most of the extremely low probabilities of detection we obtained corresponded to study cases where parrots were attracted by feeding resources most often available in the gutters of the roads, such as fruiting trees (e.g., Burrowing parrots Cyanoliseus patagonus in Argentina, [35]) or herb seeds (e.g., Galahs Eolophus roseicapilla in Australia, [47]), or by lines of eucalyptus trees and power lines running in parallel to roads in deforested areas of Argentina, Paraguay, Uruguay and Brazil, substrates where Monk parakeets Myiopsitta monachus build their large communal nests [48]. In these few cases, extremely low probabilities of detection did not result from parrots being hard to detect at large distances from roads but from the fact that they were aggregated around them. These particular circumstances violate a key assumption of DS modeling, i.e., that animal locations are independent of the line transect position [38], thus questioning its use as they may lead to the obtention of inflated densities (see Results Section 3.4 and Figure 4a,c).
On the other hand, some parrots may avoid roads because of human disturbance. This so-called “disturbance effect” may even affect bird abundances obtained from point counts because of the presence of observers [49], and thus traffic should also affect the behavior of parrots. We tried to minimize this disturbance effect by selecting a priori, using recent satellite images, minor paved roads and unpaved roads with little or no traffic, often only accessible using 4 × 4 vehicles. The fact that the relative abundances (individuals/km) of the species were uncorrelated to their distance-dependent probabilities of detection suggests that the less encountered species are actually uncommon (as is also supported by their IUCN Red List evaluations [3]), rather than their abundances being underestimated because they avoid roads and thus remain undetected. Moreover, through this work we found that parrots, from the smallest to the largest species, were largely undisturbed by the vehicle, allowing us to approach them at short distances, even taking detailed photographs (e.g., [34,35]). This agrees with the perception of high behavioral flexibility of parrots when facing human disturbance (e.g., [18,27,50]). In fact, recent studies have shown that the inter-individual variability of birds in their tolerance to sources of human disturbance such as roads [51] and human presence [52] is related to the relative brain size of the species, and parrots are among the birds with larger brains showing less fear of humans [52]. Nonetheless, further well-designed studies are needed to delve more deeply into these aspects and to evaluate how parrots respond to roads with high traffic intensity.
Another problem of roadside surveys is that habitat composition and configuration near roads may differ from the surrounding areas, thus leading to bird abundance biases [10,53]. The occurrence of these potential biases can be assessed a posteriori by comparing habitat composition along the roads surveyed with surrounding areas [54] but, ideally, can be largely avoided by carefully selecting the roads a priori using satellite images. In our case, within each survey, we intentionally selected roads crossing both protected and unprotected habitats with different degrees of transformation, as we were interested in surveying whole parrot communities that included habitat-sensitive species but also those that are favored by low-intensive agricultural and urban habitats [17,18,27,28,29]. In other cases, however, researchers may be interested in surveying a particular species and in such a case they should ensure the selected roads cover and represent the habitats used by this species and not others. Alternatively, they may be interested in species responses to habitat transformation. Road transects can be divided into small sections whose habitats can be measured [43], and thus long surveys crossing fragments of habitats with different degrees of transformation, from pristine to urban areas within the same study area, allow for testing changes in parrot abundances based on changes in land use [17,18]. The length of the section can be used as a proxy of the size of the habitat patch crossed when acquiring large data sets, and thus testing the effects of habitat transformation together with patchiness on single-species parrot abundances [18]. The same approach can be translated to multi-species studies, obtaining estimates of total abundance, diversity, and species richness (by simply recording presence/absence of each species) for each roadside habitat section [15,55]. Another approach is to compare the habitat composition within a buffer centered on each detected parrot with that around random points selected from the same roadside survey, combining field data with remote sensing tools [55]. These approaches have still been little explored and have the potential to increase our knowledge on the responses of different parrot species and communities to very large-scale changes in land use and habitat fragmentation, and are urged given the further habitat loss predicted for parrots worldwide [7].

4.2. Do We Need to Account for Parrot Detectability?

As for other avian taxa, it is widely assumed that detectability varies among parrot species [10]. However, differences in distance-dependent detectability among parrot species have been little reported [13], and even less is known about which parrot traits explain these differences. Observations of flying parrots recorded from Amazonian rainforest canopy points showed that larger-bodied species were detected at greater distances, and that average flock sizes were negatively related to their body mass [56]. Here, analyzing a large data set that includes a variety of species and biomes, we show that not only the distances of detection but also the probabilities of visual detections are positively related to the body mass and gregariousness of a species. Moreover, there are other potential sources of variation in parrot detectability that we could not assess through our large-scale approach. For example, visual (but not aural) detectability may vary within species and biomes due to habitat transformations (it could be higher in agriculture than in forest habitats) and seasonal changes in vegetation structure (it could be higher during the dry season in deciduous tropical dry forests when most trees lose their leaves).
Breeding phenology may also affect parrot detectability since the gregariousness of some species decreases during the nesting period [10,11] and nesting pairs may be more tied to their nesting sites and thus less mobile and detectable. Therefore, it is important to consider potential seasonal changes in parrot behavior and to account for variation in parrot detectability when performing censuses.
Accordingly, our distance-dependent probabilities of detection (P) were positively related to the body mass and gregariousness of the species and varied among biomes. Even though we relied on a minimum of 10 visual encounters, which can lead to useful but imprecise density estimates [4], the densities obtained were within the ranges obtained for the same parrot genera through DS modeling using walked line transects and point counts [4]. As highlighted in the same review, parrot densities obtained through different methods, even including roost counts, are quite similar when looking at differences among species [4]. This is likely due to the fact that differences in natural (and/or human-induced) abundances among parrot species [3] are so high (in our study within >40 orders of magnitude) that any biases due to differential detectability or other methodological biases are overcome in interspecific comparisons. Then, perhaps not surprisingly, our results allow us to confirm and generalize previous findings [22], showing a strong correlation between detectability-corrected and uncorrected estimates of parrot abundance at a global scale. Notably, the same correlation holds when increasing the minimum threshold of encounters to increase the robustness of DS modeling and when including estimates of the number of unseen (only-heard) individuals, while it is not affected by the body mass of the species, biomes, or the number of encounters per species. Therefore, simple estimates of relative parrot abundance (individuals/km) can be used as good proxies of their estimated detectability-corrected densities. This does not mean however that one method is better than the other, nor that distance sampling is not needed for roadside parrot surveys. The choice should be balanced attending to different methodological constraints and research objectives, as further discussed below.

4.3. Pros and Cons of Distance Sampling

A major challenge for estimating parrot densities is obtaining enough encounters from all species for DS modeling [4]. For example, density estimates could be obtained for only 9 of 17 parrot species after significant effort conducting walked line transects (accumulating 2,412 km surveyed over 3 years) in two small Amazonian study areas [23]. In our study, 64% of the case studies, 47% of the parrot species, and 35% of all surveys had to be excluded from DS modeling. This occurred despite pooling data from the same ecoregions/countries obtained in different seasons and years, when available, to increase sample sizes, to better represent the whole parrot community, and increase the precision of estimates [12], and even though we used the lowest number of visual encounters required for DS modeling [4]. Concerningly, most of the species excluded are threatened or uncommon in the wild, but there are also some common but highly gregarious species, varying among realms. The extreme case is exemplified by the Afrotropic realm, where all study cases, species, and surveys were excluded despite the high survey effort invested (Supplementary S1). Obviously, the percentage of exclusions from DS modeling would be much higher if we had separated surveys by years or seasons or split them into habitat-category sections [17], or had increased the minimum number of encounters for obtaining more precise density estimates [13], as many researchers may require for dealing with their research objectives.
Some procedures have been proposed to solve the problem of insufficient detections for parrot DS modeling. One is to use the records of a coexisting common species to model its probability of detection and use it for estimating the density of a congeneric, similar-sized rare species from which insufficient encounters were obtained [20]. However, after our experience, all species from the same genus (e.g., large macaws Ara, amazon parrots Amazona) are often equally scarce within the same survey, and thus all are unavoidably excluded from DS modeling. Another solution applied is pooling all records from rare species (even from different genera) to estimate a common probability of detection and derived species-specific density estimates [57]. However, these estimates must be taken with caution as the assumption that the detectability of different species is equivalent may be violated [53].
Rather than forcing the obtention of somewhat questionable density estimates when species-specific data are lacking, we recommend relying on simple relative abundances (individuals/km) when roadside surveys focus on whole parrot communities that include uncommon species, as they offer abundance estimates equivalent to detectability-corrected densities. Moreover, not recording distances has some advantages. On the one hand, the calculus of relative abundances is very simple and does not require the statistical skills needed for DS modeling. On the other hand, the field-work time saved by not recording distances (i.e., in surveys of rich and abundant parrot communities, researchers often must stop the car every few minutes to record them) can be invested in conducting longer roadside surveys, thus better representing the areas and parrot communities surveyed. This may be an important advantage, as parrot surveys are often logistically constrained by climatic conditions, and the time and funds available. Contrarily, we recommend DS modeling when researchers focus on one or a few common species, as they can then obtain more precise estimates of abundance by increasing the number of encounters (not paying attention to the rest of the species) and the best-fitting detection functions, as is done with point counts and line transects [13]. Even more importantly, DS modeling allows the calculation of densities that can be carefully extrapolated to the extent of suitable habitat and thus estimate the size of parrot populations, as has been done using point counts on islands [24,58]. A stratified design of large-scale roadside surveys could allow the estimation of population sizes for common parrot species with country- and even continental-level distributions, something that could be logistically unaffordable through point counts and walked line transects.
Finally, as a word of caution, researchers must keep in mind that distance sampling modeling was developed to correct for the imperfect detection of species in census surveys, but that the violation of some assumptions may also generate imperfect results. For the case of parrots, some assumptions of DS modeling are often violated: that all individuals encountered are accurately counted and their distances of detection exactly measured, and that encountered birds do not move while conducting the survey [10,38,53]. We have shown that the first assumption is not only violated in walked line transects and point counts [23,34] but also in roadside car surveys (see also [22]). In our surveys, 24% of the encounters corresponded to aural contacts of an unknown number of unseen individuals. Concerningly, the proportion of aural contacts was not randomly distributed but varied from 0 to 100% among species, being related to their body mass and gregariousness. As a solution following previous works [12,22,23,24], we estimated the number of unseen birds by substituting aural contacts with the average flock size of the species obtained from the same survey (this is important as average flock sizes may vary among seasons and regions). We used average flock size for consistency with previous works that adopted this solution [22,23,24] and because it is often reported as a measure of gregariousness (e.g., [13,56]). Given the often right-skewed distribution of flock sizes, researchers could use the median instead of the mean, although results should not markedly differ. In any case, we recommend incorporating this procedure to avoid the underestimation of parrot numbers in roadside surveys (in our case reaching 23% on average), resulting in relative parrot abundances that strongly correlated to distance-corrected densities. However, incorporating these estimates of an unseen number of individuals into DS modeling is challenging given the difficulties of estimating their distances of detection. Some solutions have been proposed when conducting parrot walked line transects and point counts, such as measuring distances to other objects at a similar distance if the heard parrot/flock was not visible [13,24] or categorizing these estimated distances to unseen parrots into intervals [58]. These estimations require expert observer skills and thus, researchers must be careful to do not introduce distance biases that would affect DS density estimates [38].
Regarding bird movements, DS modeling was conceptually developed as a ‘snapshot’ method in which animals are ideally ‘frozen’ while the survey is conducted, but in practice animals often make non-responsive movements (i.e., not disturbed by the observer) [38]. Buckland et al. [53] suggested that this assumption must be relaxed to include flying individuals in avian taxa that spend large proportions of their time in flight, such as seabirds and raptors. This is also the case for parrots. Except for a few low-mobility forest species (e.g., genus Pionites), most parrot species make long daily trips looking for food and moving between foraging, breeding, and roosting sites [10]. In fact, 36% of our parrot encounters corresponded to birds/flocks detected in non-responsive flights. Excluding these records would underestimate parrot abundances, with non-random biases according to the different flight propensities among species. Using walked line transects, Legault et al. [13] found that excluding flying birds caused an underestimation of parrot densities that varied between 7% and 67% among species. In their review on distance sampling approaches and assumptions, Thomas et al. [38] indicated that, in practice, non-responsive movement in walked line-transect surveys is not problematic provided it is slow relative to the speed of the observer, and thus it should be even less problematic for the faster-speed road car surveys. Therefore, we support the inclusion of flying parrots in roadside car surveys, as for walked line transects [13], but also suggest that researchers record the behavior of parrots (perching, foraging, flying) encountered. This may later allow researchers to decide whether to include flying birds in DS estimates [13] and to assess for example foraging habitat preferences by restricting records to foraging birds [17].
Researchers should be not discouraged by the limitations of DS modeling applied to roadside car surveys. Rather, they should be aware of how and when its application is feasible for their study species. On the other hand, some analytical advances for estimating parrot abundances [10] such as the use of hierarchical (N-mixture) models [59] have been recently applied to parrot roost counts [60], walked transects, and point counts [61], and have the potential to be used in roadside parrot surveys as has been done for raptors [16].

5. Conclusions

While roost counts may allow estimating regional and even global populations sizes of some parrot species [11,60,62,63], they are not affordable for most parrot populations and species and thus estimates of densities are often obtained using point counts or walk line transects [10]. However, these methodologies may fail to record rare and patchily distributed species, a problem that could be solved using large-scale roadside car surveys [10]. Here, compiling roadside car surveys conducted across the world biomes and continents inhabited by parrots, we have assessed how the aural- and distance-dependent probabilities of detection are affected by species traits and biomes as well as the pros and cons of roadside car surveys using or not using DS modeling, providing potential solutions for the problems encountered. We have demonstrated that distance-uncorrected estimates of parrot abundances are strongly correlated to those obtained using DS modeling, thus offering a good proxy for the actual relative densities of the species. This however does not mean that one method is better than the other. While DS modeling generally can not be used when dealing with whole parrot communities, because it results in the exclusion of a high percentage of surveys and species (mostly those uncommon and threatened ones), it may be useful for species-specific studies of common species. As learned from comparisons of other survey methodologies [10,49,59], the choice of the most suitable method is context-dependent. We summarize in Table 1 the strengths and weaknesses of using or not using DS attending to sampling effectiveness, which is understood here as the ability of either method to record birds that are present, to methodological constraints, and to the output variables required to reach different research goals. We hope this comprehensive summary will help guide researchers in choosing the best–fitting option for their particular research hypotheses, characteristics of the species studied, and logistical constraints.

Supplementary Materials

The following are available online at https://0-www-mdpi-com.brum.beds.ac.uk/article/10.3390/d13070300/s1, Supplementary S1: Details of the surveys conducted, Supplementary S2: Details of the species surveyed, Supplementary S3: histogram of detection distances, the plot of group size x detection distances (with Spearman correlation test p-value), and the estimated detection functions from the best DS models for each binning setup (including X2 goodness-of-fit tests), overlaid on the histogram of detection distances with the respective distance breaks, for each case study.

Author Contributions

Conceptualization, J.L.T., P.R.-V., F.R. and M.C.; methodology, J.L.T., F.V.D.; validation, J.L.T., F.H., G.B., F.V.D., and P.R.-V. fieldwork, all authors; formal analysis, J.L.T., F.V.D., and F.R.; resources, P.R.-V., B.T., and D.H.-B.; data curation, P.R.-V., B.T., and J.L.T.; writing—original draft preparation, J.L.T.; writing—review and editing, M.C., F.V.D., B.T., F.R., G.B., F.H., and J.M.B.; visualization, M.C.; supervision, J.L.T. and M.C.; project administration, M.C. and J.L.T.; funding acquisition, J.L.T. and M.C. All authors have read and agreed to the published version of the manuscript.

Funding

This research was funded by Fundación Biodiversidad (Spanish Ministerio de Medio Ambiente, project 52I.CA2109), Fundación Repsol, Spanish Ministerio de Ciencia e Innovación (Project CGL2015-71378-P), and mostly by Loro Parque Fundación (Project SEJI/2018/024).

Institutional Review Board Statement

Not applicable.

Informed Consent Statement

Not applicable.

Data Availability Statement

Main data are provided as Supplementary Materials. Additional information can be requested from the corresponding author.

Acknowledgments

We thank Isabel Afán (LAST-EBD) for helping in the design of road surveys using satellite maps. Logistic and technical support was provided by Doñana ICTS-RBD. We also thank John Griffith for his support in Australia, Julio Rabadán for guiding us in using and improving Observation, and two anonymous reviewers for their valuable suggestions.

Conflicts of Interest

The authors declare no conflict of interest.

References

  1. Olah, G.; Butchart, S.H.M.; Symes, A.; Guzmán, I.M.; Cunningham, R.; Brightsmith, D.; Heinsohn, R. Ecological and socio-economic factors affecting extinction risk in parrots. Biodivers. Conserv. 2016, 25, 205–223. [Google Scholar] [CrossRef]
  2. McClure, C.J.W.; Rolek, B.W. Relative Conservation Status of Bird Orders With Special Attention to Raptors. Front. Ecol. Evol. 2020, 8, 420. [Google Scholar] [CrossRef]
  3. IUCN. The IUCN Red List of Threatened Species. Available online: https://www.iucnredlist.org (accessed on 17 January 2021).
  4. Marsden, S.J.; Royle, K. Abundance and abundance change in the world’s parrots. Ibis 2015, 157, 219–229. [Google Scholar] [CrossRef] [Green Version]
  5. Berkunsky, I.; Quillfeldt, P.; Brightsmith, D.J.; Abbud, M.C.; Aguilar, J.M.R.E.; Alemán-Zelaya, U.; Aramburú, R.M.; Arce Arias, A.; Balas McNab, R.; Balsby, T.J.S.; et al. Current threats faced by Neotropical parrot populations. Biol. Conserv. 2017, 214, 278–287. [Google Scholar] [CrossRef] [Green Version]
  6. Martin, R.O.; Perrin, M.R.; Boyes, R.S.; Abebe, Y.D.; Annorbah, N.D.; Asamoah, A.; Bizimana, D.; Bobo, K.S.; Bunbury, N.; Brouwer, J.; et al. Research and conser-vation of the larger parrots of Africa and Madagascar: A review of knowledge gaps and opportunities. Ostrich 2014, 85, 205–233. [Google Scholar] [CrossRef]
  7. Vergara-Tabares, D.L.; Cordier, J.M.; Landi, M.A.; Olah, G.; Nori, J. Global trends of habitat destruction and consequences for parrot conservation. Glob. Chang. Biol. 2020, 26, 4251–4262. [Google Scholar] [CrossRef] [PubMed]
  8. Barbosa, J.M.; Hiraldo, F.; Romero, M.A.; Tella, J.L. When does agriculture enter into conflict with wildlife? A global assess-ment of parrot–agriculture conflicts and their conservation effects. Divers. Distrib. 2021, 27, 4–17. [Google Scholar] [CrossRef]
  9. Sánchez-Mercado, A.; Ferrer-Paris, J.; Rodríguez, J.; Tella, J.L. A Literature Synthesis of Actions to Tackle Illegal Parrot Trade. Diversity 2021, 13, 191. [Google Scholar] [CrossRef]
  10. Dénes, F.V.; Tella, J.L.; Beissinger, S.R. Revisiting methods for estimating parrot abundance and population size. Emu Austral. Ornithol. 2017, 118, 67–79. [Google Scholar] [CrossRef] [Green Version]
  11. Casagrande, D.G.; Beissinger, S.R. Evaluation of Four Methods for Estimating Parrot Population Size. Condor 1997, 99, 445–457. [Google Scholar] [CrossRef]
  12. Marsden, S.J. Estimation of parrot and hornbill densities using a point count distance sampling method. Ibis 2008, 141, 327–390. [Google Scholar] [CrossRef]
  13. Legault, A.; Theuerkauf, J.; Baby, E.; Moutin, L.; Rouys, S.; Saoumoé, M.; Verfaille, L.; Barré, N.; Chartendrault, V.; Gula, R. Standardising distance sampling surveys of parrots in New Caledonia. J. Ornithol. 2013, 154, 19–33. [Google Scholar] [CrossRef] [Green Version]
  14. Sánchez-Zapata, J.A.; Calvo, J.F. Raptor distribution in relation to landscape composition in semi-arid Mediterranean habitats. J. Appl. Ecol. 1999, 36, 254–262. [Google Scholar] [CrossRef]
  15. Carrete, M.; Tella, J.L.; Blanco, G.; Bertellotti, M. Effects of habitat degradation on the abundance, richness and diversity of raptors across Neotropical biomes. Biol. Conserv. 2009, 142, 2002–2011. [Google Scholar] [CrossRef]
  16. Dénes, F.V.; Solymos, P.; Lele, S.; Silveira, L.F.; Beissinger, S.R. Biome-scale signatures of land-use change on raptor abun-dance: Insights from single-visit detection-based models. J. Appl. Ecol. 2017, 54, 1268–1278. [Google Scholar] [CrossRef] [Green Version]
  17. Tella, J.; Rojas, A.; Carrete, M.; Hiraldo, F. Simple assessments of age and spatial population structure can aid conservation of poorly known species. Biol. Conserv. 2013, 167, 425–434. [Google Scholar] [CrossRef]
  18. Luna, Á.; Romero-Vidal, P.; Hiraldo, F.; Tella, J.L. Cities may save some threatened species but not their ecological functions. PeerJ 2018, 6, e4908. [Google Scholar] [CrossRef]
  19. Tella, J.L.; Dénes, F.; Zulian, V.; Prestes, N.P.; Martínez, J.; Blanco, G.; Hiraldo, F. Endangered plant-parrot mutualisms: Seed tolerance to predation makes parrots pervasive dispersers of the Parana pine. Sci. Rep. 2016, 6, 31709. [Google Scholar] [CrossRef]
  20. Baños-Villalba, A.; Blanco, G.; Díaz-Luque, J.A.; Dénes, F.; Hiraldo, F.; Tella, J.L. Seed dispersal by macaws shapes the landscape of an Amazonian ecosystem. Sci. Rep. 2017, 7, 1–12. [Google Scholar] [CrossRef] [Green Version]
  21. Blanco, G.; Hiraldo, F.; Rojas, A.; Dénes, F.; Tella, J.L. Parrots as key multilinkers in ecosystem structure and functioning. Ecol. Evol. 2015, 5, 4141–4160. [Google Scholar] [CrossRef] [Green Version]
  22. Romero-Vidal, P.; Hiraldo, F.; Rosseto, F.; Blanco, G.; Carrete, M.; Tella, J.L. Opportunistic or Non-Random Wildlife Crime? Attractiveness rather than Abundance in the Wild Leads to Selective Parrot Poaching. Diversity 2020, 12, 314. [Google Scholar] [CrossRef]
  23. Lee, A.T.K.; Marsden, S.J. The Influence of Habitat, Season, and Detectability on Abundance Estimates across an Amazonian Parrot Assemblage. Biotropica 2012, 44, 537–544. [Google Scholar] [CrossRef]
  24. Reuleaux, A.; A Siregar, B.; Collar, N.J.; Panggur, M.R.; Mardiastuti, A.; Jones, M.J.; Marsden, S.J. Protected by dragons: Density surface modeling confirms large population of the critically endangered Yellow-crested Cockatoo on Komodo Island. Condor 2020, 122, 042. [Google Scholar] [CrossRef]
  25. Lopes, D.C.; Martin, R.O.; Henriques, M.; Monteiro, H.; Cardoso, P.; Tchantchalam, Q.; Pires, A.J.; Regalla, A.; Catry, P. Combining local knowledge and field surveys to determine status and threats to Timneh Parrots Psittacus timneh in Guinea-Bissau. Bird Conserv. Int. 2019, 29, 400–412. [Google Scholar] [CrossRef]
  26. Grilli, P.G.; Soave, G.E.; Arellano, M.L.; Masello, J.F. Abundancia relativa del Loro Barranquero (Cyanoliseus patagonus) en la provincia de Buenos Aires y zonas limítrofes de La Pampa y Río Negro, Argentina. Hornero 2012, 27, 63–71. [Google Scholar]
  27. Salinas-Melgoza, A.; Salinas-Melgoza, V.; Wright, T.F. Behavioral plasticity of a threatened parrot in human-modified land-scapes. Biol. Conserv. 2013, 159, 303–312. [Google Scholar] [CrossRef]
  28. Figueira, L.; Tella, J.L.; de Camargo, U.M.; Ferraz, G. Autonomous sound monitoring shows higher use of Amazon old growth than secondary forest by parrots. Biol. Conserv. 2015, 184, 27–35. [Google Scholar] [CrossRef] [Green Version]
  29. Flores-López, E.; Montero-Castro, J.C.; Monterrubio-Rico, T.C.; Ibarra-Manríquez, G.; López-Toledo, L.; Bonilla-Ruz, C. Diffe-rential Use of Forest Patches by the Military Macaw Ara militaris (Psittacidae) in Coastal Tropical Forests of Jalisco, Mexico. Ardeola 2020, 67, 423–432. [Google Scholar] [CrossRef]
  30. Wirminghaus, J.; Downs, C.T.; Perrin, M.; Symes, C. Abundance and activity patterns of the Cape parrot ( Poicephalus robustus ) in two afromontane forests in South Africa. Afr. Zool. 2001, 36, 71–77. [Google Scholar] [CrossRef]
  31. Salinas-Melgoza, A.; Renton, K. Seasonal variation in activity patterns of juvenile Lilac-crowned parrots in tropical dry forest. Wilson Bull. 2006, 117, 291–295. [Google Scholar] [CrossRef]
  32. Montesinos-Navarro, A.; Hiraldo, F.; Tella, J.L.; Blanco, G. Network structure embracing mutualism–antagonism continuums increases community robustness. Nat. Ecol. Evol. 2017, 1, 1661–1669. [Google Scholar] [CrossRef]
  33. Sebastián-González, E.; Hiraldo, F.; Blanco, G.; Hernández-Brito, D.; Romero-Vidal, P.; Carrete, M.; Gómez-Llanos, E.; Pacífico, E.C.; Díaz-Luque, J.A.; Dénes, F.V.; et al. The extent, frequency and ecological functions of food wasting by parrots. Sci. Rep. 2019, 9, 1–11. [Google Scholar] [CrossRef] [Green Version]
  34. Hernández-Brito, D.; Romero-Vidal, P.; Hiraldo, F.; Blanco, G.; Díaz-Luque, J.A.; Barbosa, J.M.; Symes, C.T.; White, T.H.; Pacífico, E.C.; Sebastián-González, E.; et al. Epizoochory in parrots as an overlooked yet widespread plant–animal mutualism. Plants 2021, 10, 760. [Google Scholar] [CrossRef]
  35. Blanco, G.; Romero-Vidal, P.; Carrete, M.; Chamorro, D.; Bravo, C.; Hiraldo, F.; Tella, J. Burrowing Parrots Cyanoliseus patagonus as Long-Distance Seed Dispersers of Keystone Algarrobos, Genus Prosopis, in the Monte Desert. Diversity 2021, 13, 204. [Google Scholar] [CrossRef]
  36. Buckland, S.T.; Anderson, D.R.; Burnham, K.P.; Laake, J.L.; Borchers, D.L.; Thomas, L. Introduction to Distance Sampling: Estimating Abundance of Biological Populations; Oxford University Press: Oxford, UK, 2001. [Google Scholar]
  37. Buckland, S.T. Point transect surveys for songbirds: Robust methodologies. Auk 2006, 123, 345–357. [Google Scholar] [CrossRef]
  38. Thomas, L.; Buckland, S.T.; Rexstad, E.; Laake, J.L.; Strindberg, S.; Hedley, S.L.; Bishop, J.R.B.; Marques, T.A.; Burnham, K.P. Distance software: Design and analysis of distance sampling surveys for estimating population size. J. Appl. Ecol. 2010, 47, 5–14. [Google Scholar] [CrossRef] [PubMed] [Green Version]
  39. Miller, D.L.; Rexstad, E.; Thomas, L.; Marshall, L.; Laake, J.L. Distance Sampling in R. J. Stat. Softw. 2019, 89, 1–28. [Google Scholar] [CrossRef] [Green Version]
  40. R Core Team. R: A Language and Environment for Statistical Computing; R Foundation for Statistical Computing: Vienna, Austria, 2018; Available online: http://www.R-project.org/ (accessed on 6 July 2019).
  41. Burgio, K.R.; Davis, K.E.; Dreiss, L.M.; Cisneros, L.M.; Klingbeil, B.; Presley, S.J.; Willig, M.R. Phylogenetic supertree and functional trait database for all extant parrots. Data Brief. 2019, 24, 103882. [Google Scholar] [CrossRef]
  42. Jovani, R.; Tella, J.L. Parasite prevalence and sample size: Misconceptions and solutions. Trends Parasitol. 2006, 22, 214–218. [Google Scholar] [CrossRef]
  43. Bibby, C.J.; Burgess, N.D.; Hill, D.A. Bird Census Techniques; Elsevier: Amsterdam, The Netherlands, 1992. [Google Scholar]
  44. Mammides, C.; Kounnamas, C.; Goodale, E.; Kadis, C. Do unpaved, low-traffic roads affect bird communities? Acta Oecologica 2016, 71, 14–21. [Google Scholar] [CrossRef]
  45. Cooke, S.; Balmford, A.; Donald, P.F.; E Newson, S.; Johnston, A. Roads as a contributor to landscape-scale variation in bird communities. Nat. Commun. 2020, 7, 1–10. [Google Scholar] [CrossRef]
  46. Meunier, F.D.; Verheyden, C.; Jouventin, P. Use of roadsides by diurnal raptors in agricultural landscapes. Biol. Conserv. 2000, 92, 291–298. [Google Scholar] [CrossRef] [Green Version]
  47. Blanco, G.; Bravo, C.; Chamorro, D.; Lovas-Kiss, A.; Hiraldo, F.; Tella, J.L. Herb endozoochory by cockatoos: Is ‘foliage the fruit”? Austral. Ecol. 2020, 45, 122–126. [Google Scholar] [CrossRef]
  48. Hernández-Brito, D.; Carrete, M.; Blanco, G.; Romero-Vidal, P.; Senar, J.C.; Mori, E.; White, T.H., Jr.; Luna, A.; Tella, J.L. The Role of Monk Parakeets as Nest-Site Facilitators in Their Native and Invaded Areas. Biology 2021. (under review). [Google Scholar]
  49. Darras, K.; Batáry, P.; Furnas, B.J.; Grass, I.; Mulyani, Y.A.; Tscharntke, T. Autonomous sound recording outperforms human observation for sampling birds: A systematic map and user guide. Ecol. Appl. 2019, 29, e01954. [Google Scholar] [CrossRef] [PubMed] [Green Version]
  50. Tella, J.; Canale, A.; Carrete, M.; Petracci, P.; Zalba, S.M. Anthropogenic Nesting Sites Allow Urban Breeding in Burrowing Parrots Cyanoliseus patagonus. Ardeola 2014, 61, 311–321. [Google Scholar] [CrossRef] [Green Version]
  51. Carrete, M.; Tella, J.L. Individual consistency in flight initiation distances in burrowing owls: A new hypothesis on disturb-ance-induced habitat selection. Biol. Lett. 2010, 6, 167–170. [Google Scholar] [CrossRef] [Green Version]
  52. Carrete, M.; Tella, J.L. Inter-individual variability in fear of humans and relative brain size of the species are related to con-temporary urban invasion in birds. PLoS ONE 2011, 6, e18859. [Google Scholar] [CrossRef] [Green Version]
  53. Buckland, S.; Marsden, S.J.; Green, R.E. Estimating bird abundance: Making methods work. Bird Conserv. Int. 2008, 18, S91–S108. [Google Scholar] [CrossRef] [Green Version]
  54. Keller, C.M.; Scallan, J.T. Potential roadside biases due to habitat changes along breeding bird survey routes. Condor 1999, 101, 50–57. [Google Scholar]
  55. Romero-Vidal, P.; Barbosa, J.M.; Blanco, G.; Hiraldo, F.; Carrete, M.; Tella, J.L. Deforestation or overharvesting? Pet-keeping cultural burden rather than habitat transformation causes selective parrot defaunation in Costa Rica. 2021. (in preparation) [Google Scholar]
  56. Gilardi, J.D.; Munn, C.A. Patterns of Activity, Flocking, and Habitat Use in Parrots of the Peruvian Amazon. Condor 1998, 100, 641–653. [Google Scholar] [CrossRef]
  57. Española, C.P.; Collar, N.J.; Marsden, S.J. Are populations of large-bodied avian frugivores on Luzon, Philippines, facing imminent collapse? Anim. Conserv. 2013, 16, 467–479. [Google Scholar] [CrossRef]
  58. Rivera-Milán, F.F.; Simal, F.; Bertuol, P.; Boomer, G.S. Population monitoring and modelling of yellow-shouldered parrot on Bonaire, Caribbean Netherlands. Wildl. Biol. 2018, 2018, wlb.00384. [Google Scholar] [CrossRef] [Green Version]
  59. Dénes, F.V.; Silveira, L.F.; Beissinger, S.R. Estimating abundance of unmarked animal populations: Accounting for imperfect detection and other sources of zero inflation. Methods Ecol. Evol. 2015, 6, 543–556. [Google Scholar] [CrossRef]
  60. Zulian, V.; Müller, E.S.; Cockle, K.L.; Lesterhuis, A.; Júnior, R.T.; Prestes, N.P.; Martinez, J.; Kéry, M.; Ferraz, G. Addressing multiple sources of uncertainty in the estimation of global parrot abundance from roost counts: A case study with the Vina-ceous-breasted Parrot (Amazona vinacea). Biol. Conserv. 2020, 248, 108672. [Google Scholar] [CrossRef]
  61. Geary, M.; Brailsford, C.J.; Hough, L.I.; Baker, F.; Guerrero, S.; Leon, Y.M.; Collar, N.J.; Marsden, S.J. Street-level green spaces support a key urban population of the threatened Hispaniolan parakeet Psittacara chloropterus. Urban. Ecosyst. 2021, 1–8. [Google Scholar] [CrossRef]
  62. Barbosa, A.E.A.; Tella, J.L. How much does it cost to save a species from extinction? Costs and rewards of conserving the Lear’s macaw. R. Soc. Open Sci. 2019, 6, 190190. [Google Scholar] [CrossRef] [PubMed] [Green Version]
  63. Dupin, M.K.; Dahlin, C.R.; Wright, T.F. Range-Wide Population Assessment of the Endangered Yellow-Naped Amazon (Amazona auropalliata). Diversity 2020, 12, 377. [Google Scholar] [CrossRef]
Figure 1. Roadside surveys allowed us to record from (a) the smallest (green-rumped parrotlet Forpus passerinus) to (b) the largest parrot species (hyacinth macaws Anodorhynchus hyacinthinus) through 98 surveys conducted in 20 countries (c). The surveyed areas are roughly depicted with red ellipses over the world biomes. Each area may include several surveys, biomes, and ecoregions. The inserted pie chart shows the percentage of surveys conducted within each biome. Photographs: José L. Tella.
Diversity 13 00300 g001
Figure 2. Univariate relationships between the percentage of aural encounters (i.e., when parrots were only heard), and (a) their body mass (in g), (b) their average flock size (number of individuals/number of visual encounters), and (c) the biomes surveyed in 191 study cases with at least 15 encounters per parrot species. Red lines (in a,b) and bars (in c) show 95% confidence intervals. See Results for multivariate analyses.
Diversity 13 00300 g002
Figure 3. Univariate relationships between the probability of detection (P) of parrots obtained through distance sampling (DS) modeling and (a) parrot body mass (in g), (b) average flock size (number of individuals/number of visual encounters), and (c) the biomes surveyed for 208 study cases with at least 10 visual encounters at distances ≤ 500 m per parrot species. Black dots (in a,b) correspond to extremely low, questionable P values (see text for more details). Red lines (in a,b) and bars (in c) show 95% confidence intervals. See Results (Section 3.3.2) for multivariate analyses.
Diversity 13 00300 g003
Figure 4. Relationship between (a) the relative abundance (individuals/km) and density (individuals/km2) of parrots when including densities obtained from questionable probabilities of detection (black dots) and (b) excluding them, and (c) between the estimated relative abundance (i.e., (number of observed individuals + number of estimated heard individuals)/km) and density (individuals/km2) of parrots when including densities obtained from questionable probabilities of detection (black dots) and (d) excluding them. Densities were obtained through distance sampling modeling for 208 study cases with at least 10 visual encounters at distances < 500 m. Red lines represent the 95% CI for the regression lines.
Diversity 13 00300 g004
Figure 5. Several study cases and species were excluded from DS modeling because they did not met the minimum number of visual contacts to allow for estimating probabilities of detection and densities. (a) Study cases excluded (64% of 575) corresponded to species with lower relative abundances; (b) Species excluded (47% of 137) showed a poorer global conservation status (LC: Least Concern, NT: Near Threatened, VU: Vulnerable, EN: Endangered, CR: Critically Endangered).
Diversity 13 00300 g005
Table 1. Comparison of strengths (+) and weaknesses (-) when using distance sampling modeling (DS Yes) or not (DS No) for estimating parrot abundances through roadside surveys, attending to the shortcomings of both methods and the objectives of studies. Equal signs (=) denote similar performance.
DS
Yes
DS
No
Justification
Sampling effectiveness
Attraction effect-+DS may inflate densities of parrots attracted by roadside resources
Avoidance effect+-DS may account for the potential avoidance of highly transited roads
Aural-only encounters-+Estimating distances for DS from non-visual encounters is challenging
Flying individuals==Including flying individuals should not affect results from roadside surveys
Uncommon species-+Encounters of naturally scarce and threatened species are not sufficient for DS
Gregarious species-+Encounters of common but highly gregarious species may not be sufficient for DS
Detectability+-DS allows the correction of abundances for distance-dependent detectability and associated covariates
Methodological constraints
Survey length-+DS requires longer surveys to obtain enough encounters for statistical modelling
Time invested-+Time saved by not recording distances allows for longer surveys
Data analysis-+DS requires statistical modeling instead of simple divisions
Output variables
Single-species abundance+-More accurate estimates can be obtained through DS for common species
Multi-species abundances-+DS excludes a high percentage of species
Occupancy-+Only presence/absence data are required
Species richness-+DS is not needed
Species diversity-+DS excludes a high percentage of species
Density+-DS allows for calculating densities for species with enough encounters
Population size+-DS allows extrapolating densities to the species distribution and thus estimating population size
Publisher’s Note: MDPI stays neutral with regard to jurisdictional claims in published maps and institutional affiliations.

