
Consumption Patterns of a Generalist Omnivore: Eastern Box Turtle Diets in the Long Island Pine Barrens

1
Department of Biology, Hofstra University, Hempstead, NY 11549, USA
2
Brookhaven National Laboratory, P.O. Box 5000, Upton, NY 11973, USA
*
Author to whom correspondence should be addressed.
Diversity 2021, 13(8), 345; https://0-doi-org.brum.beds.ac.uk/10.3390/d13080345
Submission received: 6 May 2021
/
Revised: 20 July 2021
/
Accepted: 22 July 2021
/
Published: 28 July 2021
(This article belongs to the Special Issue Reptile Community Ecology and Conservation)
Abstract
:Eastern Box Turtles (Terrapene carolina) are diet generalists and as such are predicted to have diverse diets in which familiar, low-quality foods are eaten consistently at low levels, and high-quality foods are rare but eaten whenever available. Previous work showed that they feed opportunistically on seasonally available plants (shoots, leaves, flowers, and fruit), invertebrates, mushrooms, and occasionally carrion. We used fecal samples to test optimal foraging predictions relevant to diet generalists and also whether the Eastern Box Turtle diets varied seasonally in a northeastern U.S. pine-oak habitat. We found that in-depth prey species consumption patterns of six different individuals were similar to those of the sampled population overall. Leaf and stem material was consumed by 100% of the turtles in all months despite being lower-quality than other prey available. Invertebrates were consumed by at least 80% of turtles in every study period; Coleopterans were found more commonly than other invertebrates. Snails were not eaten by more than 20% of the turtles in any study period, and mushroom consumption varied from 31–75% of samples in different study periods. Monthly diet overlap was measured using both Pianka’s Index of Overlap (PIO) and the Morisita–Horn Index (MH). The PIO method indicated that the prey consumption patterns were broadly similar from June–October, while the M–H method showed that only the July vs. August comparison was highly similar. The turtle diets changed only slightly between seasons, and they conform to predictions of diet generalist models usually applied to mammals.
1. Introduction
Diet Generalists are able to take advantage of a wide range of food types, but their diets are presumably also disadvantaged regarding some highly profitable food types that only specialists can use efficiently [1,2,3,4,5]. Diet generalists exist because high-quality (such as high calorie, or high protein) diet items are rare or difficult to obtain, thus even species that can occasionally exploit high-quality prey must supplement their diets with low-quality prey as well. For example, feeding on abundant leaves may incur relatively low search costs, but leaves may be difficult to digest efficiently. In contrast, high calorie foods, such as nectar and carrion, may only be readily available to specialists. In addition, diet generalists must face the challenges of diverse prey defenses such as plant secondary compounds, while specialists can co-evolve to counter such defenses. The diet-breadth trade-off hypothesis [1] suggests that diet generalists should consume only small amounts of each plant species to reduce the possibility of poisoning via any particular plant secondary compounds. Ref. [1] further predicted generalists should: (1) need to consume some familiar prey species regularly, feeding on them whenever available; (2) prefer to utilize minimally toxic prey; and (3) have searching strategies and body sizes that balance the number of prey species and the total amount of food eaten.
Diet generalists may also consume generally low-quality prey to obtain micronutrients that are lacking in high-quality (protein or calorie) prey items. For example, Speke’s hinge-back tortoise (Kinixys spekii), when offered a varied diet including leaves, fungi, and invertebrates, preferred a mixed diet, despite the fungi having the highest calorie content. This was possibly due to the limited calcium and sodium:potassium ratios of mushrooms compared with millipedes and leaves that were also provided [6].
Diet generalists inevitably engage in diet mixing, which can balance nutrients and dilute toxins [7,8] and increase the possibility of additive effects on digestive efficiency. Consuming multiple types of prey can increase digestion rates and increase energy uptake rates [6]. Ref. [9] showed that due to additive effects, the omnivorous Pond Slider (Trachemys scripta scripta) had a higher digestive efficiency when fed a mixed diet, similar to its natural diet, than what was predicted from single prey species alone.
Optimal foraging models with applications for diet generalists, such as [1,2,4,5], have been applied widely to mammals e.g., [10,11,12], birds e.g., [13,14,15], lizards e.g., [16,17], and invertebrates e.g., [4,18,19], but rarely to turtles. This is surprising because many well-studied turtle species, such as the Snapping Turtle (Chelydra serpentina), Loggerhead Sea Turtle (Caretta caretta) and Yellow-Bellied Slider (Trachemys scripta) are diet generalists, as are many tortoises. In fact, two studies of tortoises [6,20,21] that both eat a wide diversity of terrestrial plants, fungi, and invertebrates, are the only previous applications of diet generalist models to turtles.
Eastern Box Turtle diets have been explored through examinations of gut contents and fecal samples [22,23,24,25,26,27], and anecdotal reports summarized in [28,29]. These show that Eastern Box Turtles are diet generalists that eat a diverse range of prey species, including leaves, fruit and berries, fungi, beetles, lepidopterans, gastropods, diplopods, feces, and carrion reviewed by [28,29]. In fact, they are remarkably nondiscriminatory predators, consuming birds, soil, stones, bone, paper, and plastic [30,31,32] M. Figueras pers. obs. Eastern Box Turtles regularly consume high fiber, tough plant material, including grass, plant roots, shoots, and leaves [27]. These materials are often easily accessible but often involve high lignin and cellulose content and lower calorie availability. Eastern Box Turtles also avidly eat high calorie, easily digestible prey, such as fruit, carrion, and earthworms [33,34].
More precise analysis of Eastern Box Turtle diets is limited by difficulties in comparing previous studies, which differ in the types, number, and timing of sample collecting. In addition, gut and fecal sampling have led to different levels of resolution of prey species identification. In general, gut samples allow for more specific prey identification. Klimstra and Newsome [25] reported over 130 identifiable prey species in Eastern Box Turtle gut samples, whereas Platt et al. [32] was only able to assign prey items from fecal samples to broad diet categories, such as Insect, Gastropod, Crustacean, and Fish.
Some of the variation in reported Eastern Box Turtle diets is probably also associated with seasonal prey availability. Klimstra and Newsome [25] found that the volumes of food found in Eastern Box Turtle guts increased after turtles became active in March, peaking in June. After June, volumes of food in the guts decreased until October. They also noted that while diets differed seasonally, most variation was within prey families or genera. Fleshy fruits and insects were major components of the diet throughout the year, but seasonal availability led to changes in the specific fruit and insects consumed. Surface [22] similarly reported that seasonally available fruits made up a large portion of Eastern Box Turtle diet items. Fruit was generally eaten after ripening and falling to the ground [22]. Seasonality is less obvious in other Eastern Box Turtle diet studies, because most studies combined data from fecal samples collected throughout the active season, or collected during only one season. For example, Platt et al. [32] collected samples during the wet season and discussed whether seasonal differences in prey availability throughout the active period could be correlated with dietary shifts.
We sought to test the relevant predictions of the diet-breadth trade-off hypothesis [1] and explore the seasonality of Eastern Box Turtle diets in the pine-oak forests of the northeastern United States, specifically the nutrient-poor Pine Barrens area of eastern Long Island, New York. Previous diet studies of Eastern Box Turtles were performed in habitats very different from the Pine Barrens. Klimstra and Newsome [25] performed their study in a Midwestern agricultural area, with small, forested patches, Platt et al. [32] conducted their study in a Slash Pine (Pinus elliottii)-dominated habitat on a barrier island in south Florida, and Stuart and Miller [27] conducted their study in the Piedmont Plateau of North Carolina in mixed hardwood and mixed pine forests.
Furthermore, many of the previous Eastern Box Turtle diet studies were primarily anecdotal reports [33] or included data from only a few individuals. We aimed to test some of the hypotheses from Freeland and Janzen [1], while also repeatedly sampling the same individuals to rigorously test seasonal variation in turtle diets and minimize the effects of inter-individual variation. We applied more quantitative techniques than previous studies, which generally did not use robust statistical tests.
2. Materials and Methods
Eastern Box Turtles (Terrapene carolina) are terrestrial turtles that inhabit mesic woodlands in much of the eastern United States [1]. We studied Eastern Box Turtles at Brookhaven National Laboratory (BNL), near the geographic center of Long Island, (40.883° N, −72.870° W, datum = WGS84), New York. The BNL includes 2131 ha of forested habitat within the Long Island Pine Barrens (LIPB) region. The LIPB is intermediate between a humid subtropical climate and a humid continental climate [35], and is composed of pine-oak forests, containing Pitch Pine (Pinus rigida) and White Oak (Quercus alba), Scarlet Oak (Q. rubra), and Black Oak (Q. velutina). Common LIPB ground cover species that are also regular Eastern Box Turtle prey included Black Huckleberry (Gaylussacia baccata) and Lowbush Blueberry (Vaccinium angustifolium). Ground cover is sparse in some areas, while common species include Bracken Fern (Pteridium aquilinum), Wintergreen (Gaultheria procumbens), and Pennsylvania Sedge (Carex pensylvanica) [36]. Wildfires, once common, have been less common over the past 70 years due to fire suppression [37], but currently, this site is mostly fire-maintained.
All procedures were pre-approved by Hofstra University’s Animal Care and Use Committee (April 2014, Protocol 13/14–10), and Brookhaven National Laboratory’s Animal Care and Use Committee, and the New York State Department of Environmental Conservation LCP #894.
We collected multiple fecal samples from 26 adult female Eastern Box Turtles that were radio-tracked as part of a long-term movement study. We used only adult females to eliminate the possibility of between-sex differences and data were not available from enough males for meaningful between-sex analyses. The turtles were weighed, measured (straight line carapace), and individually notched before transmitters were attached to their carapaces. We located up to 20 of these turtles in the field once per month in June, July, August, and October 2014, and brought them to the laboratory to soak individually overnight in 5 cm of tap water to facilitate defecation. After 24 h, we collected the resulting fecal samples, and the turtles were released where previously located.
Fecal samples were sieved through a 0.1 mm sieve and stored at −20 °C until prey were identified and categorized. Seeds, other plant materials, and hard-bodied invertebrates were separated from other materials and examined using a dissecting microscope. Seeds were identified to genus, using guides [38,39,40,41] and museum specimens for comparison. Invertebrates were identified to Order when possible, using exoskeleton, wings, or other identifiable structures.
We compiled presence/absence data for each sample, during the four sampling periods, for each of the diet categories. Percent frequency of occurrence (PFO) was calculated for each diet category, PFO being the number of samples within a sampling period containing a specific diet item belonging in that category, divided by the number of samples. Thus, PFO provides a measure of variability in prey consumption in each of the four sampling periods.
We used two methods for measuring dietary overlap between the four sampling periods. First, we used Pianka’s Index of Overlap (PIO) to compare the proportion of each resource (prey species/category) utilized during each sampling period and to calculate a single measure of diet overlap for each pairwise comparison [42,43,44,45]. One benefit of this analysis is that it can be performed with PFO, a measure that does not include volumes or numbers of prey items. The PIO equals 1.0 when there is identical resource use (100% diet overlap), and 0.0 when there is no diet overlap. We compared the observed Pianka’s O values between sampling periods with a null model generated by randomized observed data within sampling periods, using the RA3 randomization algorithm bootstrapped 100,000 times using the EcosimR [46] package of the R open-source software environment (version 3.4.1; [47]) within the RStudio (version 1.0.153; [48]).
O values generated by these null models were used to determine whether the overlaps calculated between sampling periods were significantly different from random chance by measuring how much the likelihoods of the observed O values differed from the average simulated O value in the null model. By generating frequency distributions, the probability that the observed overlap occurred could be compared with the 100,000 possible randomized distributions [49]. This test is particularly sensitive to differences in rare prey item frequencies [50].
We similarly used the Morisita–Horn Index (M–H) to also measure the degree of overlap [45,51,52,53] between diets in different sampling periods, using the ‘mh’ function in the R package ‘divo’ of the R open-source software environment (version 3.4.1; [47] within the RStudio (version 1.0.153; [48]). The M–H test was chosen because its results are robust even with small sizes and despite the sensitivity to abundant species [54].
We also performed a Kruskal–Wallis test to compare the number of prey species found among the fecal samples from sampling period. This was done by summing the number of distinct prey items (= richness) found in each fecal sample, and comparing the samples of richness values among the sampling period.
3. Results
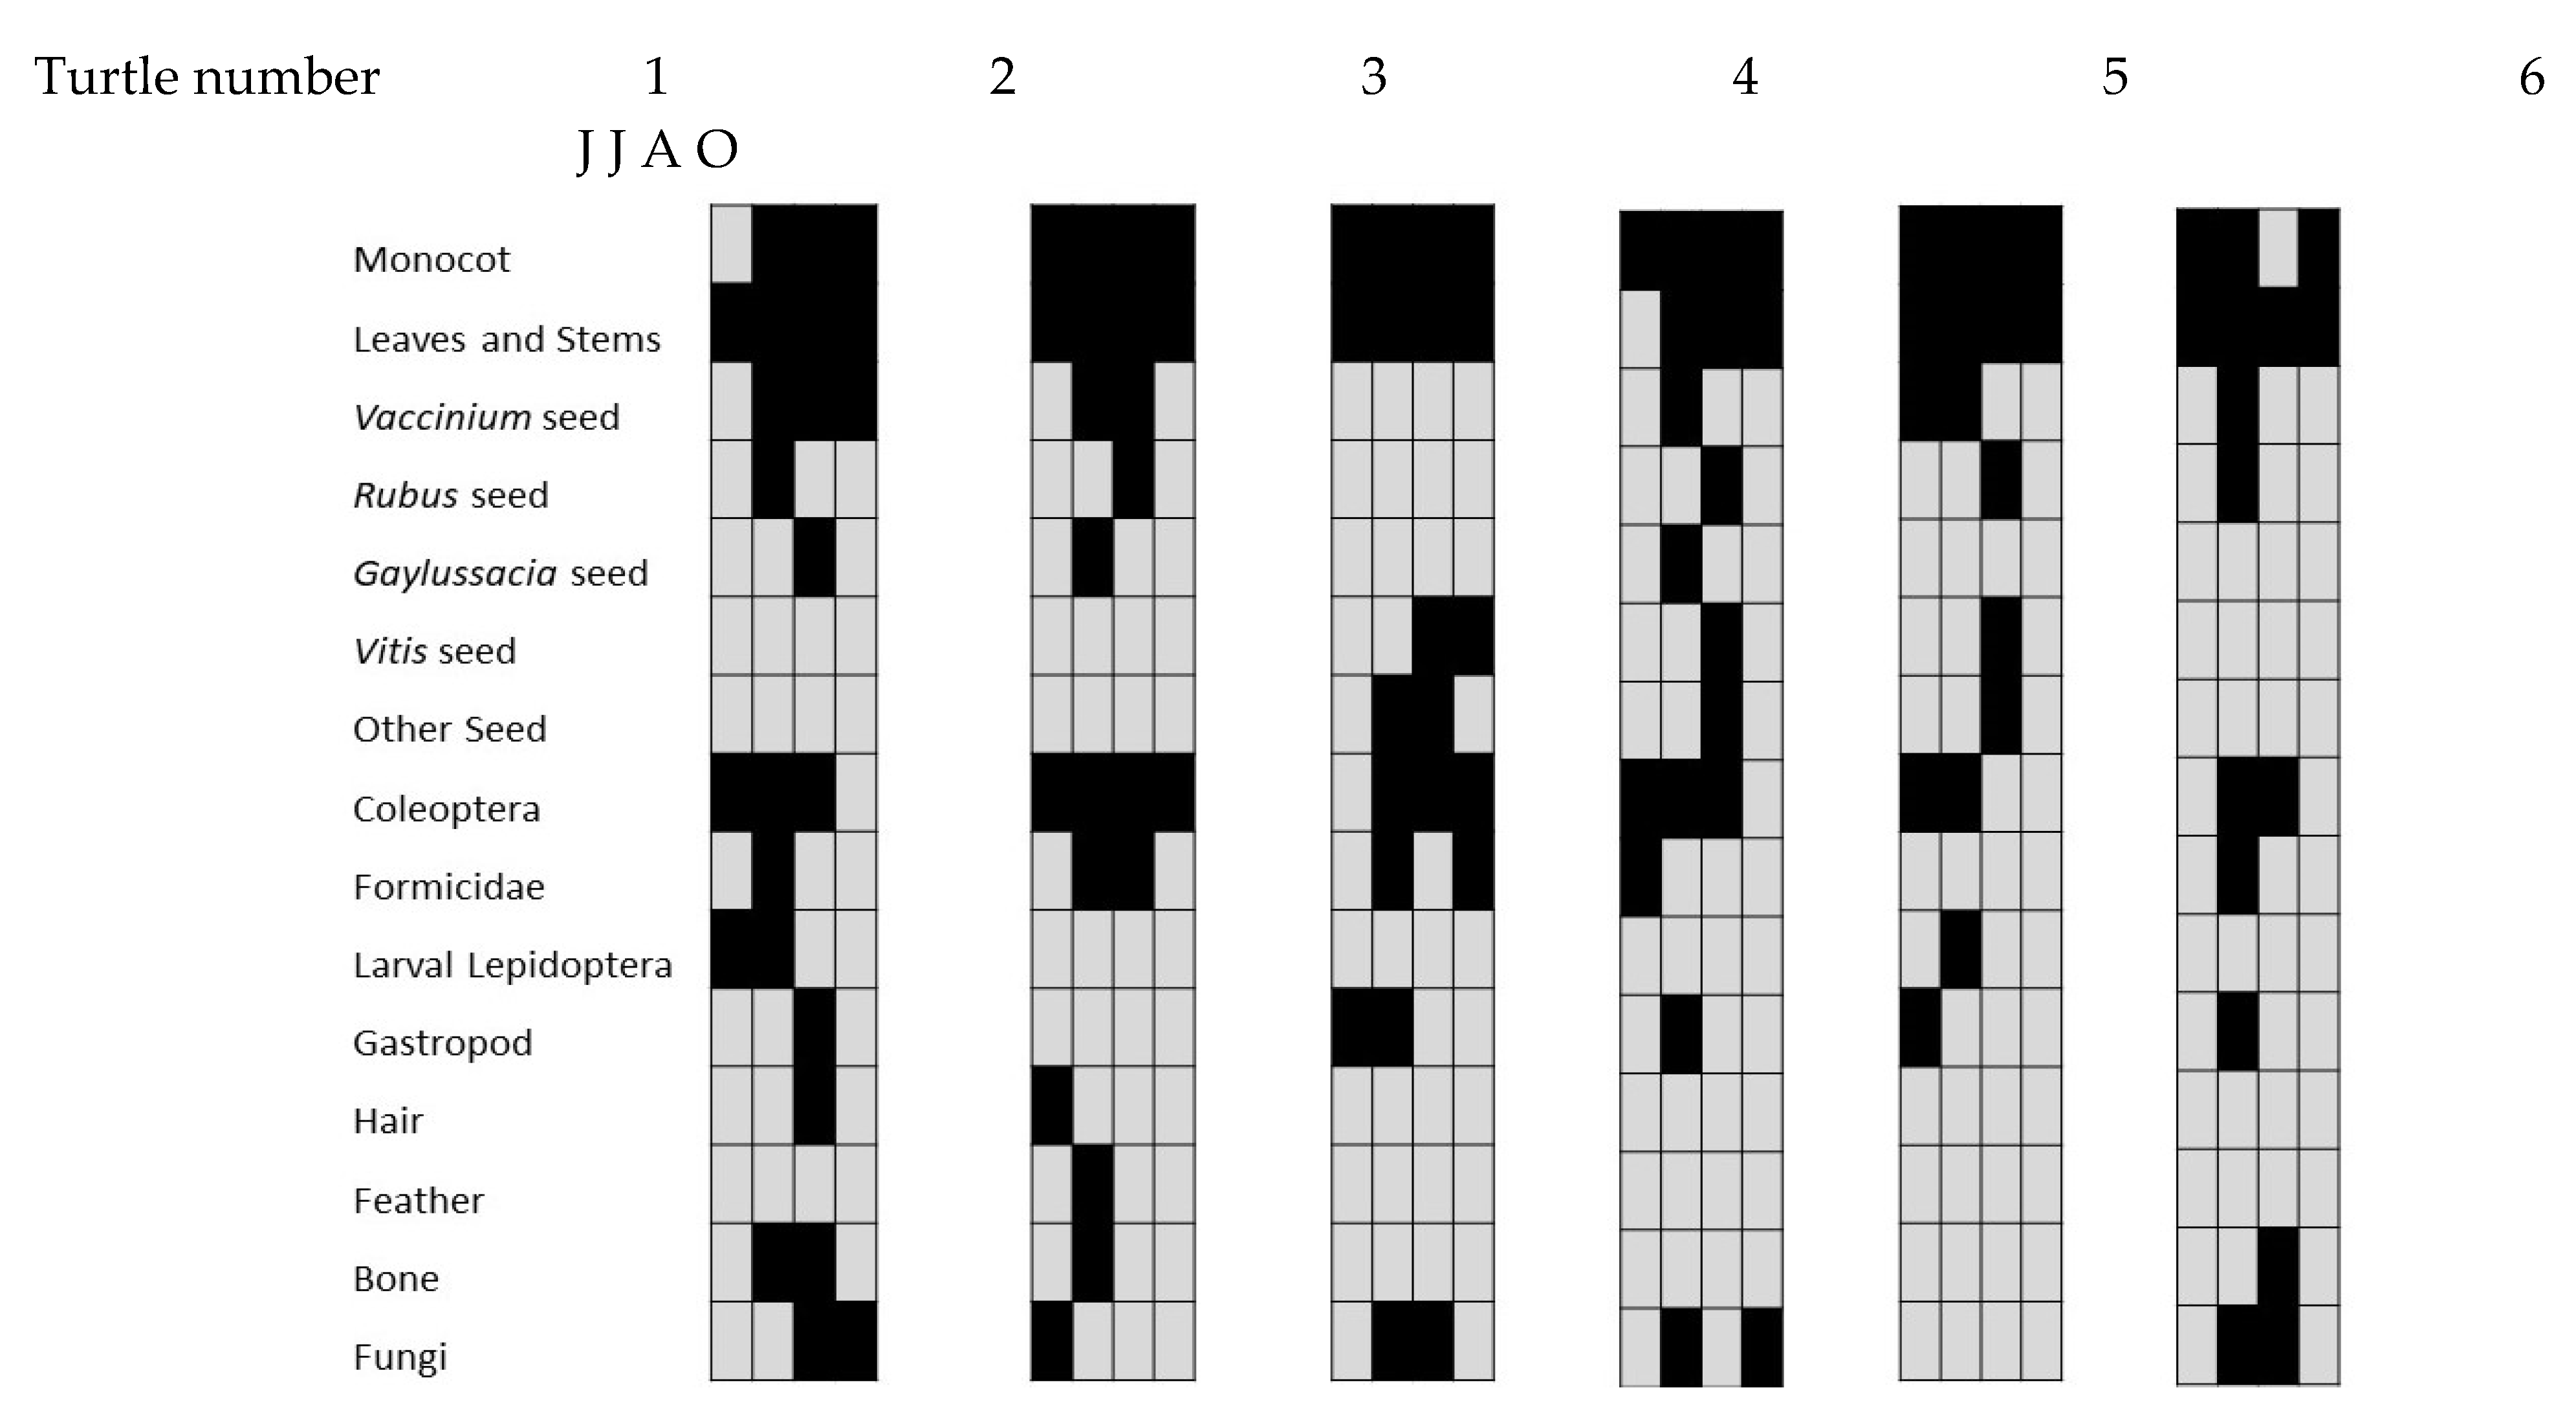
We collected 62 fecal samples from Eastern Box Turtles during 2014, on 15 June, 15 July, 16 August, and 16 October. No individuals were sampled more than once in any 30-day period. Invertebrates were combined into a single prey category, because many fecal samples contained portions of digested and unidentifiable invertebrate species. Some Coleoptera and larval Lepidoptera could be identified using the elytra of beetles and the bristles of caterpillars. Plant material was also combined into seven categories (Figure 1), as much of this material was degraded by digestion. Monocots (grass) were separated from dicot plant material based on leaf shape and venation patterns.
Six individual Eastern Box Turtles were sampled during all of the sampling months, and their diet categories consumed appeared to vary somewhat between individuals (Figure 1). Plant material (monocot and dicot) was regularly consumed by all individuals, and the fecal samples from three individuals contained vertebrate material during at least one of the sampling periods (Figure 1).
Plant material (monocot or dicot) was found in 100% of the fecal samples, while dicot plant material alone was the next most frequent of all prey items (Table 1). Dicot leaves and stems were found in a high percentage of fecal samples in June, July, August, and October (86.67%, 100%, 100%, and 100%, respectively, 96.77% overall). Seeds were relatively abundant in samples collected in July, with the highest species diversity of seeds found in samples collected in August (Table 1). Seeds from the Vaccinium spp. were found in fecal samples during all months sampled, although these fruits typically ripen in July. Vertebrate prey remains (bone, hair, or feathers) were found in many more of the fecal samples in June (40% of samples) than in October (6%) (Table 1). Two out of nine fecal samples containing hair also contained bone, while one of the two samples containing feathers also contained bone.
The analysis of Eastern Box Turtle diet overlap using Pianka’s O indicated that all pairwise comparisons were more similar than expected by random chance (Table 2). June and July (O = 0.87, p < 0.01), June and August (O = 0.81, p = 0.02), June and October (O = 0.83, p = 0.01), July and August (O = 0.89, p < 0.01), July and October (O = 0.76, p = 0.02), and August and October (O = 0.99, p < 0.01) had O values higher than would have been expected based on comparison with the null models (Table 2).
Our analysis of Eastern Box Turtle diet overlap using the Morisita–Horn Index indicated that June and August (ʎ = 0.79, 95% CI = 0.77–0.79) was the only pairwise comparison that was more similar than expected by random chance. The comparison between July and August resulted in an overlap that was nearly significant with an overlap of 0.84, and an upper 95% Confidence Interval of 0.80. The comparisons between June vs. July, June vs. October, July vs. October, and August vs. October did not yield any significant patterns (either more similar or more different than random) (Table 2).
There was a significant difference in the number of prey items found in fecal samples collected during different months (Table 3). The Kruskal–Wallace test showed that the number of prey items in a fecal sample was significantly affected by the month sampled (H = 21.03, d.f. = 3, p < 0.0001). Analyses using Conover post hoc tests for significance indicated that the average number of diet items per individual was significantly lower in June than in August (p = 0.0153), October vs. July (p = 0.0003), and October vs. August (p < 0.0001). All other comparisons found no significant differences (June vs. July p = 0.0601, June vs. October p = 0.1590, July vs. August p = 0.5527).
4. Discussion
We found that Eastern Box Turtles eat a diverse diet, as expected for generalist omnivores. Some of the differences in the findings of similar diet studies and this study can be explained by differences in the use of gut samples versus fecal samples. Gut transit times in Eastern Box Turtles can be more than 20 days [55], which causes fecal samples to be especially degraded. Studies using gut samples [22,25,27] were able to identify prey to species in some cases. However, given the declining number of Eastern Box Turtles range-wide [56], it is not acceptable to sacrifice them for ecological studies. We rejected stomach flushing because Fields et al. [57] reported difficulties obtaining samples without causing internal damage, and we were concerned that repeatedly stomach flushing the same individuals would affect their behavior. Studies based on fecal samples have generally been unable to identify prey to a similar resolution due to digestion [32], but nevertheless have been useful for indicating consumption patterns.
We did not attempt to quantify individual prey items by mass or number, because these values would have been too unreliable. For example, many preys, such as Coleopterans, were mostly digested, leaving only parts of chitinous exoskeletons from which the number of individuals could not be estimated. Prey items were not weighed, because many prey items are partially digested and could not be clearly separated. We were able to identify invertebrate prey to a resolution similar to that of Platt et al. [32], who also used fecal samples, but we were unable to identify prey to as low a taxonomic level as Klimstra and Newsome [25] or Surface [22] who used gut samples.
Another difference between this study and previous studies was our ability to repeatedly sample individuals. This allowed us to minimize the impact of inter-individual variation, and thus focus on potential seasonal changes in diet within a specific group of individuals. The six Eastern Box Turtle individuals sampled in all four sampling periods displayed patterns similar to the patterns seen overall, which suggests that there was relatively little variation among individuals and the overall pattern was representative of individual behaviors. Monocot and dicot (leaves and stems) were consumed by all six turtles in nearly every sampling period. One individual consumed Coleoptera in every sampling period, while the other individuals did so in only two or three, but in different periods. While consumption of vertebrate prey was common, feces from half of the individual turtles did not have vertebrate remains at all (Figure 1). The similarity of individual dietary patterns to population dietary patterns supports the conclusion of a generalist foraging strategy for Eastern Box Turtles at multiple levels.
We found that invertebrates were a substantial part of Eastern Box Turtle diets. Coleopteran were the most frequently observed invertebrate prey type (Table 1), which was similar to previous studies (e.g., 22, 25). The high frequency of Coleoptera may in part be due to their hard exoskeletons, making them relatively hard to digest and easy to identify in feces. Although earthworms are probably often eaten by Eastern Box Turtles, we did not detect them in any feces. We presume this is because they are highly digestible, and note that no studies based on fecal samples have detected earthworms. Gastropods were in 14.5% of fecal samples overall (Table 1). Barbour [23], Bush [24], and Klimstra and Newsome [25] also noted the importance of gastropods in Eastern Box Turtle diets, whereas Platt et al. [32] reported that gastropods were the most frequently consumed type of invertebrate, found in 92.8% of fecal samples.
We did not collect data on prey availability but note that Klimstra and Newsome [25] reported that the availability of prey species was not the sole factor influencing Eastern Box Turtle consumption patterns. Some invertebrates common at their study site, (i.e., faster-moving Coleoptera or Chilopoda, Staphylinidae, and Philomycus) were not regularly consumed, whereas other invertebrates consumed by Eastern Box Turtles could not be located by researchers during standard invertebrate surveys. They found that Eastern Box Turtles did not readily eat Formicidae (ants), despite the turtles regularly taking refuge under logs where Formicidae were present in large numbers. In contrast, we found high levels of Formicidae consumption, especially in July, with over 1/3 of samples containing identifiable Formicidae exoskeletons (Table 1).
Fibrous plant material (such as leaves and stems) was found in nearly all Eastern Box Turtle feces in this study (Table 1), which concurs with most previous studies (e.g., 22, 25, 27). Conversely, Bush [24] and Strang [26] found that Eastern Box Turtles did not eat large quantities of plant material other than fruit and flowers and did not eat leaves. It is unclear what caused this disparity.
The regularly high consumption levels of leaves and stems by Eastern Box Turtles is surprising because of the high cellulose and lignin content of these materials. The Jarman–Bell principle [58,59,60] predicts that herbivore body size varies negatively with dietary nutritional quality, because low-quality diets require increased gut capacity, longer retention times, or larger food intake. For example, large-bodied tortoises tend to be herbivorous, and small-bodied tortoises combine herbivory and invertivory [61]. In contrast to Terrapene, many tortoises specializing in grass consumption have hindgut fermentation and longer passage rates to accommodate the difficulty in digesting this type of plant material [61,62,63]. Terrapene are small-bodied turtles (ca. 425–600 g), similar to that of herbivorous/invertivorous Speke’s hinge-back tortoise. However, Eastern Box Turtles apparently lack the specialized gut morphology needed to efficiently digest cellulose-rich plant material (Burke, unpub. data) and which are common in tortoises [61]. Unfortunately, the only study of Eastern Box Turtle digestive efficiency was limited to fruit [64], and nothing is known about the Eastern Box Turtle gut microbiome, unlike tortoises e.g., [61,65,66] or sea turtles [67]. We suggest that further investigation of Terrapene adaptations for consumption of terrestrial plants could be especially interesting, especially because this clade diverged from freshwater ancestors only ca 14.25 mya [68].
It appears that the Eastern Box Turtle diets did not vary significantly by collection period. Whereas their long gut passage time [55] may have reduced our ability to detect seasonal changes, the 30 days between sampling in this study reduced the likelihood that diet items consumed in one sample would be observed in a subsequent sample. Our failure to detect seasonal variation may be due to the resolution with which we could identify diet items. Klimstra and Newsome [25] showed that when prey were only identified to the level of Order, prey did not vary by season, but consumption of specific prey species still varied according to seasonal availability. We were unable to detect changes within Orders for most prey types because of the low resolution with which we were able to identify prey. Although fruit was consumed throughout the active season, we did detect changes in the fruit species consumed each sampling month, similar to Klimstra and Newsome [25]. Early in the summer, Vaccinium sp. were consumed, but by October they were no longer eaten, while Vitis sp. consumption increased (Table 1). Within the LIPB different Vaccinium sp. ripen during somewhat different but discrete times throughout the summer, and one possibility for why diet did not differ detectably by month was that turtles may extend fruit consumption seasons. Eastern Box Turtles consumed berries before they were ripened, while they were still green and seem to be mostly indigestible (M. Figueras, personal observation) and continued to consume them after they fell to the ground.
Invertebrate consumption was also non-seasonal at a coarse level, with 90% of fecal samples containing invertebrate remains. However, the frequency that some Families were consumed varied by month; larval lepidopteran remains were found most frequently in samples from June and July with PFOs of 33.33% and 40%, respectively, but much less frequently in August and October (Table 1). Similarly, Coleopterans were consumed during each sampling period, but with the lowest PFO in October.
Pianka’s Index of Overlap (PIO) showed that the PFO of diet items consumed was highly similar among all months sampled (Table 2). This test is more sensitive to rare diet items than the M–H Index, which is robust with small sample sizes and predominantly influenced by common diet items [54]. The M–H Index detected only that the July vs. August pairwise comparison was significantly more similar than expected by chance (Table 2). Thus, opportunistic consumption of rare items, such as vertebrate remains like feathers and bone, gastropods, and seasonally available fruits, probably explains the differences between the results of the PIO and M–H indices.
The number of prey items found in fecal samples in both June and October was relatively low, compared to significantly higher prey richness in July and August (Table 3). This may, in part, be due to the Eastern Box Turtles eating less at the beginning and end of their active seasons. The turtles become active in May (M. Figueras, personal observation) and begin eating, but initially eat lower volumes of food [25]. They consume food at increasingly higher rates until a peak in July and August, then by October, many diet items are no longer available, as seen by the limited number of fecal samples containing seeds. Seeds in fecal samples represent the consumption of fruit (Table 1), which, except for Vitis sp., are no longer available in October.
Freeland and Janzen [1] predicted that diet generalists would regularly consume familiar, readily available foods. We found that Eastern Box Turtles regularly consumed readily available plant material (leaves and stems) that is relatively lower quality and difficult to digest, despite lacking specialized gut morphology. Freeland and Janzen also predicted that diet generalists would utilize diet items associated with minimal toxicity. While Eastern Box Turtles eat a variety of mushrooms, no one has studied their toxicity to turtles. When higher calorie foods were available, such as fruits, the turtles consumed large amounts, shown in the number of seeds found in fecal samples.
The Eastern Box Turtles in this study also regularly consumed low-quality vegetation. This may be due to the low searching costs associated with consuming highly abundant vegetation but may also be associated with higher digestive efficiency from a mixed diet [7,8], and this should be investigated in future studies. The turtles also readily fed on medium and large animal carcasses (M. Figueras, pers. obs., also indicated by hairs found in fecal samples), which may provide them with abundant, high quality, easily digested protein, along with access to insects that also feed on carrion.
Freeland and Janzen [1] also suggested that foraging strategies and body sizes of diet generalists would be selected synergistically to maximize prey diversity (to minimize the impacts of any particular plant secondary compounds) rather than target any particular prey. Eastern Box Turtles generally live in small (ca. 7.5 ha, [69], well-defined home ranges that generally remain stable over many years, despite seasonal variability [70], and have been seen repeatedly using the same pathways [28]. They also have a well-developed homing ability [71,72]. This familiarity with a small habitat patch, along with the low energy needs associated with their small body size, may facilitate a sophisticated foraging strategy with high prey diversity.
Studies of this kind could be improved by the addition of DNA analysis of scat samples. While we were unable to identify diet items to species in most cases, this would be possible through DNA extractions of fecal samples, using universal primers. It would also be possible to quantify genetic material found in fecal samples using DNA barcoding [73,74]. Such techniques could also detect elusive prey such as earthworms and slugs, which are so highly digestible that they are very unlikely to be observed in fecal samples. DNA analysis thus offers great promise for future turtle diet studies.
Author Contributions
Conceptualization, M.P.F. and R.L.B.; methodology, M.P.F. and R.L.B.; formal analysis, M.P.F. and R.L.B.; investigation M.P.F. and R.L.B.; resources, M.P.F., T.M.G. and R.L.B.; data curation, M.P.F.; writing—original draft preparation, M.P.F.; writing—review and editing, T.M.G. and R.L.B.; supervision, T.M.G. and R.L.B.; project administration, T.M.G. and R.L.B.; funding acquisition, M.P.F., T.M.G. and R.L.B. All authors have read and agreed to the published version of the manuscript.
Funding
This research was supported by a Donald Axinn Fellowship in Ecology and Conservation awarded to M.P.F., and a Hofstra University Faculty Research and Development Grant awarded to R.L.B.
Institutional Review Board Statement
The study was conducted according to the guidelines of the Declaration of Helsinki, and approved by the Hofstra University’s Animal Care and Use Committee (April 2014, Protocol 13/14–10), and by Brookhaven National Laboratory’s Animal Care and Use Committee, and the New York State Department of Environmental Conservation LCP #894.
Data Availability Statement
Supporting data can be found in Figueras, MP. 2018. Consumption Patterns of a Generalist Omnivore: Box Turtle Diets in the Long Island Pine Barrens. M.S. thesis, Hofstra University, Uniondale, New York.
Acknowledgments
We are grateful to Lisa Filippi, Eric Rulison, Robert Seagull, and Seth Wollney for their assistance with prey species identification, and Michael Roswell, Kent Hatch, and Steven Raciti for assistance with the analysis and preparation of the manuscript.
Conflicts of Interest
The authors declare no conflict of interest.
References
- Freeland, W.J.; Janzen, D.H. Strategies in herbivory by mammals: The role of plant secondary compounds. Am. Nat. 1974, 108, 269–289. [Google Scholar] [CrossRef]
- Pulliam, H.R. On the theory of optimal diets. Am. Nat. 1974, 108, 59–74. [Google Scholar] [CrossRef]
- Huey, R.B.; Hertz, P.E. Is a jack-of-all-temperatures a master of none? Evolution 1984, 382, 441–444. [Google Scholar]
- Belovsky, G.E. Optimal foraging and community structure: Implications for a guild of generalist grassland herbivores. Oecologia 1986, 70, 35–52. [Google Scholar] [CrossRef] [Green Version]
- Abrams, P.A. Adaptive responses of generalist herbivores to competition: Convergence or divergence. Evol. Ecol. 1990, 4, 103–114. [Google Scholar] [CrossRef]
- Hailey, A.; Chidavaenzi, R.L.; Loveridge, J.P. Diet mixing in the omnivorous tortoise Kinixys spekii. Funct. Ecol. 1998, 1, 373–385. [Google Scholar] [CrossRef]
- Lefcheck, J.S.; Whalen, M.A.; Davenport, T.M.; Stone, J.P.; Duffy, J.E. Physiological effects of diet mixing on consumer fitness: A meta-analysis. Ecology 2013, 94, 565–572. [Google Scholar] [CrossRef] [Green Version]
- Groendahl, S.; Fink, P. The effect of diet mixing on a nonselective herbivore. PLoS ONE 2016, 11, e0158924. [Google Scholar] [CrossRef] [Green Version]
- Bjorndal, K.A. Diet mixing: Nonadditive interactions of diet items in an omnivorous freshwater turtle. Ecology 1991, 72, 1234–1241. [Google Scholar] [CrossRef]
- Saether, B.E. The impact of different growth pattern on the utilization of tree species by a generalist herbivore, the moose Alces alces: Implications of optimal foraging theory. In Behavioural Mechanisms of Food Selection; Hughes, R.N., Ed.; Springer: Berlin/Heidelberg, Germany, 1990; pp. 323–341. [Google Scholar]
- Bowen, W.D.; Tully, D.; Boness, D.J.; Bulheier, B.M.; Marshall, G.J. Prey-dependent foraging tactics and prey profitability in a marine mammal. Mar. Ecol. Prog. Ser. 2002, 244, 235–245. [Google Scholar] [CrossRef]
- Vorel, A.; Válková, L.; Hamšíková, L.; Maloň, J.; Korbelová, J. Beaver foraging behaviour: Seasonal foraging specialization by a choosy generalist herbivore. Behav. Ecol. Sociobiol. 2015, 69, 1221–1235. [Google Scholar] [CrossRef]
- McKnight, S.K.; Hepp, G.R. Foraging-niche dynamics of gadwalls and American coots in winter. Auk 1998, 115, 670–683. [Google Scholar] [CrossRef]
- Clarke, J.A.; Johnson, R.E. Comparisons and contrasts between the foraging behaviors of two white-tailed ptarmigan (Lagopus leucurus) populations, Rocky Mountains, Colorado, and Sierra Nevada, California, USA. Arct. Antarct. Alp. Res. 2005, 37, 171–176. [Google Scholar] [CrossRef] [Green Version]
- Ríos, J.M.; Mangione, A.M.; Marone, L. Tolerance to dietary phenolics and diet breadth in three seed-eating birds: Implications for graminivory. J. Exp. Zool. Part A Ecol. Genet. Physiol. 2012, 317, 425–433. [Google Scholar] [CrossRef]
- Dearing, M.D.; Schall, J.J. Testing models of optimal diet assembly by the generalist herbivorous lizard Cnemidophorus murinus. Ecology 1992, 73, 845–858. [Google Scholar] [CrossRef]
- van Marken Lichtenbelt, W.D. Optimal foraging of a herbivorous lizard, the green iguana in a seasonal environment. Oecologia 1993, 95, 246–256. [Google Scholar] [CrossRef] [PubMed]
- Ritchie, M.E.; Tilman, D. Predictions of species interactions from consumer-resource theory: Experimental tests with grasshoppers and plants. Oecologia 1993, 94, 516–527. [Google Scholar] [CrossRef]
- Pennings, S.C.; Nadeau, M.T.; Paul, V.J. Selectivity and growth of the generalist herbivore Dolabella auricularia feeding upon complementary resources. Ecology 1993, 74, 879–890. [Google Scholar] [CrossRef]
- Pennings, S.C.; Carefoot, T.H.; Siska, E.L.; Chase, M.E.; Page, T.A. Feeding preferences of a generalist salt-marsh crab: Relative importance of multiple plant traits. Ecology 1998, 79, 1968–1979. [Google Scholar] [CrossRef]
- Meek, R. Nutritional selection in Hermann’s tortoise, Testudo hermanni, in Montenegro and Croatia. Testudo 2010, 7, 88–95. [Google Scholar]
- Surface, H.A. First Report on the Economic Features of Turtles of Pennsylvania; Harrisburg Publishing Co.: Harrisburg, Pennsylvania, USA, 1908. [Google Scholar]
- Barbour, R.W. The reptiles of big black mountain, Harlan County, Kentucky. Copeia 1950, 1950, 100–107. [Google Scholar] [CrossRef]
- Bush, F.M. Foods of some Kentucky herptiles. Herpetologica 1959, 15, 73–77. [Google Scholar]
- Klimstra, W.D.; Newsome, F. Some observations on the food coactions of the common box turtle, Terrapene c. carolina. Ecology 1960, 41, 639–647. [Google Scholar] [CrossRef]
- Strang, C.A. Spatial and temporal activity patterns in two terrestrial turtles. J. Herpetol. 1983, 17, 43–47. [Google Scholar] [CrossRef]
- Stuart, M.D.; Miller, G.C. The eastern box turtle, Terrapene c. carolina (Testudines, Emydidae), in North Carolina. Brimleyana 1987, 13, 123–131. [Google Scholar]
- Dodd, K.C., Jr. North American Box Turtles: A Natural History; University of Oklahoma Press: Norman, OK, USA, 2002; Volume 6. [Google Scholar]
- Ernst, C.H.; Lovich, J.E. Turtles of the United States and Canada; The John Hopkins University Press: Baltimore, MD, USA, 2009. [Google Scholar]
- Anton, T.G. Predation on the house sparrow, Passer domesticus, by the Gulf Coast box turtle, Terrapene carolina major, under seminatural conditions. Bull. Chic. Herpetol. Soc. 1990, 25, 143–144. [Google Scholar]
- Beyer, N.W.; Connor, E.E.; Gerould, S. Estimates of soil ingestion by wildlife. J. Wildl. Manag. 1994, 58, 375–382. [Google Scholar] [CrossRef]
- Platt, S.G.; Hall, C.; Liu, H.; Borg, C.K. Wet-season food habits and intersexual dietary overlap of Florida box turtles (Terrapene carolina bauri) on National Key Deer Wildlife Refuge, Florida. Southeast. Nat. 2009, 8, 335–346. [Google Scholar] [CrossRef]
- Allard, H.A. The natural history of the box turtle. Sci. Mon. 1935, 41, 325–338. [Google Scholar]
- DeVault, T.L.; Brisbin, I.L., Jr.; Rhodes, O.E., Jr. Factors influencing the acquisition of rodent carrion by vertebrate scavengers and decomposers. Can. J. Zool. 2004, 82, 502–509. [Google Scholar] [CrossRef]
- Peel, M.C.; Finlayson, B.L.; McMahon, T.A. Updated world map of the Köppen–Geiger climate classification. Hydrol. Earth Syst. Sci. 2007, 11, 1633–1644. [Google Scholar] [CrossRef] [Green Version]
- Edinger, G.J.; Evans, D.J.; Gebauer, S.; Howard, T.G.; Hunt, D.M.; Olivero, A.M. (Eds.) Ecological communities of New York state. In A Revised and Expanded Edition of Carol Reschke’s Ecological Communities of New York State, 2nd ed.; (Draft for Review); New York Natural Heritage Program, New York State Department of Environmental Conservation: Albany, NY, USA, 2002. [Google Scholar]
- Jordan, M.J.; Patterson III, W.A.; Windisch, A.G. Conceptual ecological models for the Long Island pitch pine barrens: Implications for managing rare plant communities. For. Ecol. Manag. 2003, 185, 151–168. [Google Scholar] [CrossRef] [Green Version]
- Martin, A.C.; Barkley, W.D. Seed Identification Manual; The Blackburn Press: Caldwell, NJ, USA, 2000. [Google Scholar]
- Cappers, R.T.J.; Bekker, R.M. A Manual for the Identification of Plant Seeds and Fruits; Barkhuis and University of Groningen: Groningen, The Netherlands, 2014. [Google Scholar]
- Evans, A.V. Beetles of Eastern North America; Princeton University Press: Princeton, NJ, USA, 2014. [Google Scholar]
- United States Department of Agriculture (USDA). The Plants Database, National Plant Data Team, USA. 2018. Available online: http://plants.usda.gov (accessed on 30 April 2018).
- Winemiller, K.O.; Pianka, E.R. Organization in natural assemblages of desert lizards and tropical fishes. Ecol. Monogr. 1990, 60, 27–55. [Google Scholar] [CrossRef]
- de León, L.F.; Podos, J.; Gardezi, T.; Herrel, A.; Hendry, A.P. Darwin’s finches and their diet niches: The sympatric coexistence of imperfect generalists. J. Evol. Biol. 2014, 27, 1093–1104. [Google Scholar] [CrossRef]
- Ferreira, A.S.; Silva, A.D.O.; da Conceicao, B.M.; Faria, R.G. The diet of six species of lizards in an area of Caatinga, Brazil. Herpetol. J. 2017, 27, 151–160. [Google Scholar]
- Erazmus, K.R.; Figueras, M.; Luiselli, L.; Burke, R.L. Do diets vary over large spatial or temporal ranges? A test using inter-annual and inter-population data on Diamondback Terrapins (Malaclemys terrapin) diets. Can. J. Zool. 2019, 97, 251–257. [Google Scholar] [CrossRef] [Green Version]
- Gotelli, N.J.; Hart, E.M.; Ellison, A.M. EcoSimR: Null Model Analysis for Ecological Data, R Package Version 0.1.0. 2015. Available online: http://github.com/gotellilab/EcoSimR (accessed on 4 January 2018). [CrossRef]
- R Foundation for Statistical Computing. A Language and Environment for Statistical Computing. Vienna, Austria. 2016. Available online: http://www.R-project.org (accessed on 11 October 2018).
- RStudio Team. RStudio Team (2020). RStudio: Integrated Development for R. RStudio, PBC, Boston, MA. 2016. Available online: http://www.rstudio.com/ (accessed on 11 October 2018).
- Huey, R.B.; Pianka, E.R. Temporal separation of activity and interspecific dietary overlap. In Lizard Ecology Studies of a Model Organism; Huey, R.B., Pianka, E.R., Schoener, T.W., Eds.; Harvard University Press: Cambridge, MA, USA, 1983; pp. 281–296. [Google Scholar]
- Barwell, L.J.; Isaac, N.J.B.; Kunin, W.E. Measuring β-diversity with species abundance data. J. Anim. Ecol. 2015, 84, 1112–1122. [Google Scholar] [CrossRef] [Green Version]
- Bergman, C.M.; Krebs, C.J. Diet overlap of collared lemmings and tundra voles at Pearce Point, Northwest Territories. Can. J. Zool. 1993, 71, 1703–1709. [Google Scholar] [CrossRef]
- Potier, M.; Menard, F.; Cherel, Y.; Lorrain, A.; Sabatié, R.; Marsac, F. Role of pelagic crustaceans in the diet of the longnose lancetfish Alepisaurus ferox in the Seychelles waters. Afr. J. Mar. Sci. 2007, 29, 113–122. [Google Scholar] [CrossRef] [Green Version]
- Estupiñán-Montaño, C.; Pacheco-Triviño, F.; Cedeño-Figueroa, L.G.; Galván-Magaña, F.; Estupiñán-Ortiz, J.F. Diet of three shark species in the Ecuadorian Pacific, Carcharhinus falciformis, Carcharhinus limbatus and Nasolamia velox. J. Mar. Biol. Assoc. U. K. 2018, 98, 927–935. [Google Scholar] [CrossRef] [Green Version]
- Smith, E.P.; Zaret, T.M. Bias in estimating niche overlap. Ecology 1982, 63, 1248–1253. [Google Scholar] [CrossRef]
- Braun, J.; Brooks, G.R., Jr. Box turtles (Terrapene carolina) as potential agents for seed dispersal. Am. Midl. Nat. 1987, 117, 312–318. [Google Scholar] [CrossRef]
- Budischak, S.A.; Hester, J.M.; Price, S.J.; Dorcas, M.E. Natural history of Terrapene carolina (box turtles) in an urbanized landscape. Southeast. Nat. 2006, 5, 191–204. [Google Scholar] [CrossRef]
- Fields, J.R.; Simpson, T.R.; Manning, R.W.; Rose, F.L. Modifications to the stomach flushing technique for turtles. Herpetol. Rev. 2000, 31, 32. [Google Scholar]
- Bell, R.H.V. A grazing ecosystem in the Serengeti. Sci. Am. 1971, 225, 86–93. [Google Scholar] [CrossRef]
- Geist, V. On the relationship of social evolution and ecology in ungulates. Am. Zool. 1974, 14, 205–220. [Google Scholar] [CrossRef] [Green Version]
- Jarman, P.J. The social organization of antelope in relation to their ecology. Behaviour 1974, 48, 215–266. [Google Scholar] [CrossRef] [Green Version]
- Hailey, A. Digestive efficiency and gut morphology of omnivorous and herbivorous African tortoises. Can. J. Zool. 1997, 75, 787–794. [Google Scholar] [CrossRef]
- Barboza, P.S. Digesta passage and functional anatomy of the digestive tract in the desert tortoise (Xerobates agassizii). J. Comp. Physiol. B. 1995, 165, 193–202. [Google Scholar] [CrossRef] [PubMed]
- Stevens, C.E.; Hume, I.D. Comparative Physiology of the Vertebrate Digestive System; Cambridge University Press: Cambridge, UK, 1995. [Google Scholar]
- Stone, M.D.; Moll, D. Diet-dependent differences in digestive efficiency in two sympatric species of box turtles, Terrapene carolina and Terrapene ornata. J. Herpetol. 2006, 40, 364–371. [Google Scholar] [CrossRef]
- Yuan, M.L.; Dean, S.H.; Longo, A.V.; Rothermel, B.B.; Tuberville, T.D.; Zamudio, K.R. Kinship, inbreeding and fine-scale spatial structure influence gut microbiota in a hindgut-fermenting tortoise. Mol. Ecol. 2015, 24, 2521–2536. [Google Scholar] [CrossRef] [PubMed]
- Modica, B.P. Physically Effective Fiber Threshold, Apparent Digestibility, and Novel Fecal Microbiome Identification of the Leopard Tortoise (Stigmochelys pardalis). Master’s Thesis, California Polytechnic State University, San Luis Obispo, CA, USA, 2016. [Google Scholar]
- Abdelrhman, K.F.; Bacci, G.; Mancusi, C.; Mengoni, A.; Serena, F.; Ugolini, A. A first insight into the gut microbiota of the sea turtle Caretta caretta. Front. Microbiol. 2016, 7, 1060. [Google Scholar] [CrossRef] [PubMed]
- Spinks, P.Q.; Thomson, R.C.; McCartney-Melstad, E.; Shaffer, H.B. Phylogeny and temporal diversification of the New World pond turtles (Emydidae). Mol. Phylogenetics Evol. 2016, 103, 85–97. [Google Scholar] [CrossRef] [PubMed] [Green Version]
- Habeck, C.W.; Figueras, M.P.; Deo, J.E.; Burke, R.L. A surfeit of studies: What have we learned from all the box turtle (Terrapene carolina and T. ornata) home range studies? Diversity 2019, 11, 68. [Google Scholar] [CrossRef] [Green Version]
- Stickel, L.F. Home range behavior among box turtles (Terrapene c. carolina) of a bottomland forest in Maryland. J. Herpetol. 1989, 23, 40–44. [Google Scholar] [CrossRef]
- Gould, E. Orientation in box turtles, Terrapene c. carolina (Linnaeus). Biol. Bull. 1957, 112, 336–348. [Google Scholar] [CrossRef]
- DeRosa, C.T.; Taylor, D.H. Homeward orientation mechanisms in three species of turtles (Trionyx spinifer, Chrysemys picta, and Terrapene carolina). Behav. Ecol. Sociobiol. 1980, 7, 15–23. [Google Scholar] [CrossRef]
- Valentini, A.; Miquel, C.; Nawaz, M.A.; Bellemain, E.; Coissac, E.; Pompanon, F.; Gielly, L.; Cruaud, C.; Nascetti, G.; Wincker, P.; et al. New perspectives in diet analysis based on DNA barcoding and parallel pyrosequencing: The trnL approach. Mol. Ecol. Resour. 2009, 9, 51–60. [Google Scholar] [CrossRef] [PubMed]
- Valentini, A.; Pompanon, F.; Taberlet, P. DNA barcoding for ecologists. Trends Ecol. Evol. 2009, 24, 110–117. [Google Scholar] [CrossRef]
Figure 1.
The presence (black)/Absence (gray) of prey in each diet category detected in the feces of the six individual Eastern Box Turtles sampled during every sampling period June, July, August, October, from left to right.
Figure 1.
The presence (black)/Absence (gray) of prey in each diet category detected in the feces of the six individual Eastern Box Turtles sampled during every sampling period June, July, August, October, from left to right.


Table 1.
Percent frequency of the occurrence of prey in diet categories detected in the feces of Eastern Box Turtles in June, July, August, and October 2014, New York. Sample sizes in parentheses.
Table 1.
Percent frequency of the occurrence of prey in diet categories detected in the feces of Eastern Box Turtles in June, July, August, and October 2014, New York. Sample sizes in parentheses.
| 15 June | 15 July | 16 August | 16 October | Total (62) | ||
|---|---|---|---|---|---|---|
| Monocots | 80.00 | 80.00 | 87.50 | 68.75 | 79.03 | |
| Dicots | 86.67 | 100.00 | 100.00 | 100.00 | 96.77 | |
| Leaves and stems | 86.67 | 100.00 | 100.00 | 100.00 | 96.77 | |
| Vaccinium seeds | 26.67 | 80.00 | 43.75 | 6.25 | 38.71 | |
| Rubus seeds | 0.00 | 40.00 | 37.50 | 0.00 | 19.35 | |
| Gaylussacia seeds | 0.00 | 33.33 | 37.50 | 0.00 | 17.74 | |
| Vitis seeds | 0.00 | 0.00 | 37.50 | 12.50 | 12.90 | |
| Other seeds | 0.00 | 6.67 | 31.25 | 18.75 | 14.52 | |
| Invertebrates | 93.33 | 93.33 | 93.75 | 81.25 | 90.32 | |
| Coleoptera | 73.33 | 73.33 | 81.25 | 25.00 | 62.90 | |
| Formicidae | 20.00 | 33.33 | 25.00 | 18.75 | 24.19 | |
| Larval Lepidoptera | 33.33 | 40.00 | 6.25 | 6.25 | 20.97 | |
| Gastropods | 20.00 | 20.00 | 12.50 | 6.25 | 14.52 | |
| Vertebrates | 40.00 | 26.67 | 31.25 | 6.25 | 25.81 | |
| Hair | 26.67 | 13.33 | 18.75 | 6.25 | 16.13 | |
| Feathers | 6.67 | 6.67 | 0.00 | 0.00 | 3.23 | |
| Bones | 6.67 | 20.00 | 18.75 | 0.00 | 11.29 | |
| Fungi | 13.33 | 33.33 | 75.00 | 31.25 | 38.71 | |
Table 2.
Monthly pairwise comparisons of Eastern Box Turtle diet overlap using Morisita–Horn (M–H) indices and associated 95% Confidence Intervals, Pianka’s index of overlap (O), and the p values associated with O values. Both M–H and O vary from 0.0–1.0, with 0.0 indicating no dietary overlap, and 1.0 indicating complete dietary overlap.
| Morisita-Horn Index | Pianka | |||||
|---|---|---|---|---|---|---|
| Index | Lower Quantile | Upper Quantile | O Value | P(OBS < NULL) | P(OBS > NULL) | |
| June vs. July | 0.89342 | 0.87382 | 0.91104 | 0.86836 * | 0.99 | <0.01 |
| June vs. August | 0.83779 | 0.80373 | 0.83905 | 0.81459 * | 0.98 | 0.02 |
| June vs. October | 0.86552 | 0.81272 | 0.89535 | 0.82907 * | 0.99 | 0.01 |
| July vs. August | 0.90982 * | 0.89894 | 0.90448 | 0.89258 * | 0.99 | <0.01 |
| July vs. October | 0.7673 | 0.67849 | 0.79705 | 0.75747 * | 0.98 | 0.02 |
| August vs. October | 0.82186 | 0.75479 | 0.8625 | 0.83145 * | 0.99 | <0.01 |
Values indicated with an asterisk are statistically significant (alpha = 0.05).
Table 3.
Sample sizes (the number of Eastern Box Turtles sampled) and associated means and standard deviations of the number of diet categories for which prey species were detected in the feces of individual turtles.
Table 3.
Sample sizes (the number of Eastern Box Turtles sampled) and associated means and standard deviations of the number of diet categories for which prey species were detected in the feces of individual turtles.
| Sample Size | Mean ± SD | Range | |
|---|---|---|---|
| June | 15 | 4.80 ± 1.47 | 2–6 |
| July | 15 | 6.13 ± 2.07 | 2–8 |
| August | 16 | 6.56 ± 1.50 | 4–10 |
| October | 16 | 3.75 ± 1.39 | 1–6 |
Publisher’s Note: MDPI stays neutral with regard to jurisdictional claims in published maps and institutional affiliations. |
© 2021 by the authors. Licensee MDPI, Basel, Switzerland. This article is an open access article distributed under the terms and conditions of the Creative Commons Attribution (CC BY) license (https://creativecommons.org/licenses/by/4.0/).
Share and Cite
MDPI and ACS Style
Figueras, M.P.; Green, T.M.; Burke, R.L. Consumption Patterns of a Generalist Omnivore: Eastern Box Turtle Diets in the Long Island Pine Barrens. Diversity 2021, 13, 345. https://0-doi-org.brum.beds.ac.uk/10.3390/d13080345
AMA Style
Figueras MP, Green TM, Burke RL. Consumption Patterns of a Generalist Omnivore: Eastern Box Turtle Diets in the Long Island Pine Barrens. Diversity. 2021; 13(8):345. https://0-doi-org.brum.beds.ac.uk/10.3390/d13080345
Chicago/Turabian StyleFigueras, Miranda P., Timothy M. Green, and Russell L. Burke. 2021. "Consumption Patterns of a Generalist Omnivore: Eastern Box Turtle Diets in the Long Island Pine Barrens" Diversity 13, no. 8: 345. https://0-doi-org.brum.beds.ac.uk/10.3390/d13080345
Note that from the first issue of 2016, this journal uses article numbers instead of page numbers. See further details here.