
How Can We Record Reliable Information on Animal Colouration in the Wild?


1
Key Laboratory of the Zoological Systematics and Evolution, Institute of Zoology, Chinese Academy of Sciences, Beijing 100101, China
2
Division of Molecular Biology, Ruđer Bošković Institute, 10000 Zagreb, Croatia
3
Museo di Storia Naturale dell’Università degli Studi di Firenze, “La Specola”, 50125 Firenze, Italy
4
Natural Oasis, 59100 Prato, Italy
5
Unione Speleologica Calenzano, Calenzano, 50041 Firenze, Italy
*
Author to whom correspondence should be addressed.
Diversity 2021, 13(8), 356; https://0-doi-org.brum.beds.ac.uk/10.3390/d13080356
Submission received: 7 July 2021
/
Revised: 30 July 2021
/
Accepted: 31 July 2021
/
Published: 3 August 2021
(This article belongs to the Section Animal Diversity)
Abstract
:Animal colouration is a phenotypic trait that can provide important information on species ecology and adaptation. Describing animal colours can be very challenging, and digital images may help in this difficult task. Obtaining an image with colours similar to those observed in nature is not trivial, as many factors can alter the final result. Some studies highlighted the importance of a proper post-production and analysis of the images to obtain the best results, but unfortunately very little attention has been paid to how to obtain standardised images suitable to be employed in zoological and ecological studies. This study aims to give evidence about the importance of shooting pictures in standardised condition to obtain reliable data on animal colourations. We provide a method that allows to obtain standardised pictures with colours that are comparable to those observed on wild animals. We used a method that creates an in situ standardised environment to shoot photos of relatively small animals. Our method allows to fully control lights, the factor that affect pictures the most. We also provided a test on the efficiency of this method. Using a colour checker card as reference, we compared the divergence of the Red-Green-Blue channel values obtained from pictures shot in complete darkness with those read by a colorimeter. The average divergence in RGB values between the colorimeter and the RAW images was about 4%. This divergence increased when light disturbance occurred. Our method highlighted the importance of the moment in which pictures are taken, and demonstrated that a fully controlled method is essential for obtaining reliable information on animal colourations, data that can be employed in ecological and evolutionary studies.
1. Introduction
Animal colouration has always fascinated the human mind, and it often represents one of the main features that easily catch our attention. Animals show a wide range of colourations, from very bright and colourful to a complete absence of pigmented cells [1,2], and patterns that can be very simple or extremely complex [3,4,5]. The colouration of animals can be mainly determined by a two-step process: in the first instance by the quantity and typology of pigmented cells present in the integument that reflect the incoming light, and secondly by the ability of the observer to detect the differences in wavelengths [6,7]. In fact, colouration can be considered a powerful type of communication between individuals that can go far beyond species limits, as it can even connect the animal kingdom with plants [8,9]. Messages sent through colouration can be of multiple nature: they can be used to find sexual partners [10,11], to signal how palatable an individual is [9,12], or to confuse potential enemies [13]. Some animals like chameleons or cephalopods are even able to modulate light reflection and acquire different colourations according to specific circumstances. Therefore, a better knowledge of animal colouration may enlighten many aspects of the species life-history traits and evolutionary history [3,14].
The description of animal colourations can be very easy when they show few and well-defined colours [4], but also extremely challenging in species with complex patterns [5]. Indeed, the colouration of the latter has been often described overusing a series of “–ish” adjectives to roughly cover the full range of the colour properties (e.g., hue, saturation, brightness) [15,16,17]. A step forward has been taken by introducing standard colour checkers cards, a tool that helps the observer to identify with more confidence a specific interval of colouration or to have a standard reference in photography [18,19]. With the advent of digital photography, a large number of photos has been shot and many of them have been included in research papers to provide a visual reference to the observation and diminish the vagueness of the “–ish” colour description [17,20,21,22]. However, “freezing” the subject into a digital image does not ensure that the stored information corresponds to the true colourations of the animal [23]. Indeed, the best results can only be obtained with a proper management of light, and taking care about further additional factors like camera settings [5,24,25]. Nonetheless, post-producing the photos may be a further source of artefactual colourations [26]. Very often we adjust colours according to our own taste (i.e., what is visually nicer) rather than paying attention to reproducing the most realistic colouration. This process is strongly affected by the characteristics of the device used for image visualisation and by algorithms used by software to convert colours [23,24].
The potential problem related to the representation of altered colours by an image can be overlooked (or it does not exist at all) when we talk about photography as a type of art, but it is a cardinal point when images need to be employed in analytic processes for scientific purposes [26,27,28]. Besides a few important recommendations [24,26], little attention has been paid to standardising the phase in which the photo is shot [5,19], a crucial step where the quality of the data recorded is mostly determined. The question «How to shoot a photo? » may have been often overlooked, probably thinking that the empiricism would be the best solution when the environmental conditions are different. A very common practice is to shoot photos, trying different angles and distances, until we see a nice and sharp image in the LCD camera screen. The dogma related to the reliable colour representation in documentary photos was rarely questioned, and who did so usually solves this problem white-balancing the image using colour checker cards. Unfortunately, the truth is that a colour checker card by itself does not solve the problem, but the mastery of lights is also required. Indeed, colours on colour checker cards change their properties according to the light intensity they receive, and balancing pictures with an altered white colour dramatically affects the results [19]. More recently, the employment of a softbox to shoot photos in complete darkness of wild animals produced excellent results [5,25]. These authors brought their portable photographic studio directly in the field and shot pictures of cave salamanders in their natural environment in complete darkness [5]. Under this circumstance, authors created a standardised condition thanks to the full control of lights, obtaining high quality images with reliable colourations. However, some limitations like the not fixed position of the camera, or the lack of possibility of controlling the distance of the equipment from the subject, did not make this method easily adopted by a wider public.
We here propose a method that allows researchers to obtain standardised photos with realistic colours, but that at the same time overcomes the above-mentioned problems. This method represents an updated version of the one proposed by Lunghi, Giachello, Zhao, Corti, Ficetola and Manenti [5], being therefore conceived to be a practical setup to obtain standardised images of relatively small-sized wild animals in situ that can be reliably employed in zoological and evolutionary studies. We designed our method to guarantee a procedure that enable researchers to directly obtain the most unbiased colourations and avoids the use of conversion software, which can represent an additional source of error [26]. The overarching goal of this study is to provide evidence that a wrong photographic setting may vanish the opportunity to record reliable information on animal colourations. Using this photographic set-up also allows to limit animal manipulation, contributing to reducing the spread of pathogens and the stress of photographed individuals [29,30]. While describing our method, we also provide a demonstration of its efficacy.
2. Materials and Methods
2.1. Description of the Structure
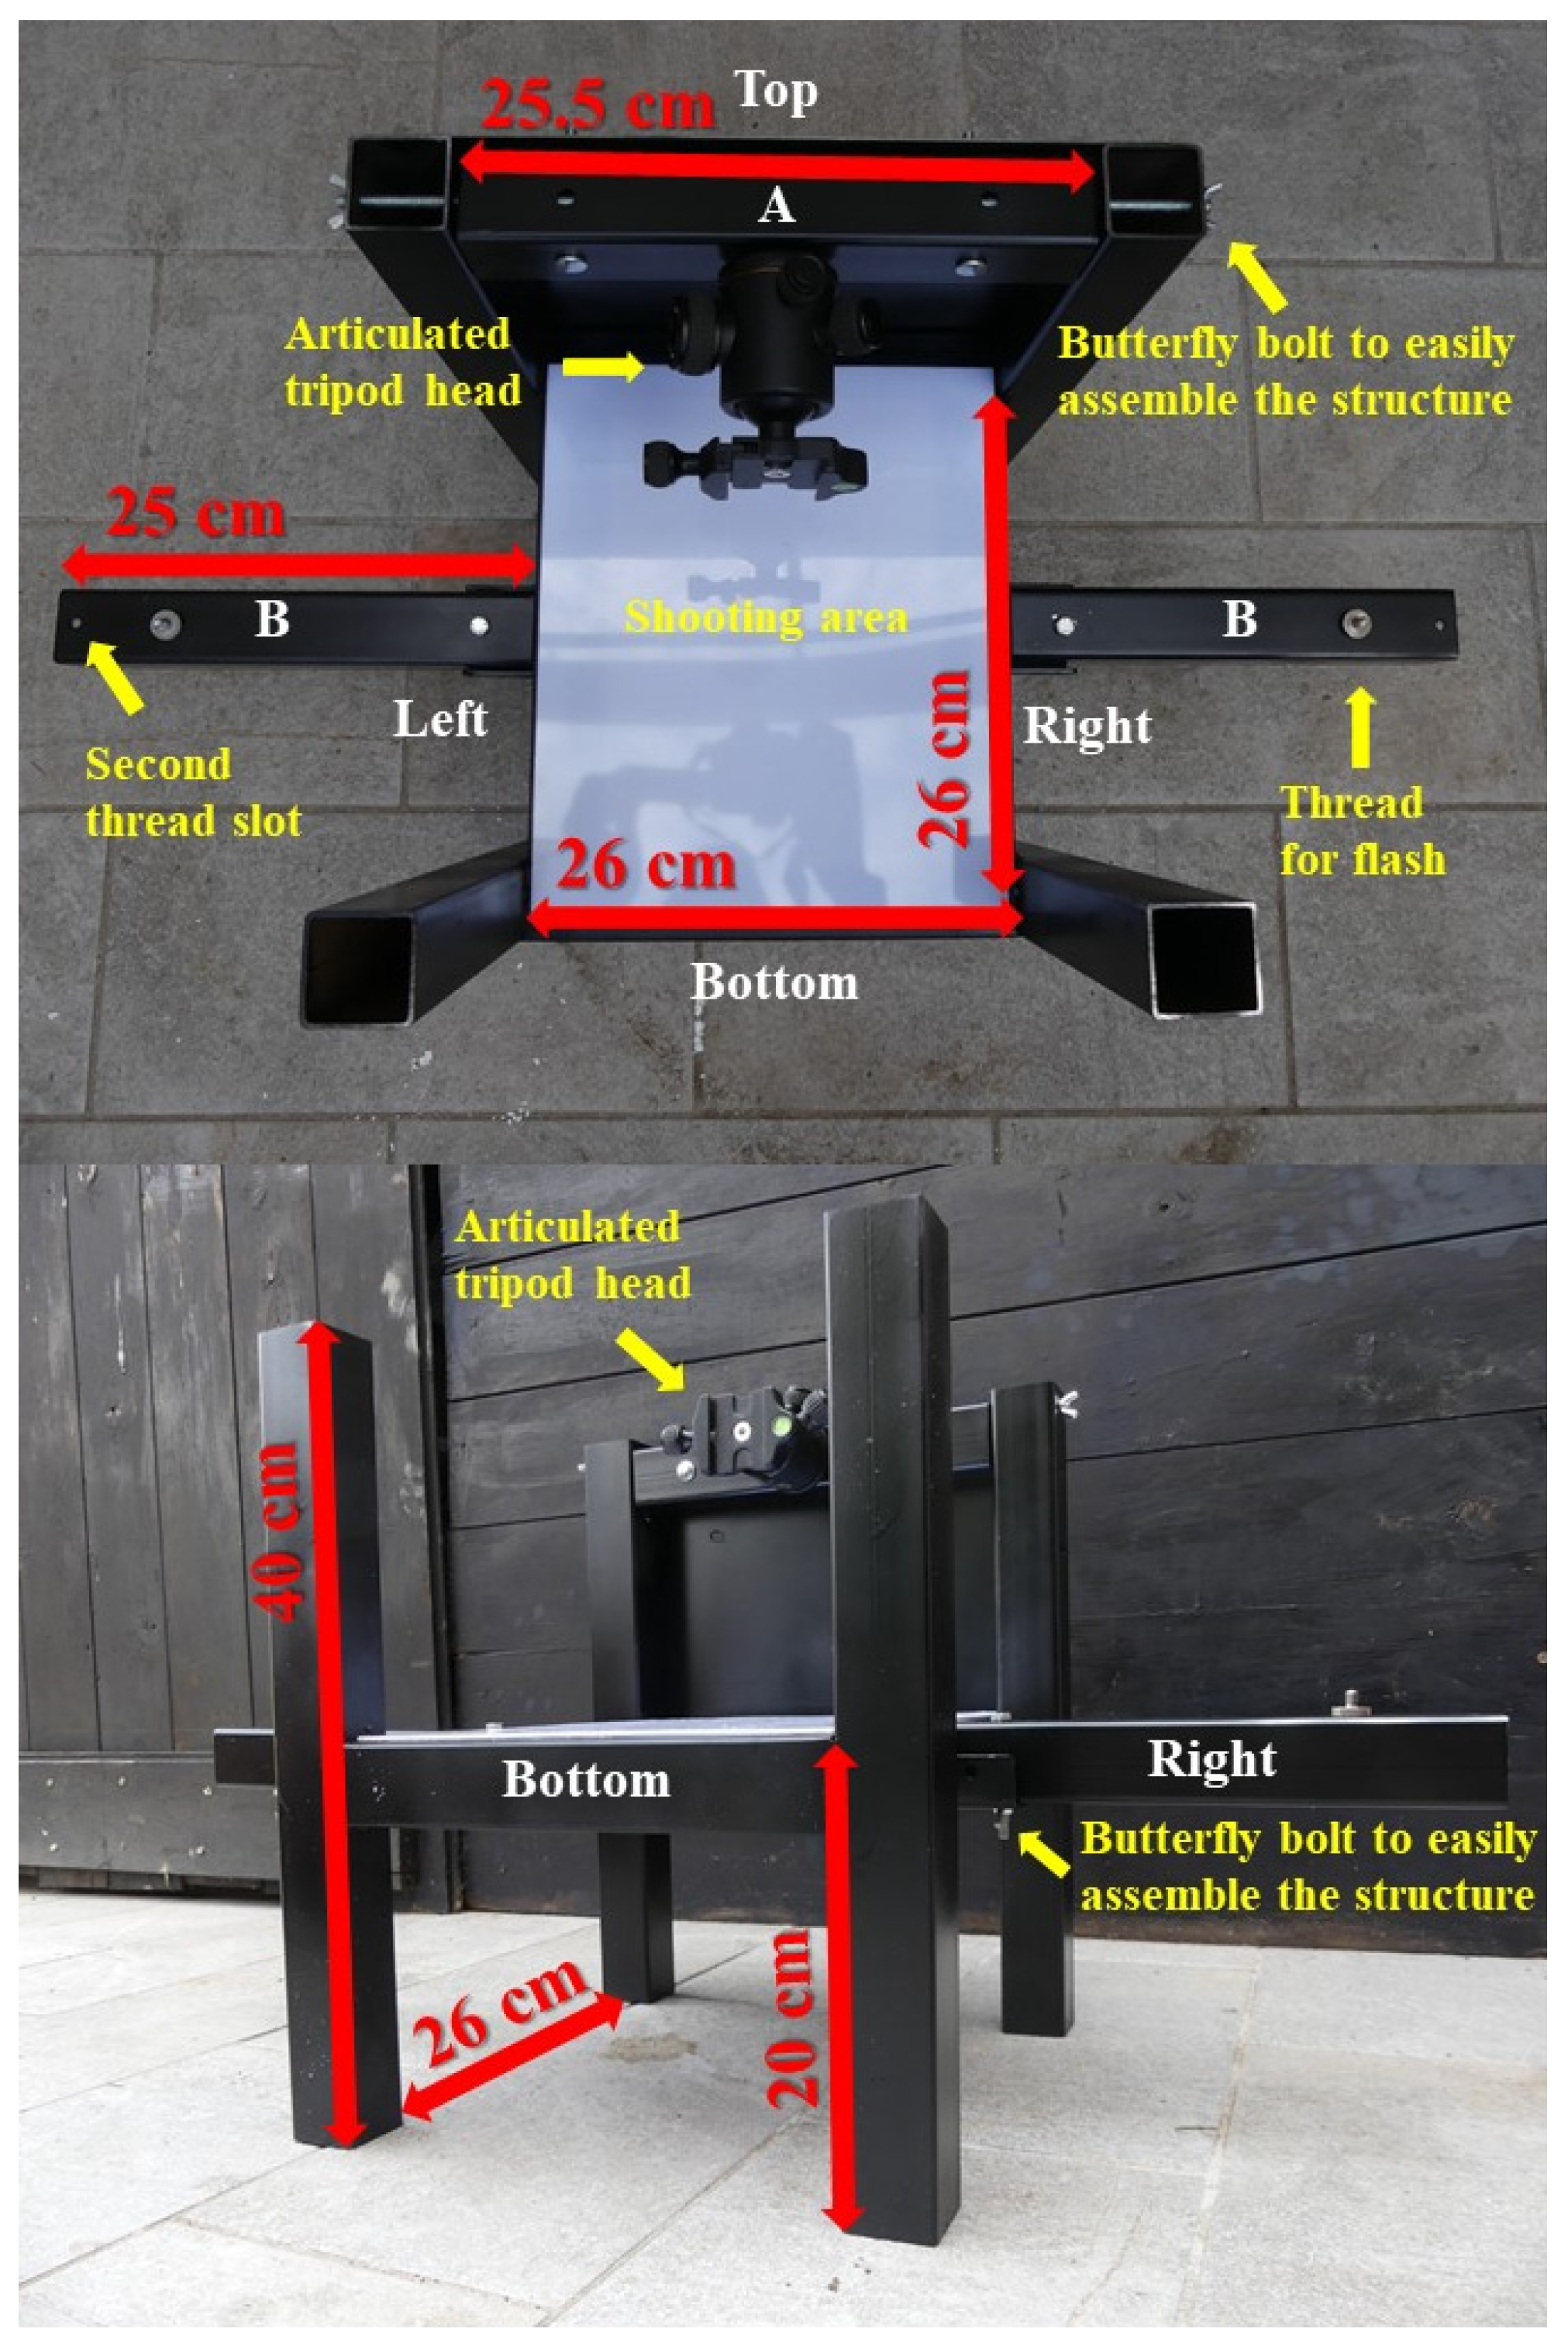
We built a solid and compact iron structure (Figure 1) that creates in situ standardised conditions to photograph wild animals, similarly to the methodologies used to photograph museum specimens and other materials in the lab [31,32]. The structure was realised to guarantee robustness and resistance to impacts and adverse environmental conditions, making it suitable for very challenging environments [5,33]. The full structure was black painted to avoid potential reflection of colours during the photo shooting. A white Plexiglas sheet is attached over the centre and represents the shooting area, over which subjects are placed (Figure 1).
This area is raised over the ground floor allowing to place a flash below. This not only allows a quick isolation of the subject from the background in post-production [5], but also avoids the formation of shadow areas that produce unexpected colour variation. On one side of the structure (the Top) a slab connects the two columns and gives support to a removable piece (A) where the camera is positioned (Figure 1). We included different heights at which A can be secured, in order to switch from larger to smaller subjects without substantial reduction of photo resolution, one of the most important characteristics to properly determine colour composition. At its centre, A has a welded thread where a camera, attached to an articulated tripod head, can be secured (Figure 1). This guarantees the camera stability and its perpendicularity towards the subject. Two removable arms (B) are secured on the Right and Left side of the structure (Figure 1). Each B has two slots for threads (at 19 and 24 cm) over which flash or a receiver trigger can be secured (Figure 1). This enables to increase the distance of the flashes from the subject if needed. Flashes are positioned with an angle of 90° in order to emit light impulses in parallel to the shooting area, and each flash has a mounted diffusor allowing a uniform illumination. From the Bottom, subjects are placed on the shooting area. A black waterproof cloth is placed below and over the structure to avoid interferences of external and/or reflecting lights during the shooting, allowing to create the required standardised dark conditions. The camera is activated via remote control (Table 1). The full structure can be easily cleaned and disinfected after each use.
2.2. Testing the Reliability of the Method
The test was conducted in complete darkness, to replicate the ideal conditions described above and to have the complete control of the lights. We used a ColorReader colorimeter to obtain a reference data on the Red-Green-Blue channels of the colour (hereafter, RGB) from a Pantone x-rite colourchecker card (for the sake of brevity, hereafter Pantone) (Figure 2a), one of the most common colourchecker card used to balance colours in digital photos [5,19].
We only considered the RGB channel because it is easily measurable, and because it is the most standardised and widely adopted method for colour description. Furthermore, to convert RGB into other formats (e.g., in CIELab) the employment of specific software is needed, a process that may represent a potential source of alterations because each device has its own built-in conversion algorithm [24], a condition that invalidates the comparability of the data. We focused on nine different colours (Figure 2a), to improve the reliability of the test [19]. We placed the Pantone on the shooting area focusing the camera on its centre (information on the equipment and settings are shown in Table 1) and we simulated potential events that can alter the light illuminating the Pantone. We used three types of disturbing events: the height of light source (up-down), the distance of light source (19 or 24 cm) and four different light conditions, for a total of 16 trials (Table 2).
For each combination of disturbing events, a photo of the Pantone was shot, allowing a post-hoc analysis evaluating the potential variation that colours experienced. Following the recommendation of Stevens et al. (2007), pictures were saved with RAW extension. We opened RAW files with Adobe Photoshop CC (v. 19.0) and for each of the nine considered colours we extrapolated the average RGB values through five sampling points: one in proximity of the corners and one at the centre of the square (Figure 2a). This hierarchical dataset was then analysed with Linear Mixed Models, a method that allows to analyse not normally distributed data [34]. The aim of this test was to evaluate whether and how the disturbing events contributed to increasing the divergence between the visible colours and those recorded into the digital photo. We used the average divergence between the RGB values of the photos and those obtained with the colorimeter as a dependent variable. This divergence was calculated as follows: first, for each colour in the picture we calculated the divergence in RGB from its reference values and the absolute value was converted into a percentage using the full RGB scale (255 units). The three percentages were then averaged. The three disturbing events, including their possible interactions, were used as independent variables. The first was related to the height of the flash: normal, when the B segment was placed at the same level of the shooting area, and lower, when B was placed 4 cm lower. The second was related to the distance occurring between flashes and the shooting area: in one case, flashes were secured at a distance of 19 cm, while in the other at 24 cm. The third disturbing event was related to the light condition: (A), no disturbing lights; (B) a yellow parasite light; (C) a hybrid parasite light; (D) the inclination of the Right flash was changed to 105°. The colour identity was used as random factor.
3. Results
The analysis identified the distance of the flash (F1,120 = 97.9, p < 0.001) and the light condition (F3,129 = 121.82, p < 0.001) as significant factors affecting the divergence in RGB values between photos and the colorimeter: the divergence was greater when flashes were more distant and when their slope angle was not the same (Figure 2b). The analysis also highlighted a significant effect of the interaction between the distance of the flash and the light condition (F3,120 = 3.51, p = 0.017), but no pattern was identified.
4. Discussion
With our study, we demonstrated the importance of a proper illumination when shooting photos, and the efficacy of our method in creating standardised conditions allowing to produce digital images characterised by colours that are comparable to those observed in nature by the human eye. In the absence of interferences, the RGB values of the RAW digital photos obtained using this method only differed by ~4% from values read by the colorimeter. This allows to obtain the most neutral white point, which also guarantees high reliability of other colours (Figure 2b). This procedure also permits to avoid colour conversions (i.e., white balance), a procedure that can increase the divergence between digital and natural colours [24,26]. For example, if we use a not well illuminated white for balancing image colours, the software will convert the colours using a wrong reference and will produce unrealistic colourations that cannot be further adjusted. Indeed, when images are white balanced they have to be saved in JPEG format, losing most of the advantages provided by the RAW format [24]. We want to remark that in this study, we only tested the divergence in RGB as this is the format in which the camera directly saves the information on colours, data that can be thus considered as “primary”. Therefore, our proposed method allows to obtain the most reliable primary data on animal colourations. From RGB format, data on colourations can be transformed in multiple forms (e.g., CIELab, HSB) useful to fully understand the evolution of a specific colouration in a given species [21,35]. However, this transformation requires the use of devices built-in algorithms, and testing the conformity of such algorithms is beyond the scope of this study.
Contrarily to museum specimens, wild animals rarely offer the opportunity to properly check their colouration with a colorimeter [23], while the use of a spectrophotometer can be often prohibitive [36]. On the other hand, the use of colourchecker cards as a surrogate, if properly illuminated, guarantees a more standard reference (i.e., we know which colours are on it) and offers the possibility to easily replicate the test. The high-quality images produced through our method represent reliable data that can be employed in studies focused on the analysis of animal colourations [11,21]. This is an emergent field of research that can enlighten multiple aspects of the evolutionary adaptation of species [3,14], but recommendations on how to collect reliable data are needed. Among these, a clear description of the used equipment and settings (see Table 1) is mandatory to convert data obtained using different devices [23,24]. When taking pictures, we often rely on the “abilities” of our camera, thinking that what is recorded cannot be so different from what we are observing. This problem was rarely considered in scientific literature [19].
With our portable shooting studio, we provided useful improvements to the method previously presented by Lunghi, Giachello, Zhao, Corti, Ficetola and Manenti [5]. First of all, the possibility to control the exact distance of flashes from the subject allows to replicate the same standardised conditions when using different flashes, or simply when the distance is adjusted according to the subject size. Another advantage is provided by the fixed position of the camera over the subject. Not only does this guarantee that photos are shot from the same angle, but it also eliminates potential blurring effects that can occur with freehand-shot photos. Furthermore, this condition allows researches to activate the camera via remote controls. The possibility of employing a remote control allows to use the camera in complete darkness (or when covered by the black waterproof cloth), a condition that not only guarantees the full control on lights, but also allows to reduce the shutter speed and quickly “freeze” the subject into the photo without compromising sharpening, even if it is not completely still. Nonetheless, some animals may be less stressed (and therefore more still) under complete darkness. The fixed position of the camera and flashes proposed in our method allows to shoot every picture from the same distance and with the same light intensity, guaranteeing the same high quality standard of RAW pictures. The possibility of controlling the distance, height and intensity of lights allows to recreate the same light conditions when we switch to a subject of different size (Figure 3). Indeed, our photo studio guarantees keeping the maximum possible resolution of the images (Figure 3) thanks to the possibility of adjusting the distance between the camera and the subject (Figure 1), a fundamental condition allowing to increase the detail of animal colouration [24].
With our study, we provide the description of a method that allows to obtain images with reliable information on animal colourations directly in the wild, and helps in avoiding potential problems that hamper to reach this goal. Adopting an appropriate methodology is crucial to collect unbiased and comparable data on wild animals useful in zoological and evolutionary studies [37]. Furthermore, these high quality data can be used by artificial intelligence to develop algorithms to automatically recognise specific phenotypes that reliably identify species, populations and even individuals [38,39], or to evaluate potential chromatic variations [40,41,42]. By adopting this method, data on animal colourations from different areas and times can be combined for large global analyses [43,44] even if recorded with different equipment [23,24]. We want to remark that, considering the numerous influences that might affect the reliability of colours recorded into images ([19,24], but see also this study), the proposed method increases the likelihood of the similarity between the final output and the animal colouration that can be observed by the human eye, but does not guarantee the perfect match. The best data on colouration can be only obtained with still subjects photographed under strictly controlled conditions in the lab and with equipment, which is rarely affordable [45,46]. These circumstances can be unlikely applied to wild animals, especially to strictly protected species that cannot be brought outside their natural environment [47]. This method was designed to shoot pictures of relatively small terrestrial subjects. However, with proper adjustments, it can be used with larger subjects or even with aquatic species. Furthermore, this iron prototype served to test the reliability and the standardisation of the condition recreated in situ. Adopting lighter (but still resistant) materials and increasing the assemblability of the photographic set-up will have a positive effect on its portability. Nonetheless, this procedure can also be used to digitalize museum collections [48]. This work contributes to updating the vademecum of digital photography employed in zoological and evolutionary studies.
Author Contributions
E.L. and F.B. conceived the study; E.L. performed the test, analysed the photos, drafted the manuscript, and prepared figures and tables; E.L., F.B. and Y.Z. reviewed the manuscript and accepted its final version. All authors have read and agreed to the published version of the manuscript.
Funding
The APC of this paper is covered by the 2021 Diversity Young Investigator Award won by the first author.
Institutional Review Board Statement
The study was authorized by the Ministero dell’Ambiente e della Tutela del Territorio e del Mare (1805/PNM of 04/02/2015 and further integrations).
Data Availability Statement
No data is available.
Acknowledgments
We thank D. M. Dieb Rivas for her comments on the first draft of the manuscript. Enrico Lunghi is supported by the Chinese Academy of Sciences President’s International Fellowship Initiative for postdoctoral researchers.
Conflicts of Interest
The authors declare no conflict of interest.
References
- Laman, T.; Scholes, E. Birds of Paradise: Revealing the World’s Most Extraordinary Birds; Nationall Geographic Society: Washington, DC, USA, 2012; p. 227. [Google Scholar]
- Fenolio, D. LIfe in the Dark. Illuminating Biodiversity in the Shadowy Haunts of Planet Earth; Johns Hopkins University Press: Baltimore, MD, USA, 2016; p. 317. [Google Scholar]
- Cuthill, I.C.; Allen, W.L.; Arbuckle, K.; Caspers, B.; Chaplin, G.; Hauber, M.E.; Hill, G.E.; Jablonski, N.G.; Jiggins, C.D.; Kelber, A.; et al. The biology of color. Science 2017, 357, eaan0221. [Google Scholar] [CrossRef] [PubMed] [Green Version]
- Najbar, A.; Konowalik, A.; Najbar, B.; Ogielska, M. Yellow patterns polymorphism of the fire salamander Salamandra salamandra in Poland. Acta Herpetol. 2018, 13, 101–108. [Google Scholar] [CrossRef]
- Lunghi, E.; Giachello, S.; Zhao, Y.; Corti, C.; Ficetola, G.F.; Manenti, R. Photographic database of the European cave salamanders, genus Hydromantes. Sci. Data 2020, 7, 171. [Google Scholar] [CrossRef]
- Bereiter-Hahn, J.; Matoltsy, A.G.; Sylvia Richards, K. (Eds.) Biology of the Integument. 2 Vertebrales; Springer: Berlin, Germany, 1986. [Google Scholar]
- Gerl, E.J.; Morris, M.R. The causes and consequences of color vision. Evol. Educ. Outreach 2008, 1, 476–486. [Google Scholar] [CrossRef] [Green Version]
- Losey, G.S.J. Crypsis and communication functions of UV-visible coloration in two coral reef damselfish, Dascyllus aruanus and D. reticulatus. Anim. Behav. 2003, 66, 299–307. [Google Scholar] [CrossRef] [Green Version]
- Giurfa, M.; Lehrer, M. Honeybee vision and floral displays: From detection to close-up recognition. In Cognitive Ecology of Pollination. Animal Behavior and Floral Evolution; Chittka, L., Thomson, J.D., Eds.; Cambridge University Press: Cambridge, UK, 2004; pp. 61–82. [Google Scholar]
- Kodric-Brown, A. Female choice of multiple male criteria in guppies: Interacting effects of dominance, coloration and courtship. Behav. Ecol. Sociobiol. 1993, 32, 415–420. [Google Scholar] [CrossRef]
- de Lanuza, G.P.I.; Font, E.; Carretero, M.A. Colour assortative pairing in a colour polymorphic lizard is independent of population morph diversity. Sci. Nat. 2016, 103, 82. [Google Scholar] [CrossRef] [PubMed]
- Santos, J.C.; Coloma, L.A.; Cannatella, D.C. Multiple, recurring origins of aposematism and diet specialization in poison frogs. Proc. Natl. Acad. Sci. USA 2003, 100, 12792–12797. [Google Scholar] [CrossRef] [Green Version]
- Ruxton, G.D.; Sherratt, T.N.; Speed, M.P. Avoiding Attack. The Evolutionary Ecology of Crypsis, Warning Signals, and Mimicry; Oxford University Press: Oxford, UK, 2004; p. 249. [Google Scholar]
- Cott, H.B. Adaptive Coloration in Animals; Methuen & Co LTD: London, UK, 1940; p. 508. [Google Scholar]
- Lanza, B.; Caputo, V.; Nascetti, G.; Bullini, L. Morphologic and genetic studies of the European plethodontid salamanders: Taxonomic inferences (genus Hydromantes). Monogr. Del. Mus. Reg. Sci. Nat. Torino 1995, 16, 1–366. [Google Scholar]
- Spinner, M.; Kovalev, A.; Gorb, S.N.; Westhoff, G. Snake velvet black: Hierarchical microand nanostructure enhances dark colouration in Bitis rhinoceros. Sci. Rep. 2013, 3, 1846. [Google Scholar] [CrossRef] [Green Version]
- Lunghi, E.; Giachello, S.; Mulargia, M.; Dore, P.P.; Cogoni, R.; Corti, C. Variability in the dorsal pattern of the Sardinian grass snake (Natrix natrix cetti) with notes on its ecology. Acta Herpetol. 2019, 14, 141–145. [Google Scholar] [CrossRef]
- Berggren, Å.; Merilä, J. WWW design code–A new tool for colour estimation in animal studies. Front. Zool. 2004, 1, 2. [Google Scholar] [CrossRef] [PubMed] [Green Version]
- Bergman, T.J.; Beehner, J.C. A simple method for measuring colour in wild animals: Validation and use on chest patch colour in geladas (Theropithecus gelada). Biol. J. Linn. Soc. 2008, 94, 231–240. [Google Scholar] [CrossRef] [Green Version]
- Thibaudeau, G.; Altig, R. Coloration of anuran tadpoles (Amphibia): Development, dynamics, function, and hypotheses. ISRN Zool. 2012, 2012, 725203. [Google Scholar] [CrossRef] [Green Version]
- Bierbach, D.; Penshorn, M.; Hamfler, S.; Herbert, D.B.; Appel, J.; Meyer, P.; Slattery, P.; Charaf, S.; Wolf, R.; Völker, J.; et al. Gradient evolution of body colouration in surfaceand cave-dwelling Poecilia mexicana and the role of phenotype-assortative female mate choice. BioMed Res. Int. 2013, 2013, 148348. [Google Scholar] [CrossRef] [PubMed]
- Brenes-Soto, A.; Dierenfeld, E.E.; Janssens, G.P.J. Colouration in amphibians as a reflection of nutritional status: The case of tree frogs in Costa Rica. PLoS ONE 2017, 12, e0182020. [Google Scholar] [CrossRef] [Green Version]
- Potash, A.D.; Greene, D.U.; Foursa, G.A.; Mathis, V.L.; Conner, L.M.; Mccleery, R.A. A comparison of animal color measurements using a commercially available digital color sensor and photograph analysis. Curr. Zool. 2020, 66, 601–606. [Google Scholar] [CrossRef] [PubMed] [Green Version]
- Stevens, M.; Párraga, C.A.; Cuthill, I.C.; Partridge, J.C.; Troscianko, T.S. Using digital photography to study animal coloration. Biol. J. Linn. Soc. 2007, 90, 211–237. [Google Scholar] [CrossRef] [Green Version]
- Lunghi, E.; Cianferoni, F.; Giachello, S.; Zhao, Y.; Manenti, R.; Corti, C.; Ficetola, G.F. Updating salamander datasets with phenotypic and stomach content information for two mainland Speleomantes. Sci. Data 2021, 8, 150. [Google Scholar] [CrossRef]
- Troscianko, J.; Stevens, M. Image calibration and analysis toolbox–A free software suite for objectivelymeasuring reflectance, colour and pattern. Methods Ecol. Evol. 2015, 6, 1320–1331. [Google Scholar] [CrossRef] [Green Version]
- Cooper, V.J.; Hosey, G.R. Sexual dichromatism and female preference in Eulemur fulvus subspecies. Int. J. Primatol. 2003, 24, 1177–1188. [Google Scholar] [CrossRef]
- Weller, H.I.; Westneat, M.W. Quantitative color profiling of digital images with earth mover’s distance using the R package colordistance. PeerJ 2019, 7, e6398. [Google Scholar] [CrossRef] [PubMed] [Green Version]
- Martel, A.; Blooi, M.; Adriaensen, C.; Van Rooij, P.; Beukema, W.; Fisher, M.C.; Farrer, R.A.; Schmidt, B.R.; Tobler, U.; Goka, K.; et al. Recent introduction of a chytrid fungus endangers Western Palearctic salamanders. Science 2014, 346, 630. [Google Scholar] [CrossRef] [PubMed] [Green Version]
- Lunghi, E.; Manenti, R.; Canciani, G.; Scarì, G.; Pennati, R.; Ficetola, G.F. Thermal equilibrium and temperature differences among body regions in European plethodontid salamanders. J. Biol. 2016, 60, 79–85. [Google Scholar] [CrossRef] [PubMed]
- Luzuriaga, D.A.; Balaban, M.O.; Yeralan, S. Analysis of visual quality attributes of white shrimp by machine vision. J. Food Sci. 1997, 62, 113–118. [Google Scholar] [CrossRef]
- Flemons, P.; Berents, P. Image based Digitisation of Entomology Collections: Leveraging volunteers to increase digitization capacity. ZooKeys 2012, 2009, 203–217. [Google Scholar] [CrossRef] [Green Version]
- Mammola, S.; Lunghi, E.; Bilandzija, H.; Cardoso, P.; Grimm, V.; Schmidt, S.I.; Hesselberg, T.; Martínez, A. Collecting eco-evolutionary data in the dark: Impediments to subterranean research and how to overcome them. Ecol. Evol. 2021, 11, 5911–5926. [Google Scholar] [CrossRef]
- Schielzeth, H.; Dingemanse, N.J.; Nakagawa, S.; Westneat, D.F.; Allegue, H.; Teplitsky, C.; Réale, D.; Dochtermann, N.A.; Garamszegi, L.Z.; Araya-Ajoy, Y.G. Robustness of linear mixed-effects models to violations of distributional assumptions. Methods Ecol. Evol. 2020, 11, 1141–1152. [Google Scholar] [CrossRef]
- French, C.M.; Ingram, T.; Bolnick, D.I. Geographical variation in colour of female threespine stickleback (Gasterosteus aculeatus). PeerJ 2018, 6, peerj-e4807. [Google Scholar] [CrossRef]
- Corciolani, G.; Vichi, A. Repeatability of colour reading with a clinical and a laboratory spectrophotometer. Int. Dent. SA 2006, 8, 62–70. [Google Scholar]
- MacCoun, R.; Perlmutter, S. Hide results to seek the truth. Nature 2015, 526, 187–189. [Google Scholar] [CrossRef]
- Sannolo, M.; Gatti, F.; Mangiacotti, M.; Scali, S.; Sacchi, R. Photo-identification in amphibian studies: A test of I3S Pattern. Acta Herpetol. 2016, 11, 63–68. [Google Scholar] [CrossRef]
- Lunghi, E.; Romeo, D.; Mulargia, M.; Cogoni, R.; Manenti, R.; Corti, C.; Ficetola, G.F.; Veith, M. On the stability of the dorsal pattern of European cave salamanders (genus Hydromantes). Herpetozoa 2019, 32, 249–253. [Google Scholar] [CrossRef] [Green Version]
- Paulraj, M.P.; Hema, C.R.; Krishnan, R.P.; Mohd Radzi, S.S. Color recognition algorithm using a neural network model in determining the ripeness of a banana. In Proceedings of the International Conference on Man-Machine Systems (ICoMMS), Batu Ferringhi, Malaysia, 11–13 October 2009; pp. 2B7-1–2B7-4. [Google Scholar]
- Jablonski, D.; Szabolcs, M.; Simović, A.; Mizsei, E. Color and pattern variation of the Balkan whip snake, Hierophis gemonensis (Laurenti, 1768). Turk. J. Zool. 2017, 41, 363–369. [Google Scholar] [CrossRef]
- Vroonen, J.; Vervust, B.; Fulgione, D.; Maselli, V.; Van Damme, R. Physiological colour change in the Moorish gecko, Tarentola mauritanica (Squamata: Gekkonidae): Effects of background, light, and temperature. Biol. J. Linn. Soc. 2012, 107, 182–191. [Google Scholar] [CrossRef] [Green Version]
- Bell, A.M.; Hankison, S.J.; Laskowski, K.L. The repeatability of behaviour: A meta-analysis. Anim. Behav. 2009, 77, 771–783. [Google Scholar] [CrossRef] [Green Version]
- Raffard, A.; Santoul, F.; Cucherousset, J.; Blanchet, S. The community and ecosystem consequences of intraspecific diversity: A meta-analysis. Biol. Rev. 2019, 94, 648–661. [Google Scholar] [CrossRef]
- Tao, L.; Xu, G. Color in machine vision and its application. Chin. Sci. Bull. 2001, 46, 1411–1421. [Google Scholar] [CrossRef]
- Yagiz, Y.; Balaban, M.O.; Kristinsson, H.G.; Welt, B.A.; Marshall, M.R. Comparison of Minolta colorimeter and machine vision system inmeasuring colour of irradiated Atlantic salmon. J. Sci. Food Agric. 2009, 89, 728–730. [Google Scholar] [CrossRef]
- Rondinini, C.; Battistoni, A.; Peronace, V.; Teofili, C. Lista Rossa IUCN dei Vertebrati Italiani; Comitato Italiano IUCN e Ministero dell’Ambiente e della Tutela del Territorio e del Mare: Roma, Italy, 2013; p. 54. [Google Scholar]
- Drew, J.A.; Moreau, C.S.; Stiassny, M.L.J. Digitization of museum collections holds the potential to enhance researcher diversity. Nat. Ecol. Evol. 2017, 1, 1789–1790. [Google Scholar] [CrossRef] [PubMed]
Figure 1.
View from above (up) and from a lower angle (down) of the portable photographic studio. Within picture are indicated: the oriented sides (Top, Right, Bottom and Left), the threads for flashes and their second slots on removable segments B, the shooting area, the articulated tripod head attached to the removable segment A. Red arrows indicate the segments; beside each arrow the relative measure is also reported. All iron segments are 4 × 4 cm.

Figure 2.
(a) The Pantone x-rite colorchecker passport used in the study. The colours measured in the study are those included within the red lines. The RGB values for each colour were extracted five times, one close to the corners and one at the centre of the square. Values were then averaged. (b) Boxplots showing the average RGB difference between the colours from RAW photos and those obtained with the ColorReader. Boxes are coloured according to the different light disturbance: green (darkness), yellow (yellow parasite light), white (hybrid parasite light), blue (Right flash sloped at 105°). Boxes represent the data from the 1st to the 3rd percentile while the diagonal bar inside is the median. Lower flash indicates that the flashes were positioned 4 cm below the level of the shooting area. Dashed line separates the groups basing on the distance of the flash from the shooting area: on the left flashes were placed at 19 cm, while on the right at 24 cm.

Figure 3.
An example of picture obtained using our photographic set-up. (A) Salamandra salamandra; (B) Speleomantes italicus; (C) Dolichopoda ligustica; (D) Euscorpius sp. Scale bars = 1 cm. These images were obtained in the wild using the described photographic set-up equipped with a Canon EOSR with the optic Canon RF 35 mm F1.8 Macro IS STM; flashes and triggers had the same settings as in this study (see Table 1).


Table 1.
The characteristics of the used equipment and the relative settings. The description of both equipment and settings used in the photo shooting are fundamental to guarantee the repeatability of the study and to allow the comparison of the images with those obtained using different devices.
Table 1.
The characteristics of the used equipment and the relative settings. The description of both equipment and settings used in the photo shooting are fundamental to guarantee the repeatability of the study and to allow the comparison of the images with those obtained using different devices.
| Type of Equipment | Brand | Model | Settings | |||
|---|---|---|---|---|---|---|
| Camera | Panasonic | FZ300 | DiaphragmF8 | SensitivityISO 100 | Shutter speed 1/500 | |
| Flash (×2) | Neewer | Speedlite NW620 | Guide number 58 | Light intensity 1/128 | Zoom 18 mm | Colour temperature 5500 K |
| Flash (×1) | Yongnuo | YN14EX | Light intensity 1/64 | Colour temperature 5600 K | ||
| Light diffuser (×2) | TYCKA | EU-TK009 | Dimension 23 × 18 | |||
| Trigger (×3) | Neewer | 2.4 GHz trigger FC16 | ||||
| Remote control | Smartphone application | Image app | ||||
Table 2.
The disturbing events simulated in the study and their potential implications on the image quality. Each variable used in the analysis is described, also providing information on the hypothetical problems that it simulates.
Table 2.
The disturbing events simulated in the study and their potential implications on the image quality. Each variable used in the analysis is described, also providing information on the hypothetical problems that it simulates.
| Variable | Description | Simulated Event |
|---|---|---|
| Height of the flash | Flash supports (B, Figure 1) were positioned at the level of the shooting area (Normal) or 4 cm lower (Down) | This simulates the different height of light source. This problem happens if flashes do not have a fixed position, but it is adjusted every time according to the subject and/or the environment |
| Distance of the flash | Flash are both secured on the closest (19 cm) or the farthest (24 cm) thread | This simulates the different distance of light source. This problem happens if flashes do not have a fixed position, but it is adjusted every time according to the subject and/or the environment |
| Light condition | The light condition is disturbed by: nothing (A), a yellow parasite light (B), a hybrid parasite light (C), a different inclination of one flash (D) | This simulates multiple problems related to the managing of light source. The category A represents the most accurate condition, where no external light is introduced into the shooting area (e.g., complete darkness) and both flashes direct their light in the same way. The category B and C simulate an external source of light (e.g., sunlight or a pilot light) which can be used to set the camera focus. This usually happens when the photo shooting is not performed in darkness or when strong pilot lights are used to drive camera focus. The category D simulates a not uniform light direction. This problem can arise when flashes do not have fixed position or when sunlight is used. |
Publisher’s Note: MDPI stays neutral with regard to jurisdictional claims in published maps and institutional affiliations. |
© 2021 by the authors. Licensee MDPI, Basel, Switzerland. This article is an open access article distributed under the terms and conditions of the Creative Commons Attribution (CC BY) license (https://creativecommons.org/licenses/by/4.0/).
Share and Cite
MDPI and ACS Style
Lunghi, E.; Bacci, F.; Zhao, Y. How Can We Record Reliable Information on Animal Colouration in the Wild? Diversity 2021, 13, 356. https://0-doi-org.brum.beds.ac.uk/10.3390/d13080356
AMA Style
Lunghi E, Bacci F, Zhao Y. How Can We Record Reliable Information on Animal Colouration in the Wild? Diversity. 2021; 13(8):356. https://0-doi-org.brum.beds.ac.uk/10.3390/d13080356
Chicago/Turabian StyleLunghi, Enrico, Francesco Bacci, and Yahui Zhao. 2021. "How Can We Record Reliable Information on Animal Colouration in the Wild?" Diversity 13, no. 8: 356. https://0-doi-org.brum.beds.ac.uk/10.3390/d13080356
Note that from the first issue of 2016, this journal uses article numbers instead of page numbers. See further details here.