
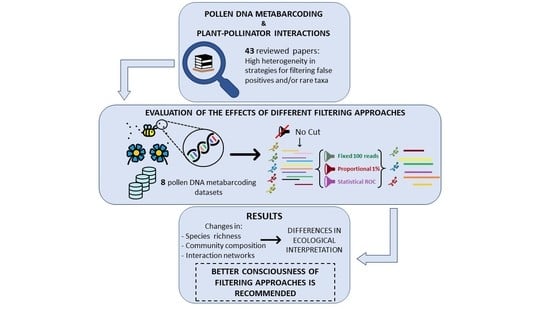
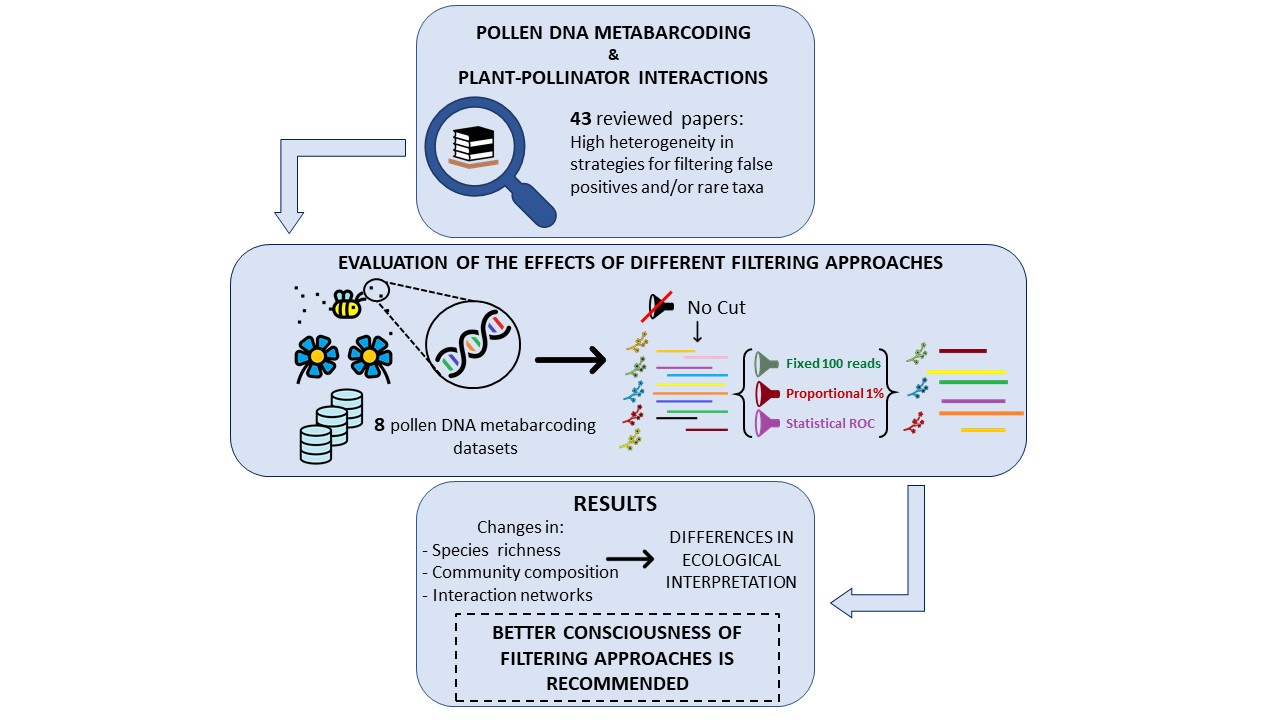
Harnessing the Power of Metabarcoding in the Ecological Interpretation of Plant-Pollinator DNA Data: Strategies and Consequences of Filtering Approaches


Abstract
:
1. Introduction
2. Methods
2.1. Filtering Taxa from Pollen DNA Metabarcoding: Literature Overview
2.2. Evaluating the Consequences of Filtering (or Not) Taxa
3. Results
3.1. Filtering Taxa from Pollen DNA Metabarcoding: Literature Overview
3.2. Evaluating the Consequences of Filtering (or Not) Taxa
4. Discussion
5. Conclusions
Supplementary Materials
Author Contributions
Funding
Institutional Review Board Statement
Data Availability Statement
Conflicts of Interest
References
- Mitchell, R.J.; Irwin, R.E.; Flanagan, R.J.; Karron, J.D. Ecology and evolution of plant–pollinator interactions. Ann. Bot. 2009, 103, 1355–1363. [Google Scholar] [CrossRef] [Green Version]
- Schweiger, O.; Biesmeijer, J.C.; Bommarco, R.; Hickler, T.; Hulme, P.E.; Klotz, S.; Kühn, I.; Moora, M.; Nielsen, A.; Ohlemuller, R.; et al. Multiple stressors on biotic interactions: How climate change and alien species interact to affect pollination. Biol. Rev. 2010, 85, 777–795. [Google Scholar] [CrossRef]
- Burkle, L.A.; Alarcón, R. The future of plant–pollinator diversity: Understanding interaction networks across time, space, and global change. Am. J. Bot. 2011, 98, 528–538. [Google Scholar] [CrossRef]
- Burkle, L.A.; Delphia, C.M.; O’Neill, K.M. A dual role for farmlands: Food security and pollinator conservation. J. Ecol. 2017, 105, 890–899. [Google Scholar] [CrossRef] [Green Version]
- CaraDonna, P.J.; Waser, N.M. Temporal flexibility in the structure of plant–pollinator interaction networks. Oikos 2020, 129, 1369–1380. [Google Scholar] [CrossRef]
- de Manincor, N.; Hautekèete, N.; Mazoyer, C.; Moreau, P.; Piquot, Y.; Schatz, B.; Schmitt, E.; Zélazny, M.; Massol, F. How biased is our perception of plant-pollinator networks? A comparison of visit- and pollen-based representations of the same networks. Acta Oecologica 2020, 105, 103551. [Google Scholar] [CrossRef]
- Bosch, J.; Martín González, A.M.; Rodrigo, A.; Navarro, D. Plant–pollinator networks: Adding the pollinator’s perspective. Ecol. Lett. 2009, 12, 409–419. [Google Scholar] [CrossRef]
- Cullen, N.; Xia, J.; Wei, N.; Kaczorowski, R.; Arceo-Gómez, G.; O’Neill, E.; Hayes, R.; Ashman, T.-L. Diversity and composition of pollen loads carried by pollinators are primarily driven by insect traits, not floral community characteristics. Oecologia 2021, 196, 131–143. [Google Scholar] [CrossRef]
- Bell, K.L.; de Vere, N.; Keller, A.; Richardson, R.; Gous, A.; Burgess, K.S.; Brosi, B.J. Pollen DNA barcoding: Current applications and future prospects. Genome 2016, 59, 629–640. [Google Scholar] [CrossRef] [Green Version]
- Bell, K.L.; Burgess, K.S.; Okamoto, K.C.; Aranda, R.; Brosi, B.J. Review and future prospects for DNA barcoding methods in forensic palynology. Forensic Sci. Int. Genet. 2016, 21, 110–116. [Google Scholar] [CrossRef]
- Khansari, E.; Zarre, S.; Alizadeh, K.; Attar, F.; Aghabeigi, F.; Salmaki, Y. Pollen morphology of Campanula (Campanulaceae) and allied genera in Iran with special focus on its systematic implication. Flora-Morphol. Distrib. Funct. Ecol. Plants 2012, 207, 203–211. [Google Scholar] [CrossRef]
- Bell, K.L.; Fowler, J.; Burgess, K.S.; Dobbs, E.K.; Gruenewald, D.; Lawley, B.; Morozumi, C.; Brosi, B.J. Applying pollen DNA metabarcoding to the study of plant–pollinator interactions1. Appl. Plant Sci. 2017, 5, 1600124. [Google Scholar] [CrossRef]
- Galimberti, A.; De Mattia, F.; Bruni, I.; Scaccabarozzi, D.; Sandionigi, A.; Barbuto, M.; Casiraghi, M.; Labra, M. A DNA Barcoding Approach to Characterize Pollen Collected by Honeybees. PLoS ONE 2014, 9, e109363. [Google Scholar] [CrossRef] [Green Version]
- Bruni, I.; Galimberti, A.; Caridi, L.; Scaccabarozzi, D.; De Mattia, F.; Casiraghi, M.; Labra, M. A DNA barcoding approach to identify plant species in multiflower honey. Food Chem. 2015, 170, 308–315. [Google Scholar] [CrossRef] [PubMed]
- Liu, L.; Li, Y.; Li, S.; Hu, N.; He, Y.; Pong, R.; Lin, D.; Lu, L.; Law, M. Comparison of Next-Generation Sequencing Systems. J. Biomed. Biotechnol. 2012, 2012, 1–11. [Google Scholar] [CrossRef]
- Taberlet, P.; Coissac, E.; Pompanon, F.; Brochmann, C.; Willerslev, E. Towards next-generation biodiversity assessment using DNA metabarcoding. Mol. Ecol. 2012, 21, 2045–2050. [Google Scholar] [CrossRef]
- Biella, P.; Tommasi, N.; Akter, A.; Guzzetti, L.; Klecka, J.; Sandionigi, A.; Labra, M.; Galimberti, A. Foraging strategies are maintained despite workforce reduction: A multidisciplinary survey on the pollen collected by a social pollinator. PLoS ONE 2019, 14, e0224037. [Google Scholar] [CrossRef] [Green Version]
- McFrederick, Q.S.; Rehan, S.M. Characterization of pollen and bacterial community composition in brood provisions of a small carpenter bee. Mol. Ecol. 2016, 25, 2302–2311. [Google Scholar] [CrossRef]
- Richardson, R.T.; Lin, C.H.; Sponsler, D.B.; Quijia, J.O.; Goodell, K.; Johnson, R.M. Application of ITS2 metabarcoding to determine the provenance of pollen collected by honey bees in an agroecosystem. Appl. Plant Sci. 2015, 3, 1400066. [Google Scholar] [CrossRef] [PubMed]
- Niemeyer, B.; Epp, L.S.; Stoof-Leichsenring, K.R.; Pestryakova, L.; Herzschuh, U. A comparison of sedimentary DNA and pollen from lake sediments in recording vegetation composition at the Siberian treeline. Mol. Ecol. Resour. 2017, 17, e46–e62. [Google Scholar] [CrossRef] [PubMed]
- Alsos, I.G.; Lammers, Y.; Yoccoz, N.G.; Jørgensen, T.; Sjögren, P.; Gielly, L.; Edwards, M.E. Plant DNA metabarcoding of lake sediments: How does it represent the contemporary vegetation. PLoS ONE 2018, 13, e0195403. [Google Scholar] [CrossRef] [PubMed]
- Ezegbogu, M.O. Identifying the scene of a crime through pollen analysis. Sci. Justice 2021, 61, 205–213. [Google Scholar] [CrossRef]
- Churko, J.M.; Mantalas, G.L.; Snyder, M.P.; Wu, J.C. Overview of High Throughput Sequencing Technologies to Elucidate Molecular Pathways in Cardiovascular Diseases. Circ. Res. 2013, 112, 1613–1623. [Google Scholar] [CrossRef] [PubMed] [Green Version]
- Bell, K.L.; Burgess, K.S.; Botsch, J.C.; Dobbs, E.; Read, T.D.; Brosi, B.J. Quantitative and qualitative assessment of pollen DNA metabarcoding using constructed species mixtures. Mol. Ecol. 2019, 28, 431–455. [Google Scholar] [CrossRef]
- Blaxter, M.; Mann, J.D.; Chapman, T.; Thomas, F.; Whitton, C.; Floyd, R.; Abebe, E. Defining operational taxonomic units using DNA barcode data. Philos. Trans. R. Soc. B Biol. Sci. 2005, 360, 1935–1943. [Google Scholar] [CrossRef] [PubMed]
- Callahan, B.J.; McMurdie, P.; Holmes, S.P. Exact sequence variants should replace operational taxonomic units in marker-gene data analysis. ISME J. 2017, 11, 2639–2643. [Google Scholar] [CrossRef] [Green Version]
- Alberdi, A.; Aizpurua, O.; Gilbert, M.T.; Bohmann, K. Scrutinizing key steps for reliable metabarcoding of environmental samples. Methods Ecol. Evol. 2018, 9, 134–147. [Google Scholar] [CrossRef] [Green Version]
- Ficetola, G.F.; Taberlet, P.; Coissac, E. How to limit false positives in environmental DNA and metabarcoding? Mol. Ecol. Resour. 2016, 16, 604–607. [Google Scholar] [CrossRef] [Green Version]
- Clare, E.L.; Chain, F.J.; Littlefair, J.E.; Cristescu, M.E. The effects of parameter choice on defining molecular operational taxonomic units and resulting ecological analyses of metabarcoding data. Genome 2016, 59, 981–990. [Google Scholar] [CrossRef]
- Cao, Q.; Sun, X.; Rajesh, K.; Chalasani, N.; Gelow, K.; Katz, B.; Shah, V.H.; Sanyal, A.J.; Smirnova, E. Effects of Rare Microbiome Taxa Filtering on Statistical Analysis. Front. Microbiol. 2021, 11, 607325. [Google Scholar] [CrossRef]
- Pornon, A.; Baksay, S.; Escaravage, N.; Burrus, M.; Andalo, C. Pollinator specialization increases with a decrease in a mass-flowering plant in networks inferred from DNA metabarcoding. Ecol. Evol. 2019, 9, 13650–13662. [Google Scholar] [CrossRef]
- Wilson, R.S.; Keller, A.; Shapcott, A.; Leonhardt, S.D.; Sickel, W.; Hardwick, J.L.; Heard, T.A.; Kaluza, B.F.; Wallace, H.M. Many small rather than few large sources identified in long-term bee pollen diets in agroecosystems. Agric. Ecosyst. Environ. 2021, 310, 107296. [Google Scholar] [CrossRef]
- Baksay, S.; Pornon, A.; Burrus, M.; Mariette, J.; Andalo, C.; Escaravage, N. Experimental quantification of pollen with DNA metabarcoding using ITS1 and trnL. Sci. Rep. 2020, 10, 1–9. [Google Scholar] [CrossRef] [Green Version]
- Bänsch, S.; Tscharntke, T.; Wünschiers, R.; Netter, L.; Brenig, B.; Gabriel, D.; Westphal, C. Using ITS2 metabarcoding and mi-croscopy to analyse shifts in pollen diets of honey bees and bumble bees along a mass-flowering crop gradient. Mol. Ecol. 2020, 29, 5003–5018. [Google Scholar] [CrossRef] [PubMed]
- Bell, K.L.; Loeffler, V.M.; Brosi, B.J. An rbcL reference library to aid in the identification of plant species mixtures by DNA metabarcoding. Appl. Plant Sci. 2017, 5, 1600110. [Google Scholar] [CrossRef] [PubMed]
- Chiara, B.; Francesco, C.; Fulvio, B.; Paola, M.; Annalisa, G.; Stefania, S.; Luigi, A.P.; Simone, P. Exploring the botanical composition of polyfloral and monofloral honeys through DNA metabarcoding. Food Control. 2021, 128, 108175. [Google Scholar] [CrossRef]
- Danner, N.; Keller, A.; Härtel, S.; Steffan-Dewenter, I. Honey bee foraging ecology: Season but not landscape diversity shapes the amount and diversity of collected pollen. PLoS ONE 2017, 12, e0183716. [Google Scholar] [CrossRef] [PubMed] [Green Version]
- De Vere, N.; Jones, L.E.; Gilmore, T.; Moscrop, J.; Lowe, A.; Smith, D.; Hegarty, M.J.; Creer, S.; Ford, C.R. Using DNA metabarcoding to investigate honey bee foraging reveals limited flower use despite high floral availability. Sci. Rep. 2017, 7, 42838. [Google Scholar] [CrossRef] [Green Version]
- Elliott, B.; Wilson, R.; Shapcott, A.; Keller, A.; Newis, R.; Cannizzaro, C.; Burwell, C.; Smith, T.; Leonhardt, S.D.; Kämper, W.; et al. Pollen diets and niche overlap of honey bees and native bees in protected areas. Basic Appl. Ecol. 2021, 50, 169–180. [Google Scholar] [CrossRef]
- Fahimee, J.; Badrulisham, A.S.; Zulidzham, M.S.; Reward, N.F.; Muzammil, N.; Jajuli, R.; Md-Zain, B.M.; Yaakop, S. Metabar-coding in Diet Assessment of Heterotrigona itama Based on trnL Marker towards Domestication Program. Insects 2021, 12, 205. [Google Scholar] [CrossRef] [PubMed]
- Galliot, J.N.; Brunel, D.; Bérard, A.; Chauveau, A.; Blanchetête, A.; Lanore, L.; Farruggia, A. Investigating a flower-insect forager network in a mountain grassland community using pollen DNA barcoding. J. Insect Conserv. 2017, 21, 827–837. [Google Scholar] [CrossRef]
- Gous, A.; Swanevelder, D.Z.; Eardley, C.D.; Willows-Munro, S. Plant–pollinator interactions over time: Pollen metabarcoding from bees in a historic collection. Evol. Appl. 2019, 12, 187–197. [Google Scholar] [CrossRef] [Green Version]
- Gous, A.; Eardley, C.D.; Johnson, S.D.; Swanevelder, D.Z.; Willows-Munro, S. Floral hosts of leaf-cutter bees (Megachilidae) in a biodiversity hotspot revealed by pollen DNA metabarcoding of historic specimens. PLoS ONE 2021, 16, e0244973. [Google Scholar] [CrossRef]
- Hawkins, J.; de Vere, N.; Griffith, A.; Ford, C.R.; Allainguillaume, J.; Hegarty, M.J.; Baillie, L.; Adams-Groom, B. Using DNA metabarcoding to identify the floral composition of honey: A new tool for investigating honey bee foraging preferences. PLoS ONE 2015, 10, e0134735. [Google Scholar] [CrossRef] [Green Version]
- Jones, L.; Brennan, G.L.; Lowe, A.; Creer, S.; Ford, C.R.; De Vere, N. Shifts in honeybee foraging reveal historical changes in floral resources. Commun. Biol. 2021, 4, 1–10. [Google Scholar] [CrossRef]
- Khansaritoreh, E.; Salmaki, Y.; Ramezani, E.; Azirani, T.A.; Keller, A.; Neumann, K.; Alizadeh, K.; Zarre, S.; Beckh, G.; Behling, H. Employing DNA metabarcoding to determine the geographical origin of honey. Heliyon 2020, 6, e05596. [Google Scholar] [CrossRef]
- Leidenfrost, R.M.; Bänsch, S.; Prudnikow, L.; Brenig, B.; Westphal, C.; Wünschiers, R. Analyzing the Dietary Diary of Bumble Bee. Front. Plant Sci. 2020, 11, 287. [Google Scholar] [CrossRef]
- Lucas, A.; Bodger, O.; Brosi, B.; Ford, C.R.; Forman, D.W.; Greig, C.; Hegarty, M.; Neyland, P.J.; de Vere, N. Generalisation, and specialisation in hoverfly (Syrphidae) grassland pollen transport networks revealed by DNA metabarcoding. J. Anim. Ecol. 2018, 87, 1008–1021. [Google Scholar] [CrossRef] [PubMed] [Green Version]
- Lucas, A.; Bodger, O.; Brosi, B.J.; Ford, C.R.; Forman, D.W.; Greig, C.; Hegarty, M.; Jones, L.; Neyland, P.J.; de Vere, N. Floral resource partitioning by individuals within generalised hoverfly pollination networks revealed by DNA metabarcoding. Sci. Rep. 2018, 8, 1–11. [Google Scholar] [CrossRef] [PubMed] [Green Version]
- Lucek, K.; Galli, A.; Gurten, S.; Hohmann, N.; Maccagni, A.; Patsiou, T.; Willi, Y. Metabarcoding of honey to assess differences in plant-pollinator interactions between urban and non-urban sites. Apidologie 2019, 50, 317–329. [Google Scholar] [CrossRef]
- Macgregor, C.J.; Kitson, J.J.N.; Fox, R.; Hahn, C.; Lunt, D.H.; Pocock, M.J.O.; Evans, D.M. Construction, validation, and application of nocturnal pollen transport networks in an agro-ecosystem: A comparison using light microscopy and DNA metabarcoding. Ecol. Èntomol. 2019, 44, 17–29. [Google Scholar] [CrossRef] [Green Version]
- Nürnberger, F.; Keller, A.; Härtel, S.; Steffan-Dewenter, I. Honey bee waggle dance communication increases diversity of pollen diets in intensively managed agricultural landscapes. Mol. Ecol. 2019, 28, 3602–3611. [Google Scholar] [CrossRef]
- Peel, N.; Dicks, L.; Clark, M.; Heavens, D.; Percival-Alwyn, L.; Cooper, C.; Davies, R.G.; Leggett, R.; Yu, D.W. Semi-quantitative characterisation of mixed pollen samples using MinION sequencing and Reverse Metagenomics (RevMet). Methods Ecol. Evol. 2019, 10, 1690–1701. [Google Scholar] [CrossRef]
- Piko, J.; Keller, A.; Geppert, C.; Batáry, P.; Tscharntke, T.; Westphal, C.; Hass, A.L. Effects of three flower field types on bum-blebees and their pollen diets. Basic Appl. Ecol. 2021, 52, 95–108. [Google Scholar] [CrossRef]
- Pornon, A.; Escaravage, N.; Burrus, M.; Holota, H.; Khimoun, A.; Mariette, J.; Pellizzari, C.; Iribar, A.; Etienne, R.; Taberlet, P.; et al. Using metabarcoding to reveal and quantify plant-pollinator interactions. Sci. Rep. 2016, 6, 27282. [Google Scholar] [CrossRef] [PubMed] [Green Version]
- Pornon, A.; Andalo, C.; Burrus, M.; Escaravage, N. DNA metabarcoding data unveils invisible pollination networks. Sci. Rep. 2017, 7, 1–11. [Google Scholar] [CrossRef]
- Potter, C.; de Vere, N.; Jones, L.E.; Ford, C.R.; Hegarty, M.J.; Hodder, K.H.; Diaz, A.; Franklin, E.L. Pollen metabarcoding reveals broad and species-specific resource use by urban bees. PeerJ 2019, 7, e5999. [Google Scholar] [CrossRef] [PubMed]
- Richardson, R.T.; Lin, C.H.; Quijia, J.O.; Riusech, N.S.; Goodell, K.; Johnson, R.M. Rank-based characterization of pollen as-semblages collected by honey bees using a multi-locus metabarcoding approach. Appl. Plant Sci. 2015, 3, 1500043. [Google Scholar] [CrossRef] [PubMed]
- Richardson, R.T.; Curtis, H.R.; Matcham, E.G.; Lin, C.-H.; Suresh, S.; Sponsler, D.B.; Hearon, L.E.; Johnson, R.M. Quantitative multi-locus metabarcoding and waggle dance interpretation reveal honey bee spring foraging patterns in Midwest agroecosys-tems. Mol. Ecol. 2019, 28, 686–697. [Google Scholar] [CrossRef] [PubMed]
- Richardson, R.T.; Eaton, T.D.; Lin, C.H.; Cherry, G.; Johnson, R.M.; Sponsler, D.B. Application of plant metabarcoding to identify diverse honeybee pollen forage along an urban–agricultural gradient. Mol. Ecol. 2021, 30, 310–323. [Google Scholar] [CrossRef] [PubMed]
- Sickel, W.; Ankenbrand, M.J.; Grimmer, G.; Holzschuh, A.; Härtel, S.; Lanzen, J.; Steffan-Dewenter, I.; Keller, A. Increased effi-ciency in identifying mixed pollen samples by meta-barcoding with a dual-indexing approach. BMC Ecol. 2015, 15, 1–9. [Google Scholar] [CrossRef] [PubMed] [Green Version]
- Simanonok, M.P.; Otto, C.R.V.; Cornman, R.S.; Iwanowicz, D.D.; Strange, J.P.; Smith, T.A. A century of pollen foraging by the endangered rusty patched bumble bee (Bombus affinis): Inferences from molecular sequencing of museum specimens. Biodivers. Conserv. 2021, 30, 123–137. [Google Scholar] [CrossRef]
- Smart, M.D.; Cornman, R.S.; Iwanowicz, D.D.; McDermott-Kubeczko, M.; Pettis, J.S.; Spivak, M.S.; Otto, C. A Comparison of Honey Bee-Collected Pollen from Working Agricultural Lands Using Light Microscopy and ITS Metabarcoding. Environ. Èntomol. 2017, 46, 38–49. [Google Scholar] [CrossRef] [PubMed] [Green Version]
- Suchan, T.; Talavera, G.; Sáez, L.; Ronikier, M.; Vila, R. Pollen metabarcoding as a tool for tracking long-distance insect mi-grations. Mol. Ecol. Resour. 2019, 19, 149–162. [Google Scholar] [CrossRef] [Green Version]
- Swenson, S.J.; Gemeinholzer, B. Testing the effect of pollen exine rupture on metabarcoding with Illumina sequencing. PLoS ONE 2021, 16, e0245611. [Google Scholar] [CrossRef]
- Tanaka, K.; Nozaki, A.; Nakadai, H.; Shiwa, Y.; Shimizu-Kadota, M. Using pollen DNA metabarcoding to profile nectar sources of urban beekeeping in Kōtō-ku, Tokyo. BMC Res. Notes 2020, 13, 1–6. [Google Scholar] [CrossRef]
- Tommasi, N.; Biella, P.; Guzzetti, L.; Lasway, J.V.; Njovu, H.K.; Tapparo, A.; Agostinetto, G.; Peters, M.K.; Steffan-Dewenter, I.; Labra, M. Impact of land use intensification and local features on plants and pollinators in Sub-Saharan smallholder farms. Agric. Ecosyst. Environ 2021, in press. [Google Scholar] [CrossRef]
- Tremblay É., D.; Duceppe, M.O.; Thurston, G.B.; Gagnon, M.C.; Côté, M.J.; Bilodeau, G.J. High-resolution biomonitoring of plant pathogens and plant species using metabarcoding of pollen pellet contents collected from a honey bee hive. Environ. DNA 2019, 1, 155–175. [Google Scholar] [CrossRef] [Green Version]
- Vaudo, A.D.; Biddinger, D.J.; Sickel, W.; Keller, A.; López-Uribe, M.M. Introduced bees (Osmia cornifrons) collect pollen from both coevolved and novel host-plant species within their family-level phylogenetic preferences. R. Soc. Open Sci. 2020, 7, 200225. [Google Scholar] [CrossRef]
- Metz, C.E. Basic principles of ROC analysis. Semin. Nucl. Med. 1978, 8, 283–298. [Google Scholar] [CrossRef]
- Robin, X.; Turck, N.; Hainard, A.; Tiberti, N.; Lisacek, F.; Sanchez, J.-C.; Muller, M.J. pROC: An open-source package for R and S+ to analyze and compare ROC curves. BMC Bioinform. 2011, 12, 77. [Google Scholar] [CrossRef] [PubMed]
- Youden, W.J. Index for rating diagnostic tests. Cancer 1950, 3, 32–35. [Google Scholar] [CrossRef]
- Anderson, M.J. A new method for non-parametric multivariate analysis of variance. Austral. Ecol. 2001, 26, 32–46. [Google Scholar]
- Dixon, P. VEGAN, a package of R functions for community ecology. J. Veg. Sci. 2003, 14, 927–930. [Google Scholar] [CrossRef]
- Biella, P.; Akter, A.; Ollerton, J.; Nielsen, A.; Klecka, J. An empirical attack tolerance test alters the structure and species richness of plant–pollinator networks. Funct. Ecol. 2020, 34, 2246–2258. [Google Scholar] [CrossRef]
- Dormann, C.F.; Gruber, B.; Fründ, J. Introducing the bipartite package: Analysing ecological networks. Interaction 2008, 8, 8–11. [Google Scholar]
- Doulcier, G.; Stouffer, D. Rnetcarto: Fast Network Modularity and Roles Computation by Simulated Annealing, 2015. R Package, Version 0.2.4. Available online: https://cran.r-project.org/web/packages/rnetcarto/rnetcarto.pdf (accessed on 7 September 2021).
- Bruno, A.; Sandionigi, A.; Bernasconi, M.; Panio, A.; Labra, M.; Casiraghi, M. Changes in the drinking water microbiome: Effects of water treatments along the flow of two drinking water treatment plants in a urbanized area, Milan (Italy). Front. Microbiol. 2018, 9, 2557. [Google Scholar] [CrossRef] [PubMed]
- Frigerio, J.; Agostinetto, G.; Galimberti, A.; De Mattia, F.; Labra, M.; Bruno, A. Tasting the differences: Microbiota analysis of different insect-based novel food. Food Res. Int. 2020, 137, 109426. [Google Scholar] [CrossRef]
- Galimberti, A.; Bruno, A.; Mezzasalma, V.; De Mattia, F.; Bruni, I.; Labra, M. Emerging DNA-based technologies to characterize food ecosystems. Food Res. Int. 2015, 69, 424–433. [Google Scholar] [CrossRef]
- Galimberti, A.; Casiraghi, M.; Bruni, I.; Guzzetti, L.; Cortis, P.; Berterame, N.M.; Labra, M. From DNA barcoding to person-alized nutrition: The evolution of food traceability. Curr. Opin. Food Sci. 2019, 28, 41–48. [Google Scholar] [CrossRef]
- Galimberti, A.; Bruno, A.; Agostinetto, G.; Casiraghi, M.; Guzzetti, L.; Labra, M. Fermented food products in the era of glob-alization: Tradition meets biotechnology innovations. Curr. Opin. Biotechnol. 2021, 70, 36–41. [Google Scholar] [CrossRef] [PubMed]
- Casey, J.M.; Meyer, C.P.; Morat, F.; Brandl, S.J.; Planes, S.; Parravicini, V. Reconstructing hyperdiverse food webs: Gut content metabarcoding as a tool to disentangle trophic interactions on coral reefs. Methods Ecol. Evol. 2019, 10, 1157–1170. [Google Scholar] [CrossRef]
- Arrizabalaga-Escudero, A.; Clare, E.L.; Salsamendi, E.; Alberdi, A.; Garin, I.; Aihartza, J.; Goiti, U. Assessing niche partitioning of co-occurring sibling bat species by DNA metabarcoding. Mol. Ecol. 2018, 27, 1273–1283. [Google Scholar] [CrossRef] [PubMed]
- Ruppert, K.M.; Kline, R.J.; Rahman, S. Past, present, and future perspectives of environmental DNA (eDNA) metabarcoding: A systematic review in methods, monitoring, and applications of global eDNA. Glob. Ecol. Conserv. 2019, 17, e00547. [Google Scholar] [CrossRef]
- Andriollo, T.; Gillet, F.; Michaux, J.R.; Ruedi, M. The menu varies with metabarcoding practices: A case study with the bat Plecotus auritus. PLoS ONE 2019, 14, e0219135. [Google Scholar] [CrossRef]
- Zinger, L.; Bonin, A.; Alsos, I.G.; Bálint, M.; Bik, H.; Boyer, F.; Chariton, A.A.; Creer, S.; Coissac, E.; Deagle, B.E.; et al. DNA metabarcoding—Need for robust experimental designs to draw sound ecological conclusions. Mol. Ecol. 2019, 28, 1857–1862. [Google Scholar] [CrossRef] [Green Version]
- Elbrecht, V.; Vamos, E.E.; Meissner, K.; Aroviita, J.; Leese, F. Assessing strengths and weaknesses of DNA metabarcoding-based macroinvertebrate identification for routine stream monitoring. Methods Ecol. Evol. 2017, 8, 1265–1275. [Google Scholar] [CrossRef] [Green Version]
- Forup, M.L.; Henson, K.S.; Craze, P.G.; Memmott, J. The restoration of ecological interactions: Plant–pollinator networks on ancient and restored heathlands. J. Appl. Ecol. 2008, 45, 742–752. [Google Scholar] [CrossRef] [Green Version]
- Fisogni, A.; Quaranta, M.; Grillenzoni, F.-V.; Corvucci, F.; de Manincor, N.; Bogo, G.; Bortolotti, L.; Galloni, M. Pollen load diversity and foraging niche overlap in a pollinator community of the rare Dictamnus albus L. Arthropod-Plant Interact. 2017, 12, 191–200. [Google Scholar] [CrossRef]
- Vianna, M.R.; Da Luz, C.F.P.; Kleinert, A.D.M.P. Interaction networks in a Brazilian cerrado: What changes when you add palynological information to floral visitor data? Apidologie 2013, 45, 418–430. [Google Scholar] [CrossRef]
- Marchand, P.; Harmon-Threatt, A.; Chapela, I. Testing models of bee foraging behavior through the analysis of pollen loads and floral density data. Ecol. Model. 2015, 313, 41–49. [Google Scholar] [CrossRef]
- Beil, M.; Horn, H.; Schwabe, A. Analysis of pollen loads in a wild bee community (Hymenoptera: Apidae)—A method for elucidating habitat use and foraging distances. Apidologie 2008, 39, 456–467. [Google Scholar] [CrossRef]
- Bohmann, K.; Gopalakrishnan, S.; Nielsen, M.; Nielsen, L.D.S.B.; Jones, G.; Streicker, D.G.; Gilbert, M.T.P. Using DNA metabarcoding for simultaneous inference of common vampire bat diet and population structure. Mol. Ecol. Resour. 2018, 18, 1050–1063. [Google Scholar] [CrossRef] [PubMed] [Green Version]
- Arribas, P.; Andújar, C.; Salces-Castellano, A.; Emerson, B.C.; Vogler, A.P. The limited spatial scale of dispersal in soil ar-thropods revealed with whole-community haplotype-level metabarcoding. Mol. Ecol. 2021, 30, 48–61. [Google Scholar] [CrossRef]
- Poos, M.S.; Jackson, D.A. Addressing the removal of rare species in multivariate bioassessments: The impact of methodological choices. Ecol. Indic. 2012, 18, 82–90. [Google Scholar] [CrossRef]
- Tylianakis, J.M.; Laliberté, E.; Nielsen, A.; Bascompte, J. Conservation of species interaction networks. Biol. Conserv. 2010, 143, 2270–2279. [Google Scholar] [CrossRef]
- Thébault, E.; Fontaine, C. Stability of ecological communities and the architecture of mutualistic and trophic networks. Science 2010, 329, 853–856. [Google Scholar] [CrossRef] [PubMed]
- Strydom, T.; Dalla Riva, G.V.; Poisot, T. SVD entropy reveals the high complexity of ecological networks. EcoEvoRxiv. 2020, 2. Available online: https://ecoevorxiv.org/q9v85/ (accessed on 7 September 2021).
- Cirtwill, A.R.; Eklöf, A.; Roslin, T.; Wootton, K.; Gravel, D. A quantitative framework for investigating the reliability of empirical network construction. Methods Ecol. Evol. 2019, 10, 902–911. [Google Scholar] [CrossRef]
- Alotaibi, S.S.; Sayed, S.M.; Alosaimi, M.; Alharthi, R.; Banjar, A.; Abdulqader, N.; Alhamed, R. Pollen molecular biology: Applications in the forensic palynology and future prospects: A review. Saudi J. Biol. Sci. 2020, 27, 1185–1190. [Google Scholar] [CrossRef]
- Fan, J.; Upadhye, S.; Worster, A. Understanding receiver operating characteristic (ROC) curves. CJEM 2006, 8, 19–20. [Google Scholar] [CrossRef] [PubMed]
- Nutz, S.; Döll, K.; Karlovsky, P. Determination of the LOQ in real-time PCR by receiver operating characteristic curve analysis: Application to qPCR assays for Fusarium verticillioides and F. proliferatum. Anal. Bioanal. Chem. 2011, 401, 717–726. [Google Scholar] [CrossRef] [PubMed] [Green Version]
- Siddique, A.B.; Biella, P.; Unterseher, M.; Albrectsen, B.R. Mycobiomes of Young Beech Trees Are Distinguished by Organ Rather than by Habitat, and Community Analyses Suggest Competitive Interactions among Twig Fungi. Front. Microbiol. 2021, 12, 646302. [Google Scholar] [CrossRef] [PubMed]
- Serrao, N.R.; Reid, S.M.; Wilson, C.C. Establishing detection thresholds for environmental DNA using receiver operator characteristic (ROC) curves. Conserv. Genet. Resour. 2018, 10, 555–562. [Google Scholar] [CrossRef]
- Ficetola, G.F.; Pansu, J.; Bonin, A.; Coissac, E.; Giguet-Covex, C.; De Barba, M.; Gielly, L.; Lopes, C.M.; Boyer, F.; Pompanon, F.; et al. Replication levels, false presences and the estimation of the presence/absence from eDNA metabarcoding data. Mol. Ecol. Resour. 2014, 15, 543–556. [Google Scholar] [CrossRef] [PubMed]
- Deagle, B.E.; Thomas, A.C.; McInnes, J.C.; Clarke, L.J.; Vesterinen, E.J.; Clare, E.L.; Kartzinel, T.R.; Eveson, J.P. Counting with DNA in metabarcoding studies: How should we convert sequence reads to dietary data? Mol. Ecol. 2019, 28, 391–406. [Google Scholar] [CrossRef] [Green Version]


| Source | Type of Sample | Organism | Type of Cut-Off Threshold | Detail on the Application of the Cut-Off Threshold | DNA Barcode Marker(s) | Nonfiltered Dataset Used in This Study |
|---|---|---|---|---|---|---|
| Baksay et al. (2020) [33] | Mock pollen samples | - | Mixed | Sequences with a count of ≤10, with no variants and with a count <5% of the total reads per sample | ITS1, trnL | |
| Bänsch et al. (2020) [34] | Pollen from legs | Apis mellifera, Bombus spp. (Apidae) | Not specified | - | ITS2 | |
| Bell et al. (2017b) [35] | Mock pollen samples | - | Negative controls | Removed identifications occurring at a frequency lower than those obtained in negative controls (isolation negative control = 34 reads, PCR negative control = 30 reads) | ITS2, rbcL | |
| Bell et al. (2017a) [12] | Pollen from the whole body | Hymenoptera: Anthophila | Negative controls | Removed taxonomic classifications recorded from reads fewer than the maximum number of a negative control (21-936 rbcL and 42-1124 ITS2) | ITS2, rbcL | X |
| Bell et al. (2019) [24] | Mock pollen samples | - | Negative controls | Threshold based on the maximum sequence count from any negative control (11 and 34 ITS2, 8 and 30 rbcL) | ITS2, rbcL | X |
| Beltramo et al. (2021) [36] | Honey | Apis mellifera (Apidae) | Proportional | Removed OTUs with <0.2% of the reads | trnL | |
| Biella et al. (2019) [17] | Pollen from legs | Bombus terrestris (Apidae) | Variable: statistical-based | Receiver Operating Characteristics (ROC) | ITS2 | X |
| Danner et al. (2017) [37] | Pollen from legs | Apis mellifera (Apidae) | Proportional | Removed species <1% of the relative reads count per sample | ITS2 | |
| DeVere et al. (2017) [38] | Honey | Apis mellifera (Apidae) | Not specified | - | rbcL | X |
| Elliott et al. (2021) [39] | Pollen from legs or scopa | Hymenoptera: Apidae, Halictidae, Megachilidae, Colletidae | Proportional | Removed taxa <1% of all reads per plant taxon for each bee species | rbcL | |
| Fahimee et al. (2021) [40] | Pollen from the whole body | Heterotrigona itama (Apidae) | Fixed—Not proportional | Removed OTUs with <2 reads | trnL | |
| Galliot et al. (2017) [41] | Pollen from the whole body | Diptera, Hymenoptera, Coleoptera, Lepidoptera | Negative controls | Threshold of 3 reads based on negative controls | ITS2 | |
| Gous et al. (2019) [42] | Pollen from the scopa | Megachile venusta (Megachilidae) | Proportional | Removed taxa <0.1% of total reads number per sample | ITS1, ITS2, rbcL | |
| Gous et al. (2021) [43] | Pollen from the scopa | Megachile spp. (Megachilidae) | Proportional | Removed taxa <0.1% of total reads number per sample | ITS2 | |
| Hawkins et al. (2015) [44] | Honey | Apis mellifera (Apidae) | Fixed—Not proportional | Removed taxa <10 sequences | rbcL | |
| Jones et al. (2021) [45] | Honey | Apis mellifera (Apidae) | Fixed—Not proportional | Singletons discarded | ITS2, rbcL | X |
| Khansaritoreh et al. (2020) [46] | Honey | Apis mellifera (Apidae) | Not specified | - | ITS2, rbcL | |
| Leidenfrost et al. (2020) [47] | Pollen from legs | Bombus terrestris (Apidae) | Not specified | - | ITS2 | |
| Lucas et al. (2018a) [48] | Pollen from the whole body | Syrphidae | Not specified | - | rbcL | |
| Lucas et al. (2018b) [49] | Pollen from the whole body | Syrphidae | Not specified | - | rbcL | |
| Lucek et al. (2019) [50] | Honey | Apis mellifera (Apidae) | Fixed—Not proportional | 5 reads per sequences cluster | ITS2 | X |
| Macgregor et al. (2019) [51] | Pollen from proboscid | Lepidoptera (moths) | Negative controls | Threshold of 50 reads based on positive and negative controls | rbcL | |
| Nürnberger et al. (2019) [52] | Pollen from legs | Apis mellifera (Apidae) | Not specified | - | ITS2 | |
| Peel et al. (2019) [53] | Pollen from legs | Apis mellifera, Bombus spp. (Apidae) | Proportional | Removed taxa <1% of the total assigned long reads per sample | Genomic DNA | |
| Piko et al. (2021) [54] | Pollen from the whole body | Bombus terrestris, B.pascuorum, B.lucorum (Apidae) | Mixed | Removed taxa <100 reads each sample and <1% of the total read count per sample | ITS2 | |
| Pornon et al. (2016) [55] | Mock pollen samples, Pollen from whole body | Hippeastrum sp., Chrysanthemum sp., Lilium sp.; Diptera, Hymenoptera, Coleoptera, Lepidoptera | Mixed | Removed taxa <0.1% of the most common sequences and <10 reads each sample | ITS1, trnL | |
| Pornon et al. (2017) [56] | Pollen from the whole body | Diptera, Hymenoptera, Coleoptera, Lepidoptera | Fixed—Not proportional | Sequences less than <1000 | ITS1, trnL | |
| Pornon et al. (2019) [31] | Pollen from the whole body | Syrphidae, Empididae, Apidae | Fixed—Not proportional | Sequences less than <1000 | ITS1, trnL | |
| Potter et al. (2019) [57] | Pollen from the whole body | Hymenoptera: Anthophila | Not specified | - | rbcL | |
| Richardson et al. (2015a) [19] | Pollen from legs | Apis mellifera (Apidae) | Not specified | - | ITS2 | |
| Richardson et al. (2015b) [58] | Pollen from legs | Apis mellifera (Apidae) | Not specified | - | ITS2, rbcL, matK | |
| Richardson et al. (2019) [59] | Pollen from legs | Apis mellifera (Apidae) | Proportional | Removed genera identified with only one marker and taxa with proportion of sequences <0.01% | ITS2, rbcL, trnL, trnH | |
| Richardson et al. (2021) [60] | Pollen from legs | Apis mellifera (Apidae) | Proportional | Removed genera identified with only one marker and with <0.001 proportional abundance of sequences | ITS2, rbcL, trnL | |
| Sickel et al. (2015) [61] | Pollen from nest | Osmia bicornis, O.truncorum (Megachilidae) | Proportional | Removed taxa <0.1% of reads per sample | ITS2 | |
| Simanonok et al. (2021) [62] | Pollen from legs | Bombus affinis (Apidae) | Mixed | Removed OTU <10 reads and taxa with <2% reads per sample | ITS2 | |
| Smart et al. (2017) [63] | Pollen from legs | Apis mellifera (Apidae) | Fixed—Not proportional | Removed taxa <50 reads | ITS1, ITS2 | |
| Suchan et al. (2019) [64] | Pollen from the whole body | Vanessa cardui (Lepidoptera) | Fixed—Not proportional | Removed taxa <100 reads per sample | ITS2 | |
| Swenson et al. (2021) [65] | Mock pollen samples | - | Mixed | Removed taxa <0.1% of the sample reads of ITS1 and ITS2; removed taxa occurring at a lower frequency than those obtained from negative controls | ITS1, ITS2, rbcL | |
| Tanaka et al. (2020) [66] | Pollen from honeycomb | Apis mellifera (Apidae) | Not specified | - | rbcL | |
| Tommasi et al. (2021) [67] | Pollen from the whole body | Hymenoptera: Anthophila, Diptera: Syrphidae | Not specified | - | ITS2 | X |
| Tremblay et al. (2019) [68] | Pollen from legs | Apis mellifera (Apidae) | Fixed—Not proportional | Removed taxa <100 reads | ITS2 | |
| Vaudo et al. (2020) [69] | Pollen from nest | Osmia cornifrons (Megachilidae) | Proportional | Removed taxa <1% sample read abundance and genera <0.3% of the total read counts per site across all sites | ITS2 | X |
| Wilson et al. (2021) [32] | Pollen from nest | Tetragonula carboniaria (Apidae) | Proportional | Removed taxa identified in blank controls with abundance <1% of the relative read abundance in real sample | ITS2, rbcL |
| Dataset | F-Value | Significance p of Full Model | Significance p of Pairwise Comparisons | |||||
|---|---|---|---|---|---|---|---|---|
| Proportional 1% vs. No Cut | Fixed 100 Reads vs. No Cut | Proportional 1% vs. Fixed 100 Reads | Statistical ROC vs. No Cut | Statistical ROC vs. 1% | Statistical ROC vs. Fixed 100 Reads | |||
| Tommasi et al. (2021) [67] | 0.819 | 0.806 | 1 | 1 | 1 | 0.031 | 0.314 | 0.045 |
| Bell et al. (2017a) [12] | 87.264 | 0.001 | 0.001 | 0.001 | 0.14 | 0.001 | 0.001 | 0.001 |
| Bell et al. (2019) [24] | 39.817 | 0.001 | 0.001 | 0.001 | 0.01 | 0.001 | 0.658 | 0.001 |
| Biella et al. (2019) [17] | 29.671 | 0.001 | 0.001 | 0.001 | 0.035 | 0.001 | 0.725 | 0.008 |
| Jones et al. (2021) [45] | 6.538 | 0.001 | 0.001 | 0.001 | 0.944 | 0.001 | 0.233 | 0.855 |
| Lucek et al. (2019) [50] | 5.465 | 0.001 | 0.001 | 0.001 | 0.038 | 0.001 | 0.975 | 0.058 |
| DeVere et al. (2017) [38] | 2.415 | 0.024 | 0.004 | 0.212 | 0.538 | 0.003 | 0.704 | 0.152 |
| Vaudo et al. (2020) [69] | 11.553 | 0.001 | 0.001 | 0.001 | 0.556 | 0.001 | 1 | 0.578 |
| Variable | Comparison | Estimated Difference | Significance p |
|---|---|---|---|
| Species richness | No cut—Fixed 100 reads | 0.383 | <0.001 |
| Proportional 1%—Fixed 100 reads | 0.043 | 0.178 | |
| Statistical ROC—Fixed 100 reads | −0.013 | 0.934 | |
| Proportional 1%—No cut | −0.340 | <0.001 | |
| Statistical ROC—No cut | −0.396 | <0.001 | |
| Statistical ROC—Proportional 1% | −0.055 | 0.040 | |
| Connectance | No cut—Fixed 100 reads | 0.660 | 0.008 |
| Proportional 1%—Fixed 100 reads | −0.068 | 0.991 | |
| Statistical ROC—Fixed 100 reads | −0.131 | 0.941 | |
| Proportional 1%—No cut | −0.729 | 0.004 | |
| Statistical ROC—No cut | −0.792 | 0.001 | |
| Statistical ROC—Proportional 1% | −0.063 | 0.993 | |
| Modularity | No cut—Fixed 100 reads | −0.678 | <0.001 |
| Proportional 1%—Fixed 100 reads | 0.000 | 1 | |
| Statistical ROC—Fixed 100 reads | 0.259 | 0.176 | |
| Proportional 1%—No cut | 0.679 | <0.001 | |
| Statistical ROC—No cut | 0.937 | <0.001 | |
| Statistical ROC—Proportional 1% | 0.259 | 0.177 | |
| Entropy | No cut—Fixed 100 reads | 1.189 | <0.001 |
| Proportional 1%—Fixed 100 reads | −0.191 | 0.819 | |
| Statistical ROC—Fixed 100 reads | −0.411 | 0.237 | |
| Proportional 1%—No cut | −1.380 | <0.001 | |
| Statistical ROC—No cut | −1.600 | <0.001 | |
| Statistical ROC—Proportional 1% | −0.220 | 0.746 |
| Filtering Type x Normalized Degree | Estimated Difference | Significance p |
|---|---|---|
| No cut—Fixed 100 reads | −11.896 | <0.001 |
| Proportional 1%—Fixed 100 reads | 0.279 | 0.756 |
| Statistical ROC—Fixed 100 reads | 0.694 | 0.456 |
| Proportional 1%—No cut | 12.175 | <0.001 |
| Statistical ROC—No cut | 12.590 | <0.001 |
| Statistical ROC—Proportional 1% | −0.414 | 0.662 |
Publisher’s Note: MDPI stays neutral with regard to jurisdictional claims in published maps and institutional affiliations. |
© 2021 by the authors. Licensee MDPI, Basel, Switzerland. This article is an open access article distributed under the terms and conditions of the Creative Commons Attribution (CC BY) license (https://creativecommons.org/licenses/by/4.0/).
Share and Cite
Tommasi, N.; Ferrari, A.; Labra, M.; Galimberti, A.; Biella, P. Harnessing the Power of Metabarcoding in the Ecological Interpretation of Plant-Pollinator DNA Data: Strategies and Consequences of Filtering Approaches. Diversity 2021, 13, 437. https://0-doi-org.brum.beds.ac.uk/10.3390/d13090437
Tommasi N, Ferrari A, Labra M, Galimberti A, Biella P. Harnessing the Power of Metabarcoding in the Ecological Interpretation of Plant-Pollinator DNA Data: Strategies and Consequences of Filtering Approaches. Diversity. 2021; 13(9):437. https://0-doi-org.brum.beds.ac.uk/10.3390/d13090437
Chicago/Turabian StyleTommasi, Nicola, Andrea Ferrari, Massimo Labra, Andrea Galimberti, and Paolo Biella. 2021. "Harnessing the Power of Metabarcoding in the Ecological Interpretation of Plant-Pollinator DNA Data: Strategies and Consequences of Filtering Approaches" Diversity 13, no. 9: 437. https://0-doi-org.brum.beds.ac.uk/10.3390/d13090437