
Diversity and Molecular Phylogeny of Pagurid Hermit Crabs (Anomura: Paguridae: Pagurus)


1
Japan International Research Center for Agricultural Sciences, 1-1 Ohwashi, Ibaraki 305-8686, Japan
2
Shenzhen Key Laboratory of Gene Regulation and Systems Biology, Department of Biological Sciences, Southern University of Science and Technology, Shenzhen 518055, China
3
Faculty of Agriculture (Main Building), Kyoto University (Yoshida North Campus), Kitashirakawa Oiwake-cho, Sakyo-ku, Kyoto 606-8502, Japan
*
Author to whom correspondence should be addressed.
Diversity 2022, 14(2), 141; https://0-doi-org.brum.beds.ac.uk/10.3390/d14020141
Submission received: 26 November 2021
/
Revised: 10 February 2022
/
Accepted: 11 February 2022
/
Published: 16 February 2022
(This article belongs to the Special Issue Ecology and Diversity of Marine Decapods)
Abstract
:Species of the genus Pagurus have diversified into a wide variety of marine habitats across the world. Despite their worldwide abundance, the genus diversity and biogeographical relationship are relatively less understood at species-level. We evaluated the phylogenetic relationship and genetic diversity among the Pagurus species based on publicly available mitochondrial and nuclear markers. While independent analyses of different markers allowed for larger coverage of taxa and produced largely consistent results, the concatenation of 16S and COI partial sequences led to higher confidence in the phylogenetic relationships. Our analyses established several monophyletic species clusters, substantially corresponding to the previously established morphology-based species groups. The comprehensive species inclusion in the molecular phylogeny resolved the taxonomic position of a number of recently described species that had not been assigned to any morpho-group. In mitochondrial markers-based phylogenies, the “Provenzanoi” group was identified as the basal lineage of Pagurus. The divergence time estimation of the major groups of Pagurus revealed that the Pacific species originated and diversified from the Atlantic lineages around 25–51 MYA. The molecular results suggested a higher inter-regional species diversity and complex phylogenetic relationships within the diverse and heterogeneous members of the genus Pagurus. The study presents a comprehensive snapshot of the diversity of pagurid hermit crabs across multiple geographic regions.
1. Introduction
Hermit crabs (Anomura) are a morphologically and ecologically highly diverse group of decapod crustaceans, inhabiting various dimensions of elevations from inland to deep-ocean. To cope with versatile ecological biotopes, species of hermit crabs have evolved a variety of specialized body forms and behaviors. In fact, species of this group are well-recognized for their asymmetric, decalcified, and coiled hind body (pleon) which can be looped into gastropod shells for protective shelter [1,2]. These attributes have long attracted the interests of evolutionary biologists for addressing various questions in the evolution of asymmetrical body form and phenotypic diversity. Moreover, being the ancestor of complete carcinized king crabs (Lithodidae) [3], these species are potentially excellent models for investigating adaptive ecology, comparative population biology, speciation, and biogeographic process [4]. While several aspects of phylogenetic relationship of anomuran have been extensively studied at higher taxonomic levels [5,6,7,8,9,10,11,12,13,14,15,16], a large-scale species level phylogeny and diversity using molecular data has not been exhaustively investigated.
Among hermit crabs, the genus Pagurus Fabricius, 1775 [17] is one of the most diverse groups with high morphological and ecological variability among the species [18]. The genus encompasses about 176 species worldwide [19]. The most obvious feature for differentiating Pagurus from other hermit crabs is the larger right cheliped, hence they are also known as right-handed hermit crabs. They are very common and important members among the macro-zoobenthic groups in the intertidal and subtidal communities. The pelagic larval stages (typically four stages) of Pagurus facilitate their wide distribution. However, due to the reliance on the abandoned shells of gastropods for protection; establishment of Pagurus populations in a particular environment is directly linked to the availability of marine gastropod shells and their quality and quantity [20]. Furthermore, the interspecific differences in the patterns of shell utilization also may limit the range of biogeographical distribution of these species [21]. Therefore, species composition and distribution of a sympatric community of the intertidal hermit crabs are largely associated with the features of resource (gastropod shell) partitioning [22]. Consequently, these species can potentially be used as an index for the study of biological interactions (i.e., competition for shell or other resources) and adaptive mechanisms of successful colonization of a variety of habitats ranging from costal to deep sea.
Over several decades, the classification of Pagurus hermit crabs has largely been carried out by reviewing both adult and larval morphology extensively, leading to a list of hypothetical species relationships [6,7,8,9,10,11,12,13,14,15,16,23,24,25,26,27,28,29]. For example, considering the characters of males (presence or absences of a pleopod on the second abdominal somite), Bouvier (1940) divided the Northeast Atlantic species into Group I (presence of a pleopod) and Group II (absences of a pleopod) [23]. After describing the larval and adult characters of the European species (northeastern Atlantic-Mediterranean regions), Ingle (1985) categorized the Pagurus species into eight groups under two subdivisions: Subdivision I (three groups) and Subdivision II (five groups) [28]. Later, McLaughlin et al. (1988) designated four larval groups and 12 adult groups in the eastern Pacific species (with two “unnamed group”) of Pagurus [29]. However, many species of the “unnamed group” (Group XII) were previously assigned to Ingle’s Subdivision I (Table 1). In the Ingle (1985) and McLaughlin et al. (1988) species arrangements, there are three groups (“Bernhardus”, “Anachoretus”, and “Trigonocheirus”) in common. As a result, there have been 15 groups recognized in the genus Pagurus based on adult morphology up until now (Table 1). However, these lists were geographically specific to the Atlantic-Mediterranean species [30], many species from the Indo-Pacific region were not included. Further, numerous new species have been described in more than three decades since the publications of Ingle (1985) and McLaughlin et al. (1988). Therefore, a number of species are yet to be assigned to the morpho-groups.
Identification of taxon based on morphological characteristics is a common method in the classical taxonomy, and the accuracy of such method is broadly accepted [31]. However, many challenging issues remain in the identification and delimitation of species that are phenotypically similar, but reproductively isolated. Furthermore, sibling and cryptic species are sometimes not properly identified by morphological characteristics alone [32,33]. On the other hand, convergent evolution of morphological features in distantly related species may also lead to wrong identification [34]. The availability and easy access to ever increasing DNA sequences and the development of the necessary computational tools are being employed in phylogenetic studies. The analyses of these sequences have proved useful for identification and delimitation of species that have less morphological distinctness in particular [35,36]. As a result, the molecular taxonomy or the integration of the morphology and molecular (morpho-molecular) data in taxonomy has become a more frequent and widely accepted approach to evaluate the evolutionary relationships among species at various taxonomic levels.
To resolve the complexity in taxonomic relationships among the morphologically convergent species in Pagurus, a considerable number of molecular phylogenetic studies have been conducted in recent years [37,38,39,40,41,42,43,44]. As a consequence, the paraphyly or polyphyly of the genus Pagurus was also suggested in some studies [15,39,40,44]. However, most of these reports are limited to a restricted geographic scope and provide only a fragmented picture of the taxonomic relationships. Despite the world-wide distribution of the Pagurus hermit crabs, information on the molecular phylogeny among the biogeographical lineages, intra/interspecific variations, and the regional species diversities remain deficient and unresolved. The increasing discoveries of new species from various geographical localities in recent years provides an opportunity to investigate the molecular phylogeny and geographical distribution patterns of the genus Pagurus from the major geographical localities.
In this study, we investigated the phylogenetic relationships, and the patterns of species diversity among the species of the genus Pagurus based on multiple genetic markers. The genetic diversity was determined by estimating both intra and interspecific genetic variations among the sequences. Next, the association between the morphology-based species groups and molecular phylogenetic relationships was assessed to evaluate the genetic evidence for supporting morpho-groups. Finally, the geographical distributions of the Pagurus species were investigated for the identification of the regional patterns of species diversity. The inclusion of a large number of species from a wide range of habitats and the use of multiple molecular data sets allowed us to present the most complete evolutionary picture for the genus Pagurus to date.
2. Materials and Methods
2.1. Taxon Sampling
To elucidate the phylogenetic relationships among the species of the genus Pagurus, the publicly available molecular data were retrieved from the GenBank with the aim of sampling as many species as possible. The specimens were chosen to obtain molecular data from a wide range of species across every major habitat, providing a complete geographical coverage throughout all possible distributions of Pagurus species (Figure 1). Species were assigned a location code defined by their sampling regions as Arctic Ocean (AO), North Sea (NS), North Atlantic (NA), northeast Atlantic (NEA), northwestern Atlantic (NWA), Caribbean Sea (CS), Mediterranean Sea (MS), Alboran Sea (AO), Gulf of Mexico (GoM), South Atlantic (SA), southwest Atlantic (SWA), North Pacific (NP), East Pacific (EP), northeast Pacific (NEP), northwest Pacific (NWP), southeast Pacific (SEP), Yellow Sea China (YSC), Yellow Sea South Korea (YSSK), East China Sea (ECS), South China Sea (SCS), Sea of Japan (SOJ), and Indian Ocean (IO).
2.2. Retrieval of Molecular Data
Appropriate genetic markers for species-level phylogenetic analyses are those that mutate quickly enough for difference to be observed between species. Though mitochondrial (mt) DNA markers have been proven useful in elucidating phylogenetic problem at species level, some factors derived from intergenomic co-adaptation can quicken or slow the rate of base substitution at various mtDNA loci and cause evolutionary rate variation between sites. Therefore, inclusion of more than two coding genes and nuclear markers are suggested to depict the evolutionary relationships between different species [45]. We therefore incorporated both mitochondrial and nuclear markers in our analyses.
2.3. Characteristics of Analysed Sequences Data
The resulting data set of complete mt genome consisted of 15 Pagurus species (https://0-www-ncbi-nlm-nih-gov.brum.beds.ac.uk/nuccore, accessed on 15 March 2021). However, among them, two sequences are duplicates (Table S1). Excluding the duplicates, 13 sequences of 10 species were left in the data set for final molecular analyses. Additonally, sequences of the partial mitochondrial gene regions, including 30 of the small subunit ribosomal gene (12S), 288 of the large subunit ribosomal gene (16S), and 1010 of the protein coding cytochrome c oxidase gene (COI), were obtained from both NCBI and UNIPROT databases (https://www.uniprot.org/uniprot/, accessed on 18 March 2021). In addition, sequences of three available nuclear genes, including 21 of the small subunit ribosomal gene (18S), 35 of the large subunit ribosomal gene (28S), and 19 of the Histone 3 (H3) were retrieved from the NCBI database (https://0-www-ncbi-nlm-nih-gov.brum.beds.ac.uk/nuccore, accessed on 23 March 2021).
Each individual marker was exploited for subsequent analyses. However, because of the numbers of sequences available, the inference of the molecular phylogenetic relationship and species diversity of the genus Pagurus was mainly based on 16S and COI gene trees. Moreover, because of the genetic relatedness of species from the same regions, only one species per location was included in the subsequent analyses. Therefore, the resulting pruned data sets for subsequent analyses included 73 sequences of 50 species (Table S3-1) and 127 sequences of 58 species (Table S4-1) for the 16S and COI genes, respectively. Furthermore, to obtain a more robust phylogenetic tree with increased branch support values, 16S and COI sequences were concatenated for the individuals from the same localities. A total of 50 sequences of 35 species were left in the concatenated (16S and COI) data set (Table S8). Despite the relatively small proportion of remaining data analyzed, the samples collectively encompass the breadth of morphological and ecological diversity of the genus Pagurus. For the analyses of the complete mitochondrial genomes, crayfish, Procambarus clarkii (NC_016926), was used as an outgroup taxon.
2.4. Phylogenetic Analyses
Different alignment methods were employed. The alignment of the ribosomal gene sequences was performed using ClustalW [46] in MEGA 7.0.16 [47] with the default settings: pairwise parameters, gap opening 15.0, gap extension 6.66, multi-alignment parameters, gap opening 15.0, and gap extension 6.66. On the other hand, aliment for the coding genes was performed based on the translated amino acid sequences using ClustalW (codons) with the default settings: pairwise parameters, gap opening 10.0, gap extension 0.1, multi-alignment parameters, gap opening 10.0, and gap extension 0.2. Ambiguous regions of the alignment were removed. Additionally, all alignments were visually examined for mismatches, and gaps/missing data were treated as complete deletions.
Phylogenetic trees were inferred by both the maximum likelihood (ML) [48] and neighbor joining (NJ) [49] methods. In ML analyses, the best-fit model under the “Find Best DNA/Protein Models” was searched for each gene. On the other hand, Kimura 2-parameter (K2P) model [50] was used as a model of substitution in NJ analyses. To determine confidence values for the resulting trees, for both NJ and ML methods, non-parametric bootstrap analyses were performed on 1000 replicates [51]. In case of identical topologies and bootstrap supporting values of two methods, the ML tree is shown. On the molecular trees, confidence values ≥50% were reported. Patterns of interspecific and intraspecific pairwise distances were calculated using the K2P substitution model implemented in MEGA.
2.5. Estimating Diversification Rates from Phylogenetic Information
We dated the ML phylogenetic tree derived from the combined 16S and COI sequences of 35 Pagurus species, which included one individual per taxon from a location, with Procambarus clarkii as an outgroup. While P. clarkii has been estimated to have diverged from Anomura about 357–385 millions of years ago (MYA) [15,52,53], P. brevidactylus and P. bernhardus diverged relatively recently at about 70.4 MYA [14]. We therefore eliminated Procambarus clarkii from the alignment and phylogenetic tree to focus the estimations of divergence times to the last 80 million years. The phylogenetic tree and aligned sequences were then used for the estimation of divergence times using MCMC tree in PAML package [54], following previously reported steps [55,56]. Briefly, the overall substitution rate was computed with baseml in PAML package, using <80 MYA divergence between P. brevidactylus and P. bernhardus. MCMC tree was then used to compute the gradient and Hessian using the overall substitution rate. The final steps involved the computation of the actual divergence times using the computed gradient and Hessian. The calibrations used were 60–80 MYA for the divergence of P. brevidactylus and P. bernhardus and 14–24 MYA for P. brevidactylus and P. maclaughlinae split [15]. The tree was then visualized in Fig Tree v 1.4.4 (http://tree.bio.ed.ac.uk/software/figtree/, accessed on 19 November 2021).
2.6. Morphological Characters Analyses
The morphological characteristics of Pagurus species were retrieved from the taxonomic literatures [35,36]. The diagnostic characters include the shape of chelipeds, number of spines/tubercles on its surface, shape of ambulatory pereopods, maxillipeds, telson, and so on. The morphological features were investigated with reference to the phylogeny of the morpho-based species groups.
3. Results
3.1. Species Composition
The localities of obtained sequences data may reflect the species richness and pattern of geographical distribution. Most of the species in our data set tend to be geographically restricted lineages; very few species show wider distributions (Table S9). The NWP species (Chinese, Korean and Japanese adjacent water) are restricted to the Kuroshio and Tsushima warm currents. Similarly, species of the NA region are confined to the North Atlantic gyre. While most of species maintain an exclusive limited distribution, a few species (P. longicarpus, P. prideaux, and P. pubescens) extend their ranges of geographical distibution widely along the North Atlantic and eastern Pacific regions. Some South African species (P. emmersoni and P. liochele) are also found in the Indian Ocean regions (Table S9).
3.2. Phylogenetic Aspects
The complete mt genome, and partial 12S, 16S, COI, 18S, 28S, and H3 data sets consisted of sequences of 10, 27, 50, 58, 19, 22, and 16 species, respectively (Table S1–S7). Several sequences were excluded from the analysis due to suspicious topologies after constructing phylogenetic trees (data derived from specimens may have been erroneously linked to species name on NCBI database due to misidentification, i.e., Pagurus japonicus: MG214647; Pagurus fraserorum: MF695071; Pagurus pollicaris: AF483159, etc.). The best fit models for each gene found in MEGA were as follows: (GTR + G) mt genome nucleotide, (mtREV + G + F) mt genome amino acid; (GTR + G + I) COI, combined 16S + COI; (T92 + G) 12S, 16S, 18S, 28S, and H3.
3.2.1. Complete mt Genome Sequences
Most of the taxa with complete mitochondrial genome sequences were exclusive to the NWP regions, except one species from the NA region. In the ML phylogenetic tree obtained from complete mt genome sequences, the NWP species formed a distinct clade that was further separated into three distinct sub-clades (Figure 2). The basal sub-clade consisted of two individuals of P. nigrofascia from the Yellow Sea, China (YSC), and Japanese waters. The genetic distance between them was very small (0.0003) (Table S10). Pagurus lanuginosus and P. maculosus were distinctly clustered together as sister species with 0.04 genetic diversities. Pagurus japonicus and P. filholi showed genetic closeness with 0.005 genetic distances, and distinctly separated from P. gracilipes. Pagurus minutus, and P. similis were clustered together as sister species. A Pagurus species (Pagurus sp.) collected at a 20 m depth from the northwester coast of Japan, showed genetic closeness with the species from the NA region (P. longicarpus). The genetic distances between the Pagurus species from the NWP regions and P. longicarpus ranged from 0.19–0.20, (Table S10).
3.2.2. Partial mtDNA Markers
In the 12S ML tree (Figure S1), species belonging to the “Provenzanoi” group (P. maclaughlinae, P. brevidactylus, and P. stimpsoni) were nested together. Similar to mt genome-based tree, species from the NWP regions clustered together and formed a distinct clade with one representative species of the “Smithi” and “Exilis” groups. However, unlike the mt genome-based tree, P. similis from the NWP region showed genetic closeness to an unassigned group species P. bullisi from the IO region and formed a distinct clade. On the other hand, most of the species from the Atlantic regions nested together in a distinct clade, and showed long genetic distance to the species from other regions. Representative species of the “Bernhardus” and “Comptus” groups were bifurcated, and positioned separately with low support values.
In the 16S ML tree, a single representative of the “Chevereuxi” group (belonging to the Ingle 1985′s Subdivision II), P. chevreuxi, positioned at the base (Figure 3). Similar to the result of 12S tree, species of the “Provenzanoi” group clustered together and formed a distinct clade. However, unlike the 12S tree, P. stimpsoni diverged at the base of this clade, and P. brevidactylus showed close genetic relationship with P. provenzanoi instead of P. maclaughlinae. P. criniticornis, and P. nr. criniticornis were likely to be the same species as they clustered together and formed a clade. On the other hand, P. nr. maclaughlinae and P. maclaughlinae were likely to be different species, since they positioned separately in two distinct clades. Pagurus nr. maclaughlinae was genetically close to P. nr. carolinensis, whereas, P. maclaughlinae was genetically close to P. nr. criniticornis/P. criniticornis species. Pagurus leptonyx and P. villosus were found genetically closed and nested with the “P. maclaughlinae-P. nr. criniticornis/P. criniticornis” clade. The results demonstrated the existence of genetically and geographically distinct populations in P. brevidactylus and P. criniticornis species. Pagurus meloi and P. heblingi, two unassigned species to any morpho-group, nested together in a clade with high bootstraps support, and positioned as sister-taxon to the “Provenzanoi” clade.
Species of the “Alatus”, “Prideaux”, and “Cuanensis” groups (belonging to the Ingle 1985′s Subdivision I) were positioned together in a distinct clade. The “Alatus” group was bifurcated into two distinct clades, since P. excavates was isolated distinctly from other two members of this group. Similar pattern of isolation was also observed between the species of the “Cuanensis” group that two members of this groups, P. forbesii and P. cuanensis were positioned distantly. An unassigned morpho-group species, P. pseudosculptimanus clustered with the Subdivision I clade. On the other hand, among the five species groups of the Ingle 1985′s Subdivision II, species of only three groups were included in the analyses. A single representative of the “Trigonocheirus” group, P. pubescens formed a distinct clade and showed genetic closeness with species of the “Capillatus” group, P. kennerlyi. An unassigned morpho-group species, P. pectinatus was nested with P. kennerlyi. Species belonging to the “Bernhardus” group were nested together. However, P. aleuticus was positioned distantly and showed genetic closeness with P. pubescens, P. kennerlyi, and P. pectinatus.
Species of the “Comptus” group were split into several clades suggesting a polyphyletic group. Pagurus forceps, P. comptus, and P. edwardsii were clustered together and isolated from other members such as P. beringanus, P. caurinus, P. granosimanus, and P. middendorffii. Unlike the 12S tree, P. bullisi from the IO regions clustered with the “Comptus” species from the SP regions, whereas P. similis clustered with P. minutus as was in the complete mt genome tree (Figure 2). The species of “Exilis” group (P. exilis, P. gladius, P. longicapus, and P. perlatus) showed a close genetic relationship with a species of the “Smithi” group (P. pollicaris) (Figure 3).
The NWP regions species comprised several clusters with high bootstrap support values. Two individuals of P. nigrofascia clustered together. Pagurus maculosus and P. lanuginosus were nested with P. proximus from Russian Far East. Pagurus hirsutiusculus was clustered with the NWP species. Consistent with the result of the complete mt genome tree, P. minutus and P. similis were closely related species. Unlike 12S phylogeny, but similar to the complete mt genome tree, P. filholi, P. japonicus, and P. gracillipes showed genetic closeness. An affinity between P. brachiomastus and P. beringanus (species of the “Comptus” group) was found.
In the most species-rich COI based ML tree (Figure 4), the species clustering was mostly consistent with the results of other mtDNA markers. However, a few inconsistencies were found in species topologies. Three representative species of the “Provenzanoi” group were divided into two clades. Similar to the 16S tree, P. brevidactylus and P. nr. maclaughlinae clustered together in a distinct clade, and P. criniticornis/P. nr. criniticornis formed another clade, though the bootstrap support values were low (<50%).
Similar to the 16S tree, species of the Ingle 1985′s Subdivision I (“Alatus”, “Prideaux”, and “Cuanensis”) groups formed a distinct clade. Phylogenetic relationship of some unassigned morpho-group species was found to correlate with geographical distributions. We observed that species from the IO regions clustered together, and formed a distinct clade near to the Subdivision I clade. The genetic relationship among the species of the “Bernhardus” group was clearly reflected by the COI tree; species of this group were clustered together in a distinct clade. However, an unassigned morpho-group species P. acadianus was nested in this clade. Species of the “Trigonocheirus” group formed a distinct monophyletic clade with an unassigned morpho-group species, P. rathbuni. The close genetic relationship between the species of the “Capillatus” group and P. pectinatus was also proven by the COI tree. An unassigned morpho-group species, P. constans showed close genetic relationship with the “Capillatus” group. A close genetic relationship between the species of the “Trigonocheirus-Capillatus” and “Exilis-Smithi” groups were also proven by the COI tree.
Consistent with other mtDNA marker phylogenies, species from the NWP regions were divided into several sub-clades with higher bootstrap support values. Pagurus filholi, P. japonicus, P. minutus, and P. similis were nested in a distinct clade with P. nigrivittatus. The taxonomic position of P. middendorffii, P. nigrofascia, and P. brachiomastus was inconsistent among mtDNA markers (Figure 3, Figure 4 and Figure S1). Unlike 16S tree, species of the “Comptus” group clustered together, however, P. caurinus was isolated into different clade. An unassigned morpho-group species, P. venturensis showed genetic closeness with the “Comptus” group.
To obtain more informative sites, the aligned sequences of 16S and COI were concatenated for species with both markers. The phylogenetic tree obtained from the concatenated sequences (Figure 5) had a better resolution of ancestral relationships among the morpho-based Pagurus groups, depicted by three monophyletic linages (L 1–3) with higher bootstrap support. These three major linages can be further divided into five clades (clade I–V), though some clades have low bootstrap supports (Figure 5). Consistent with both 16S and COI trees, species of the “Provenzanoi” group clustered together as the basal clade (clade I). Species of the “Alatus-Prideaux-Cuanensis” groups formed a distinct clade II. However, P. alatus and P. pubescentulus showed genetic closeness with P. forbesii of the “Cuanensis” group. Species of the “Exilis” and “Smithi” groups were genetically the closest and formed the clade III with P. comptus. The hairy hermit crab, P. hirsutiusculus, was diverged at the base of clades IV and V. The NWP species around the Japanese adjacent waters clustered together and formed the clade IV. Species of the “Trigonocheirus” group nested with that of the “Capillatus” group, and formed the clade V with three unassigned morpho-group species P. brachiomastus and P. nigrofascia and P. pectinatus. On the other hand, species of the “Bernhardus” and “Comptus” groups were also nested together with this clade V.
3.2.3. Partial Nuclear DNA Markers
The sequences of all three nuclear markers were not available for the same analyzed taxa, therefore, the comparison or concatenation of the sequences were difficult. Nevertheless, the phylogenetic relationships established using 18S, 28S, and H3 ML trees (Figure 6A–C, respectively), were congruent with those inferred from mtDNA markers. However, a few inconsistencies were found in general tree topologies. Species of the “Provenzanoi” group were always clustered together in a distinct clade in all three markers. Similar to the 16S tree, in the H3 tree P. stimpsoni diverged at the base, and P. maclaughlinae, P. criniticornis, P. leptonyx, and P. villosus were found to be genetically closely related species. However, P. heblingi and P. meloi that were close to the “Provenzanoi” group in 16S tree, were positioned distantly in H3 tree.
Consistent with the results of mtDNA markers, in both 18S and H3 ML trees (Figure 6A,C), species of the “Exilis” and “Smithi” groups were nested together showing genetic closeness to each other. Similar to the results of mt-based trees, species of the ‘Comptus’ and “Bernhardus” groups were scattered in several clades, and showed inconsistencies in topologies. Pagurus beringanus and P. bernhardus clustered together in both 18S and 28S trees. However, two individuals of P. bernhardus were isolated distantly in the 28S tree. P. comptus clustered with the “Comptus” group in the 18S tree, was positioned separately in both 28S and H3 trees. Similarly, in 16S tree, P. comptus clustered with P. foceps and P. edwardsii, however, it isolated from these two species and clustered with the “Provenzanoi” group in the H3 tree. Unlike in the mtDNA marker trees, P. hirsutiusculus and P. granosimanus were clustered together in both 18S and 28S trees. In the 28S tree, a single representative of the “chevereuxi” group, P. chevreuxi, positioned separately. Similar to the results of mtDNA markers, species of the “Alatus” group formed two distinct clades, however, P. excavatus was clustered with P. pseudosculptimanus, instead of P. cuanensis as in the COI tree. Consistent with the results from mtDNA markers, the clustering and formation of morpho-based species “Prideaux-Alatus-Cuanensis” clade was also supported by the nuclear marker 28S (Figure 6B).
3.3. Genetic Variability among Geographical Regions
Pagurus species are most likely to be restricted to narrow geographical localities, with the largest number of endemic species confined to the Northwest Pacific, and the western and eastern North Atlantic regions. A few species inhabit the South Atlantic, the Indian Ocean, and the China Sea regions. Analysis of interspecific variations reflected the genetic diversifications among the Pagurus species from various geographical localities (Table 2 and Table S10–S13). Based on 16S, the interspecific genetic distances between P. provenzanoi and P. brevidactylus ranged from 0.003–0.06. These values were smaller than the intraspecific genetic diversity of P. brevidactylus individuals that ranged from 0.06–0.07 (Table S11), and the highest intraspecific genetic variability (0.07) was found between NWP and CS populations. Pagurus nr. maclaughlinae and P. maclaughlinae are seemed to be different species, as they had 0.09–0.10 K2P genetic distances based on 16S data, larger than that the interspecific genetic variation between P. criniticornis and P. maclaughlinae (0.07), or between P. nr. maclaughlinae and P. nr. carolinensis (0.08–0.09) (Table S11). Based on the third codon of COI gene, the genetic distances between the species of “Alatus” group (P. alatus and P. pubescentulus) and the species of “Cuanensis” group (P. forbesii) ranged from 0.38–0.43, smaller than those 0.75–0.82 with another species of the “Alatus” group, P. excavate (Table S12).
Species from the Indian Ocean, which formed a monophyletic clade in the COI tree, showed low level of interspecific genetic distances. The least interspecific diversity (0.12) was found between P. emmersoni and P. liochele, whereas the highest interspecific diversity (0.59) was found between P. emmersoni and P. fraserorum. Surprisingly, that was 0.01 between P. pitagsaleei from SCS and P. boriaustraliensis from IO (Table S12), which was even smaller than the intraspecific genetic variation among two different populations of P. liochele from IO and SA (0.02). The North Atlantic species, P. pollicaris and P. longicarpus, each formed a monophyletic clade (Figure 4), with a range of intraspecific genetic distances of 0.01–0.84 and 0.02–0.12, respectively (Table S12). The higher genetic divergence of the gulf (GoM) populations of P. longicarpus (Figure 4) may indicate the less genetic connectivity and less expansion of population compare to the open waters. A similar case was found between two populations of P. beringanus from the eastern North Atlantic region that showed 0.03 intraspecific genetic diversity. Likewise, two population of P. arcuatus showed 0.02 intraspecific genetic diversity. Similarly, higher inter-regional intraspecific diversity (0.17) was also found between populations of P. cuanensis from the North and South Atlantic regions. Among the populations of P. bernhardus, the highest (0.04) intraspecific genetic diversity was found between the North Sea and North Atlantic individuals.
Based on the combined 16S + COI data (Table 2), the highest interregional genetic diversity (0.18) was found between the species from MS and AO, CS, and NS, whereas the lowest genetic diversity 0.05 was found between the species from MS and NS. On the other hand, the highest intraregional genetic diversity was found among the species from NWA (0.14), followed by species from the SA (0.13), CS (0.12), and NP (0.10), whereas the lowest was found among the species from NEA (0.08) and NEP (0.09) (results were not shown).
3.4. Geographical Diversification
To investigate the timescale for biogeographical connection, we dated the divergence among Pagurus species (Figure 7). Divergence times estimated in the present study revealed that Pagurus species from the Atlantic and Pacific diverged between 25–51 MYA. The main diversification of extant lineages took places between 4–25 MYA. The major NWP lineages seemed to have diverged from NP ancestor between 16–18 MYA.
3.5. Morphological Characteristics within Pagurus Species
In molecular phylogeny, the patterns of distinct separation among species may interpret the variations in morpho-anatomical traits. The diagnostic characteristics among the species group were shown in Table 3. The genetic closeness between P. provenzannoi and P. brevidactylus is consistent with their common diagnostic character of bearing of a row of more than tree terminal spines [26]. The genetic closeness between P. meloi and P. heblingi in both 16S and H3 trees may correspond to several similar morphological characteristics, e.g., shape of chelipeds, long second and third pereopods, slender dactyls, and shape of gill [35,40].
In the “Ingle’s Subdivision I” clade, the relationship between the species of “Alatus” and “Cuanensis” groups remains ambiguous. Generally, P. excavatus was separated from other members of the “Alatus” group. Instead, it positioned at the base of the “Ingle’s Subdivision I” clade in 16S, nested with P. cuanensis in COI, P. pseudosculptimanus in 28S, and with both in combined 16S + COI trees. These relationships are consistent with the adult morphology that is quite unlike the “Alatus” group but similar to P. cuanensis and P. pseudosculptimanus, with the male P. excavatus having four unpaired pleopods [38,57]. The main differences in morphological traits between P. alatus and P. excavatus were described as follow; segment 1 of antennular peduncle with 1-3 spines, cheliped palm not striking concave, male with three unpaired pleopods in P. alatus; whereas in P. excavatus, segment 1 of antennular peduncle without or with small obtuse spines, cheliped palm strikingly concave, male with four unpaired pleopods [38]. The distinct genetic separation of the two species of the “Cuanensis” group, P. forbesii and P. cuanensis can be explained by their morphological differences that in outer surface of right cheliped with long, dense setae in P. cuanensis, which is either absent or present in a few numbers in P. forbesii. The lower margin of dactyl of pereiopod 3 is relatively smooth in P. cuanensis but with subacute teeth and spines in P. forbesii [28].
Though the suggested closely related species of P. proximus was P. brachiomastus [58], P. proximus clustered with P. maculosus and P. lanuginosus in the molecular phylogeny. This relationship may reflect an accord with a common morphological feature among these species having very dense hairs on cheliped/pereopods. Pagurus maculosus can be distinguished from P. lanuginosus by the number of calcareous teeth on the dactyl of and presence or absence of a large tubercle of the merus of the right cheliped, and distinct chromatophore color (white vs. black- spotted, respectively) across the carapace and walking legs [59]. On the other hand, P. proximus differs from the other two species by the color of antenna and antennules (former have bright red in color) and horizontal striped pattern instead of spotted chromatophore [58].
On the contrary, P. brachiomastus showed close genetic relationship with P. beinganus (in 16S tree), P. simulans (in COI tree), and P. nigrofascia (in combined 16S + COI tree). Pagurus brachiomastus is recognizable by the distally red colored chelae and dactyli of the ambulatory pereopods, whereas P. nigrofascia is characterized by the olive colored chelipeds with scattered dark brown spots in general, and orangish tips; the dactyls are banded proximally with dark brown or gray, without stripes. Pagurus simulans differs from these two species by brown chelipeds and ambulatory pereopods [60]. Pagurus beinganus is diagnosed by chelipeds with flame scarlet spines, distal end of merus with a distinct scarlet band; ambulatory legs with large irregular spots of claret brown, antennae claret brown to brussels brown [26].
4. Discussion
The scarcity of genetic data for a significant number of species covering broader geographic locations is a major challenge in biogeographical studies of non-model organisms. In this study, however, an attempt was made to evaluate extensive molecular phylogeny of the genus Pagurus from a wide range of taxa currently available from a wide range of geographical locations. Many recent molecular studies have dramatically increased our knowledge on ancestral relationship of Pagurus species, however, the exploration of many new species in recent years highlights the necessity for integrated and continued molecular phylogenetic study of this group.
Of the molecular data sets analyzed, the COI gene consisted of the largest number of taxa representing wider locations. The phylogenetic relationship among the Pagurus species was mainly delineated based on the 16S, COI, and combined 16S and COI data sets. In the double-marker genetic approaches, the tree topologies showed substantially similar phylogenetic relationships among the terminal taxa, and largely consistent with the previously assigned morpho-trait based species groups. The close relationship among the morpho-groups in the phylogenetic analyses may suggest that the phenotypic traits are substantially supported by the molecular evidence. The inclusion of species from the Pacific regions—especially from the Chinese, Korean and Japanese waters, and Indian Ocean—in the present study resulted an increased clade diversity as well as regional diversity.
Despite the aim that the current study endeavored to evaluate an extensive molecular phylogeny of the genus Pagurus including a wide range of taxa; a few representative taxa of each morpho-based species group were obtained for the analyses. However, in terms of taxon numbers, the present study is so far the most comprehensive of Pagurus. The distinct cladistics forms obtained here may likely reflect interspecific variation related to unique morphological traits. Taxon composition of the “Provenzanoi” group were consistent among markers in 12S, 16S, COI, and 28S trees (Figure 3, Figure 4, Figure 6B, and Figure S1). Species of this group always formed a monophyletic linage with some subdivisions, and represented the earliest diverging group of Pagurus.
In agreement with the morphology-based taxonomy, phylogenetic trees inferred from both mtDNA and nuclear markers established the monophyly of the Ingle’s (1985) Subdivision I, consisting of “Alatus” group (P. alatus, P. excavates, and P. pubescentulus), “Prideaux” group (P. prideaux), and the “Cuanensis” group. However, the assemblage of species in the “Alatus” and “Cuanensis” groups were not well-resolved due to the inconsistencies in phylogenetic relationships among markers. In the 16S tree, P. excavatus positioned at the base of the “Ingle’s Subdivision I” clade. In contrast, it nested with P. cuanensis in COI, P. pseudosculptimanus in 28S, and with both in combined 16S + COI trees. With the conclusion of morpho-taxonomy and based on the results obtained from the molecular phylogenetic analyses, the genetic closeness between P. pseudosculptimanus and P. excavatus may suggest proposing a new species group to unite these two species.
On the other hand, species of only three groups (“Bernhardus”, “Trigonocheirus”, and “Chevreuxi”) among five groups of Ingle’s (1985) Subdivision II were attained in the analyses. The phylogenetic relationship among three representative species of the “Bernhardus” group were clearly depicted by COI tree (Figure 4) than the 16S tree (P. aleuticus was isolated) (Figure 3). Pagurus acadianus, unassigned to any morpho-group, was nested with the “Bernhardus” group as sister species in COI tree. Species of the “Trigonocheirus” group nested together in a distinct monophyletic clade with P. rathbuni (Figure 4), and showed genetic closeness with the “Capillatus” group. A single representative species of “Chevreuxi” group, P. chevreuxi, showed distinct genetic isolation in both 16S and 28S trees.
The previously reported polyphyly of the “Comptus” group was largely congruent with the present study [15,37,39,44,61]. In most cases, the actual phylogenetic relationship could not be established because the species of the “Comptus” group were split into several distinct clades in both individual and combined trees. According to the description of McLaughlin et al. (1988), species of the “Comptus” group form the North American region has ambulatory legs with short dactyls ornamented by strong, spiniform bristles on ventral margin; and a thin chitinous layer on lateral margins of the posterior lobes of the telson. Therefore, the review of the species listed in this group has been suggested [29]. The genetic closeness between the “Exilis” and “Smithi” groups was supported by both mtDNA and nuclear markers. This genetic closeness was consistent with the previous spermiotaxonmic study that the morphology of spermatophore (an ovoid and slightly flattened capsule shaped main ampulla and similar accessory ampulla) is identical among P. exilis, P. pollcaris, and P. longicarpus [7,13]. The Species of the “Capillatus” group showed genetic relationship with P. pectinatus in all mtDNA markers and always nested together (Figure 3, Figure 4 and Figure 5). Based on the results, the possible inclusion of P. pectinatus in “Capillatus” group could be proposed.
In all phylogenetic analyses, species from the NWP regions did not appear as monophyletic group, but rather appeared as more distantly related than their localities suggest. Species were split and formed several sub-clades, and positioned distantly, though the species topologies were not consistent. Each united sub-clade may correspond to a particular morphological trait. One sub-clade consists of P. lanuginosus, P. maculosus, and P. proximus from the Russian Far East, while the other sub-clade consists of P. filholi, P. japonicus, P. gracilipes, and P. minutus (Figure 5). Pagurus brachiomastus, P. middendorffii, and P. nigrofascia isolated and positioned with the “Ingle’s Subdivision II” clade. The phylogenetic position and interspecific relationship among P. brachiomastus, P. middendorffii, and P. nigrofascia were not well-resolved due to a number of contradicting tree topologies produced by mtDNA markers (Figure 3, Figure 4 and Figure 5 and Figure S1). Pagurus brachiomastus were related with P. nigrofascia based on the COI and combined trees. However, based on the 12S and 16S trees, they were found to be distantly related. Similar topological inconsistencies were also found for P. middendorffii in 16S and COI trees (Figure 3 and Figure 4). Although in phylogenetic trees, the clustering of taxa was mainly formed based on morpho-groups; highly supported clades were also found that consisted of species collected from the same geographical localities. In most cases, species distributed in the IO, SCS, and SA regions nested together and formed a monophyletic clade (Figure 4). A representative of P. pitagsaleei population from the Taiwan has close relationship with P. boriaustraliensis from the Australian region. Indeed, previous report suggested that these two species might be two populations of the same species [62]. The relationship presented here suggests a close ancestral relationship among the species. Similarly, P. meloi and P. heblingi were likely to be genetically close species (Figure 3 and Figure 6C). This result is consistent with previously reported findings from both molecular [39], and morphological studies that they are morphologically similar but can be differentiated from each other by the morphology of telson plate [43,48]. Interestingly, the analyses of H3 sequences support the previous report that the two species were separate from “Provenzanoi” group [39].
Generally, species of the genus Pagurus appear as geographically disjunct populations, since species distributed in the Pacific regions were rarely found in Atlantic regions, and vice versa. It may suggest that the migrations across geographical barriers are rare. The Pagurus hermit crabs, with the active migratory pelagic larval stages, can disperse widely via the transportation of the ocean currents. However, their ranges of expansion remain somewhat static throughout their shell-dwelling juvenile-to-adult lives. The water temperature could be one of the most important barriers for their dispersion particularly for dispersal at the larval stages. Further the biological interactions (i.e., competition for shell or other resources) may affect the observed distribution patterns. Recent discoveries of several new anomuran species in areas of the Indo-West Pacific regions support the prediction that there may be many undescribed species particularly in areas of Indo-west Pacific, the Central Indian Ocean, and the East Asian Sea [63].
The knowledge of the distribution patterns of organisms is important for the understanding of global diversity. All species occurring in either the Atlantic or the Pacific regions were likely restricted to the respective areas. The divergence time estimation indicated that the Pacific species likely diverged from the Atlantic ancestors, perhaps through the Arctic Ocean connectivity pathway (Figure 7). The “Provenzanoi” species represented the basal clade, and the time tree suggested that it arose at the age of 33 MYA. Species of the “Exilis” group diverged from the “Smithi” group around 20 MYA. The “Alatus” group appeared to have spilt at 15.87 MYA. The Japanese intertidal hermit crab species that possesses a similar geographic distribution, have likely derived from the North Pacific origin, estimated dates for the subsequent diversification ranged from 16 (P. nigrofascia) to 18 MYA (major Japanese species clade). The estimated clade ages suggest that P. filholi and P. japonicus, P. minutus, and P. similis clades diversified nearly at the same time, since the divergence times of these species were 1.27 MYA and 1.44 MYA.
To advance our understanding of the biogeographical history of a group, a robust and well-resolved phylogenetic tree is required [64]. Taxon sampling is thus fundamental, as limited taxon sampling may bias phylogenetic relationships as well as influence the reliability of any estimate of ancestral area of distribution. Genetic divergence and geographic distances were not compared analytically in this study due to the inability to include multiple populations for each species in the analyses. Despite that, an empirical estimation for the level of relationship was obtained by using species representatives from distant localities where possible. A high inter-regional genetic population structure was found in our analyses. The highest rate of genetic diversification (0.18) was found between the species of MS and AO regions (Table 2), suggesting more ancestral relationship and/or genetic isolation. Similar result of genetic diversification was also found between the species of CS and NS regions. It may indicate that the marine biogeographic barriers (e.g., the Mid-Atlantic Barrier that directs the straight-line flow of the major east–west current at the Atlantic zones, and the Amazon Barrier at the Amazon and Orinoco rivers) effectively influence the long-distance dispersal of the pelagic larvae of the Pagurus species along these regions [65]. On the other hand, the lowest genetic diversity (0.05) was found between the species from MS and NS regions. The low level of genetic differences between species from different localities may indicate close ancestral or habitats interconnected by gene flow [66]. It may also suggest weak selective pressures leading to divergence or limited localized adaptation than that in the gulf population. Our analyses revealed that the highest intraregional genetic diversity was found among the species from NWA (0.14), followed by species from the SA (0.13), CS (0.12), and NP (0.10), whereas the lowest was found among the species from NEA (0.08) and NEP (0.09) (results are not shown).
Some phylogenetic relationships could not be exhaustively resolved because of the limited genetic markers and taxonomic coverages. Nonetheless, it is unlikely that the general patterns of phylogeny observed here have been biased by such limitations. Independent analysis of different markers allowed for the inclusion of large number of species from different habitats, while the concatenation of 16S and COI regions gave higher confidence because of increased number of informative sites. The incomplete taxon inclusion may influence the estimation of spatial diversification. Therefore, future comprehensive molecular studies on the regional endemic Pagurus fauna, and the integration of those results would benefit from inclusion of larger number of taxa from broader geographical localities. In addition, to establish a precise taxonomic relationship among the major genetic lineages of this genus Pagurus, larger sample size per population and sequencing of more genetic markers across geographical ranges are necessary. These more comprehensive studies would require international collaborative studies/joint research agreements.
5. Conclusions
In this study, we have assessed the phylogenetic relationship and estimated the intra/interspecific genetic diversity among the major lineages of Pagurus with the currently available molecular data. The data sets analyzed here were one of the most comprehensive molecular data sets of a larger number of representative individuals of the Pagurus species across global bioregions. While independent analysis of each molecular marker led to the analyses of numerous taxa, the concatenation of the sequences provided results with higher confidence. The results provide a new insight into evolutionary relationships among the Pagurus species. We confirmed previous morphology-based taxonomic classifications from the molecular data. The taxonomic classification of a number of previously unassigned group species were resolved. We established that “Provenzanoi” was the basal group of Pagurus genus. Additionally, our analyses supported previous studies reporting the polyphyly of “Comptus” group. Taken together, this study provides a comprehensive phylogenetic analysis revealing the diversity of Pagurus species distributed across multiple geographical locations.
Supplementary Materials
The following are available online at https://0-www-mdpi-com.brum.beds.ac.uk/article/10.3390/d14020141/s1. Figure S1: Individual gene tree constructed from mitochondrial marker (12S) based on maximum-likelihood (ML) method with 1000 bootstraps. Different colors represent the morpho-based species groups: “Alatus” in light blue; “Bernhardus” in green; “Capillatus” in magenta; “Chevereuxi” in gray; “Comptus” in blue; “Cuanensis” in olive; “Exilis” in lawn green; “Prideaux” in red; “Provenzanoi“ in purple; “Smithi” in medium turquoise; “Trigonocheirus” in brown; and unassigned morpho-group species are in black. Table S1: Species information and accession numbers for the complete mitochondrial genome sequences used for assessment of Pagurus species diversity. Table S2: Species information and accession numbers for the 12S sequences used for assessment of Pagurus species diversity. Table S3: Species information and accession numbers for the 16S sequences downloaded from NCBI for assessment of Pagurus species diversity. Table S3-1: Species information and accession numbers for the selected 16S sequences used for assessment of Pagurus species diversity. Table S4: Species information and accession numbers for the COI sequences downloaded from NCBI for assessment of Pagurus species diversity. Table S4-1: Species information and accession numbers for the selected COI sequences used for assessment of Pagurus species diversity. Table S5: Species information and accession numbers for the selected 18S sequences used for assessment of Pagurus species diversity. Table S6: Species information and accession numbers for the selected 28S sequences used for assessment of Pagurus species diversity. Table S7: Species information and accession numbers for the selected H3 sequences used for assessment of Pagurus species diversity. Table S8: Species information and accession numbers for the concatenated mitochondrial genome sequences used for assessment of Pagurus species diversity. Table S9: Species of the genus Pagurus along the major geographical localities. Table S10: Pairwise genetic distance Kimura’s two-parameter model (K2P) values (per site) among Pagurus species based on complete mt genome. Table S11: Pairwise genetic distance Kimura’s two-parameter model (K2P) values (per site) among Pagurus species based on the 16S gene. Table S12: Pairwise genetic distance Kimura’s two-parameter model (K2P) values (per site) among Pagurus species based on the third codon of the COI gene. Table S13: Pairwise genetic distance Kimura’s two-parameter model (K2P) values (per site) among Pagurus species based on the 16S + COI genes.
Author Contributions
A.A. and Z.S. conceptualized this work. Z.S. collected sequences and performed the phylogenetic analyses. I.A.B. led the additional phylogenetic analyses and provided valuable advice on other analyses. A.A. managed funds for the publication. Z.S. primarily wrote the manuscript and finalized with input from all authors. All authors have read and agreed to the published version of the manuscript.
Funding
This research received no external funding.
Institutional Review Board Statement
Not applicable.
Data Availability Statement
All sequence data used in this study have been downloaded from the NCBI database with accession numbers provided by each gene list as a supplementary file. Intermediate data used for these analyses are available upon reasonable request to the corresponding author.
Acknowledgments
The authors are deeply indebted with all the colleagues which have collaborated on the molecular phylogenetic study of Pagurus species over the years and made those molecular data available to the public database. Special thanks to two anonymous reviewers for their critic comments on the manuscript. Authors are grateful to Patricia Briones-Fourzán and Michel E. Hendrickx, Guest Editors of the open-access journal Diversity, for providing an opportunity to submit this manuscript for a special issue on the topic “Ecology and Diversity of Marine Decapods”.
Conflicts of Interest
The authors declare no conflict of interest.
References
- Walker, S. Criteria for recognizing marine hermit crabs in the fossil record using gastropod shells. J. Paleontol. 1992, 66, 535–558. [Google Scholar] [CrossRef]
- Tsang, L.M.; Chan, T.Y.; Ahyong, S.T.; Chu, K.H. Hermit to king, or hermit to all: Multiple transitions to crab-like forms from hermit crab ancestors. Syst. Biol. 2011, 60, 616–629. [Google Scholar] [CrossRef] [PubMed]
- Cunningham, C.W.; Blackstone, N.W.; Buss, L.W. Evolution of king crab from hermit crab ancestors. Nature 1992, 355, 539–542. [Google Scholar] [CrossRef] [PubMed]
- Wolfe, J.M.; Luque, J.; Bracken-Grissom, H.D. How to become a crab: Phenotypic constraints on a recurring body plan. BioEssays 2021, 43, 2100020. [Google Scholar] [CrossRef]
- McLaughlin, P.A. A review of the phylogenetic position of the Lomidae (Crustacea, Decapoda, Anomala). J. Crust. Biol. 1983, 3, 431–437. [Google Scholar] [CrossRef]
- McLaughlin, P.A.; Lemaitre, R. Carcinization in the Anomura—Fact or fiction? I. Evidence from adult morphology. Contrib. Zool. 1997, 67, 79–123. [Google Scholar] [CrossRef] [Green Version]
- Tudge, C.C. Spermatophore morphology in the hermit crab families Paguridae and Parapaguridae (Paguroidea, Anomura, Decapoda). Invertebr. Reprod. Dev. 1999, 35, 203–214. [Google Scholar] [CrossRef]
- McLaughlin, P.A.; Lemaitre, R.; Tudge, C.C. Carcinization in the Anomura—Fact or fiction? Part II. Evidence from larval, megalopal and early juvenile morphology. Contrib. Zool. 2004, 73, 165–205. [Google Scholar] [CrossRef] [Green Version]
- McLaughlin, P.A.; Lemaitre, R.; Sorhannus, U. Hermit crab phylogeny: A reappraisal and its “fall-out”. J. Crust. Biol. 2007, 27, 97–115. [Google Scholar] [CrossRef] [Green Version]
- Tsang, L.M.; Ma, K.Y.; Ahyong, S.T.; Chan, T.Y.; Chu, K.H. Phylogeny of Decapoda using two nuclear protein-coding genes: Origin and evolution of the Reptantia. Mol. Phylogenet. Evol. 2008, 48, 359–368. [Google Scholar] [CrossRef]
- Lemaitre, R.; McLaughlin, P.A. Recent advances and conflicts in concepts of anomuran phylogeny (Crustacea: Malacostraca). Arthropod Syst. Phylogeny 2009, 67, 119–135. [Google Scholar]
- Lemaitre, R.; McLaughlin, P.A.; Sorhannus, U. Phylogenetic relationships within the Pylochelidae (Decapoda: Anomura: Paguroidea): A cladistics analysis based on morphological characters. Zootaxa 2009, 2022, 1–14. [Google Scholar] [CrossRef]
- Scelzo, M.A.; Fantucci, M.Z.; Mantelatto, F.L. Spermatophore and gonopore morphology of the Southwestern-Atlantic hermit crab Pagurus exilis (Benedict, 1892) (Anomura, Paguridae). Zool. Stud. 2010, 49, 421–433. [Google Scholar]
- Tirelli, T.; Gamba, M.; Pessani, D.; Tudge, C. Spermatophore and spermatozoal ultrastructure of the Mediterranean hermit crab Pagurus excavatus (Paguridae: Anomura: Decapoda). JMBA 2013, 93, 1363–1371. [Google Scholar] [CrossRef]
- Bracken-Grissom, H.D.; Cannon, M.E.; Cabezas, P.; Feldmann, R.M.; Schweitzer, C.E.; Ahyong, S.T.; Felder, D.L.; Lemaitre, R.; Crandall, K.A. A comprehensive and integrative reconstruction of evolutionary history for Anomura (Crustacea: Decapoda). BMC Evol. Biol. 2013, 13, 128. [Google Scholar] [CrossRef] [PubMed] [Green Version]
- Tan, M.H.; Gan, H.M.; Lee, Y.P.; Linton, S.; Grandjean, F.; Bartholomei-Santos, M.L.; Miller, A.D.; Austin, C.M. ORDER within the chaos: Insights into phylogenetic relationships within the Anomura (Crustacea: Decapoda) from mitochondrial sequences and gene order rearrangements. Mol. Phylogenet. Evol. 2018, 127, 320–331. [Google Scholar] [CrossRef]
- Fabricius, J.C. Systema entomologiae, sistens insectorum classes, ordines, genera, species, adiectis synonymis, locis, descriptionibus, observationibus. Flensbg. Lipsiae Kortii 1775, 832, 1745–1808. [Google Scholar]
- Susana, M.P.; Fran, R. Hermit crabs (Decapoda: Crustacea) from deep Mauritanian waters (NW Africa) with the description of a new species. Zootaxa 2015, 3926, 151–190. [Google Scholar]
- De Grave, S.; Pentcheff, N.D.; Ahyong, S.T.; Chan, T.-Y.; Crandall, K.A.; Dworschak, P.C.; Felder, D.L.; Feldmann, R.M.; Fransen, C.H.J.M.; Goulding, L.Y.D.; et al. A classification of living and fossil genera of decapods crustaceans. Raffles Bull. Zool. 2009, 21, 1–109. [Google Scholar]
- Oba, T.; Goshima, S. Temporal and spatial settlement patterns of sympatric hermit crabs and the influence of shell resource availability. Mar. Biol. 2004, 144, 871–879. [Google Scholar] [CrossRef]
- Gherardi, F.; Nardone, F. The question of coexistence in hermit crabs: Population ecology of a tropical intertidal assemblage. Crustaceana 1997, 70, 608–629. [Google Scholar]
- Biagi, R.; Meireles, A.L.; Mantelatto, F.L. Bio-ecological aspects of the hermit crab Paguristes calliopsis (Crustacea, Diogenidae) from Anchieta Island, Brazil. An. Acad. Bras. Ciênc. 2006, 78, 451–462. [Google Scholar] [CrossRef] [PubMed] [Green Version]
- Bouvier, E.-L. Décapodes Marcheurs Faune de France, 37; Paul Lechevalier: Paris, France, 1940; 404p. [Google Scholar]
- MacDonald, J.D.; Pike, R.B.; Williamson, D.I. Larvae of the British species of Diogenes, Pagurus, Anapagurus and Lithodes (Crustacea, Decapoda). Proc. Zool. Soc. 1957, 128, 209–257. [Google Scholar] [CrossRef]
- Pike, R.B.; Williamson, D.I. Crustacea, Decapoda: Larvae XI. Paguridea, Coenobitidea, Dromiidea and Homolidea; Zooplankton Identification Sheet; Conseil International pour l’Exploration de la Mer ICES: Copenhagen, Danmai, 1959; Volume 81, pp. 1–9. [Google Scholar]
- McLaughlin, P.A. The hermit crabs (Crustacea, Decapoda, Paguridae) of northwestern North America. Zool. Verh. 1974, 130, 1–396. [Google Scholar]
- McLaughlin, P.A. On the identity of Pagurus brevidactylus (Stimpson) (Decapoda: Paguridae), with the description of a new species of Pagurus from the western Atlantic. Bull. Mar. Sci. 1975, 25, 359–376. [Google Scholar]
- Ingle, R.W. Northeastern Atlantic and Mediterranean hermit crabs (Crustacea: Anomura: Paguroidea: Paguridae). I. The genus Pagurus Fabricius, 1775. J. Nat. Hist. 1985, 19, 745–769. [Google Scholar] [CrossRef]
- McLaughlin, P.A.; Gore, R.H.; Crain, J.A. Studies on the Provenzanoi and other pagurid groups: II. A reexamination of the larval stages of Pagurus hirsutiusculus (Dana) (Decapoda: Anomura: Paguridae) reared in the laboratory. J. Crust. Biol. 1988, 8, 430–450. [Google Scholar] [CrossRef]
- Lemaitre, R.; Castaño, N.C. A new species of Pagurus Fabricius, 1775 from the Pacific coast of Colombia, with a checklist of the eastern Pacific species of the genus. Nauplius 2004, 12, 71–82. [Google Scholar]
- Scotland, R.W.; Olmstead, R.G.; Bennett, J.R. Phylogeny reconstruction: The role of morphology. Syst. Biol. 2003, 52, 539–548. [Google Scholar] [CrossRef]
- Machordom, A.; Macpherson, E. Rapid radiation and cryptic speciation in squat lobsters of the genus Munida (Crustacea, Decapoda) and related genera in the south west Pacific: Molecular and morphological evidence. Mol. Phylogenet. Evol. 2004, 33, 259–279. [Google Scholar] [CrossRef] [PubMed]
- Negri, M.; Pileggi, L.G.; Mantelatto, F.L. Molecular barcode and morphological analyses reveal the taxonomic and biogeographical status of the striped-legged hermit crab species Clibanarius sclopetarius (Herbst, 1796) and Clibanarius vittatus (Bosc, 1802) (Decapoda: Diogenidae). Invert. Syst. 2012, 26, 561–571. [Google Scholar] [CrossRef]
- Hultgren, K.M.; Stachowicz, J.J. Alternative camouflage strategies mediate predation risk among closely related co-occurring kelp crabs. Oecologia 2008, 155, 519–528. [Google Scholar] [CrossRef] [PubMed]
- Bickford, D.; Lohman, D.J.; Sodhi, N.S.; Ng, P.K.L.; Meier, R.; Winker, K.; Ingram, K.K.; Das, I. Cryptic species as a window on diversity and conservation. Trends Ecol. Evol. 2007, 22, 148–155. [Google Scholar] [CrossRef] [PubMed]
- Piffaretti, J.; Vanlerberghe-Masutti, F.; Tayeh, A.; Clamens, A.L.; D’Acier, A.C.; Jousselin, E. Molecular phylogeny reveals the existence of two sibling species in the aphid pest Brachycaudus helichrysi (Hemiptera: Aphididae). Zool. Scr. 2012, 41, 266–280. [Google Scholar] [CrossRef]
- Mantelatto, F.L.; Pardo, L.M.; Pileggi, L.G.; Felder, D.L. Taxonomic re-examination of the hermit crab species Pagurus forceps and Pagurus comptus (Decapoda: Paguridae) by molecular analysis. Zootaxa 2009, 2133, 20–32. [Google Scholar] [CrossRef] [Green Version]
- da Silva, M.J.; dos Santos, A.; Cunha, M.R.; Costa, F.O.; Creer, S.; Carvalho, G.R. Multigene molecular systematics confirm species status of morphologically convergent Pagurus hermit crabs. PLoS ONE 2011, 6, e28233. [Google Scholar]
- Olguín, N.; Mantelatto, F.L. Molecular analysis validates of some informal morphological groups of Pagurus (Fabricius, 1775) (Anomura: Paguridae) from South America. Zootaxa 2013, 3666, 436–448. [Google Scholar] [CrossRef]
- Lemaitre, R.; Tavares, M. New taxonomic and distributional information on hermit crabs (Crustacea: Anomura: Paguroidea) from the Gulf of Mexico, Caribbean Sea, and Atlantic coast of South America. Zootaxa 2015, 3994, 451–506. [Google Scholar] [CrossRef] [Green Version]
- Sultana, Z.; Asakura, A.; Kinjo, S.; Nozawa, M.; Nakano, T.; Ikeo, K. Molecular phylogeny of ten intertidal hermit crabs of the genus Pagurus inferred from multiple mitochondrial genes, with special emphasis on the evolutionary relationship of Pagurus lanuginosus and Pagurus maculosus. Genetica 2018, 146, 369–381. [Google Scholar] [CrossRef]
- Hwang, J.-Y.; Haque, N.; Lee, D.-H.; Kim, B.-M.; Rhee, J.-S. Complete mitochondrial genome of the intertidal hermit crab, Pagurus similis (Crustacea, Anomura). Mitochondrial DNA B 2019, 4, 1861–1862. [Google Scholar] [CrossRef]
- Gong, L.; Jiang, H.; Zhu, K.; Lu, X.; Liu, L.; Liu, B.; Jiang, L.; Ye, Y.; Lü, Z. Large-scale mitochondrial genere arrangements in the hermit crab Pagurus nigrofascia and phylogenetic analysis of the Anomura. Gene 2019, 695, 75–83. [Google Scholar] [CrossRef] [PubMed]
- Landschoff, J.; Gouws, G. DNA barcoding as a tool to facilitate the taxonomy of hermit crabs (Decapoda: Anomura: Paguroidea). J. Crust. Biol. 2018, 38, 780–793. [Google Scholar] [CrossRef] [Green Version]
- Takezaki, N.; Gojobori, T. Correct and incorrect vertebrate phylogenies obtained by the entire mitochondrial DNA sequences. Mol. Biol. Evol. 1999, 15, 727–737. [Google Scholar] [CrossRef] [PubMed] [Green Version]
- Thompson, J.D.; Higgins, D.G.; Gibson, T.J. CLUSTAL W: Improving the sensitivity of progressive multiple sequence alignment through sequence weighting, position-specific gap penalties and weight matrix choice. Nucleic Acids Res. 1994, 22, 4673–4680. [Google Scholar] [CrossRef] [Green Version]
- Kumar, S.; Stecher, G.; Tamura, K. MEGA7: Molecular evolutionary genetics analysis version 7.0 for bigger datasets. Mol. Biol. Evol. 2016, 33, 1870–1874. [Google Scholar] [CrossRef] [Green Version]
- Felsenstein, J. Evolutionary trees from DNA sequences: A maximum likelihood approach. J. Mol. Evol. 1981, 17, 368–376. [Google Scholar] [CrossRef]
- Saitou, N.; Nei, M. The neighbor-joining method: A new method for reconstructing phylogenetic trees. Mol. Biol. Evol. 1987, 4, 406–442. [Google Scholar]
- Kimura, M.A. simple method for estimating evolutionary rate of base substitutions through comparative studies of nucleotide sequences. J. Mol. Evol. 1980, 16, 111–120. [Google Scholar] [CrossRef]
- Felsenstein, J. Confidence limits on phylogenies: An approach using the bootstrap. Evolution 1985, 39, 783–791. [Google Scholar] [CrossRef]
- Hedges, S.B.; Kumar, S. The Timetree of Life; Oxford University Press: Oxford, UK, 2009. [Google Scholar]
- Yang, J.-S.; Lu, B.; Chen, D.-F.; Yu, Y.-Q.; Yang, F.; Nagasawa, H.; Tsuchida, S.; Fujiwara, Y.; Yang, W.-J. When did decapods invade hydrothermal vents? Clues from the western Pacific and Indian oceans. Mol. Biol. Evol. 2013, 30, 305–309. [Google Scholar] [CrossRef] [PubMed] [Green Version]
- Yang, Z. PAML 4: A program package for phylogenetic analysis by maximum likelihood. Mol. Biol. Evol. 2007, 24, 1586–1591. [Google Scholar] [CrossRef] [PubMed] [Green Version]
- Inoue, J.G.; Miya, M.; Lam, K.; Tay, B.H.; Danks, J.A.; Bell, J.; Walker, T.I.; Venkatesh, B. Evolutionary origin and phylogeny of the modern holocephalans (Chondrichthyes: Chimaeriformes): A mitogenomic perspective. Mol. Biol. Evol. 2010, 27, 2576–2586. [Google Scholar] [CrossRef] [PubMed] [Green Version]
- Babarinde, I.A.; Saitou, N. The dynamics, causes, and impacts of mammalian evolutionary rates revealed by the analyses of Capybara draft genome sequences. Genome Biol. Evol. 2020, 12, 1444–1458. [Google Scholar] [CrossRef] [PubMed]
- Muñoz, J.E.; Cuesta, J.A.; Raso, J.E. Taxonomic study of the Pagurus forbesii “complex” (Crustacea: Decapoda: Paguridae). Description of Pagurus pseudosculptimanus sp. nov. from Alborán Sea (Southern Spain, Western Mediterranean Sea). Zootaxa 2014, 3753, 25–46. [Google Scholar] [CrossRef] [PubMed] [Green Version]
- Komai, T. The identity of Pagurus brachiomastus and descriptions of two new species of Pagurus (Crustacea: Decapoda: Anomura: Paguridae) from the Northwestern Pacific. Species Divers. 2000, 5, 229–265. [Google Scholar] [CrossRef] [Green Version]
- Komai, T.; Imafuku, M. Redescription of Pagurus lanuginosus with the establishment of a neotype, and description of a new closely related species (Decapoda: Anomura: Paguridae). J. Crust. Biol. 1996, 16, 782–796. [Google Scholar] [CrossRef] [Green Version]
- Komai, T. Identities of Pagurus japonicus (Stimpson, 1858) and P. similis (Ortmann, 1892), with description of a new species of Pagurus. Zoosystema 2003, 25, 377–411. [Google Scholar]
- Noever, C.; Glenner, H. The origin of king crabs: Hermit crab ancestry under the magnifying glass. Zool. J. Linn. Soc. 2017, 182, 300–318. [Google Scholar] [CrossRef]
- Landschoff, J.; Komai, T.; du Plessis, A.; Gouws, G.; Griffiths, C.L. MicroCT imaging applied to description of a new species of Pagurus Fabricius, 1775 (Crustacea: Decapoda: Anomura: Paguridae), with selection of three-dimensional type data. PLoS ONE 2018, 13, e0203107. [Google Scholar]
- Trivedi, J.N.; Vachhrajani, K.D. An annotated checklist of hermit crabs (Crustacea, Decapoda, Anomura) of Indian waters with three new records. J. Asia Pac. Biodivers. 2017, 10, 175–182. [Google Scholar] [CrossRef]
- Ree, R.H.; Smith, S.A. Maximum likelihood inference of geographic range evolution by dispersal, local extinction, and cladogenesis. Syst. Biol. 2008, 57, 4–14. [Google Scholar] [CrossRef] [PubMed] [Green Version]
- Luiz, O.J.; Madin, J.S.; Robertson, D.R.; Rocha, L.; Wirtz, P.; Floeter, S.R. Ecological traits influencing range expansion across large oceanic dispersal barriers: Insights from tropical Atlantic reef fishes. Proc. Biol. Sci. 2012, 279, 1033–1040. [Google Scholar] [CrossRef] [PubMed]
- Hellberg, M.E. Gene flow and isolation among populations of marine animals. Annu. Rev. Ecol. Evol. Syst. 2009, 40, 291–310. [Google Scholar] [CrossRef]
Figure 1.
Map shows geographical locations of collection sites, adopted from the source of sequences in NCBI. Abbreviations are herein referred to as Arctic Ocean (AO), North Sea (NS), North Atlantic (NA), northeast Atlantic (NEA), northwestern Atlantic (NWA), Caribbean Sea (CS), Mediterranean Sea (MS), Gulf of Mexico (GoM), South Atlantic (SA), southwest Atlantic (SWA), North Pacific (NP), East Pacific (EP), northeast Pacific (NEP), northwest Pacific (NWP), southeast Pacific (SEP), Yellow Sea China (YSC), Yellow Sea South Korea (YSSK), East China Sea (ECS), South China Sea (SCS), Sea of Japan (SOJ), and Indian Ocean (IO).

Figure 2.
Maximum-likelihood (ML) tree based on mitochondrial genome (2709 amino acid) of Pagurus species with 1000 bootstrap replicates. Each sample was represented by species name, sequence accession number and the sampling location. The sampling locations included Yellow Sea South Korea (YSSK), northwest Pacific (NWP), Sea of Japan (SOJ), Yellow Sea China (YSC), and North Atlantic (NA). Different colors represent the localities of species analyzed.

Figure 3.
Phylogenetic tree of Pagurus species based on the 16S sequence inferred with the maximum-likelihood (ML) method using T92 + G model. Branch lengths are proportional to inferred nucleotide substitutions. Numbers at nodes represent bootstrap value in percentages; value below 50% are not shown. The species name, accession number, and sampling location are shown for each sequence. Samples were collected from Arctic Ocean (AO), North Sea (NS), North Atlantic (NA), northeast Atlantic (NEA), northwestern Atlantic (NWA), Caribbean Sea (CS), Mediterranean Sea (MS), Gulf of Mexico (GoM), South Atlantic (SA), southwest Atlantic (SWA), North Pacific (NP), East Pacific (EP), northeast Pacific (NEP), northwest Pacific (NWP), southeast Pacific (SEP), Yellow Sea China (YSC), Yellow Sea South Korea (YSSK), East China Sea (ECS), South China Sea (SCS), Sea of Japan (SOJ), and Indian Ocean (IO). Different colors represent the morpho-based species groups.

Figure 4.
Phylogenetic tree of Pagurus species based on the COI sequence inferred with the maximum-likelihood (ML) method using GTR + G + I model. Branch lengths are proportional to inferred nucleotide substitutions. The species name, accession number and sampling location are shown for each sequence. Samples were collected from Arctic Ocean (AO), North Sea (NS), North Atlantic (NA), northeast Atlantic (NEA), northwestern Atlantic (NWA), Caribbean Sea (CS), Mediterranean Sea (MS), Gulf of Mexico (GoM), South Atlantic (SA), southwest Atlantic (SWA), North Pacific (NP), East Pacific (EP), northeast Pacific (NEP), northwest Pacific (NWP), southeast Pacific (SEP), Yellow Sea China (YSC), Yellow Sea South Korea (YSSK), East China Sea (ECS), South China Sea (SCS), Sea of Japan (SOJ), and Indian Ocean (IO). Different colors represent the morpho-based species groups.

Figure 5.
Phylogenetic tree of Pagurus species based on the combined gene (16S & COI) sequence inferred with the maximum-likelihood (ML) method using GTR + G + I model. Branch lengths are proportional to inferred nucleotide substitutions. Numbers at nodes represent bootstrap value in percentages; value below 50% are not shown. One concatenated sequence set from a species was included per location. Sampling locations included Arctic Ocean (AO), North Sea (NS), North Atlantic (NA), northeast Atlantic (NEA), northwestern Atlantic (NWA), Caribbean Sea (CS), Mediterranean Sea (MS), Gulf of Mexico (GoM), South Atlantic (SA), southwest Atlantic (SWA), North Pacific (NP), East Pacific (EP), northeast Pacific (NEP), northwest Pacific (NWP), southeast Pacific (SEP), Yellow Sea China (YSC), Yellow Sea South Korea (YSSK), East China Sea (ECS), South China Sea (SCS), Sea of Japan (SOJ), and Indian Ocean (IO). Different colors represent the morpho-based species groups.

Figure 6.
Individual gene trees based on maximum-likelihood (ML) method with 1000 bootstraps constructed from nuclear markers of Pagurus species: (A) (18S), (B) (28S), and (C) (H3). Numbers at nodes represent bootstrap value in percentages; value below 50% are not shown. The species name and sequence accession number are shown for each sample. Different colors represent the morpho-based species groups.

Figure 7.
Dated phylogenetic tree of Pagurus species obtained from analysis of combined 16 and COI sequences. The evolutionary time-scale in millions of years ago (MYA) is shown below. The calibration points are shown in red circles. Different colors represent the morpho-based species groups.
Figure 7.
Dated phylogenetic tree of Pagurus species obtained from analysis of combined 16 and COI sequences. The evolutionary time-scale in millions of years ago (MYA) is shown below. The calibration points are shown in red circles. Different colors represent the morpho-based species groups.


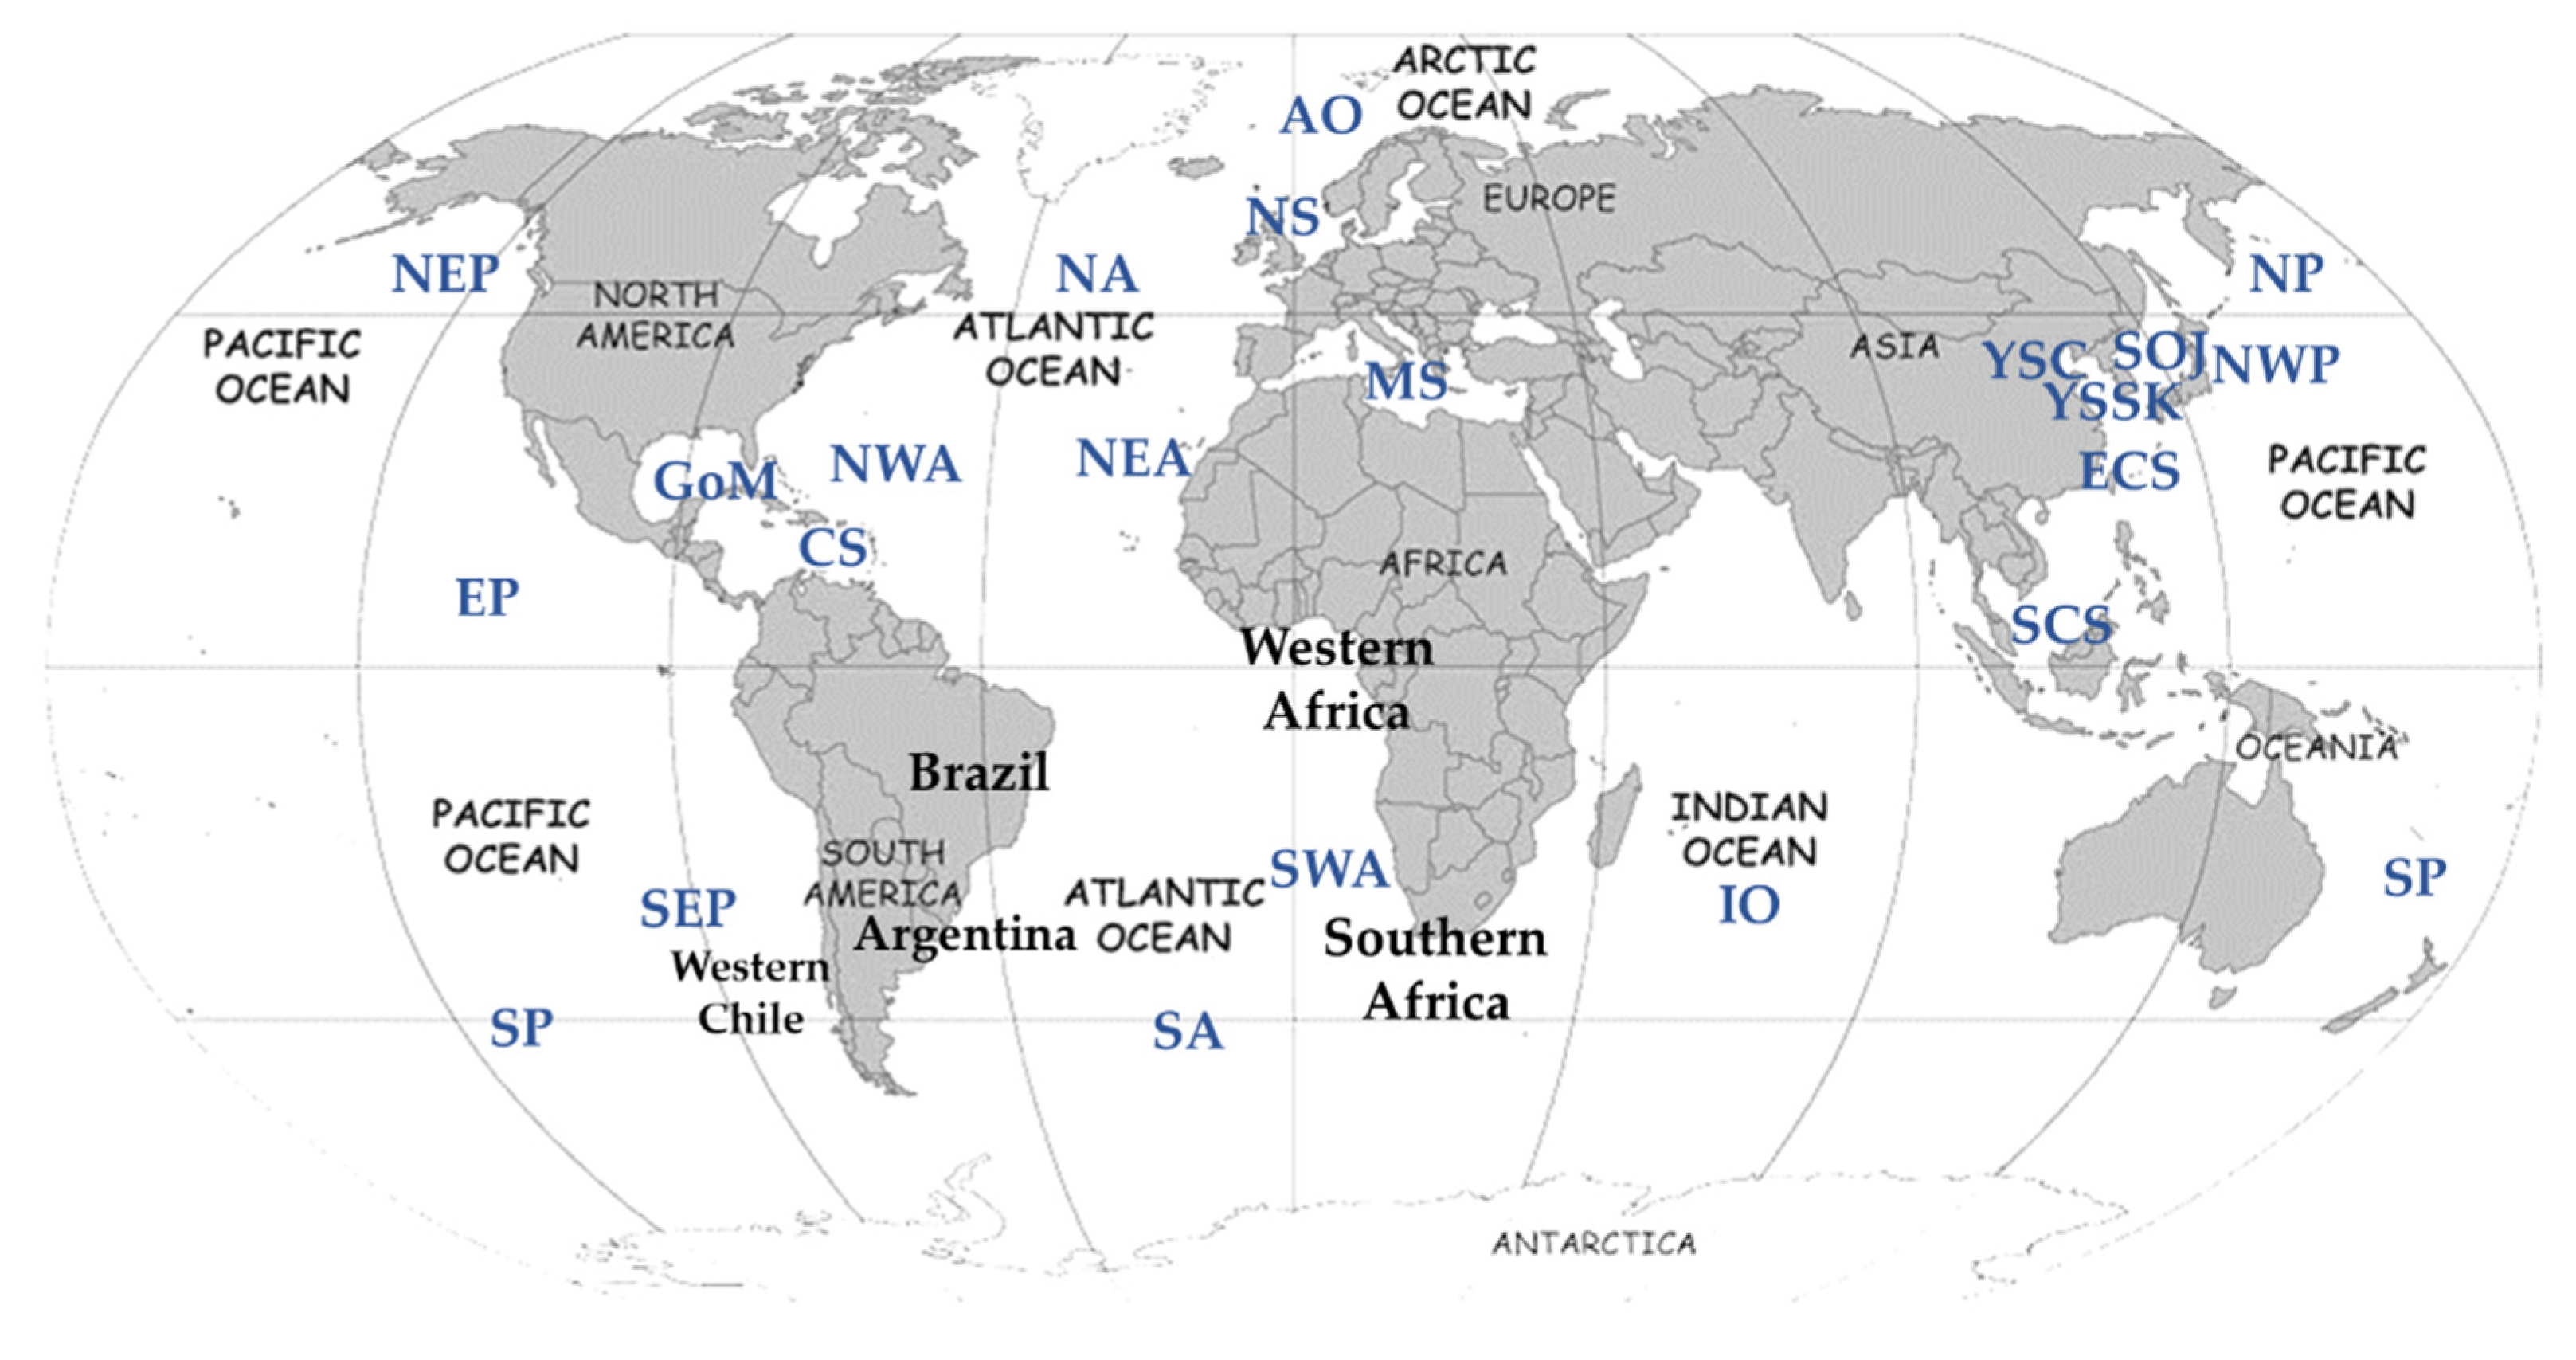
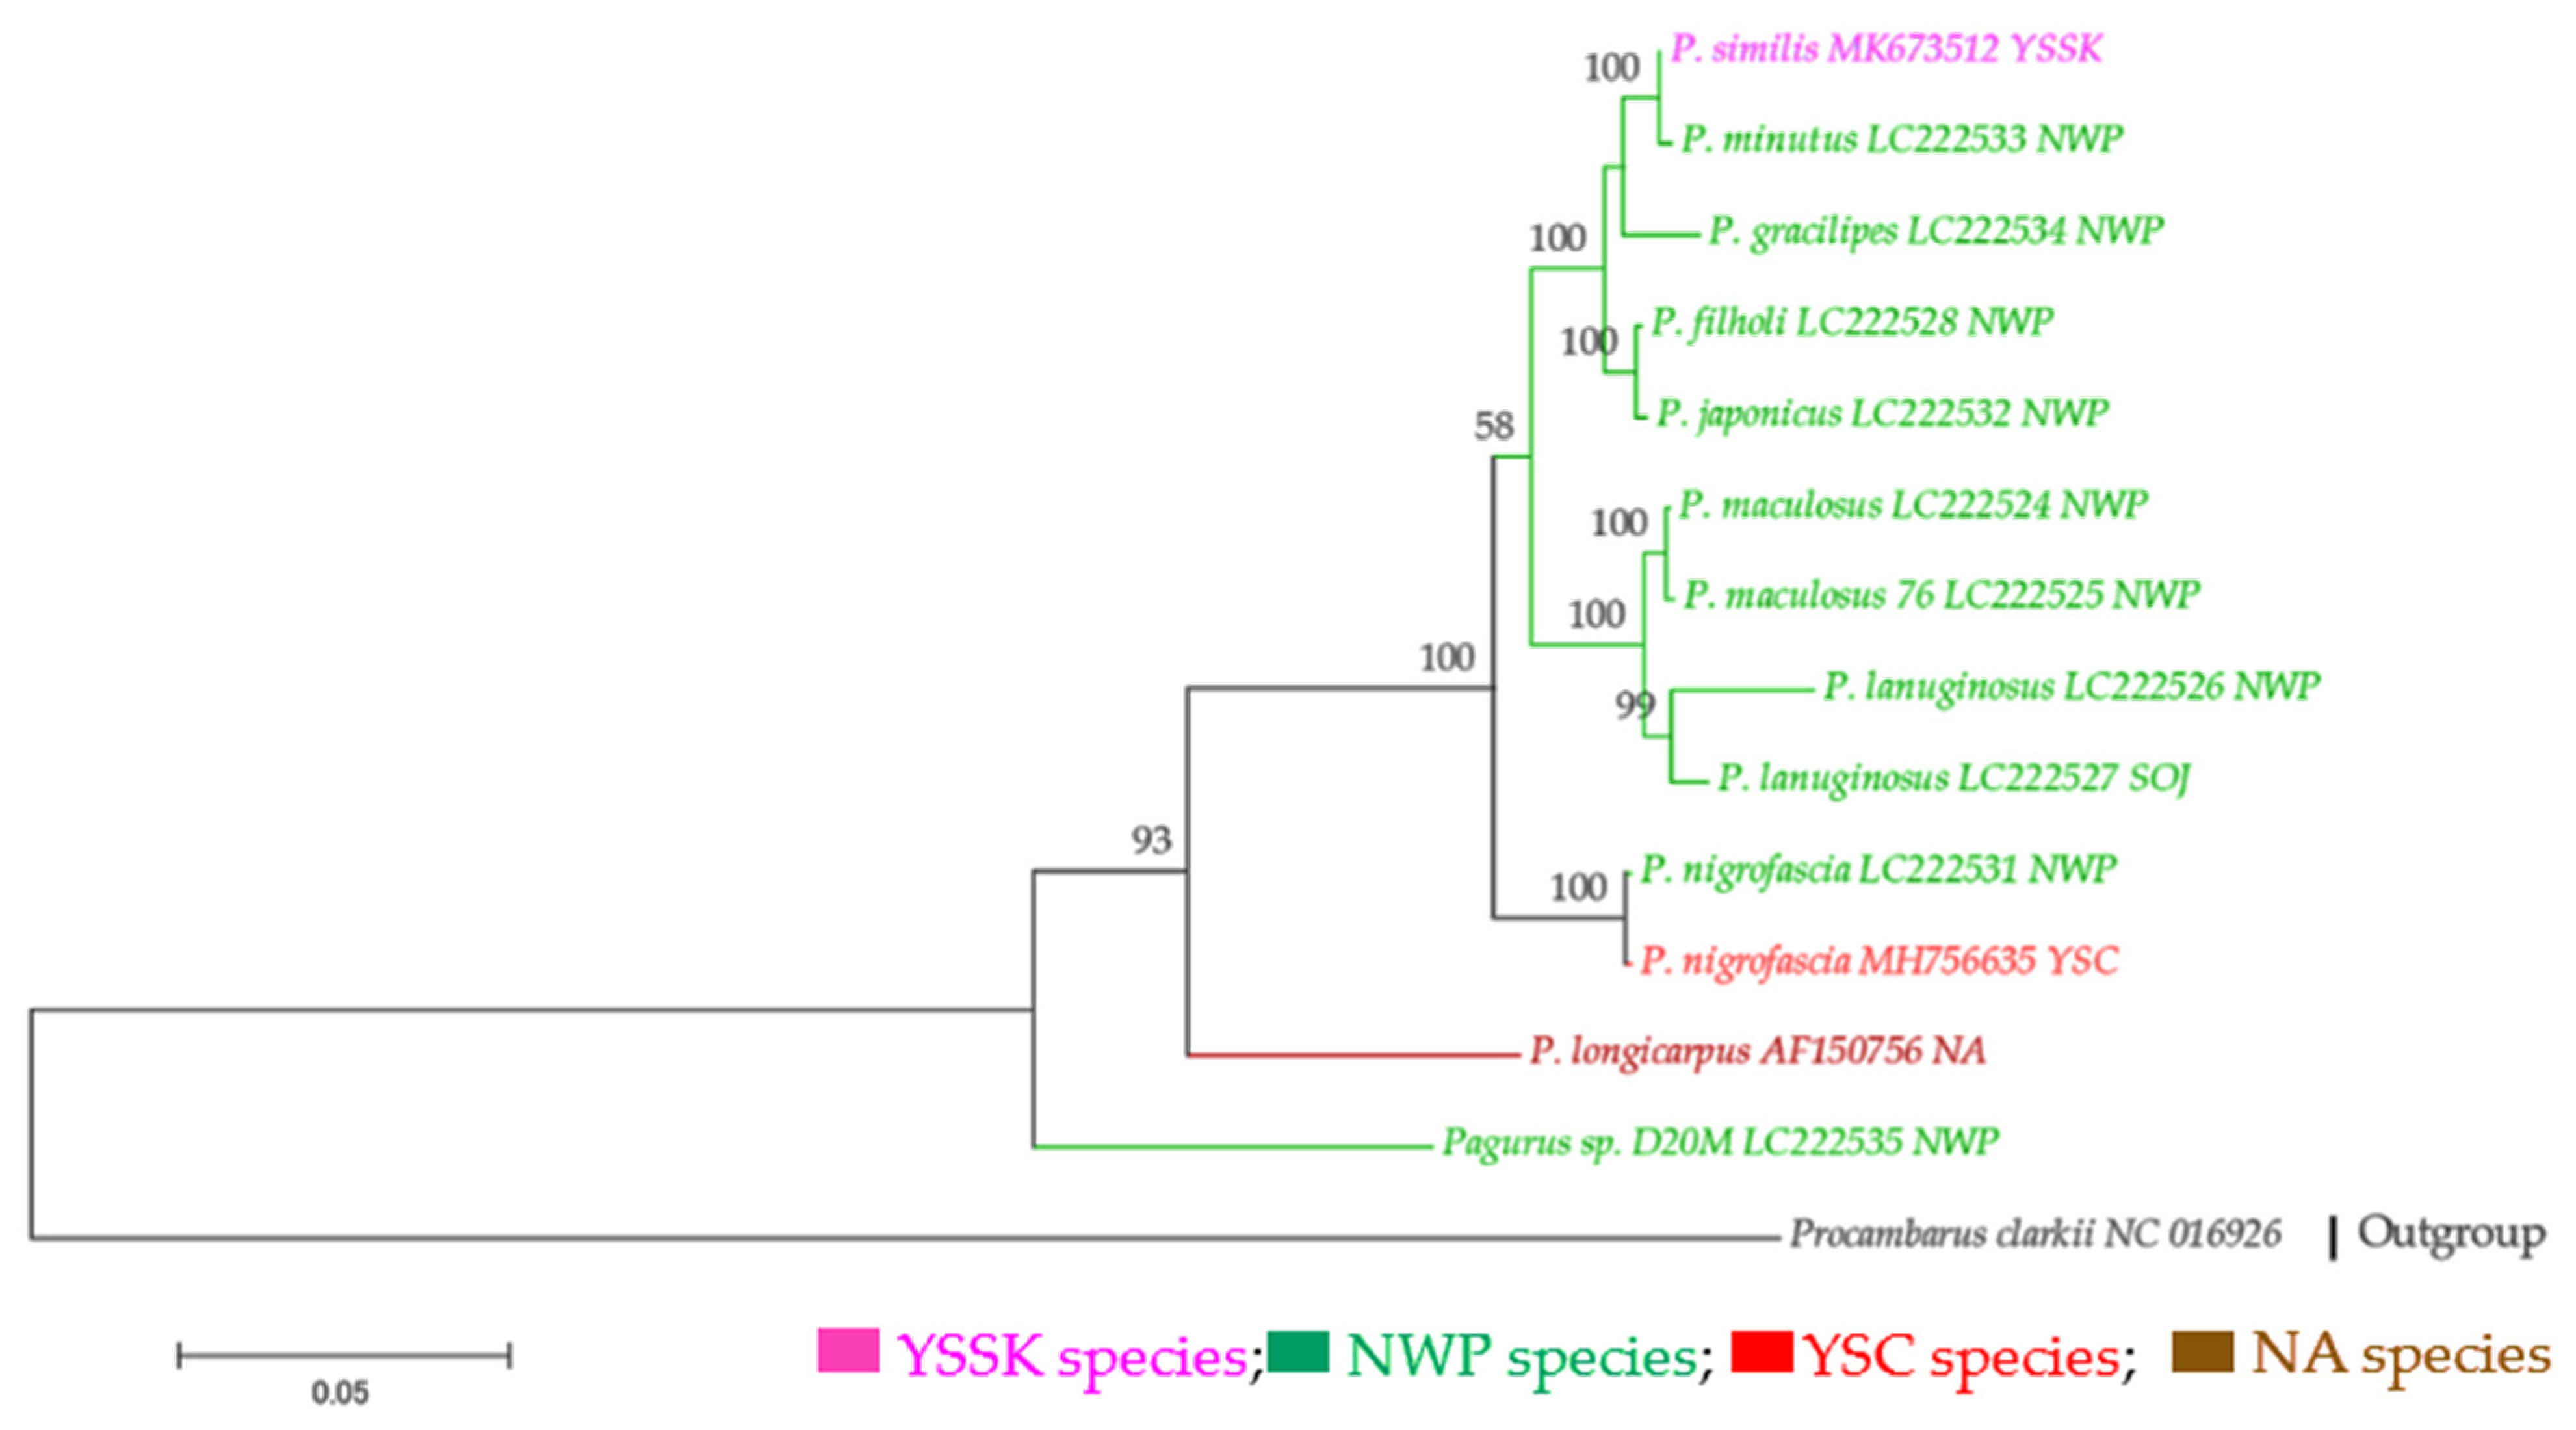
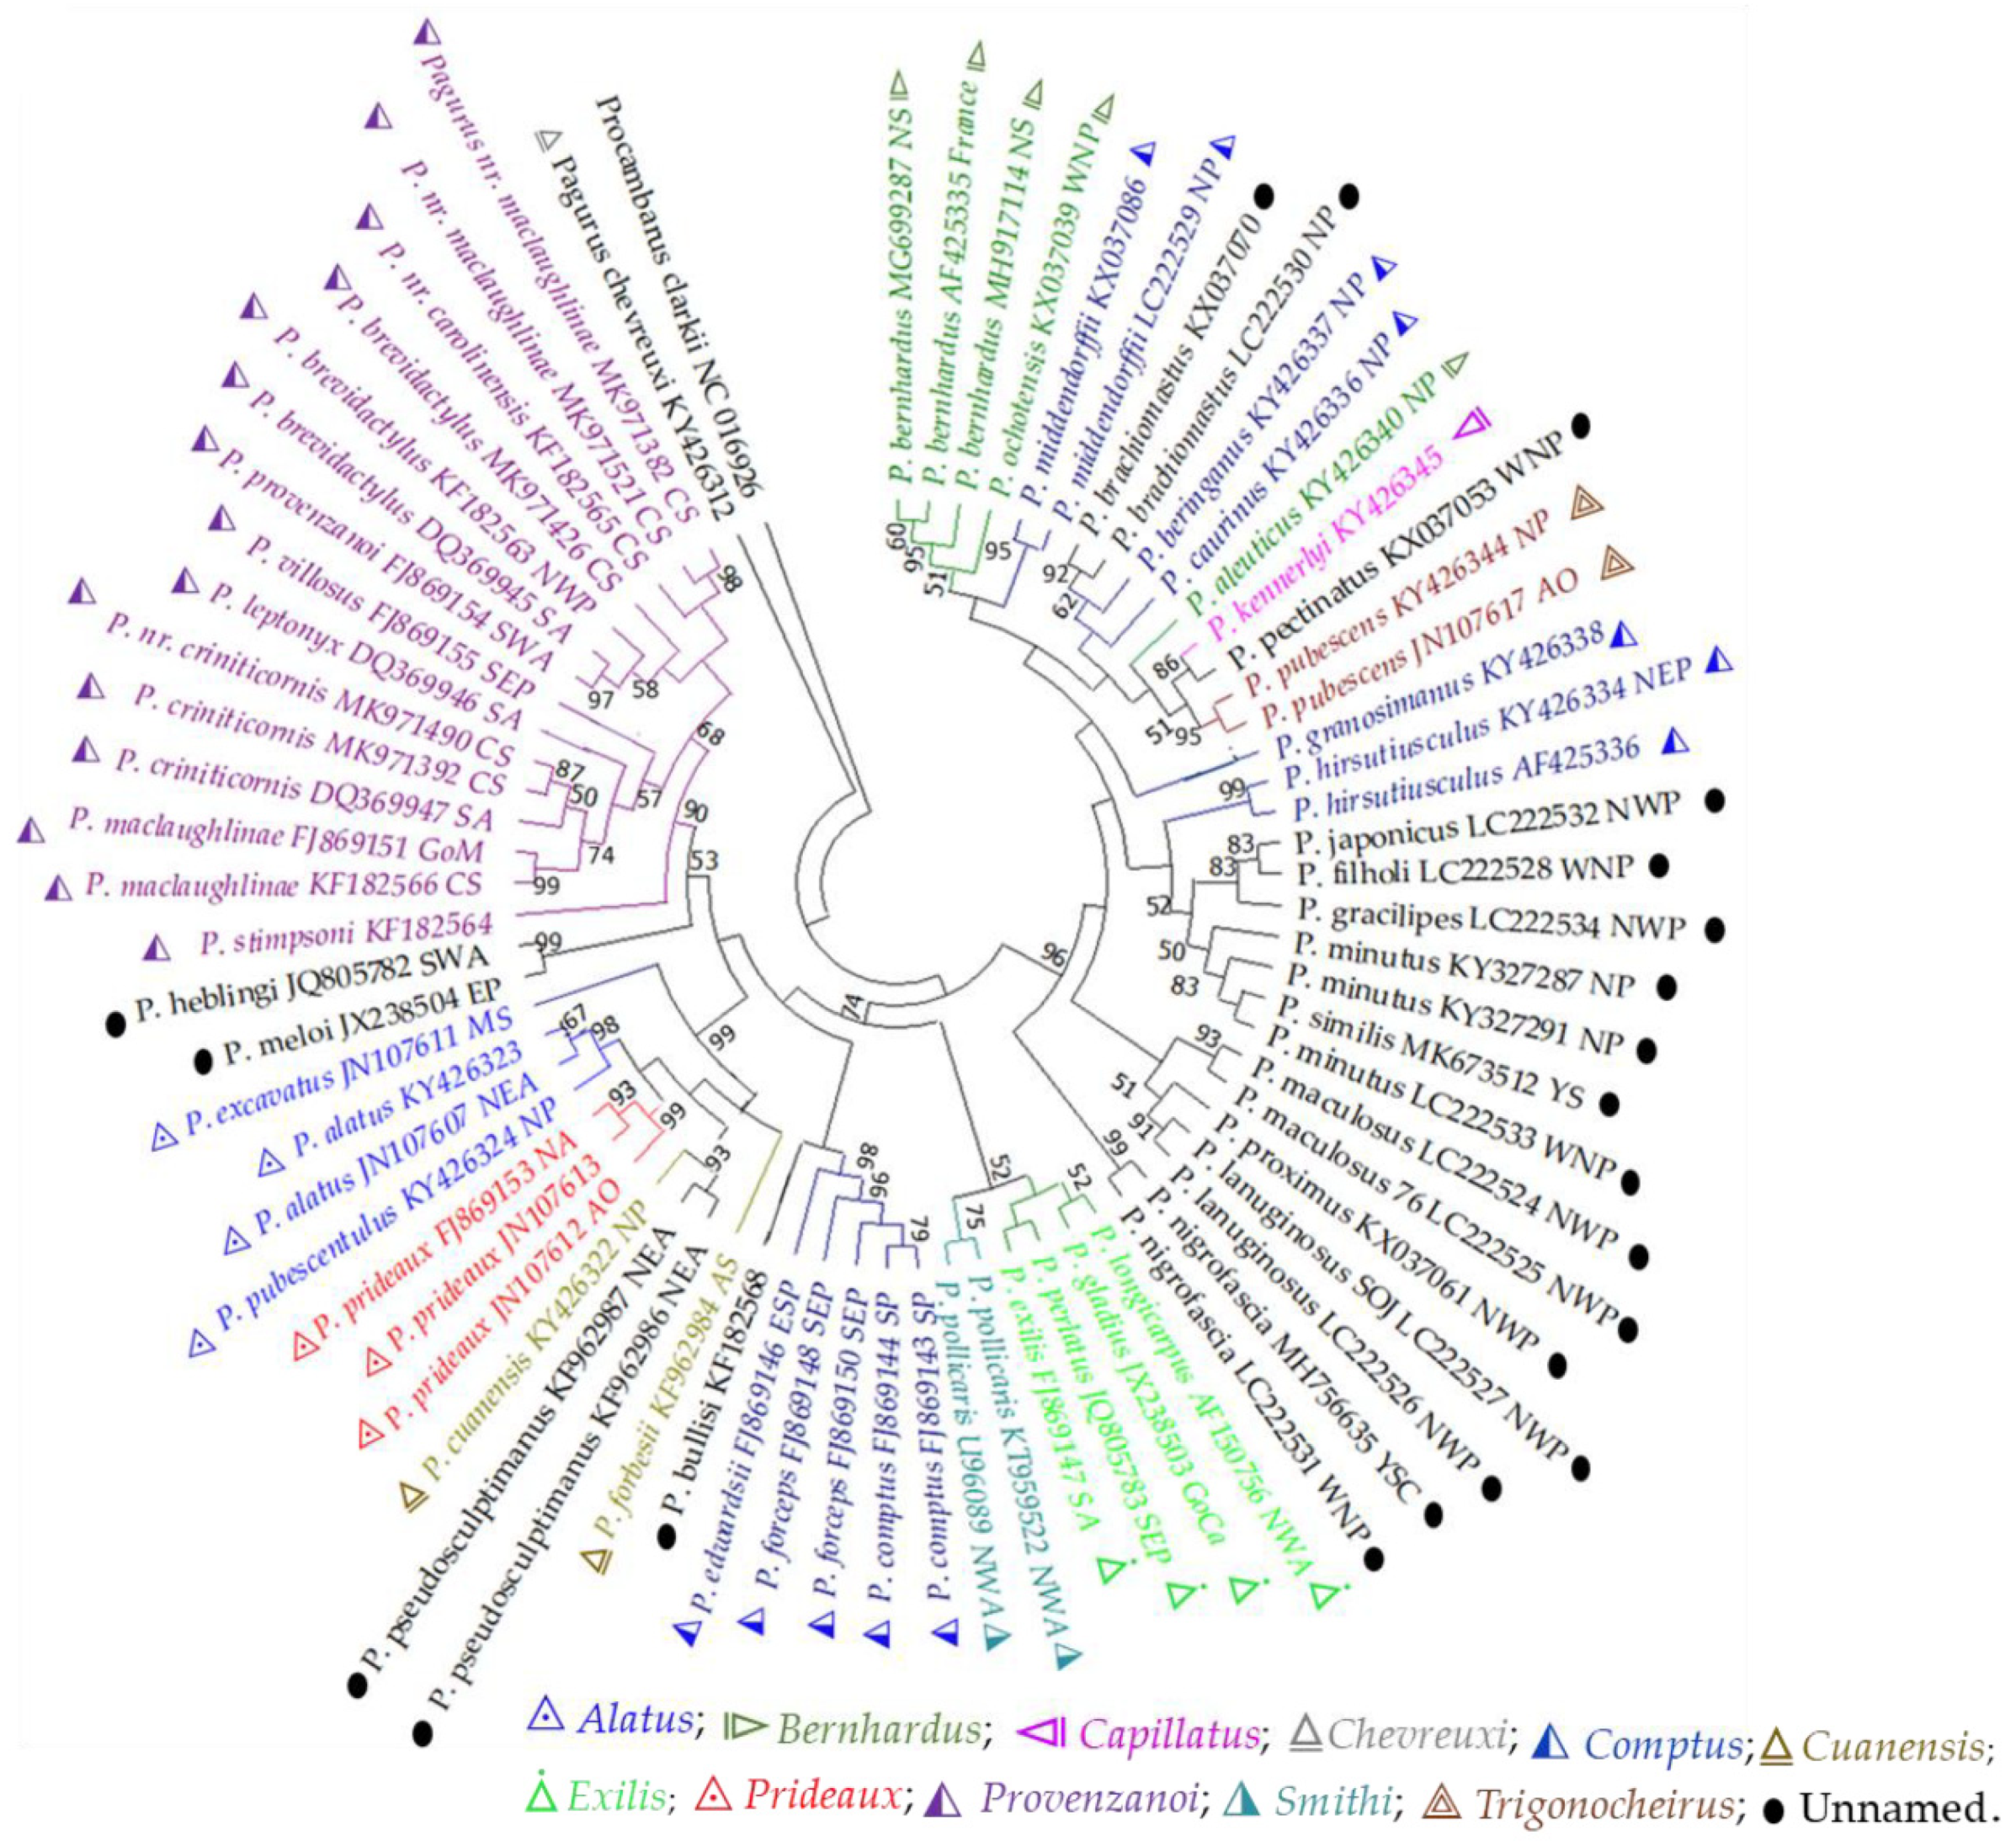
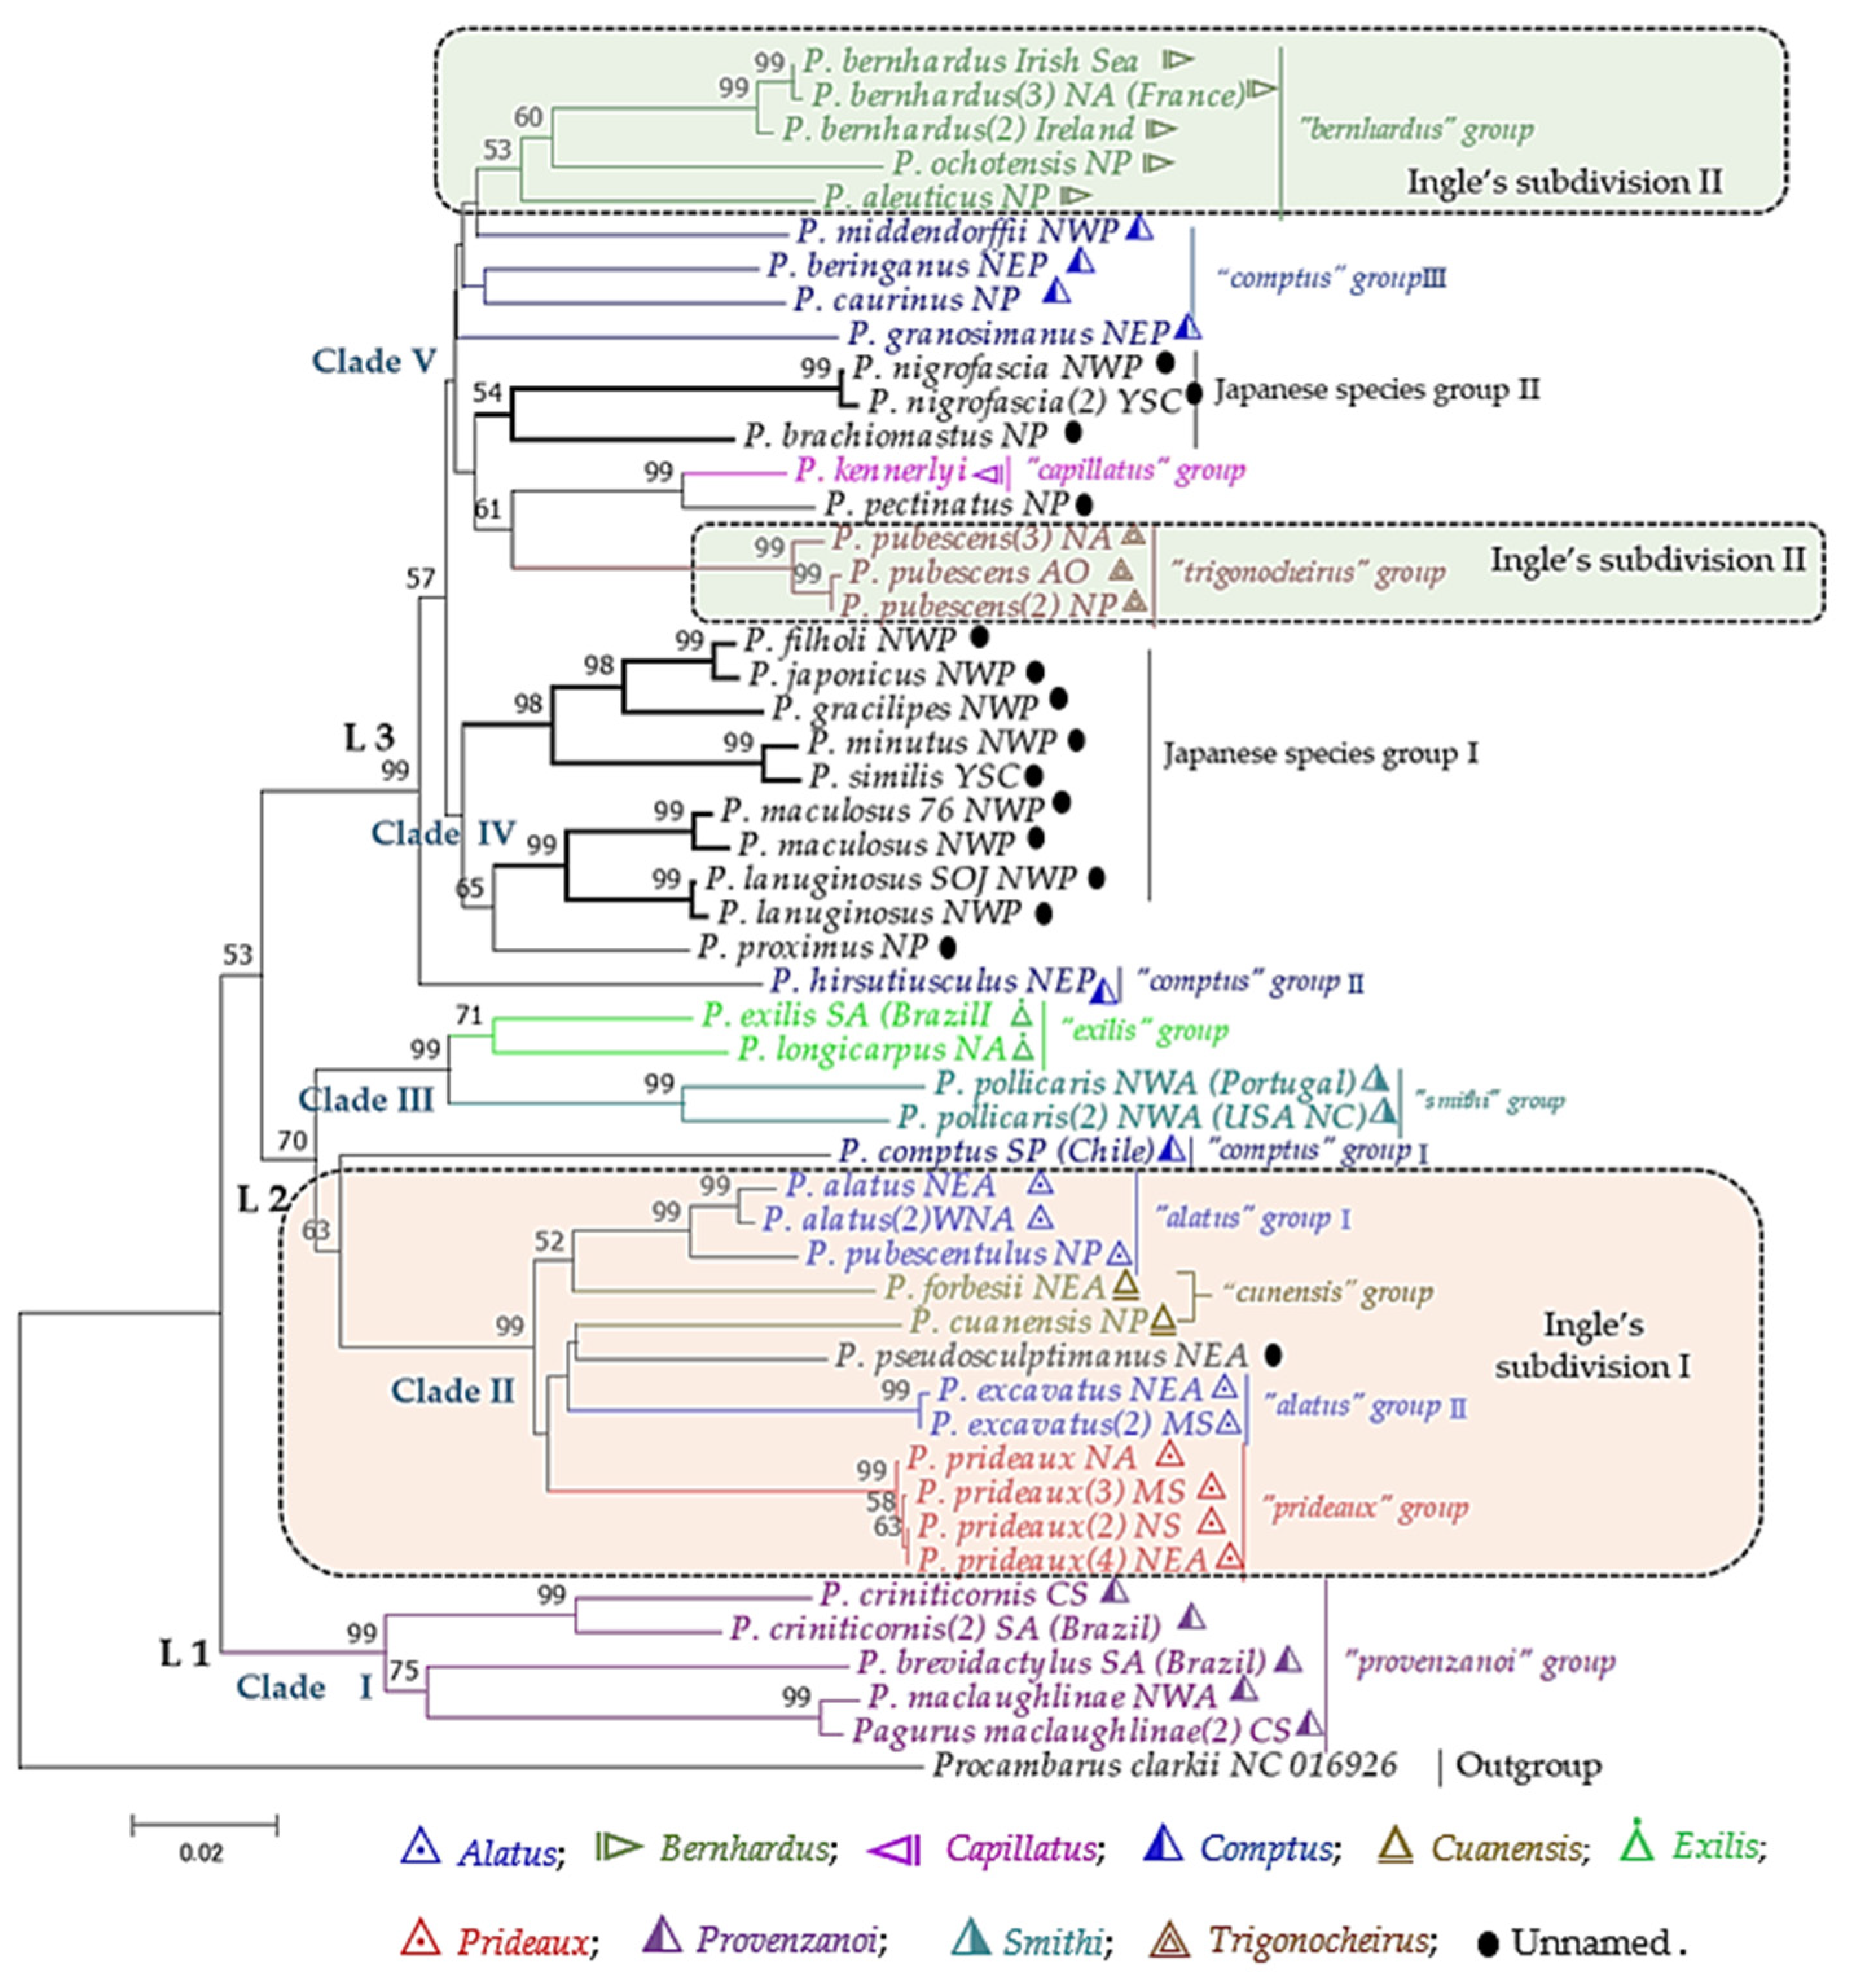
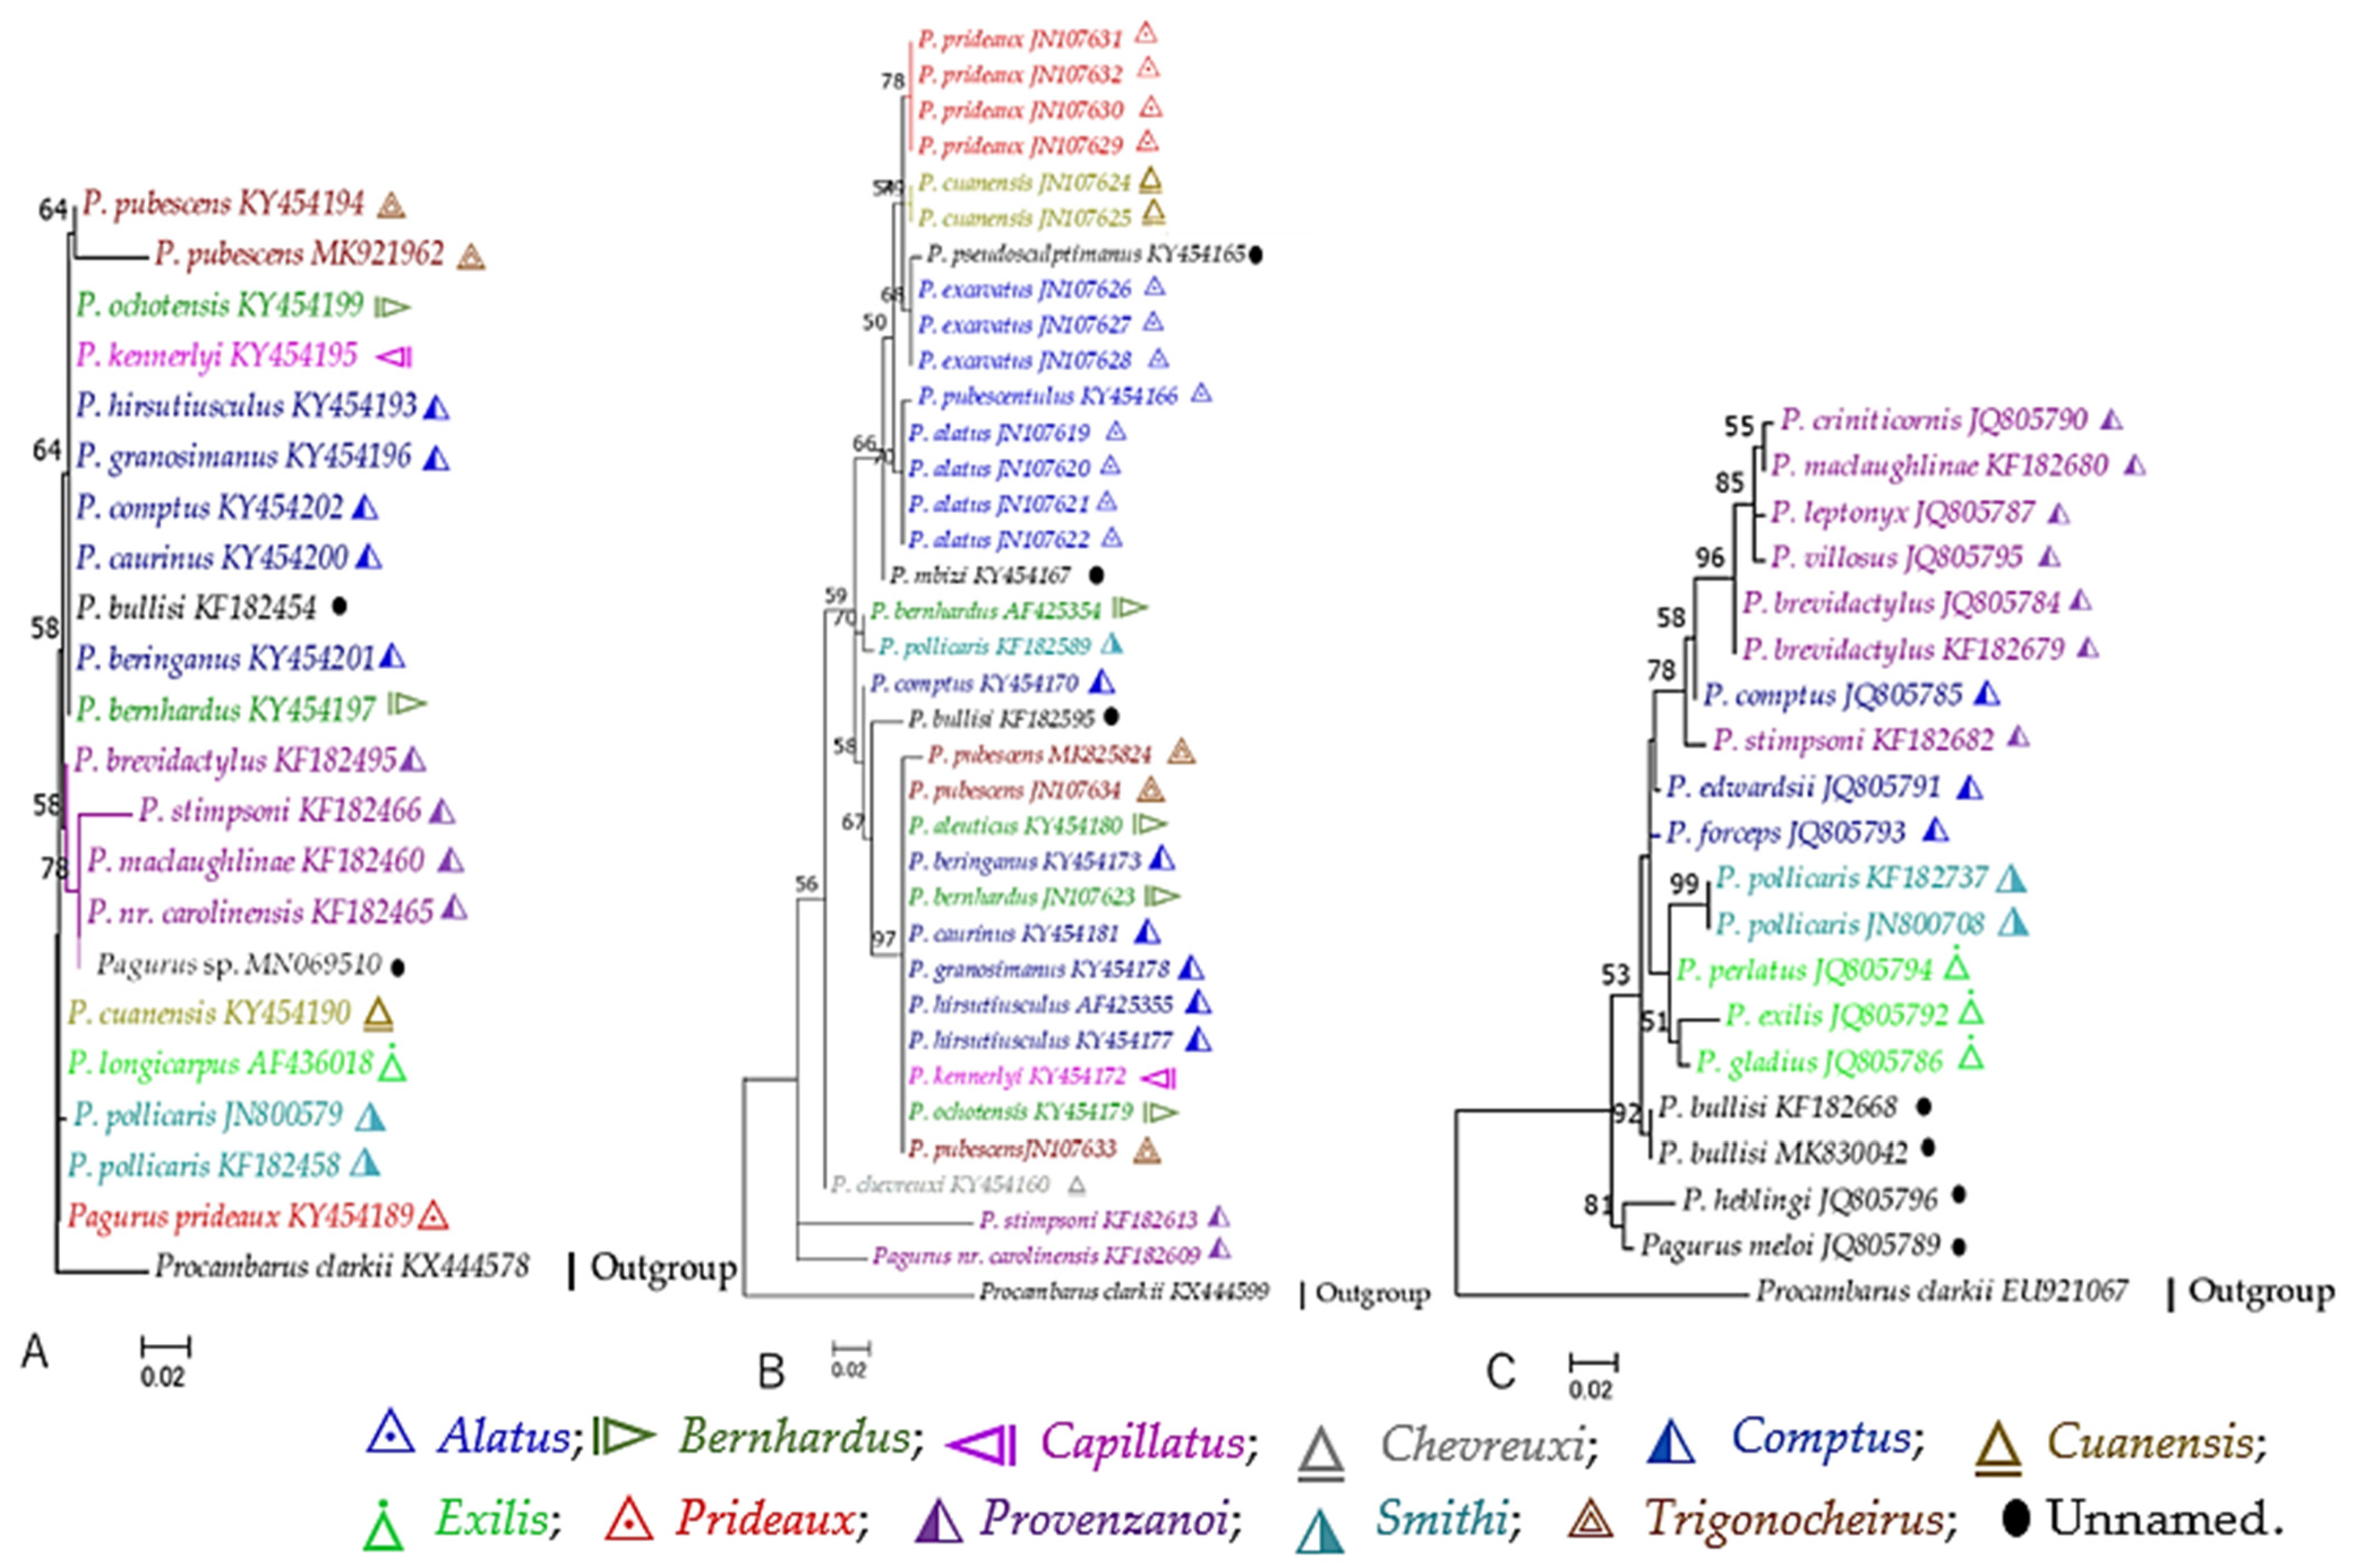
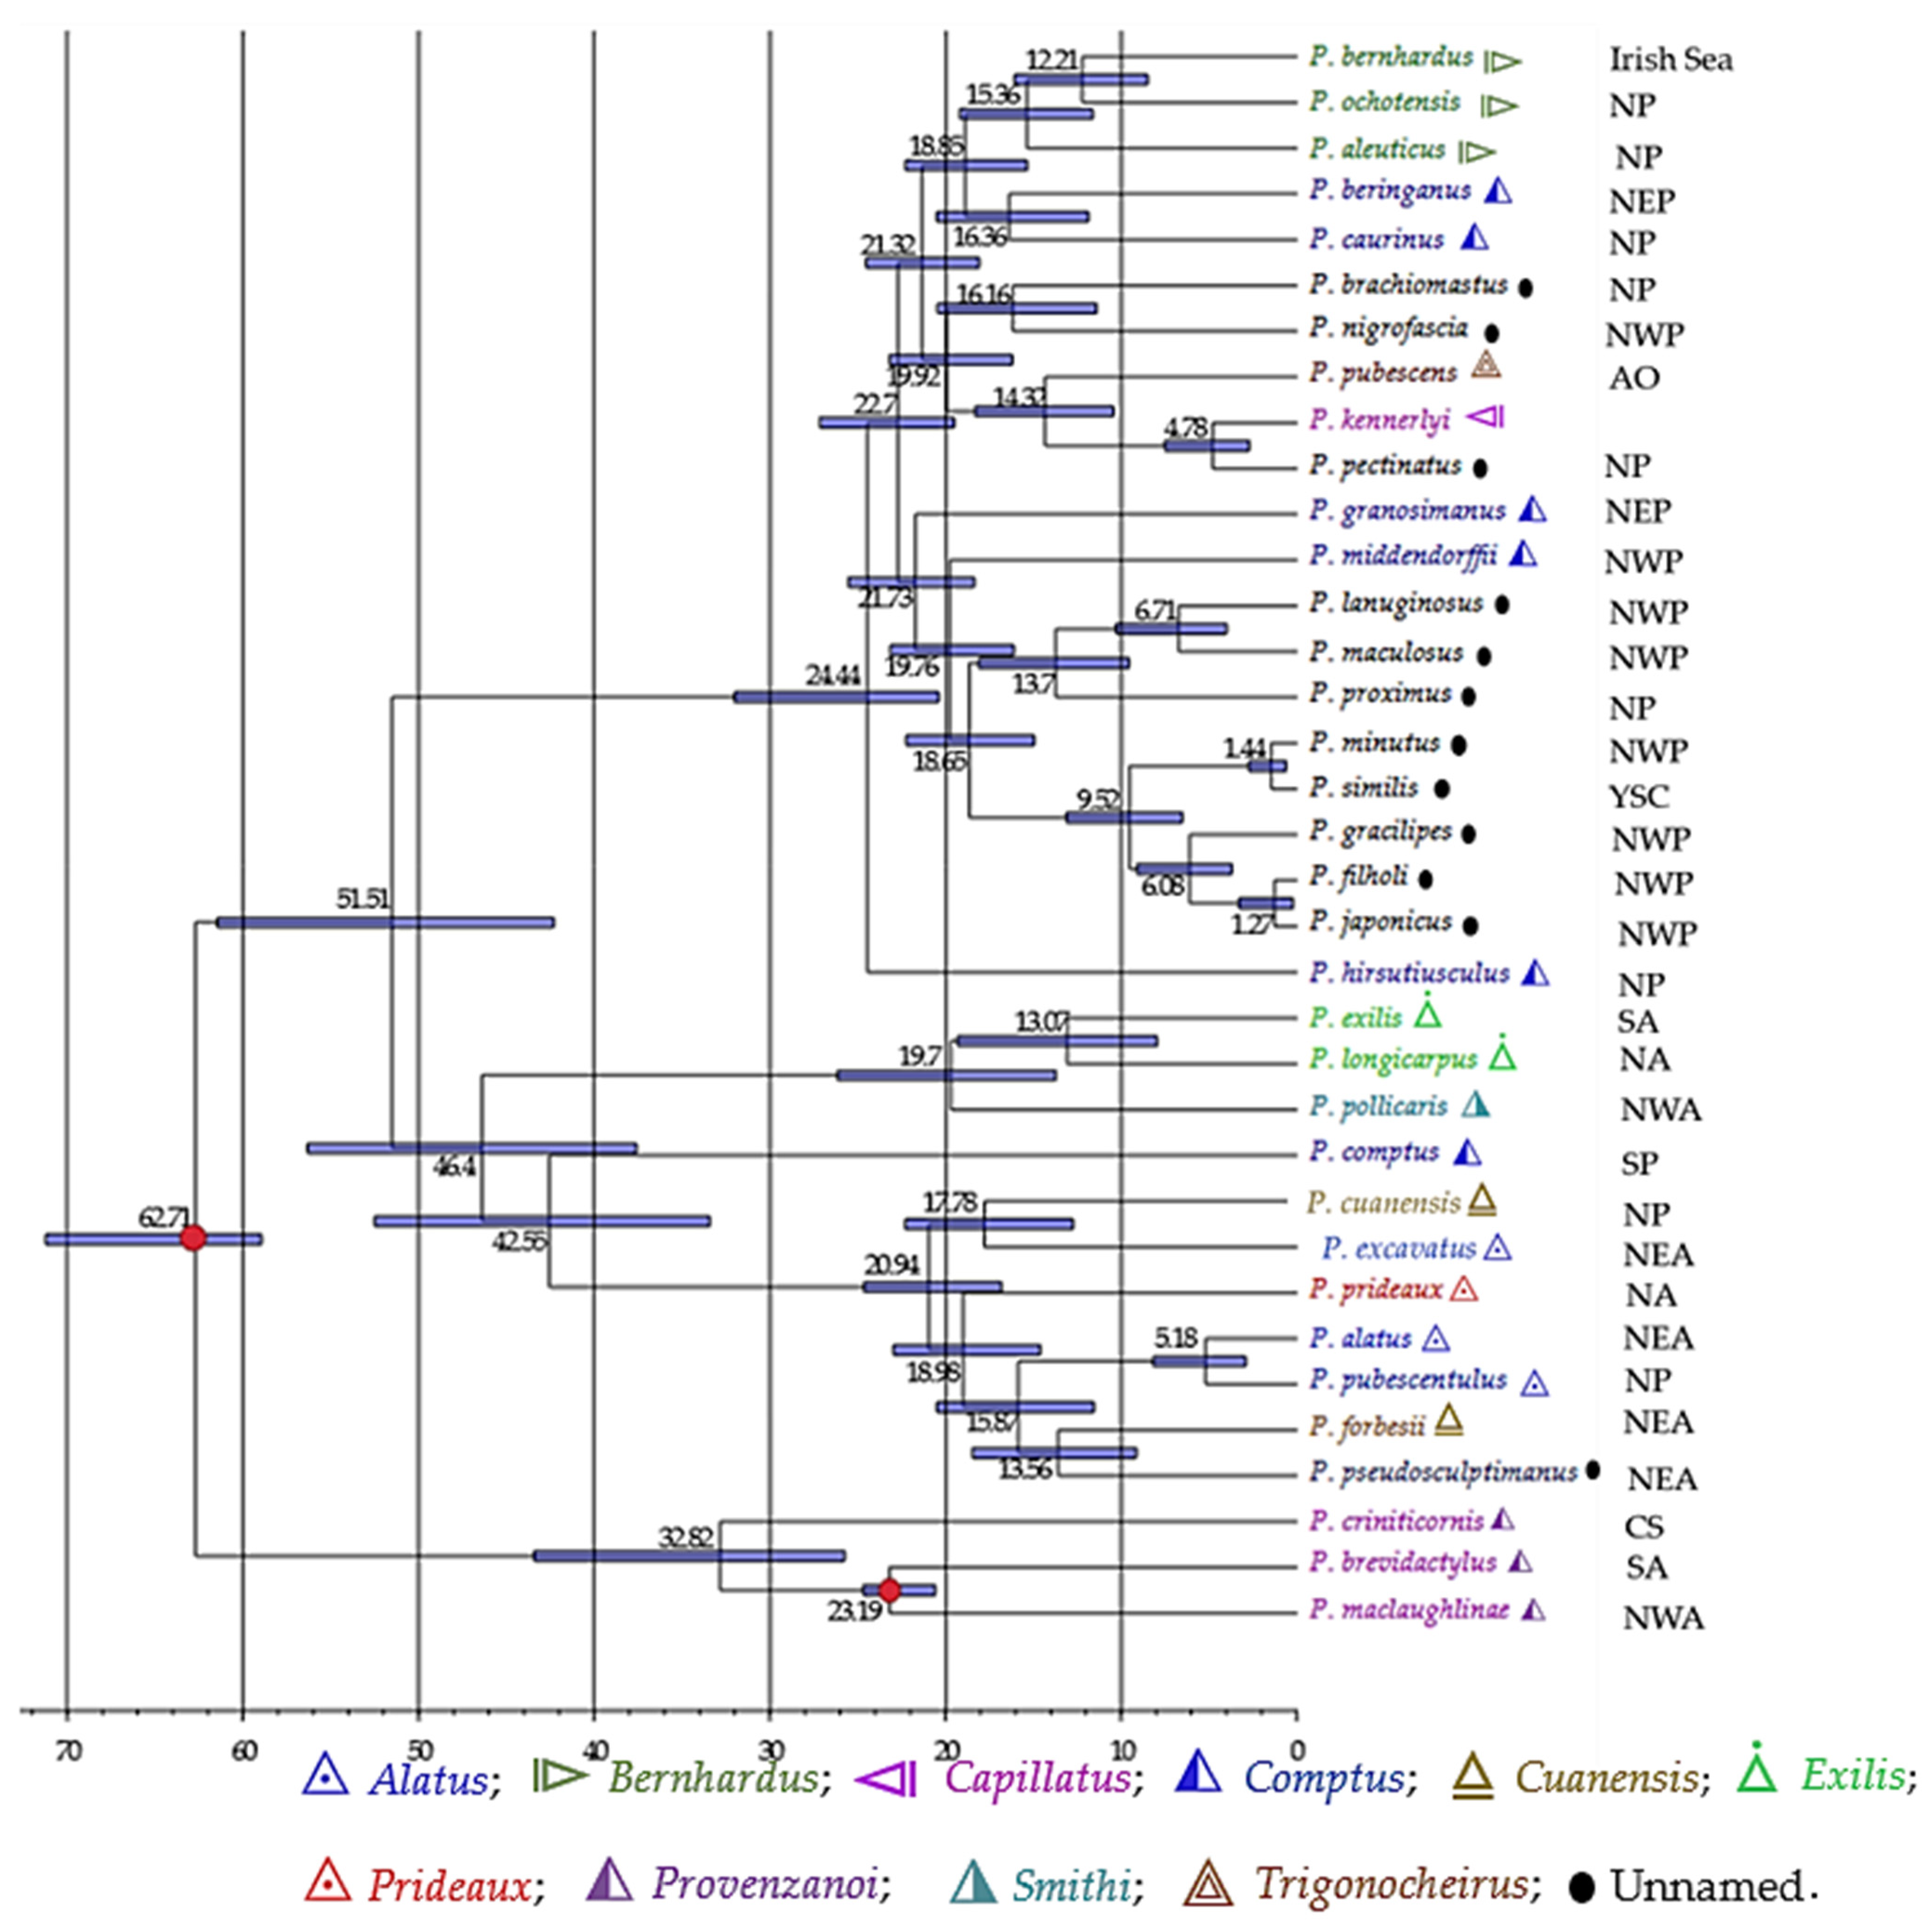
Table 1.
Species groups of the genus Pagurus based on adults’ morphological characters.
| References | Ingle (1985) [28] | McLaughlin et al. (1988) [29] | ||||||||||||||||
|---|---|---|---|---|---|---|---|---|---|---|---|---|---|---|---|---|---|---|
| Species groups of the genus Pagurus | Subdivision I | Subdivision II | ||||||||||||||||
| Group 1 “Alatus” | Group 2 “Prideaux” | Group 3 “Cuanensis” | Group 1 (Group V) “Bernhardus” | Group 2 (Group VIII) “Trigonocheirus” | Group 3 (Group XI) “Anachoretus” | Group 4 “Chevreuxi” | Group 5 “Carneus” | Group I “Provenzanoi” | Group II “Exilis” | Group III “Comptus” | Group IV “Gaudichaudii” | Group VI “Capillatus” | Group VII “Confragosus” | Group X “Smithi” | Group IX “Unnamed” | Group XII “Unnamed” | ||
| Species assigned in the groups | P. alatus | P. prideaux | P. cuanensis | P. aleuticus | P. brandti | P. anachoretoides | P. chevreuxi | P. carneus | P. annexus* | P. albus* | P. beringianus | P. gaudichaudii | P. arcuatus | P. confragosus | P. impressus | P. delsolari | P. alatus | |
| P. excavatus | P. pycnacanthus | P. forbesii | P. armatus | P. dalli | P. anachoretus | P. arenisaxatilis* | P. gladius | P. caurinus | P. capillatus | P. cornutus | P. pollicaris | P. imarpe | P. cuanensis | |||||
| P. pubescentulus | P. bernhardus | P. pubescens | P. gordonae | P. benedicti | P. limatulus | P. comptus | P. kennerlyi | P. tanneri | P. smithi | P. ruber | ||||||||
| P. pulchellus | P. ochotensis | P. stevensae | P. laurentae | P. brevidactylus | P. longicarpus | P. edwardsii | P. setosus | P. spilocarpus | P. sculptimanus | |||||||||
| P. trigonocheirus | P. souriei | P. carolinensis | P. mertensii | P. forceps | P. pubescentulus | |||||||||||||
| P. undosus | P. triangularis | P. criniticornis | P. perlatus* | P. granosimanus | P. prideaux | |||||||||||||
| P. galapagensis | P. hemphilli | P. variailis | ||||||||||||||||
| P. gymnodactylus | P. hirsutiusculus | |||||||||||||||||
| P. lepidus | P. middendorffii | |||||||||||||||||
| P. leptonyx | P. samuelis | |||||||||||||||||
| P. maclaughlinae | P. quaylei | |||||||||||||||||
| P. nanodes* | ||||||||||||||||||
| P. nesiotes* | ||||||||||||||||||
| P. protuberocarpus | ||||||||||||||||||
| P. provenzanoi | ||||||||||||||||||
| P. redondoensis | ||||||||||||||||||
| P. retrorsimanus* | ||||||||||||||||||
| P. rhabdotus* | ||||||||||||||||||
| P. spighti* | ||||||||||||||||||
| P. stimpsoni | ||||||||||||||||||
| P. trichocerus | ||||||||||||||||||
| P. vetaultae* | ||||||||||||||||||
| P. villosus | ||||||||||||||||||
| P. virgulatus* | ||||||||||||||||||
| Compiled species groups of the genus Pagurus | Group 1 “Alatus” | Group 2 “Prideaux” | Group 3 “Cuanensis” | Group 4 “Bernhardus” | Group 5 “Trigonocheirus” | Group 6 “Anachoretus” | Group 7 “Chevreuxi” | Group 8 “Carneus” | Group 9 “Provenzanoi” | Group 10 “Exilis” | Group 11 “Comptus” | Group 12 “Gaudichaudii” | Group 13 “Capillatus” | Group 14 “Confragosus” | Group 15 “Smithi” | Group 16 “Unnamed” (combined of Group IX and XII) | Ungrouped Species | |
| Species assigned in the groups | P. alatus | P. prideaux | P. cuanensis | P. aleuticus | P. brandti | P. anachoretoides | P. chevreuxi | P. carneus | P. annexus* | P. albus* | P. beringianus | P. gaudichaudii | P. arcuatus | P. confragosus | P. impressus | P. delsolari | Pagurus acadianus | |
| P. excavatus | P. pycnacanthus | P. forbesii | P. armatus | P. dalli | P. anachoretus | P. arenisaxatilis* | P. gladius | P. caurinus | P. capillatus | P. cornutus | P. pollicaris | P. hartae* | Pagurus boriaustraliensis | |||||
| P. pubescentulus | P. bernhardus | P. pubescens | P. gordonae | P. benedicti | P. limatulus | P. comptus | P. kennerlyi | P. tanneri | P. smithi | P. imarpe | Pagurus brachiomastus | |||||||
| P. pulchellus | P. ochotensis | P. stevensae | P. laurentae | P. brevidactylus | P. longicarpus | P. edwardsii | P. setosus | P. spilocarpus | P. meloi* | Pagurus bullisi | ||||||||
| P. trigonocheirus | P. souriei | P. carolinensis | P. mertensii | P. forceps | P. rathbuni* | Pagurus constans | ||||||||||||
| P. undosus | P. triangularis | P. criniticornis | P. perlatus* | P. granosimanus | P. retrorsimanus* | Pagurus emmersoni | ||||||||||||
| P. galapagensis | P. hemphilli | P. ruber | Pagurus filholi | |||||||||||||||
| P. gymnodactylus | P. hirsutiusculus | P. sculptimanus | Pagurus fraserorum | |||||||||||||||
| P. lepidus | P. middendorffii | P. townsendi* | Pagurus gracilipes | |||||||||||||||
| P. leptonyx | P. samuelis | P. variailis | Pagurus heblingi | |||||||||||||||
| P. maclaughlinae | P. quaylei | P. venturensis* | Pagurus japonicus | |||||||||||||||
| P. nanodes* | Pagurus kulkarni | |||||||||||||||||
| P. nesiotes* | Pagurus lanuginosus | |||||||||||||||||
| P. protuberocarpus | Pagurus liochele | |||||||||||||||||
| P. provenzanoi | Pagurus maculosus | |||||||||||||||||
| P. redondoensis | Pagurus mbizi | |||||||||||||||||
| P. retrorsimanus* | Pagurus minutus | |||||||||||||||||
| P. rhabdotus* | Pagurus nigrivittatus | |||||||||||||||||
| P. spighti* | Pagurus nigrofascia | |||||||||||||||||
| P. stimpsoni | Pagurus pectinatus | |||||||||||||||||
| P. trichocerus | Pagurus pitagsaleei | |||||||||||||||||
| P. vetaultae* | Pagurus proximus | |||||||||||||||||
| P. villosus* | Pagurus pseudosculptimanus | |||||||||||||||||
| P. virgulatu | Pagurus quinquelineatus | |||||||||||||||||
| Pagurus rectidactylus | ||||||||||||||||||
| Pagurus rubrior | ||||||||||||||||||
| Pagurus similis | ||||||||||||||||||
| Pagurus simulans | ||||||||||||||||||
| Pagurus spina | ||||||||||||||||||
“*” According to Lemaitre and Castaño (2004) [30].
Table 2.
Pairwise genetic distance Kimura’s two-parameter model (K2P) values (per site) among Pagurus species between geographic groups based on combined (16S + COI) genes.
Table 2.
Pairwise genetic distance Kimura’s two-parameter model (K2P) values (per site) among Pagurus species between geographic groups based on combined (16S + COI) genes.
| NEA | NWA | NP | NEP | NA | SA | SP | CS | MS | NWP | NWA | YSC | NS | AO | |
| NEA | ||||||||||||||
| NWA | 0.06 | |||||||||||||
| NP | 0.14 | 0.12 | ||||||||||||
| NEP | 0.16 | 0.15 | 0.11 | |||||||||||
| NA | 0.14 | 0.13 | 0.11 | 0.12 | ||||||||||
| SA | 0.15 | 0.14 | 0.15 | 0.15 | 0.15 | |||||||||
| SP | 0.14 | 0.13 | 0.15 | 0.15 | 0.15 | 0.15 | ||||||||
| CS | 0.17 | 0.16 | 0.16 | 0.17 | 0.16 | 0.12 | 0.16 | |||||||
| MS | 0.08 | 0.09 | 0.15 | 0.17 | 0.14 | 0.16 | 0.14 | 0.17 | ||||||
| NWP | 0.16 | 0.14 | 0.12 | 0.11 | 0.12 | 0.15 | 0.16 | 0.17 | 0.16 | |||||
| NWA | 0.16 | 0.16 | 0.16 | 0.16 | 0.16 | 0.14 | 0.15 | 0.14 | 0.16 | 0.17 | ||||
| YSC | 0.17 | 0.15 | 0.11 | 0.10 | 0.12 | 0.15 | 0.15 | 0.16 | 0.17 | 0.10 | 0.16 | |||
| NS | 0.08 | 0.09 | 0.15 | 0.17 | 0.13 | 0.16 | 0.15 | 0.18 | 0.05 | 0.16 | 0.16 | 0.17 | ||
| AO | 0.17 | 0.15 | 0.10 | 0.10 | 0.10 | 0.15 | 0.17 | 0.17 | 0.18 | 0.11 | 0.17 | 0.10 | 0.17 |
Samples were collected from Arctic Ocean (AO), North Sea (NS), North Atlantic (NA), northeast Atlantic (NEA), northwestern Atlantic (NWA), Caribbean Sea (CS), Mediterranean Sea (MS), Gulf of Mexico (GoM), South Atlantic (SA), southwest Atlantic (SWA), North Pacific (NP), East Pacific (EP), northeast Pacific (NEP), northwest Pacific (NWP), southeast Pacific (SEP), Yellow Sea China (YSC), Yellow Sea South Korea (YSSK), East China Sea (ECS), South China Sea (SCS), Sea of Japan (SOJ), and Indian Ocean (IO). The cells are shown in heatmaps with green representing lower values and red representing higher values.
Table 3.
Variabilities in morphological features among species groups of the genus Pagurus.
| Common features | Morpho-traits | Ingle (1985) Subdivision I | Ingle (1985) Subdivision II | |||||||||||||
|---|---|---|---|---|---|---|---|---|---|---|---|---|---|---|---|---|
| Maxillule (endopod outer distal margin) | rounded or obtusely produced | produced as a conspicuous lobe or papilla, sometimes recurved, rerely segmented | ||||||||||||||
| Pereiopod 3 (anterior lobe of sternite) | triangular to sub-triangular, and setose with acute to subacute spines | broadly subquadrate to suboval, and setos, smooth | ||||||||||||||
| Telson (posterior margin) | armed with teeth that extend on to lateral margin | armed with teeth but that not extend on to lateral margin | ||||||||||||||
| Male’s pleopod (number) | 0-4 unpaired | 3 unpaired | ||||||||||||||
| Species groups | Group 1 “Alatus” | Group 2 “Prideaux” | Group 3 “Cuanensis” | Group 4 “Bernhardus” | Group 5 “Trigonocheirus” | Group 6 “Anachoretus” | Group 7 “Chevreuxi” | Group 8 “Carneus” | Group 9 “Provenzanoi” | Group 10 “Exilis” | Group 11 “Comptus” | Group 12 “Gaudichaudii” | Group 13 “Capillatus” | Group 14 “Confragosus” | Group 15 “Smithi” | |
| Diagnostic features | ocular peduncles | stout, noticeably subcylindrical, | stout, noticeably subcylindrical, | long and cylindrical | short, moderatelystout | subcylindrical | / | / | / | subcylindrical | strong | narrow, subcylindrical | / | cylindrical | moderately short, stout | / |
| ocular acicles | spatulate to subtriangular, dorsal surface concave | spatulate, dorsal surface relatively flat | spatulate to subtriangular, dorsal surface slightly concave | spatulate, dorsal surface concave | subtriangular, dorsal surface flat to slightly concave | subtriangular, dorsal surface flat | subtriangular, dorsal surface flat | narrowly subtriangular, dorsal surface slightly concave | broad, denticulate terminally | triangular, dorsal surface concave | triangular, with subterminal spine inserted ventrally | / | acutely or ovately triangular | ovately triangular | / | |
| Maxilliped 1 (peduncle of exopod) | moderately broadened proximally | slightly broadened proximally | broadened proximally | broadened proximally | moderately broadened proximally | slightly broadened proximally | / | broadened proximally | very narrow | strongly inflated proximally | / | / | slender | moderately inflated | / | |
| Maxilliped 3 | outer distal margin of corpus and merus with a spine, crista dentata with many acute teeth | outer distal margin of corpus and merus with a spine; crista dentata with moderate number of acute teeth | outer distal margin of corpus and merus without spines; crista dentata with many teeth | endopod, inner margin and outer distal margin of merus each with a spine; crista dentata with moderate number of teeth | endopod, inner margin and outer distal margin of merus each with a spine; crista dentata with many teeth | endopod, outer distal margin of merus without or with a spine; crista dentata with moderate number of teeth | endopod, inner and outer distal margin of merus with a spine; crista dentata with numerous small teeth | outer margin of merus with a spine; crista dentata with numerous small teeth | outer margin of merus unarmed; crista dentata with one tooth | outer margin of merus with small spines; crista dentata with few teeth | / | / | outer margin of merus with spines; crista dentata with 1 or 2 teeth | merus and carpus each with spin, crista dentata with 1 tooth | / | |
| Left cheliped (propodal outer surface) | medially elevated and with prominent longitudinal row of acute tubercles | slightly elevated and, with scattered tubercles | medially elevated and, with acute to subacute tubercles | gently convex and tuberculate | medially elevated with spiniform tubercles | convex and relatively smooth | relatively flat | a longitudinal median elevation bearing tubercles | with spiny tubercles and numerus bristles | compressed laterally. | / | / | oblique, not produced into prominent ridge | strongly oblique, concave, elevated into prominent ridge | / | |
| pereiopods 2, 3 (dactyls) | slightly obliquely compressed distally | obliquely compressed distally | slightly compressed distally not obliquely | obliquely compressed distally | obliquely compressed distally | not obliquely compressed distally | not obliquely compressed distally | slightly obliquely compressed distally | terminating in sharp, corneous claw | long, arched, ventral margin with spiniform bristles | short, ornamented by strong, spiniform bristles on ventral margin | / | straight or twisted, with setos | moderately long, slender, usually twisted | / | |
| Telson (posterior margin ) | biconcave, many teeth extending on to lateral margin | concave, many teeth extending on to lateral margin | biconcave, and small to medium size teeth extending on to lateral margin | concave, with a few small teeth | biconcave, with a few large, recurved teeth | biconcave, with many or a few small teeth | biconcave, with numerous small teeth | concave, with large subacute teeth | lest uropod bordered with long, ribbon-like bristles | difurcated lobes, spinous, without bristles | separated by fine median incision, denticulated | / | oblique, with 2-8 strong spines | subtriangular, oblique, denticulate or with small spinules | / | |
| Male’s pleopod (number) | 3 | 4 | 4 | 3 | 3 | / | / | / | 3 | 3 | / | / | 3 | 3 | / | |
| Reference Literature | Ingle (1985) [28] | Mclaughlin (1974) [26] | ||||||||||||||
“/” means information unavailable.
Publisher’s Note: MDPI stays neutral with regard to jurisdictional claims in published maps and institutional affiliations. |
© 2022 by the authors. Licensee MDPI, Basel, Switzerland. This article is an open access article distributed under the terms and conditions of the Creative Commons Attribution (CC BY) license (https://creativecommons.org/licenses/by/4.0/).
Share and Cite
MDPI and ACS Style
Sultana, Z.; Babarinde, I.A.; Asakura, A. Diversity and Molecular Phylogeny of Pagurid Hermit Crabs (Anomura: Paguridae: Pagurus). Diversity 2022, 14, 141. https://0-doi-org.brum.beds.ac.uk/10.3390/d14020141
AMA Style
Sultana Z, Babarinde IA, Asakura A. Diversity and Molecular Phylogeny of Pagurid Hermit Crabs (Anomura: Paguridae: Pagurus). Diversity. 2022; 14(2):141. https://0-doi-org.brum.beds.ac.uk/10.3390/d14020141
Chicago/Turabian StyleSultana, Zakea, Isaac Adeyemi Babarinde, and Akira Asakura. 2022. "Diversity and Molecular Phylogeny of Pagurid Hermit Crabs (Anomura: Paguridae: Pagurus)" Diversity 14, no. 2: 141. https://0-doi-org.brum.beds.ac.uk/10.3390/d14020141
Note that from the first issue of 2016, this journal uses article numbers instead of page numbers. See further details here.