
Genetic Contributions of Genes on Sex Chromosomes and Mitochondrial DNA in a Pedigreed Population


Graduate School of Agricultural Science, Tohoku University, Sendai 980-8572, Japan
*
Author to whom correspondence should be addressed.
Diversity 2022, 14(2), 142; https://0-doi-org.brum.beds.ac.uk/10.3390/d14020142
Submission received: 23 January 2022
/
Revised: 31 January 2022
/
Accepted: 15 February 2022
/
Published: 16 February 2022
Abstract
:The genetic contribution with respect to autosomal genes has been widely used to evaluate the genetic diversity of a target population. Here, we developed a method to calculate the genetic contribution with respect to genes on sex chromosomes and mitochondrial DNA through pedigree analysis. To demonstrate the performance, we applied the methods for calculating genetic contributions to example pedigree data. To verify the results of genetic contribution calculations, we performed gene-dropping simulations mimicking flows of genes on autosomes, X and Y chromosomes, and mitochondrial DNA, and then compared the results from the simulation with the corresponding genetic contributions. To investigate the effect of pedigree error, we compared the results of genetic contribution calculations using pedigree data with and without errors. The results of gene-dropping simulation showed good agreement with the results of the genetic contribution calculation. The effect of pedigree errors on the calculation of genetic contribution depended on the error rate. Since the patterns of the genetic contributions of such genes might be different from those on autosomes, the novel approach could provide new information on the genetic composition of populations. The results are expected to contribute to the development of methods for sustainable breeding and population management.
1. Introduction
In livestock breeding, production traits have been the main targets of genetic improvement, such as milk yield of dairy cattle, carcass weight of beef cattle, and growth rate of pigs [1]. Heritabilities estimated from many phenotypic records and pedigree information under the infinitesimal model, which generally targets quantitative trait loci on autosomes (e.g., [2,3,4]), are often moderate to high (e.g., [5,6,7]), and genetic improvements have made steady progress (e.g., [8,9,10]). On the other hand, there is growing concern about the decline in genetic diversity within given populations, which might be further boosted by introducing a genomic selection scheme (e.g., [11,12,13]). Therefore, developing a tool to effectively manage and secure genetic diversity is an urgent need (e.g., [14,15,16]). Existing theories assume the use of 100% accurate pedigree data, although low but non-zero pedigree error rates, partly due to human errors, have been reported (e.g., [17,18,19]). This indicates the importance of investigating the effect of pedigree error on evaluation of genetic diversity (e.g., [20,21,22]).
Recent studies have investigated genetic improvement of novel traits, including fertility and disease resistance (e.g., [23,24,25]), with lower estimated heritabilities than those of production traits (e.g., [5,26,27]). An increasing number of studies have examined the relationships of sex chromosomes and mitochondria with gametogenesis, embryogenesis, immune function, feed efficiency, and heat stress (e.g., [28,29,30,31,32,33]). These facts suggest the importance of non-autosomal genetic materials (e.g., [34,35,36]), although the sex chromosomes and mitochondrial DNA have fewer genes than autosomes.
The use of conserved genetic resources, such as cryopreserved semen, oocytes, embryos, and even primordial germ cells, seems important in securing genetic variability within a population to improve based on revised breeding objectives, occasionally adding novel traits (e.g., [37,38,39]). Furthermore, for example, domestic pig breeders occasionally introduce foreign genes into their populations by using imported frozen semen. On the other hand, introduction of external genes to increase genetic variance could have risk of genetic contamination or pollution of a population (e.g., [40,41,42]). Genetic pollution is also a problem in managing the genetic diversity of wild animal populations, such as the case of wild boars in Japan reported after the Fukushima Daiichi Nuclear Power Plant accident in 2011 (e.g., [42,43,44]). Thus, providing a proper methodology to manage the genetic composition in a target population is always essential.
The genetic contribution of a particular individual can be used as an indicator to monitor the pattern of gene transmission in a population with pedigree information (e.g., [45,46,47]). In Japan, the genetic contribution has been used for line maintenance and brand identification in pigs and for genetic diversity management in Wagyu cattle populations (e.g., [48,49,50,51]). For example, different pig strains have been developed through closed-line breeding with widely collecting animals and semen as a base population and strict selection of several generations (e.g., [8,52,53]), and the coefficient of variation (CV) of genetic contribution has been used to keep the genetic composition of the population after approving it as a distinct strain (e.g., [51,54,55]). Nishida et al. [54] proposed a goodness-of-fit test using the CV of genetic contribution to evaluate the degree to which the genetic contributions deviate from equal. However, the classical genetic contribution generally targets only autosomal genes.
Here, we developed a method for calculating the genetic contribution with respect to genes on the sex chromosomes and mitochondrial DNA, as an extension of the method for calculating that with respect to autosomal genes. We assessed the performance using the toy example obtained from Fernando and Grossman [56] and the pedigree data of laboratory mice of Ogawa and Satoh [57]. To verify the results of genetic contributions calculated using the mouse pedigree data, we performed a gene-dropping simulation [58] and compared the results from the simulation with the calculated genetic contributions. To assess the effect of pedigree errors, we compared results with and without introduced errors in the pedigree data.
2. Materials and Methods
2.1. Genetic Contribution of an Individual with Respect to Autosomal Genes
First, we will introduce the genetic contribution of individual I to individual A with respect to autosomal genes, GCAI,A, which is calculated as [45,58]:
where n is the maximum difference between the generations of I and A (n ≥ t) in a given pedigree structure, and at is the total number of appearances of I. For instance, GCAI,A = 0.5 when I is the parent of A, GCAI,A = 0.25 when I is the grandparent of A, GCAI,A = 0 when I is the sib of A, and GCAI,A = 1 when I and A are identical. Note that it is assumed that individual I has two unique alleles for autosomal genes and that the contribution of one of the I’s two alleles to individual A can be calculated as the half of GCAI,A, whereas the contribution of individual I to one of the A’s two alleles can be the same as GCAI,A.
Next, when A is the direct descendant of I, denoting A’s sire and dam as S and D, the following equation holds [51,54]:
By extending this approach, we devised a method of calculating the genetic contribution with respect to genes on sex chromosomes and mitochondrial DNA.
2.2. Genetic Contribution with Respect to Genes on Sex Chromosomes and Mitochondrial DNA
We will consider the genetic contribution of individual I with respect to genes on sex chromosomes to individual A of each sex. Note that here we considered genes on X-specific and Y-specific regions because sex chromosomes contain pseudoautosomal regions (e.g., [59,60,61]). Here, it is assumed that individual I has a unique one allele and two alleles for genes on X chromosome, and a unique one allele and no allele for genes on Y chromosome when I is male (XY) and female (XX), respectively, as well as a unique one allele for genes on mitochondrial DNA regardless of the sex of I. When A is male (XY), the genetic contributions with respect to genes on X and Y chromosomes, denoted respectively as GCXI,A and GCYI,A, are:
When I and A are identical, GCXI,A = GCYI,A = 1. When A is female (XX):
When I and A are identical, GCXI,A = 1 but GCYI,A = 0 because I does not have her Y chromosome.
The genetic contribution with respect to genes on mitochondrial DNA, regardless of the sex of A, is calculated as:
When I and A are identical, GCMI,A = 1.
2.3. Average Genetic Contribution of an Individual to a Target Population
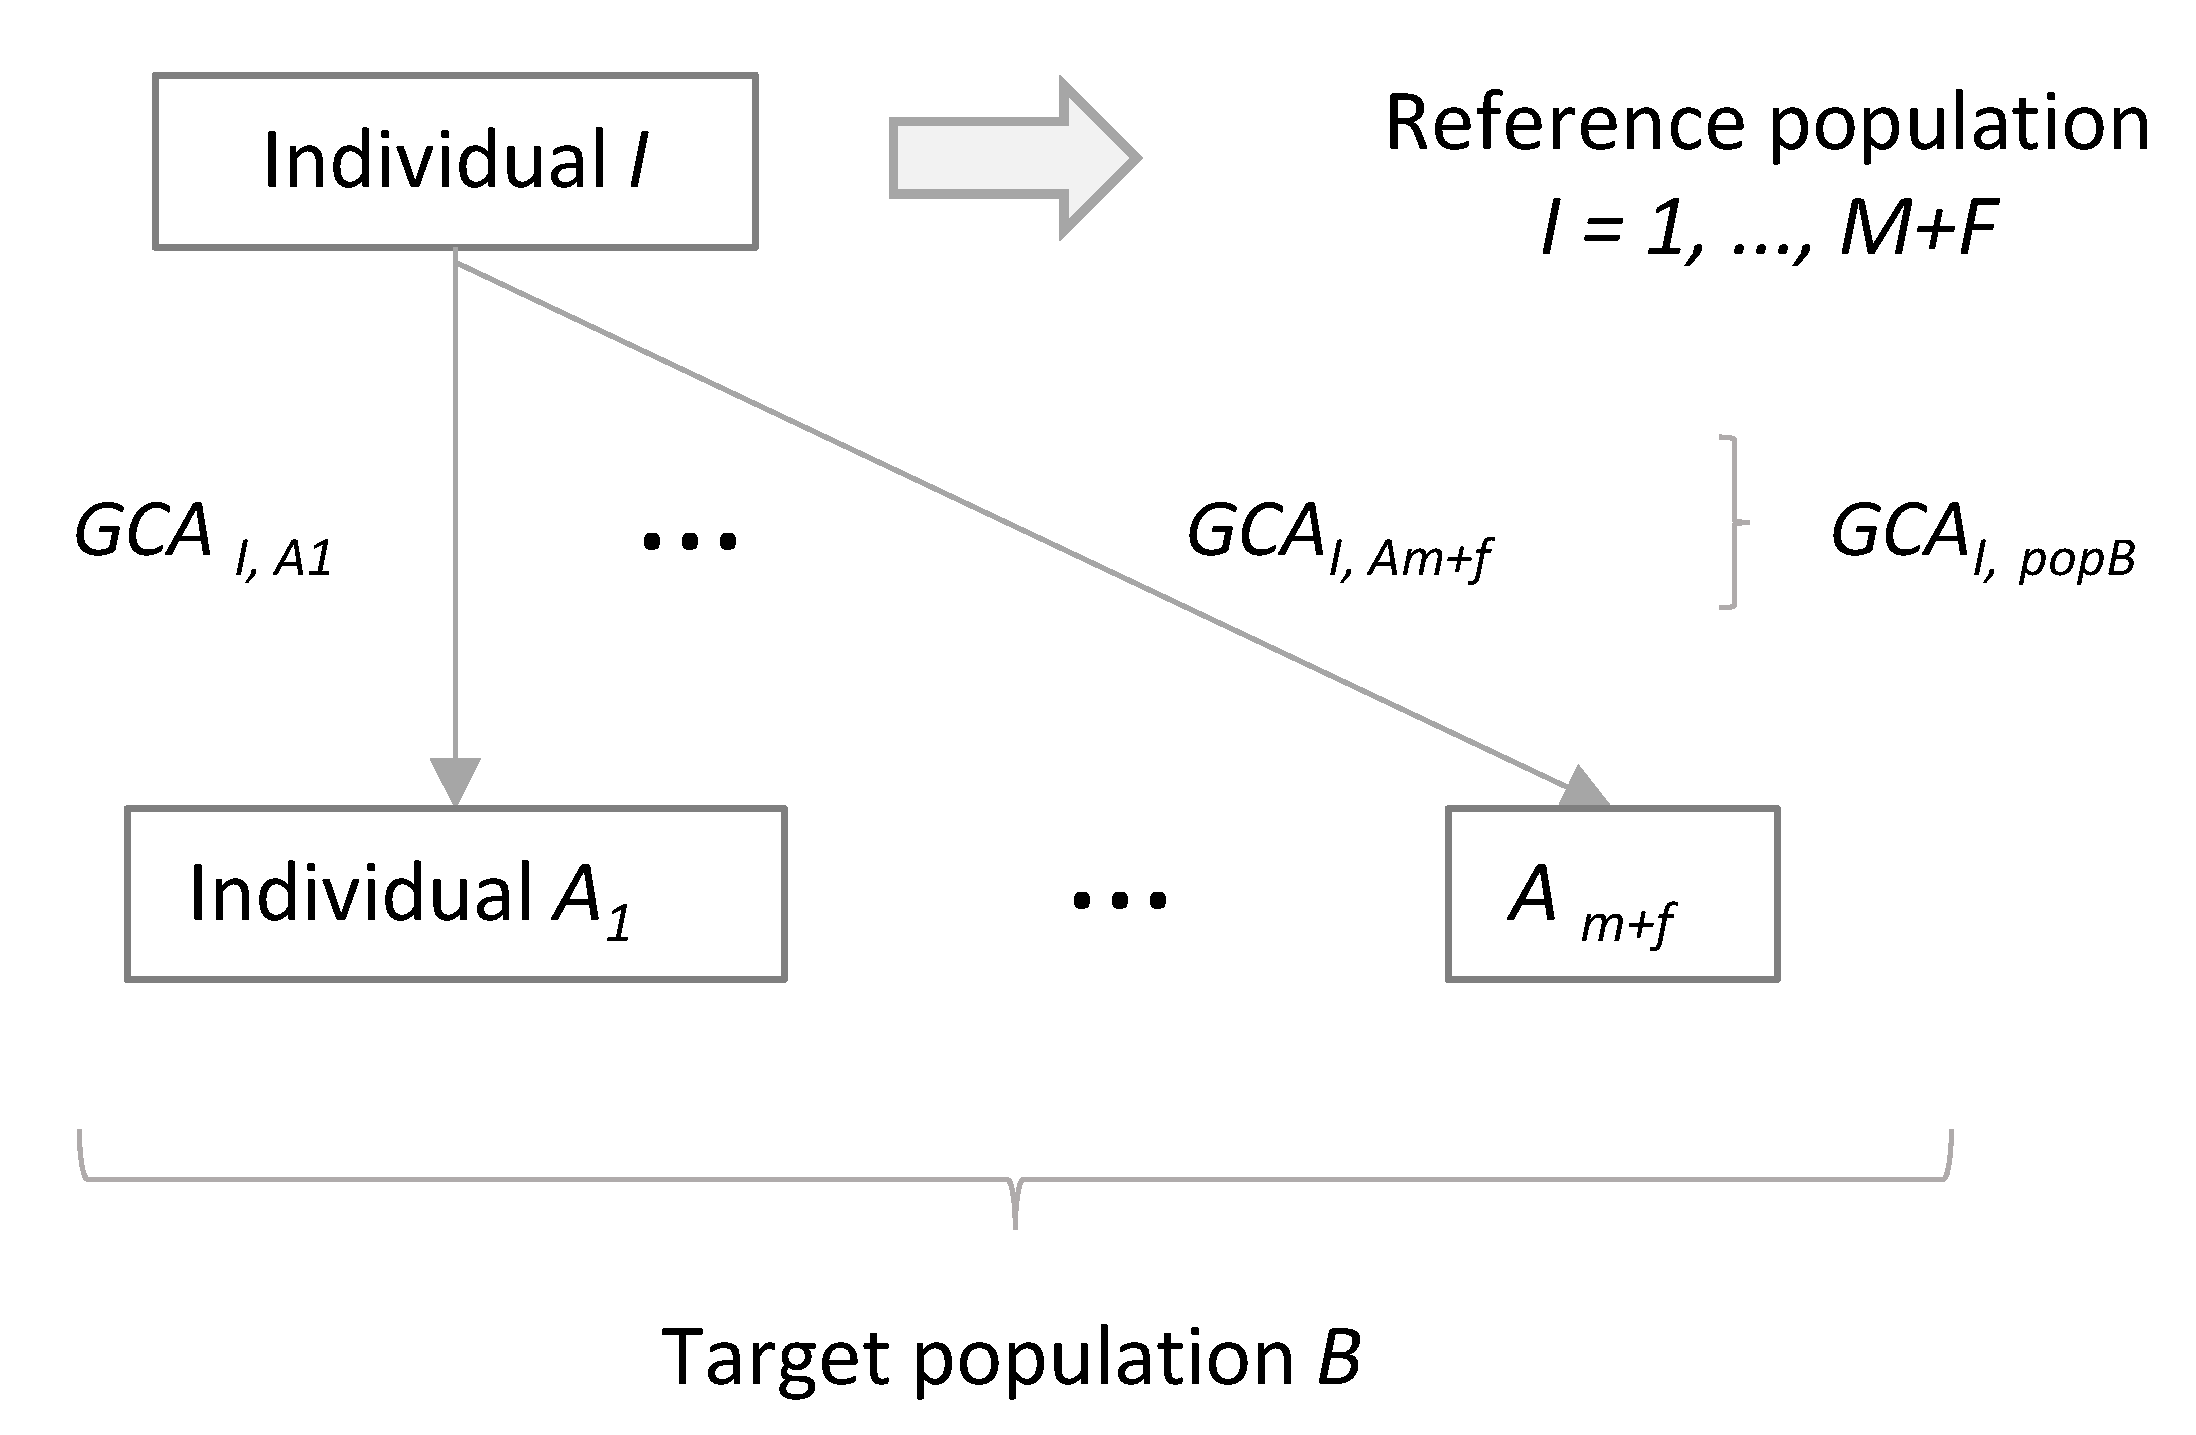
Now we can consider the average genetic contribution of individual I to a target population, denoted as population B (Figure 1). We assume that population B consists of m males and f females, and each is denoted as individual Ak (k = 1, …, m, m + 1, …, m + f). Thus, we can calculate the average genetic contribution of individual I to target population B with respective to autosomal genes, GCAI,popB, as [51,54,55]:
Here, multiplying by 2 reflects that each Ak has two alleles for autosomal genes. Following this, the average genetic contributions with respect to genes on X chromosome (GCXI,popB), Y chromosome (GCYI,popB), and mitochondrial DNA (GCMI,popB) can be calculated as:
2.4. Coefficient of Variation of Genetic Contribution
Here, we assume that a population, denoted as reference population in this study and being different from target population B, consists of M males and F females, including individual I (I = 1, …, M, M + 1, …, M + F). We also assume the situation that a new offspring is obtained from target population B and want to evaluate the degree of heterogeneity in genetic contributions to a virtual offspring from population B (Figure 2). The sum of the genetic contributions of males in the reference population to a virtual offspring from population B is expected to be 1/2, 1/3, 1, and 0 for genes on autosomes, the X chromosome, the Y chromosome, and mitochondrial DNA, respectively, while that of females in the reference population is expected to be 1/2, 2/3, 0, and 1, respectively. Based on these, weighted averages of the genetic contributions of individual I in to population B with respect to genes on autosomes (), the X chromosome (), the Y chromosome (), and mitochondrial DNA (), with weights based on the number of males and females in a target population, can be calculated as:
Finally, the CV of the genetic contribution to population B with respective to autosomal genes (CVA) is calculated as [51,54]:
Here, the values of 1/2M and 1/2F are used as the expected values of for males and females in a reference population, respectively [51,54]. Similarly, CV of the genetic contribution with respect to genes on X chromosome (CVX), Y chromosome (CVY), and mitochondrial DNA (CVM) to population B, were calculated as:
2.5. Example Pedigree Data
To investigate the performance of the approach we devised, two pedigree data were used as examples. Table 1 shows the toy sample obtained from Fernando and Grossman [56]. Table S1 is the pedigree data of a mouse population [57], an experiment was carried out over 2 years from 2018 to 2020, under the Regulations for Animal Experiments and Related Activities at Tohoku University (http://www.clar.med.tohoku.ac.jp/en.html) (lastly accessed on 1 October 2021). All mice were reared and handled according to the protocols approved by the Institutional Animal Care and Use Committee of Tohoku University [57]. For breeding scheme, see Figure 1 in Ogawa and Satoh [57]. The mouse population was a total of non-overlapping 8 generations from G1 to G8 (Table 2). Parent information on 100 G1 mice (50 male and 50 female mice) was unknown, and the 92 G1 mice (46 male and 46 female mice) had their offspring in G2. Nishida et al. [54] proposed a goodness-of-fit test using the following values as chi-square statistics, to test whether the genetic contributions with respect to autosomal genes to a virtual offspring obtained from target population B are equal:
A previous study [57] conducted this test for the contribution of the 92 G1 mice (M = F = 46) to the parents of each generation and confirmed that p-value was always >0.05.
2.6. Data Analysis
To demonstrate the performance, we applied the rules for determining GCAI,A, GCXI,A, GCYI,A, and GCMI,A to the pedigree data from Fernando and Grossman [56] (Table 1). We also applied the same rules to mouse pedigree data from Ogawa and Satoh [57] (Table S1) in order to obtain GCAI,A, GCXI,A, GCYI,A, and GCMI,A of each of the G1 mice (50 males and 50 females) to each of the G8 mice (151 males and 152 females) (Table 2), and then we calculated the average genetic contributions, GCAI,popB, GCXI,popB, GCYI,popB, and GCMI,popB, of each G1 mouse to the population of 303 G8 mice.
To verify the results of calculating GCAI,popB, GCXI,popB, GCYI,popB, and GCMI,popB in the mouse population, we performed a gene-dropping simulation [58]. In the case of autosomal genes, every mouse in G1 has two unique alleles, giving a total of 200 unique alleles in G1. In the case of genes on X chromosome, each of the 50 males has one unique allele and each of the 50 females has two unique alleles, giving a total of 150 unique alleles in G1. In the case of genes on Y chromosome, each male has one unique allele, giving a total of 50 unique alleles in G1. In the case of mitochondrial DNA, every mouse has one unique allele, giving a total of 100 unique alleles in G1. Simulated alleles in G1 were then dropped progressively to descendants in G8 according to each mode of inheritance, and then we determined the frequency of each allele in G8 population. These frequencies were converted to the frequency of all alleles each G1 mouse uniquely had, that is, the frequencies were summed when a G1 mouse had two alleles. We ran this simulation for 10,000 iterations to obtain the averages of the proportions through the iterations, and then compared the results to the average genetic contributions, GCAI,popB, GCXI,popB, GCYI,popB, and GCMI,popB.
To assess the effect of pedigree error on calculated genetic contributions, errors were introduced into parent information on G2 to G8 mice by randomly replacing the original parents with others used as parents in the same generation. GCAI,popB, GCXI,popB, GCYI,popB, and GCMI,popB of each G1 mouse to G8 population were calculated using pedigree information with errors. According to estimated pedigree error rates by previous studies (e.g., [17,18,19]), the error size was set to 1%, 2%, 4%, 8%, and 16% of the total number of known parents (Table 2). Within the same error rate, we ran this simulation for 10,000 iterations to obtain the root mean squared error (RMSE) of the average genetic contributions calculated with and without pedigree errors. Note that only 50 G1 males were considered in calculating RMSE for GCYI,popB and 50 G1 female mice were considered for GCMI,popB.
We calculated CVA, CVX, CVY, and CVM using mouse pedigree data, changing the target population from G1 to G8 while retaining the reference population as G1.
3. Results and Discussion
3.1. Calculated Genetic Contribution
Table 3 shows the results of the calculation of GCAI,A, GCXI,A, GCYI,A, and GCMI,A using the pedigree data shown as Table 1. No pairs completely matched the distribution of the calculated genetic contributions. As expected, the results were real numbers ranging from 0 to 1 for GCAI,A and GCXI,A, and either 0 or 1 for GCYI,A and GCMI,A. The sums of GCAI,A of individuals 1 and 2 to individuals 3, 5, 7, and 8 were <1, because the dam of individual 3 was unknown in the pedigree data. This problem might be manageable by introducing the concept of a phantom parent group and a meta-founder [62,63]. In this example, all the Y chromosomes and mitochondrial DNA of the individuals 4 to 8 were derived from individuals 1 and 2, respectively.
3.2. Comparing with Gene-Dropping Simulation Results
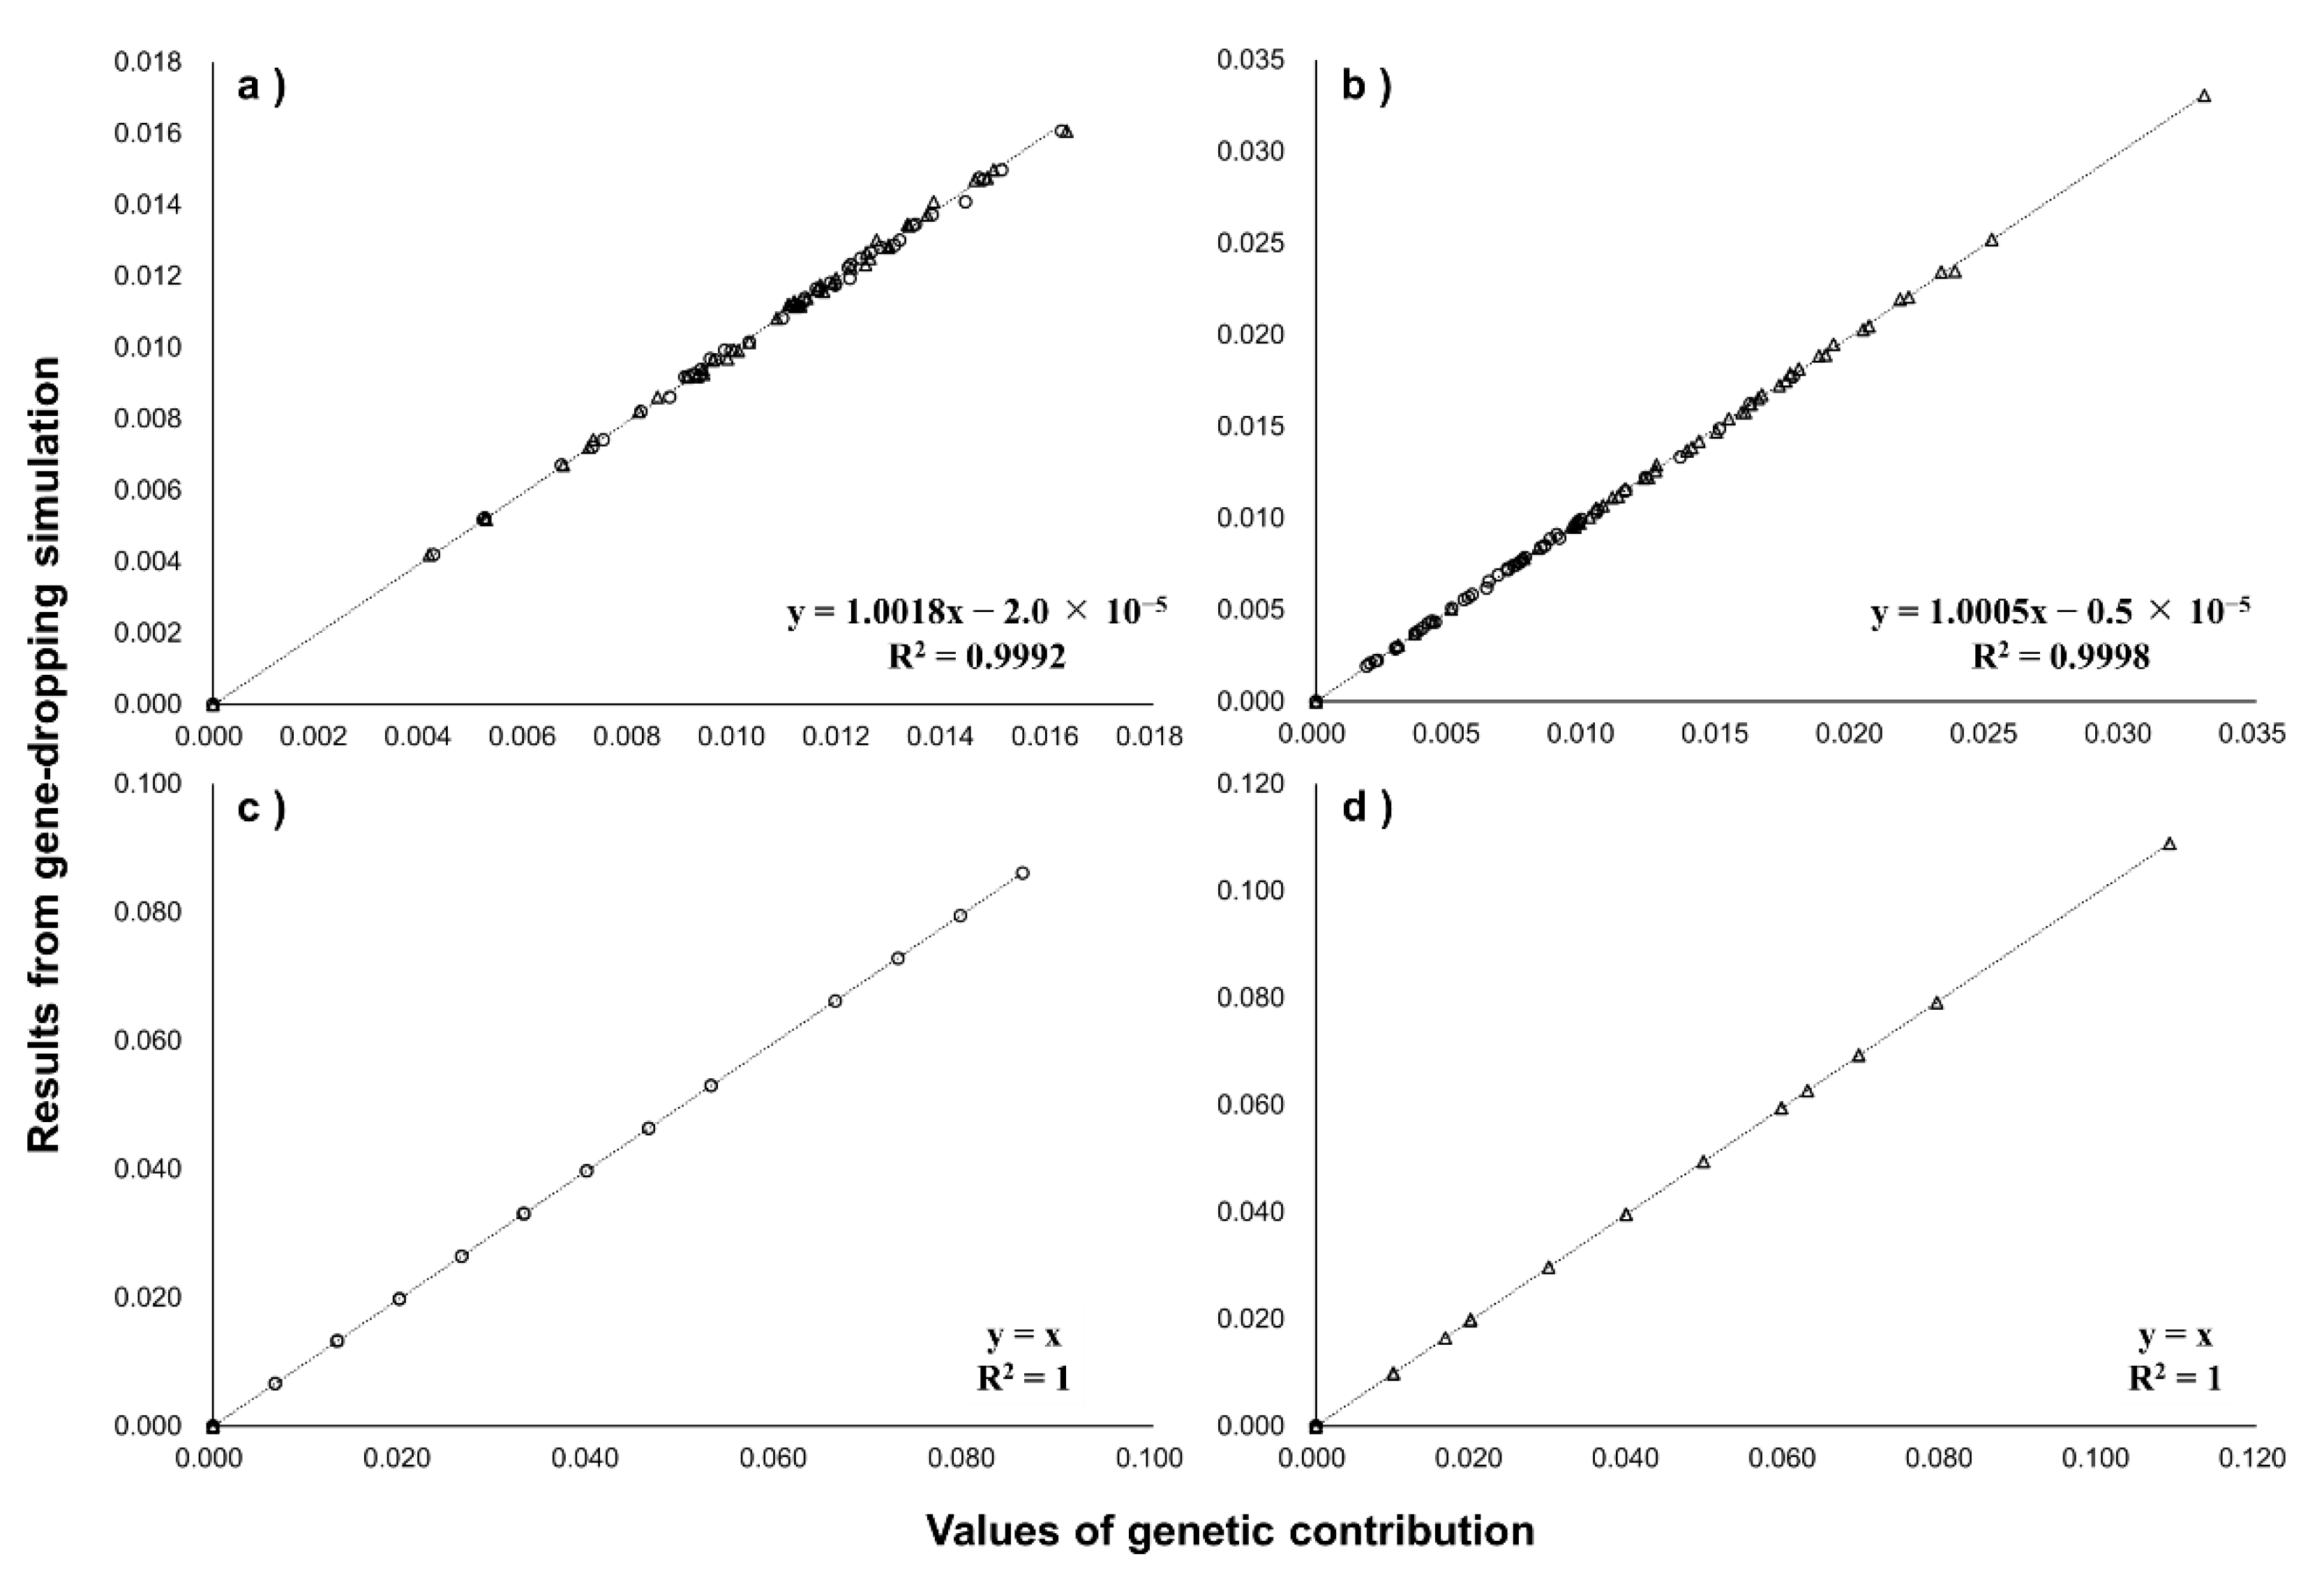
Figure 3 compares GCAI,popB, GCXI,popB, GCYI,popB, and GCMI,popB of each G1 mouse to G8 with the total frequencies of all unique alleles of each G1 mouse, which were determined by the gene-dropping simulation performed with mouse pedigree data. Coefficients of determinations between them were all >0.999, the single regression coefficients were almost 1, and the intercepts were almost 0, indicating very high consistency. The results indicate the validity of using GCAI,popB, GCXI,popB, GCYI,popB, and GCMI,popB as indicators of “expected” contributions of individual I to target population B.
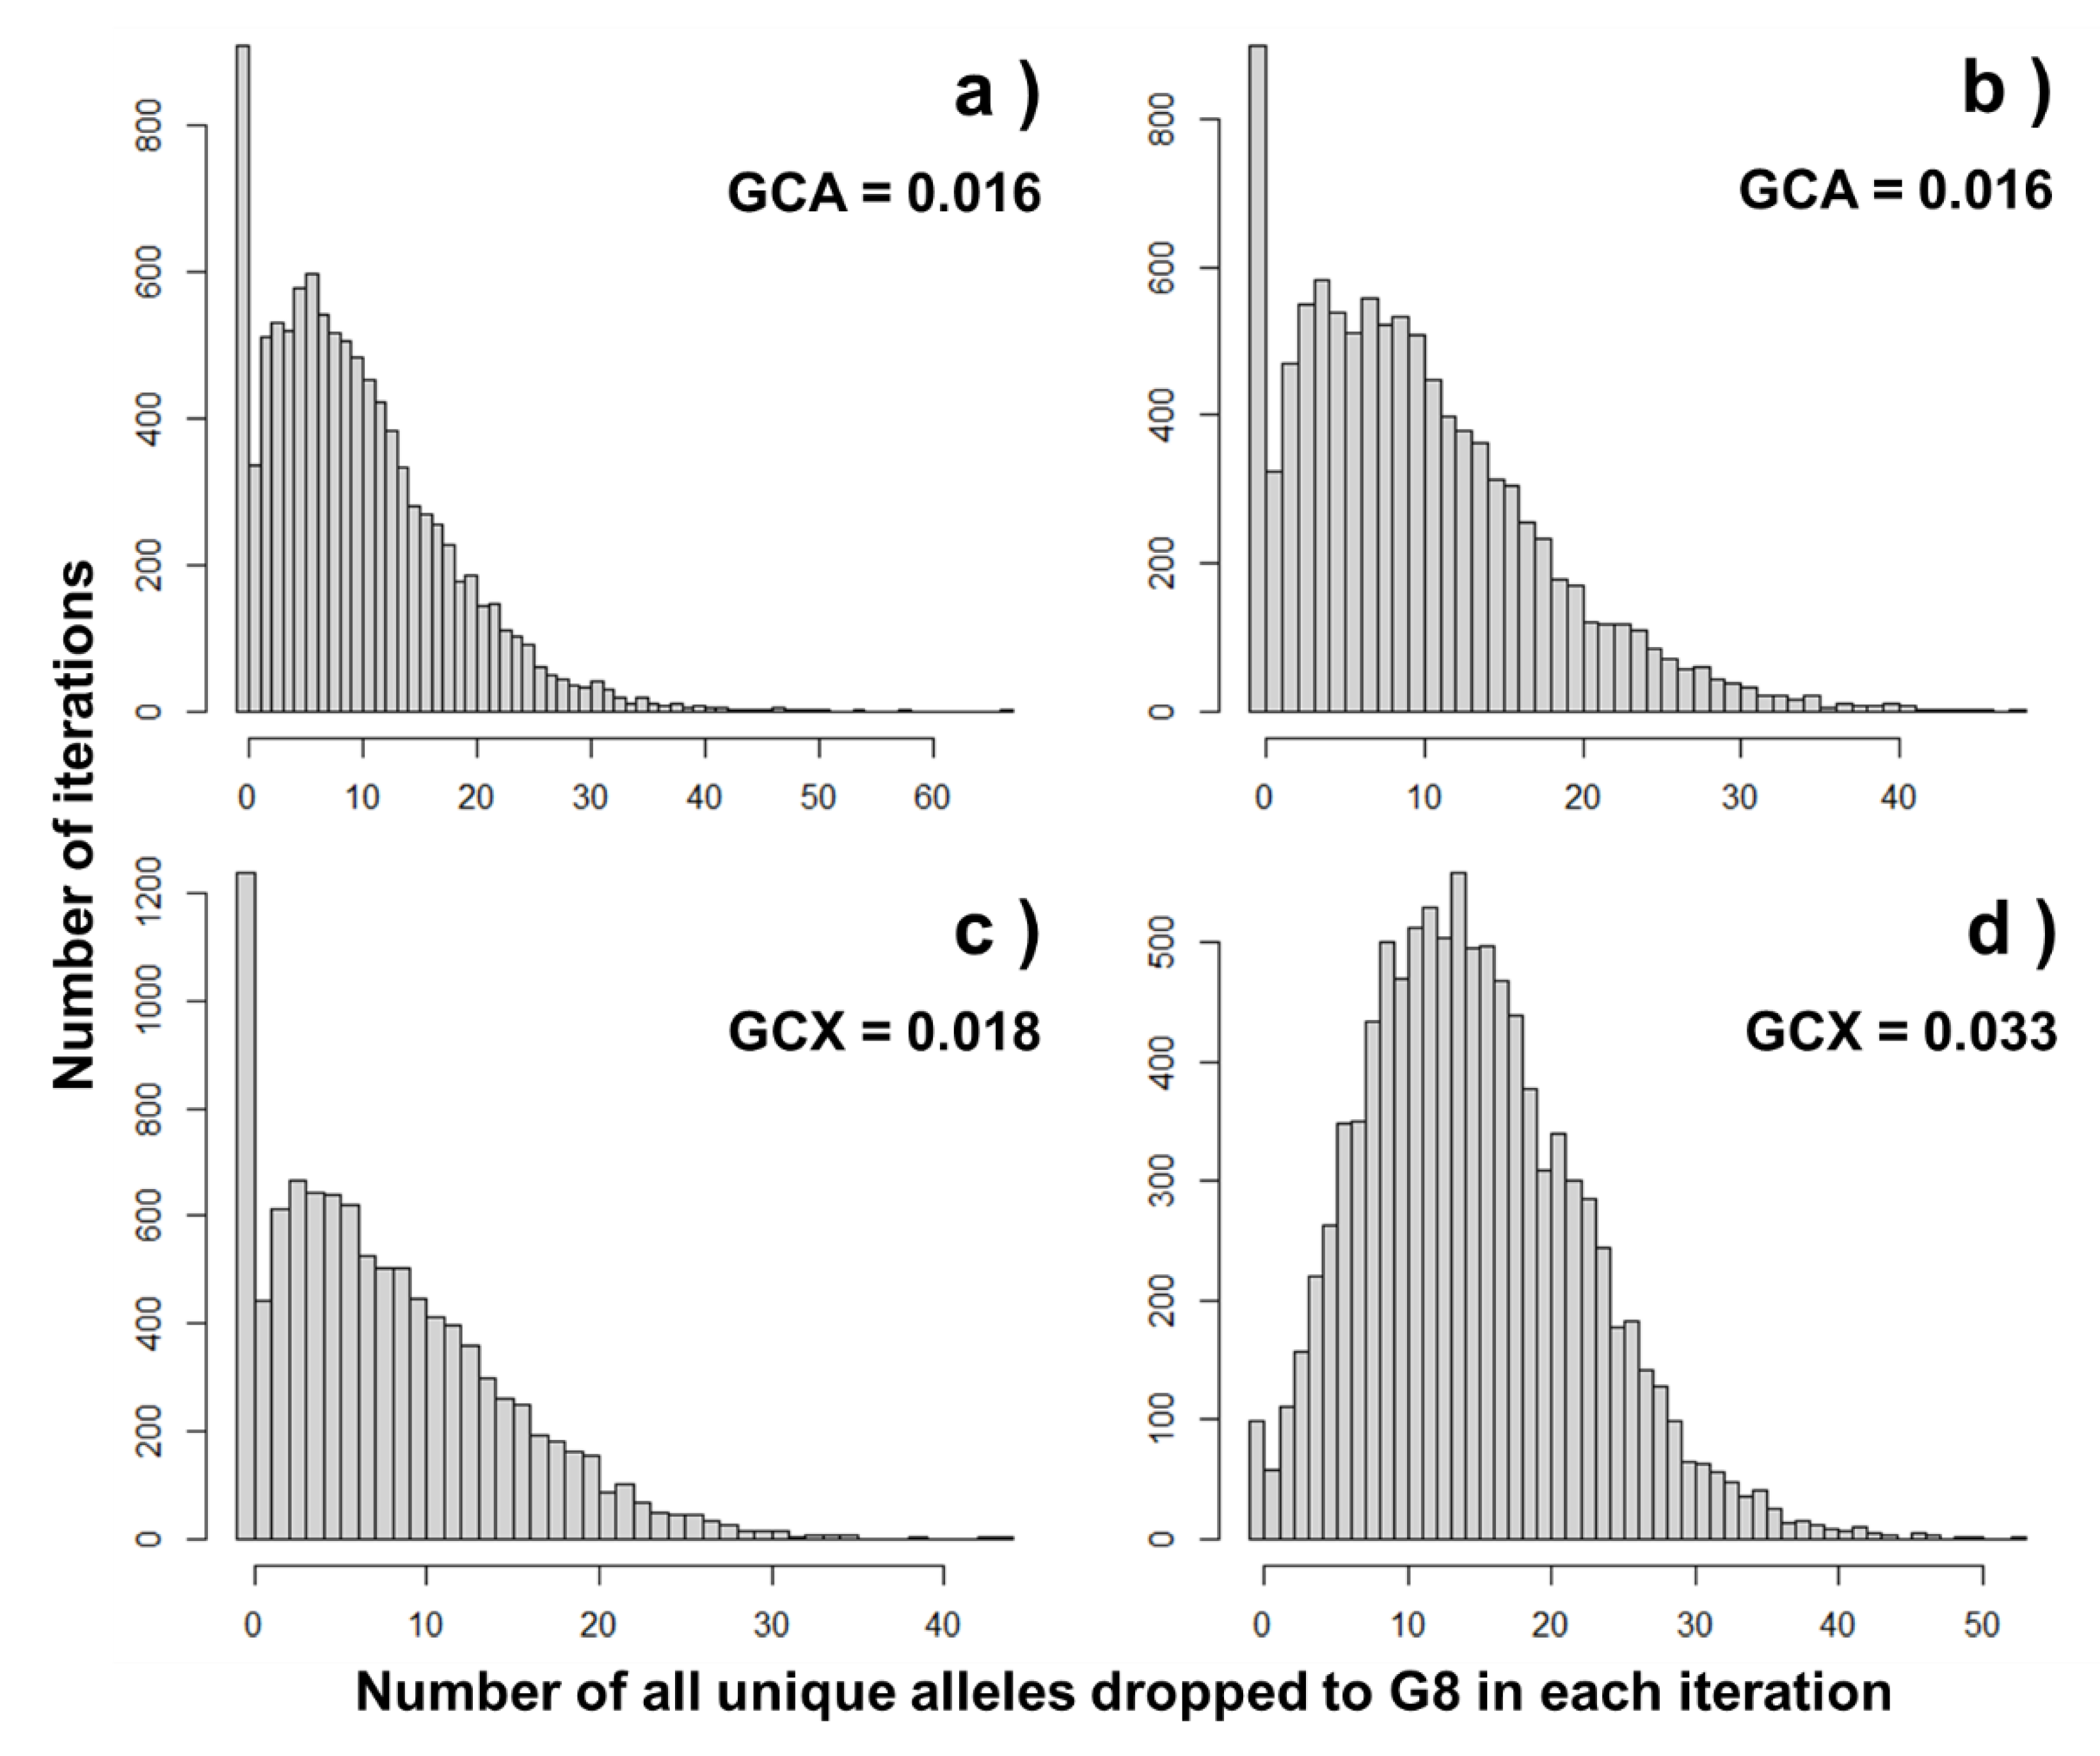
Figure 4 shows histograms of the total numbers of all unique alleles of four mice with the highest GCAI,popB and GCXI,popB. As shown by Figure 4, the gene-dropping simulation could provide results like the interval estimation, although the performing would be time-consuming. In all cases, the histograms are asymmetric, and therefore, average and mode values seemed inconsistent. There were iterations showing the number of their unique alleles inherited to G8 of 0, suggesting the possibility that even the four mice did not actually transmit their alleles on autosomes and the X chromosome to G8, although their GCAI,popB and GCXI,popB were >0. This possibility would be higher when the difference in the generation number between populations is greater, owing to Mendelian segregation events, or genetic drift. Therefore, a gene-dropping simulation for genes on the X chromosome could provide information, including the expected proportion of surviving alleles (what is called allele retention) as in the case of autosomal genes [58]. Such results cannot be obtained from the calculation of GCAI,popB and GCXI,popB because these are expected contributions. For genes on the Y chromosome and mitochondrial DNA, there was no variation in the number of alleles dropped to G8 among the iterations. This means that individuals with non-zero GCYI,popB and GCMI,popB are expected to transmit their genes without uncertainty.
3.3. Effect of Pedigree Errors on Genetic Contribution Calculation
Table 4 summarizes the results of GCAI,popB, GCXI,popB, GCYI,popB, and GCMI,popB of G1 mice to G8 calculated using pedigree data with errors. As expected, the higher the error rate, the larger the RMSE. On the other hand, the range of RMSE was substantial within the same pedigree error rate. For instance, the maximum value of RMSE for GCAI,popB was 2.20 when the error rate was 1%, which is greater than the mean value of 2.14 when the error rate was 4%, and even the minimum value of 1.87 when the error rate was 8%. When the error rate was 1%, the minimum value of RMSE was >0 for GCAI,popB and GCXI,popB but 0 for GCYI,popB and GCMI,popB. It was expected that there was no effect on calculating GCMI,A when sires were replaced because mitochondrial DNA is assumed to be maternally inherited, and that replacement of dams did not affect GCYI,A because females do not have the Y chromosome. These results indicate that pedigree errors could affect the results of genetic contribution calculations, and the effect might depend on error rate and the kinds of errors. Pedigree errors could have effects not only on genetic diversity evaluation but also on genetic parameter estimation, breeding value prediction, evaluating the degree of inbreeding and inferring inbreeding depression, and so on (e.g., [20,21,64]). Thus, efforts should be still paid to collect and accumulate accurate pedigree information (e.g., [19,65,66]).
3.4. Calculating Coefficient of Variation of Genetic Contribution
Figure 5 shows the changes in CVA, CVX, CVY, and CVM through generations. As expected, CVA, CVX, CVY, and CVM were all zero in G1. Increases in values from G1 to G2 and G2 and G3 were similar among the CVs, while those from G3 to G4 and after seem different. For this population, the way to produce offspring was slightly different between G1 and G2 and during G3 and G8 [57], which might affect the results of calculating CVA, CVX, CVY, and CVM. Values of CVY and CVM were higher than CVA and CVX in G8, which agreed with greater variances of GCYI,popB and GCMI,popB than GCAI,popB and GCXI,popB, shown in Figure 4 and Figure 6.
3.5. General Discussion
The proposed method for calculating the genetic contribution with respect to genes on sex chromosomes is based on the XX–XY-type sex-determination mechanism found in many mammals, including mice, cattle, and pigs. The similar concept used in this study could also be applicable to the ZZ–ZW-type mechanism found in birds, such as chickens and Japanese crested ibises, and in silkworms. For example, briefly, genetic contribution with respect to genes on Z and W chromosomes might be calculated in a similar way to calculate that with respect to genes on X and Y chromosomes, respectively, although the difference in inheritance patterns between sexes must be considered. In recent years, population genetic analysis using genomic information, such as genome-wide single nucleotide polymorphism markers, has become available (e.g., [67,68,69]). However, in livestock populations where selection based on pedigree information has been conducted for many years, it is often more difficult to use genotype information closer to the base population, and thus approaches based on pedigree data are still useful. It should be noted that the indicators proposed do not consider mutations, recombination, or mitochondrial DNA heteroplasmy, as is the case with the genetic contribution with respect to autosomal genes [48,49,50,51].
This study developed the novel method to calculate the genetic contributions with respect to genes on sex chromosomes and mitochondrial DNA. The results of gene-dripping simulation support the validity of our method (Figure 4). The distributions of values for GCAI,popB, GCXI,popB, GCYI,popB, and GCMI,popB were different (Table 3, Figure 6), implying that the degree of genetic composition (diversity) in a target population and its change through time could be different, as shown in Figure 5, depending on what genes are focused on. Therefore, when genes on sex chromosomes and mitochondrial DNA become more important, it will be required to use indicators for sex chromosomes and mitochondrial DNA, as well as autosomal genes. An extreme example would be the case when a genetic disease risk allele is located on sex chromosomes and mitochondrial DNA. Male fertility traits might also be a possible example to utilize GCY and GCM (e.g., [70,71,72]). Genetic evaluation using an animal model in considering the effects of X chromosome inheritance has been proposed [56,73]. Several studies have used this model to estimate the X-linked additive genetic effects using real data (e.g., [74,75,76]), while Meyer [77], with computer simulation, showed the difficulty in accurate estimation of X-linked effects. Wittenburg et al. [78] used the statistical model in considering autosomal and gonosomal (X and Y chromosomes) effects to estimate genetic parameters of piglet birth weight. Effects for Y chromosome and mitochondrial DNA inheritances could be considered as paternal and maternal lineage effects, respectively, based on the calculated GCY and GCM, and then, a statistical model for genetic evaluation simultaneously considering effects for genes on autosomes, sex chromosomes, and mitochondrial DNA might be available. Using this model could provide information on the relative importance of each kind of inheritance (autosomes, X chromosome, Y chromosome, and mitochondrial DNA), which might be available as weighting factors to take all components into account.
Pedigree error could affect the results of calculating genetic contributions (Table 4), which might introduce inappropriate population management. Errors in pedigree data occurred by different reasons, including human errors, and thus, continued efforts should be paid to confirm the accuracy of pedigree data. On the other hand, the values of genetic contributions obtained through pedigree analysis are “expected” values, and “actual” contributions might be different for genes on autosomes and X chromosome due to Mendelian segregation events (genetic drift) (Figure 4). This might be more crucial in the case that a long-term closed-line breeding with smaller population size has been practiced, such as maintaining a pig population after approving as a distinct strain in Japan.
Our primary objective was to develop the method to calculate genetic contributions with respect to genes on sex chromosomes and mitochondrial DNA, and as a further challenge, we extended the concept of CV of genetic contribution with respect to autosomal genes to those with respect to sex chromosomes and mitochondrial DNA. Our method developed in this study might also contribute the expansion of other indicators for genetic diversity, such as the number of founder alleles [48,50]. Further study would be valuable to develop an indicator to monitor the genetic diversity with respect to genes on sex chromosomes and mitochondrial DNA.
In the mouse study population [57], the sex ratio at mating was 1:1, the population has been closed, and there was no generation overlap (Table S1). We used this data as the example because such a pedigree structure seems easier to interpret the obtained results. On the other hand, livestock populations often feature generation overlap and sex ratio bias at mating, as shown in the pedigree data of Fernando and Grossman [56] (Table 1). As a result, for example, limited Y chromosome diversity has been reported in horse and cattle populations (e.g., [35,79,80]). Recent studies have examined the genetic improvement of superovulatory responses in cattle (e.g., [25,81,82]), in connection with the idea of preimplantation genomic selection (e.g., [83,84,85]). This kind of production might increase the frequency of full-sibs and reduce genetic diversity, especially with respect to the X chromosome and mitochondrial DNA. In the future, the behavior of genetic contribution under different pedigree structures should be investigated in detail using computer simulations.
Storage facilities, such as gene banks, are used to preserve gametes and embryos (e.g., [86,87,88]), and as a response to epidemics, such as recent outbreaks of classical swine fever in Japan [89,90,91]. Previous studies have examined the use of conserved genetic resources for autosomal genes (e.g., [92,93,94]), while genetic diversity of genes on sex chromosomes and mitochondrial DNA should also be monitored. Therefore, in the future, the performance of the results of a genetic contribution calculation in tracing the gene flow should be assessed in detail. Moreover, genetic improvement by selection while considering genetic diversity for autosomal genes has been studied (e.g., [95,96,97]), and it might be possible to consider genes other than autosomes by using the indicators developed here.
4. Conclusions
We developed novel methods for calculating the genetic contribution for genes on sex chromosomes and mitochondrial DNA by extending the method for calculating the genetic contribution of autosomal genes. Using real pedigree data of a mouse population [57] (Table S1), the calculated genetic contributions were in excellent agreement with the results of the gene-dropping simulation (Figure 3). The consistency among the calculated genetic contributions for genes on different types of DNA was not consistently high (Figure 6). The effect of pedigree errors on the calculated genetic contribution depended on the error rate and when errors were introduced (Table 4). We believe that the proposed methodology could contribute to future sustainable breeding strategies.
Supplementary Materials
The following supporting information can be downloaded at: https://0-www-mdpi-com.brum.beds.ac.uk/article/10.3390/d14020142/s1, Table S1: Pedigree data of mice population in Ogawa and Satoh [57].
Author Contributions
Conceptualization, S.O. and M.S.; methodology, S.O.; formal analysis, S.O.; resources, S.O.; data curation, S.O.; writing—original draft preparation, S.O.; writing—review and editing, S.O. and M.S.; visualization, S.O.; supervision, M.S. All authors have read and agreed to the published version of the manuscript.
Funding
This research received no external funding.
Institutional Review Board Statement
Not applicable.
Informed Consent Statement
Not applicable.
Data Availability Statement
All data generated or analyzed during this study are included in this published article and its supplementary information files.
Acknowledgments
We thank Akiko Iwai, Kazuyuki Tashima, Ayane Konta, Ryoichi Furukawa, Natsumi Yazaki, Tomohiro Ishizaka, Kasumi Ichinoseki, Yusuke Ota, Hitomi Hara, Taiga Ito, Suguru Kitajima, and Chihiro Homma, the technical assistant and students of the Laboratory of Animal Breeding and Genetics, Graduate School of Agricultural Science, Tohoku University, for their help in data collection. We thank Yuki Arino and Nana Sato, technical staffs of the Animal experiment building of the Graduate School of Agricultural Science, for maintaining the rearing room.
Conflicts of Interest
The authors declare no conflict of interest.
References
- Thornton, P.K. Livestock production: Recent trends, future prospects. Phil. Trans. R. Soc. B Biol. Sci. 2010, 365, 2853–2867. [Google Scholar] [CrossRef] [Green Version]
- Henderson, C.R. Estimation of variances in animal model and reduced animal model for single traits and single records. J. Dairy Sci. 1986, 69, 1394–1402. [Google Scholar] [CrossRef]
- Hofer, A. Variance component estimation in animal breeding: A review. J. Anim. Breed. Genet. 1998, 115, 247–265. [Google Scholar] [CrossRef]
- Thompson, R. Estimation of quantitative genetic parameters. Proc. R. Soc. B Biol. Sci. 2008, 27, 679–686. [Google Scholar] [CrossRef] [Green Version]
- Oyama, K. Genetic variability of Wagyu cattle estimated by statistical approaches. Anim. Sci. J. 2011, 82, 367–373. [Google Scholar] [CrossRef] [PubMed]
- Akanno, E.C.; Schenkel, F.S.; Quinton, V.M.; Friendship, R.M.; Robinson, J.A.B. Meta-analysis of genetic parameter estimates for reproduction, growth and carcass traits of pigs in the tropics. Livest Sci. 2013, 152, 101–113. [Google Scholar] [CrossRef]
- Jembere, T.; Dessie, T.; Rischkowsky, B.; Kebede, K.; Okeyo, A.M.; Haile, A. Meta-analysis of average estimates of genetic parameters for growth, reproduction and milk production traits in goats. Small Rumin. Res. 2017, 153, 71–80. [Google Scholar] [CrossRef]
- Suzuki, K.; Kadowaki, H.; Shibata, T.; Uchida, H.; Nishida, A. Selection for daily gain, loin-eye area, backfat thickness and intramuscular fat based on desired gains over seven generations of Duroc pigs. Livest. Prod. Sci. 2005, 97, 193–202. [Google Scholar] [CrossRef]
- Sasaki, Y.; Miyake, T.; Gaillard, C.; Oguni, T.; Matsumoto, M.; Ito, M.; Kurahara, T.; Sasae, Y.; Fujinaka, K.; Ohtagaki, S.; et al. Comparison of genetic gains per year for carcass traits among breeding programs in the Japanese Brown and the Japanese Black cattle. J. Anim. Sci. 2006, 84, 317–323. [Google Scholar] [CrossRef]
- García-Ruiz, A.; Cole, J.B.; VanRaden, P.M.; Wiggans, G.R.; Ruiz-López, F.J.; Van Tassell, C.P. Changes in genetic selection differentials and generation intervals in US Holstein dairy cattle as a result of genomic selection. Proc. Natl. Acad. Sci. USA 2016, 113, E3995–E4004. [Google Scholar] [CrossRef] [Green Version]
- Doekes, H.P.; Veerkamp, R.F.; Bijma, P.; Hiemstra, S.J.; Windig, J.J. Trends in genome-wide and region-specific genetic diversity in the Dutch-Flemish Holstein–Friesian breeding program from 1986 to 2015. Genet. Sel. Evol. 2018, 50, 15. [Google Scholar] [CrossRef] [PubMed] [Green Version]
- Forutan, M.; Mahuari, S.A.; Baes, C.; Melzer, N.; Schenkel, F.S.; Sargolzaei, M. Inbreeding and runs of homozygosity before and after genomic selection in North American Holstein cattle. BMC Genom. 2018, 19, 98. [Google Scholar] [CrossRef] [PubMed]
- Doublet, A.-C.; Croiseau, P.; Fritz, S.; Michenet, A.; Hozé, C.; Danchin-Burge, C.; Laloë, D.; Restoux, G. The impact of genomic selection on genetic diversity and genetic gain in three French dairy cattle breeds. Genet. Sel. Evol. 2019, 51, 52. [Google Scholar] [CrossRef] [PubMed] [Green Version]
- Meuwissen, T.H.E.; Sonesson, A.K.; Gebregiwergis, G.; Woolliams, J.A. Management of genetic diversity in the era of genomics. Front. Genet. 2020, 11, 880. [Google Scholar] [CrossRef]
- Polak, G.; Gurgul, A.; Jasielczuk, I.; Szmatoła, T.; Krupiński, J.; Bugno-Poniewierska, M. Suitability of pedigree information and genomic methods for analyzing inbreeding of polish cold-blooded horses covered by conservation programs. Genes 2021, 12, 429. [Google Scholar] [CrossRef] [PubMed]
- Villanueva, B.; Fernández, A.; Saura, M.; Caballero, A.; Fernández, J.; Morales-González, E.; Toro, M.A.; Pong-Wong, R. The value of genomic relationship matrices to estimate levels of inbreeding. Genet. Sel. Evol. 2021, 53, 42. [Google Scholar] [CrossRef]
- Leroy, G.; Danchin-Burge, C.; Palhiere, I.; Baumung, R.; Fritz, S.; Mériaux, J.C.; Gautier, M. An ABC estimate of pedigree error rate: Application in dog, sheep and cattle breeds. Anim. Genet. 2012, 43, 309–314. [Google Scholar] [CrossRef]
- Zhang, J.; Song, H.; Zhang, Q.; Ding, X. Assessment of relationships between pigs based on pedigree and genomic information. Animal 2020, 14, 697–705. [Google Scholar] [CrossRef]
- Komiya, R.; Ogawa, S.; Aonuma, T.; Satoh, M. Performance of using opposing homozygotes for paternity testing in Japanese Black cattle. J. Anim. Breed. Genet. 2022, 139, 113–124. [Google Scholar] [CrossRef]
- Sørensen, M.K.; Sørensen, A.C.; Baumung, R.; Borchersen, S.; Berg, P. Optimal genetic contribution selection in Danish Holstein depends on pedigree quality. Livest. Sci. 2008, 118, 212–222. [Google Scholar] [CrossRef]
- Oliehoek, P.A.; Bijma, P. Effects of pedigree errors on the efficiency of conservation decisions. Genet. Sel. Evol. 2009, 41, 9. [Google Scholar] [CrossRef] [Green Version]
- Reid, J.M.; Keller, L.F.; Marr, A.B.; Nietlisbach, P.; Sardell, R.J.; Arcese, P. Pedigree error due to extra-pair reproduction substantially biases estimates of inbreeding depression. Evolution 2014, 68, 802–815. [Google Scholar] [CrossRef] [Green Version]
- Kadowaki, H.; Suzuki, E.; Kojima-Shibata, C.; Suzuki, K.; Okamura, T.; Onodera, W.; Shibata, T.; Kano, H. Selection for resistance to swine mycoplasmal pneumonia over 5 generations in Landrace pigs. Livest Sci. 2012, 147, 20–26. [Google Scholar] [CrossRef]
- Ogawa, S.; Satoh, M. Random regression analysis of calving interval of Japanese Black cows. Animals 2021, 11, 202. [Google Scholar] [CrossRef] [PubMed]
- Zoda, A.; Urakawa, M.; Oono, Y.; Ogawa, S.; Satoh, M. Estimation of genetic parameters for superovulatory response traits in Japanese Black cows. J. Anim. Sci. 2021, 99, skab265. [Google Scholar] [CrossRef] [PubMed]
- Okamura, T.; Maeda, K.; Onodera, W.; Kadowaki, H.; Kojima-Shibata, C.; Suzuki, E.; Uenishi, H.; Satoh, M.; Suzuki, K. Correlated responses of respiratory disease and immune capacity traits of Landrace pigs selected for Mycoplasmal pneumonia of swine (MPS) lesion. Anim. Sci. J. 2016, 87, 1099–1105. [Google Scholar] [CrossRef] [PubMed]
- Ogawa, S.; Ohnishi, C.; Ishii, K.; Uemoto, Y.; Satoh, M. Genetic relationship between litter size traits at birth and body measurement and production traits in purebred Duroc pigs. Anim. Sci. J. 2020, 91, e13497. [Google Scholar] [CrossRef]
- Bottje, W.; Iqbal, M.; Tang, Z.X.; Cawthon, D.; Okimoto, R.; Wing, T.; Cooper, M. Association of mitochondrial function with feed efficiency within a single genetic line of male broilers. Poult. Sci. 2002, 81, 546–555. [Google Scholar] [CrossRef]
- Tsai, T.; John, J.C. The role of mitochondrial DNA copy number, variants, and haplotypes in farm animal developmental outcome. Domest. Anim. Endocrinol. 2016, 56, S133–S146. [Google Scholar] [CrossRef]
- Srirattana, K.; McCosker, K.; Schatz, T.; John, J.C. Cattle phenotypes can disguise their maternal ancestry. BMC Genet. 2017, 18, 59. [Google Scholar] [CrossRef] [Green Version]
- Darhan, H.; Zoda, A.; Kukusato, M.; Toyomizu, M.; Katoh, K.; Roh, S.; Ogawa, S.; Uemoto, Y.; Satoh, M.; Suzuki, K. Correlations between mitochondrial respiration activity and residual feed intake after divergent genetic selection for high- and low-oxygen consumption in mice. Anim. Sci. J. 2019, 90, 818–826. [Google Scholar] [CrossRef] [PubMed]
- Fortes, M.R.S.; Porto-Neto, L.R.; Satake, N.; Nguyen, L.T.; Freitas, A.C.; Melo, T.P.; Scalez, D.C.B.; Hayes, B.; Raidan, F.S.S.; Reverter, A.; et al. X chromosome variants are associated with male fertility traits in two bovine populations. Genet. Sel. Evol. 2020, 52, 46. [Google Scholar] [CrossRef] [PubMed]
- Meester, I.; Manilla-Muñoz, E.; León-Cachón, R.B.R.; Paniagua-Frausto, G.A.; Carrión-Alvarez, D.; Ruiz-Rodríguez, C.O.; Rodríguez-Rangel, Y.; García-Martínez, J.M. SeXY chromosomes and the immune system: Reflections after a comparative study. Biol. Sex Differ. 2020, 11, 3. [Google Scholar] [CrossRef] [PubMed] [Green Version]
- Gibson, J.P.; Freeman, A.E.; Boettcher, P.J. Cytoplasmic and mitochondrial inheritance of economic traits in cattle. Livest. Prod. Sci. 1997, 47, 115–124. [Google Scholar] [CrossRef]
- Yue, X.P.; Dechow, C.; Liu, W.S. A limited number of Y chromosome lineages is present in North American Holsteins. J. Dairy Sci. 2015, 98, 2738–2745. [Google Scholar] [CrossRef] [Green Version]
- Diaz, I.D.P.S.; de Camargo, G.M.F.; da Cruz, V.A.R.; Hermisdorff, I.C.; Carvalho, C.V.D.; de Albuquerque, L.G.; Costa, R.B. Effect of the X chromosome in genomic evaluations of reproductive traits in beef cattle. Anim. Reprod. Sci. 2021, 225, 106682. [Google Scholar] [CrossRef]
- Leroy, G.; Danchin-Burge, C.; Verrier, E. Impact of the use of cryobank samples in a selected cattle breed: A simulation study. Genet. Sel. Evol. 2011, 43, 36. [Google Scholar] [CrossRef] [Green Version]
- Doekes, H.P.; Veerkamp, R.F.; Bijma, P.; Hiemstra, S.J.; Windig, J. Value of the Dutch Holstein Friesian germplasm collection to increase genetic variability and improve genetic merit. J. Dairy Sci. 2018, 101, 10022–10033. [Google Scholar] [CrossRef] [Green Version]
- Eynard, S.E.; Windig, J.J.; Hulsegge, I.; Hiemstra, S.-J.; Calus, M.P.L. The impact of using old germplasm on genetic merit and diversity—A cattle breed case study. J. Anim. Breed. Genet. 2018, 135, 311–322. [Google Scholar] [CrossRef]
- Gibson, J.P.; Candiff, L.V. Developing straight breeding and crossbreeding structures for extensive grazing systems which utilize exotic animal genetic resources. In Developing Breeding Strategies for Lower Input Animal Production Environments; ICAR Technical Series; Galal, S., Boyazoglu, J., Hammond, K., Eds.; ICAR: Rome, Italy, 2000; Volume 3, pp. 207–242. [Google Scholar]
- Bolet, G.; Bidanel, J.P.; Olliver, L. Selection for litter size in pigs. II. Efficiency of closed and open selection lines. Genet. Sel. Evol. 2001, 33, 515. [Google Scholar] [CrossRef] [Green Version]
- Anderson, D.; Toma, R.; Negishi, Y.; Okuda, K.; Ishiniwa, H.; Hinton, T.G.; Nanba, K.; Tamate, H.B.; Kaneko, S. Mating of escaped domestic pigs with wild boar and possibility of their offspring migration after the Fukushima Daiichi Nuclear Power Plant accident. Sci. Rep. 2019, 9, 11537. [Google Scholar] [CrossRef] [PubMed] [Green Version]
- Takahashi, R. Detection of Inobuta from wild boar population in Japan by genetic analysis. Rev. Agric. Sci. 2018, 6, 61–71. [Google Scholar] [CrossRef] [Green Version]
- Anderson, D.; Negishi, Y.; Ishiniwa, H.; Okuda, K.; Hinton, T.G.; Toma, R.; Nagata, J.; Tamate, H.B.; Kaneko, S. Introgression dynamics from invasive pigs into wild boar following the March 2011 natural and anthropogenic disasters at Fukushima. Proc. R. Soc. B. 2020, 288, 20210874. [Google Scholar] [CrossRef] [PubMed]
- Wiener, G. Breed structure in the pedigree Ayrshire cattle population in Great Britain. J. Agric. Sci. 1953, 43, 123–130. [Google Scholar] [CrossRef]
- Vozzi, P.A.; Marcondes, C.R.; Magnabosco, C.U.; Bezerra, L.A.F.; Lôbo, R.B. Structure and genetic variability in Nellore (Bos indicus) cattle by pedigree analysis. Genet. Mol. Biol. 2006, 29, 482–485. [Google Scholar] [CrossRef] [Green Version]
- Carolino, N.; Vitorino, A.; Carolino, I.; Pais, J.; Henriques, N.; Silveira, M.; Vicente, A. Genetic diversity in the Portuguese Mertolenga cattle breed assessed by pedigree analysis. Animals 2020, 10, 1990. [Google Scholar] [CrossRef]
- Honda, T.; Nomura, T.; Yamaguchi, Y.; Mukai, F. Monitoring of genetic diversity in the Japanese Black cattle population by the use of pedigree information. J. Anim. Breed. Genet. 2004, 121, 242–252. [Google Scholar] [CrossRef] [Green Version]
- Honda, T.; Fujii, T.; Nomura, T.; Mukai, F. Evaluation of genetic diversity in Japanese Brown cattle population by pedigree analysis. J. Anim. Breed. Genet. 2006, 123, 172–179. [Google Scholar] [CrossRef] [Green Version]
- Uemoto, Y.; Suzuki, K.; Yasuda, J.; Roh, S.; Satoh, M. Evaluation of inbreeding and genetic diversity in Japanese Shorthorn cattle by pedigree analysis. Anim. Sci. J. 2021, 92, e13643. [Google Scholar] [CrossRef]
- Okamura, T. An R program for inbreeding coefficient, relationship coefficient, genetic rate of contribution. Jpn. J. Swine Sci. 2020, 57, 108–115. [Google Scholar] [CrossRef]
- Ohnishi, C.; Satoh, S. Estimation of genetic parameters for performance and body measurement traits in Duroc pigs selected for average daily gain, loin muscle area, and backfat thickness. Livest. Sci. 2018, 214, 161–166. [Google Scholar] [CrossRef]
- Yazaki, N.; Ogawa, S.; Ohnishi, C.; Ishii, K.; Uemoto, Y.; Satoh, M. Effectiveness of body measurement traits for improving production traits in Duroc pigs. Nihon Chikusan Gakkaiho 2020, 91, 9–16. [Google Scholar] [CrossRef]
- Nishida, A.; Shinohara, H.; Ohtomo, Y.; Suzuki, K. A method for evaluating the change in genetic constitution of pig line. Jpn. J. Swine Science 2005, 42, 34–36. [Google Scholar] [CrossRef] [Green Version]
- Nagai, K.; Takahashi, Y.; Nomura, K.; Furukawa, T. Calculation of inbreeding coefficient, relationship coefficient and genetic rate of contribution using spreadsheet software. Jpn. J. Swine Sci. 2015, 52, 29–36. [Google Scholar] [CrossRef] [Green Version]
- Fernando, R.L.; Grossman, M. Genetic evaluation with autosomal and X-chromosomal inheritance. Theor. Appl. Genet. 1990, 80, 75–80. [Google Scholar] [CrossRef]
- Ogawa, S.; Satoh, M. Relationship between litter size at birth and within-litter birth weight characteristics in laboratory mice as pilot animal for pig. Anim. Sci. J. 2020, 91, e13488. [Google Scholar] [CrossRef] [PubMed]
- MacCluer, J.W.; VandeBerg, J.L.; Read, B.; Ryder, O.A. Pedigree analysis by computer simulation. Zoo Biol. 1986, 5, 147–160. [Google Scholar] [CrossRef]
- Arishima, T.; Sasaki, S.; Isobe, T.; Ikebata, Y.; Shimbara, S.; Ikeda, S.; Kawashima, K.; Suzuki, Y.; Watanabe, M.; Sugano, S.; et al. Maternal variant in the upstream of FOXP3 gene on the X chromosome is associated with recurrent infertility in Japanese Black cattle. BMC Genet. 2017, 18, 103. [Google Scholar] [CrossRef] [Green Version]
- Acquaviva, L.; Boekuhout, M.; Karasu, M.E.; Brick, K.; Pratto, F.; Li, T.; van Overbeek, M.; Kauppi, L.; Camerini-Otero, R.D.; Jasin, M.; et al. Ensuring meiotic DNA break formation in the mouse pseudoautosomal region. Nature 2020, 582, 426–431. [Google Scholar] [CrossRef]
- Zhang, J.; Kadri, N.K.; Mullaart, E.; Spelman, R.; Fritz, S.; Boichard, D.; Charlier, C.; Georges, M.; Druet, T. Genetic architecture of individual variation in recombination rate on the X chromosome in cattle. Heredity 2020, 125, 304–316. [Google Scholar] [CrossRef]
- Quaas, R.L. Additive genetic model with groups and relationships. J. Dairy Sci. 1988, 71, 1338–1345. [Google Scholar] [CrossRef]
- Legarra, A.; Christensen, O.F.; Vitezica, Z.G.; Aguilar, I.; Misztal, I. Ancestral relationships using metafounders: Finite ancestral populations and across population relationships. Genetics 2015, 200, 455–468. [Google Scholar] [CrossRef] [PubMed] [Green Version]
- Nwogwugwu, C.P.; Kim, Y.; Chung, Y.J.; Jang, S.B.; Roh, S.H.; Kim, S.; Lee, J.H.; Choi, T.J.; Lee, S.H. Effect of errors in pedigree on the accuracy of estimated breeding value for carcass traits in Korean Hanwoo cattle. Asian-Australas. J. Anim. Sci. 2020, 33, 1057–1067. [Google Scholar] [CrossRef] [PubMed]
- Taniguchi, Y.; Matsuda, H.; Yamada, T.; Sugiyama, T.; Homma, K.; Kaneko, Y.; Yamagishi, S.; Iwaisaki, H. Genome-wide SNP and STR discovery in the Japanese Crested Ibis and genetic diversity among founders of the Japanese population. PLoS ONE 2013, 8, e72781. [Google Scholar] [CrossRef]
- Moore, K.; Vilela, C.; Kaseja, K.; Mrode, R.; Coffey, M. Forensic use of the genomic relationship matrix to validate and discover livestock pedigrees. J. Anim. Sci. 2019, 97, 35–42. [Google Scholar] [CrossRef]
- Eusebi, P.G.; Martinez, A.; Cortes, O. Genomic tools for effective conservation of livestock breed diversity. Diversity 2019, 12, 8. [Google Scholar] [CrossRef] [Green Version]
- Suezawa, R.; Nikadori, H.; Sasaki, S. Genetic diversity and genomic inbreeding in Japanese Black cows in the islands of Okinawa Prefecture evaluated using single-nucleotide polymorphism array. Anim. Sci. J. 2021, 92, e13525. [Google Scholar] [CrossRef]
- Zoda, A.; Ogawa, S.; Matsuda, H.; Taniguchi, Y.; Watanabe, T.; Sugimoto, Y.; Iwaisaki, H. Inferring genetic characteristics of Japanese Black cattle populations using genome-wide single nucleotide polymorphism markers. J. Anim. Genet. 2021, in press. [Google Scholar]
- Frank, S.A. Evolution: Mitochondrial burden on male health. Curr. Biol. 2012, 22, R797–R799. [Google Scholar] [CrossRef] [Green Version]
- Vaught, R.C.; Dowling, D.K. Maternal inheritance of mitochondria: Implications for male fertility? Reproduction 2018, 155, R159–R168. [Google Scholar] [CrossRef] [Green Version]
- Subrini, J.; Turner, J. Y chromosome functions in mammalian spermatogenesis. eLife 2021, 10, e67345. [Google Scholar] [CrossRef] [PubMed]
- Druet, T.; Legarra, A. Theoretical and empirical comparisons of expected and realized relationships for the X-chromosome. Genet. Sel. Evol. 2020, 52, 50. [Google Scholar] [CrossRef] [PubMed]
- Ghafouri-Kesbi, F.; Abbasi, M.A. Autosomal and X-linked additive genetic effects on body weight, body measurements and efficiency-related traits in sheep. Small Rumin. Res. 2019, 180, 21–26. [Google Scholar] [CrossRef]
- Noorian, M.; Joezy-Shekalgorabi, S.; Kashan, N.E.J. Analysis of X chromosome and autosomal genetic effects on growth and efficiency-related traits in sheep. Anim. Prod. Sci. 2020, 61, 363–370. [Google Scholar] [CrossRef]
- Latifi, M.; Naderi, Y.; Mortazavi, A.; Bohlouli, M.; Sadeghi, S. Variation in autosomal and sex-linked genetic effects for growth traits in Markhoz goat using multivariate animal models. Trop. Anim. Health Prod. 2020, 52, 2917–2923. [Google Scholar] [CrossRef]
- Meyer, K. Scope for estimation of variances due to sex-linked, maternal and dominance effects in mixed model analyses. Proc. Assoc. Advmt. Anim. Breed. Genet. 2007, 17, 407–410. [Google Scholar]
- Wittenburg, D.; Teuscher, F.; Reinsch, N. Statistical tools to detect genetic variation for a sex dimorphism in piglet birth weight. J. Anim. Sci. 2011, 89, 622–629. [Google Scholar] [CrossRef] [Green Version]
- Götherström, A.; Anderung, C.; Hellborg, L.; Elburg, R.; Smith, C.; Bradley, D.G.; Ellegren, H. Cattle domestication in the Near East was followed by hybridization with aurochs bulls in Europe. Proc. Royal Soc. B. 2005, 272, 2345–2351. [Google Scholar] [CrossRef] [Green Version]
- Wutke, S.; Sandoval-Castellanos, E.; Benecke, N.; Döhle, H.J.; Friederich, S.; Gonzalez, J.; Hofreiter, M.; Lõugas, L.; Magnell, O.; Malaspinas, A.S.; et al. Decline of genetic diversity in ancient domestic stallions in Europe. Sci. Adv. 2018, 4, eaap9691. [Google Scholar] [CrossRef] [Green Version]
- Jaton, C.; Koeck, A.; Sargolzaei, M.; Malchiodi, F.; Price, C.A.; Schenkel, F.S.; Miglior, F. Genetic analysis of superovulatory response of Holstein cows in Canada. J. Dairy Sci. 2016, 99, 3612–3623. [Google Scholar] [CrossRef] [Green Version]
- Parker Gaddis, K.L.; Dikmen, S.; Null, D.J.; Cole, J.B.; Hansen, P.J. Evaluation of genetic components in traits related to superovulation, in vitro fertilization, and embryo transfer in Holstein cattle. J. Dairy Sci. 2017, 100, 2877–2891. [Google Scholar] [CrossRef] [PubMed] [Green Version]
- Bouquet, A.; Sørensen, A.C.; Juga, J. Genomic selection strategies to optimize the use of multiple ovulation and embryo transfer schemes in dairy cattle breeding programs. Livest. Sci. 2015, 174, 18–25. [Google Scholar] [CrossRef]
- Thomasen, J.R.; Willam, A.; Egger-Danner, C.; Sørensen, A.C. Reproductive technologies combine well with genomic selection in dairy breeding programs. J. Dairy Sci. 2016, 99, 1331–1340. [Google Scholar] [CrossRef] [PubMed]
- Fujii, T.; Naito, A.; Hirayama, H.; Kashima, M.; Yoshino, H.; Hanamure, T.; Domon, Y.; Hayakawa, H.; Watanabe, T.; Moriyasu, S.; et al. Potential of preimplantation genomic selection for carcass traits in Japanese Black cattle. J. Reprod. Dev. 2019, 65, 251–258. [Google Scholar] [CrossRef] [PubMed] [Green Version]
- Gandini, G.; Pizzi, F.; Stella, A.; Boettcher, P.J. The costs of breed reconstruction from cryopreserved material in mammalian livestock species. Genet. Sel. Evol. 2007, 39, 465. [Google Scholar] [CrossRef]
- Fernández, J.; Meuwissen, T.H.E.; Toro, M.A.; Mäki-Tanila, A. Management of genetic diversity in small farm animal populations. Animal 2011, 5, 1684–1698. [Google Scholar] [CrossRef] [Green Version]
- Woelders, H.; Windig, J.; Hiemstra, S.J. How developments in cryobiology, reproductive technologies and conservation genomics could shape gene banking strategies for (farm) animals. Reprod. Domest. Anim. 2012, 47, 264–273. [Google Scholar] [CrossRef]
- Kameyama, K.; Nishi, T.; Yamada, M.; Masujin, K.; Morioka, K.; Kokuho, T.; Fukai, K. Experimental infection of pigs with a classical swine fever virus isolated in Japan for the first time in 26 years. J. Vet. Med. Sci. 2019, 81, 1277–1284. [Google Scholar] [CrossRef] [Green Version]
- Shimizu, Y.; Hayama, Y.; Murato, Y.; Sawai, K.; Yamaguchi, E.; Yamamoto, T. Epidemiology of classical swine fever in Japan—a descriptive analysis of the outbreaks in 2018–2019. Front. Vet. Sci. 2020, 7, 573480. [Google Scholar] [CrossRef]
- Shimizu, Y.; Hayama, Y.; Murato, Y.; Sawai, K.; Yamaguchi, E.; Yamamoto, T. Epidemiological analysis of classical swine fever in wild boars in Japan. BMC Vet. Res. 2021, 17, 188. [Google Scholar] [CrossRef]
- Sonesson, A.; Goddard, M.E.; Meuwissen, T.H.E. The use of frozen semen to minimize inbreeding in small populations. Genet. Res. Camb. 2002, 80, 27–30. [Google Scholar] [CrossRef] [PubMed] [Green Version]
- Boettcher, P.J.; Stella, A.; Pizzi, F.; Gandini, G. The combined use of embryos and semen for cryogenic conservation of mammalian livestock genetic resources. Genet. Sel. Evol. 2005, 37, 657. [Google Scholar] [CrossRef] [PubMed]
- Howard, J.G.; Lynch, C.; Santymire, R.M.; Marinari, P.E.; Wildt, D.E. Recovery of gene diversity using long-term cryopreserved spermatozoa and artificial insemination in the endangered black-footed ferret. Anim. Conserv. 2016, 19, 102–111. [Google Scholar] [CrossRef]
- Oyama, K.; Nojima, M.; Shojo, M.; Fukushima, M.; Anada, K.; Mukai, F. Effect of sire mating patterns on future genetic merit and inbreeding in a closed beef cattle population. J. Anim. Breed. Genet. 2007, 124, 73–80. [Google Scholar] [CrossRef] [Green Version]
- Heidaritabar, M.; Vereijken, A.; Muir, W.M.; Meuwissen, T.; Cheng, H.; Megens, H.-J.; Groenen, M.A.M.; Bastiaansen, J.W.M. Systematic differences in the response of genetic variation to pedigree and genome-based selection methods. Heredity 2014, 113, 503–513. [Google Scholar] [CrossRef] [Green Version]
- Gómez-Romano, F.; Villanueva, B.; Fernández, J.; Wooliams, J.A.; Pong-Wong, R. The use of genomic coancestry matrices in the optimisation of contributions to maintain genetic diversity at specific regions of the genome. Genet. Sel. Evol. 2016, 48, 2. [Google Scholar] [CrossRef] [Green Version]
Figure 1.
Concept of calculating average genetic contribution of individual I to a target population B, showing GCA as an example.
Figure 1.
Concept of calculating average genetic contribution of individual I to a target population B, showing GCA as an example.

Figure 2.
Concept of calculating weighted average of genetic contribution of individual I to a target population B, showing GCA* as an example.
Figure 2.
Concept of calculating weighted average of genetic contribution of individual I to a target population B, showing GCA* as an example.

Figure 3.
Comparison of average genetic contribution of 100 G1 mice to G8 (horizontal axis) and results of gene-dropping simulation (vertical axis) for genes on autosomes (a), X chromosome (b), Y chromosome (c), and mitochondrial DNA (d). Circle: 50 G1 male mice; triangle: 50 G1 female mice.
Figure 3.
Comparison of average genetic contribution of 100 G1 mice to G8 (horizontal axis) and results of gene-dropping simulation (vertical axis) for genes on autosomes (a), X chromosome (b), Y chromosome (c), and mitochondrial DNA (d). Circle: 50 G1 male mice; triangle: 50 G1 female mice.

Figure 4.
Distribution of the number of alleles of G1 mice inherited to G8 in gene-dropping simulation: (a) shows the histogram of the number of dropped alleles of autosomal genes of the G1 male with the highest GCAI,popB to G8, (b) shows the histogram of the number of dropped alleles of the G1 female with the highest GCAI,popB to G8, (c) shows the histogram of the number of dropped gene alleles on the X chromosome of the G1 male with the highest GCXI,popB to G8, and (d) shows the histogram of the number of dropped gene alleles on the X chromosome of the G1 female with the highest GCXI,popB to G8.

Figure 5.
Changes in values of coefficient of variation of the genetic contribution (CV). Circle: autosomes (CVA); triangle: X chromosome (CVX); square: Y chromosome (CVY); rhombus: mitochondrial DNA (CVM).
Figure 5.
Changes in values of coefficient of variation of the genetic contribution (CV). Circle: autosomes (CVA); triangle: X chromosome (CVX); square: Y chromosome (CVY); rhombus: mitochondrial DNA (CVM).

Figure 6.
Comparison of average genetic contributions of 100 G1 mice to G8: (a) shows the relationship between GCAI,popB and GCXI,popB, (b) shows the relationship between GCAI,popB and GCYI,popB, (c) shows the relationship between GCAI,popB and GCMI,popB, and (d) shows the relationship between GCXI,popB and GCMI,popB. Circle: average genetic contributions of 50 G1 male mice to G8; triangle: average genetic contributions of 50 G1 female mice to G8.


Table 1.
Pedigree data from Fernando and Grossman [56].
Table 1.
Pedigree data from Fernando and Grossman [56].
| Individual | Sex | Sire | Dam |
|---|---|---|---|
| 1 | Male | Unknown | Unknown |
| 2 | Female | Unknown | Unknown |
| 3 | Male | 1 | Unknown |
| 4 | Female | 1 | 2 |
| 5 | Male | 3 | 4 |
| 6 | Female | 1 | 4 |
| 7 | Male | 5 | 6 |
| 8 | Female | 5 | 6 |
Table 2.
Numbers of male and female mice in pedigree data from Ogawa and Satoh [57].
Table 2.
Numbers of male and female mice in pedigree data from Ogawa and Satoh [57].
| Generation | No. of Males | No. of Females | No. of Known Sires | No. of Known Dams |
|---|---|---|---|---|
| G1 | 50 | 50 | 0 | 0 |
| G2 | 186 | 173 | 46 | 46 |
| G3 | 248 | 249 | 124 | 124 |
| G4 | 149 | 146 | 95 | 95 |
| G5 | 174 | 171 | 112 | 112 |
| G6 | 158 | 154 | 103 | 103 |
| G7 | 151 | 156 | 100 | 100 |
| G8 | 151 | 152 | 101 | 101 |
| Total | 1267 | 1251 | 681 | 681 |
Table 3.
Values of genetic contributions of individual I to individual A (GCAI,A, GCXI,A, GCYI,A, and GCMI,A) in Table 1.
Table 3.
Values of genetic contributions of individual I to individual A (GCAI,A, GCXI,A, GCYI,A, and GCMI,A) in Table 1.
| I | A | |||||||||||||||
|---|---|---|---|---|---|---|---|---|---|---|---|---|---|---|---|---|
| 1 | 2 | 3 | 4 | 5 | 6 | 7 | 8 | 1 | 2 | 3 | 4 | 5 | 6 | 7 | 8 | |
| Autosomes (GCAI,A) | X chromosome (GCXI,A) | |||||||||||||||
| 1 | 1 | 0 | 0.5 | 0.5 | 0.5 | 0.75 | 0.625 | 0.625 | 1 | 0 | 0 | 0.5 | 0.5 | 0.75 | 0.75 | 0.625 |
| 2 | 0 | 1 | 0 | 0.5 | 0.25 | 0.25 | 0.25 | 0.25 | 0 | 1 | 0 | 0.5 | 0.5 | 0.25 | 0.25 | 0.375 |
| 3 | 0 | 0 | 1 | 0 | 0.5 | 0 | 0.25 | 0.25 | 0 | 0 | 1 | 0 | 0 | 0 | 0 | 0 |
| 4 | 0 | 0 | 0 | 1 | 0.5 | 0.5 | 0.5 | 0.5 | 0 | 0 | 0 | 1 | 1 | 0.5 | 0.5 | 0.75 |
| 5 | 0 | 0 | 0 | 0 | 1 | 0 | 0.5 | 0.5 | 0 | 0 | 0 | 0 | 1 | 0 | 0 | 0.5 |
| 6 | 0 | 0 | 0 | 0 | 0 | 1 | 0.5 | 0.5 | 0 | 0 | 0 | 0 | 0 | 1 | 1 | 0.5 |
| 7 | 0 | 0 | 0 | 0 | 0 | 0 | 1 | 0 | 0 | 0 | 0 | 0 | 0 | 0 | 1 | 0 |
| 8 | 0 | 0 | 0 | 0 | 0 | 0 | 0 | 1 | 0 | 0 | 0 | 0 | 0 | 0 | 0 | 1 |
| Y chromosome (GCYI,A) | Mitochondrial DNA (GCMI,A) | |||||||||||||||
| 1 | 1 | 0 | 1 | 0 | 1 | 0 | 1 | 0 | 1 | 0 | 0 | 0 | 0 | 0 | 0 | 0 |
| 2 | 0 | 0 | 0 | 0 | 0 | 0 | 0 | 0 | 0 | 1 | 0 | 1 | 1 | 1 | 1 | 1 |
| 3 | 0 | 0 | 1 | 0 | 1 | 0 | 1 | 0 | 0 | 0 | 1 | 0 | 0 | 0 | 0 | 0 |
| 4 | 0 | 0 | 0 | 0 | 0 | 0 | 0 | 0 | 0 | 0 | 0 | 1 | 1 | 1 | 1 | 1 |
| 5 | 0 | 0 | 0 | 0 | 1 | 0 | 1 | 0 | 0 | 0 | 0 | 0 | 1 | 0 | 0 | 0 |
| 6 | 0 | 0 | 0 | 0 | 0 | 0 | 0 | 0 | 0 | 0 | 0 | 0 | 0 | 1 | 1 | 1 |
| 7 | 0 | 0 | 0 | 0 | 0 | 0 | 1 | 0 | 0 | 0 | 0 | 0 | 0 | 0 | 1 | 0 |
| 8 | 0 | 0 | 0 | 0 | 0 | 0 | 0 | 0 | 0 | 0 | 0 | 0 | 0 | 0 | 0 | 1 |
Table 4.
Effects of pedigree errors (RMSE × 103) on calculating the average genetic contributions to G8 1.
Table 4.
Effects of pedigree errors (RMSE × 103) on calculating the average genetic contributions to G8 1.
| Error Rate | GCAI,popB | GCXI,popB | GCYI,popB | GCMI,popB | ||||||||||||
|---|---|---|---|---|---|---|---|---|---|---|---|---|---|---|---|---|
| Mean | SD | Min | Max | Mean | SD | Min | Max | Mean | SD | Min | Max | Mean | SD | Min | Max | |
| 1% | 1.07 | 0.23 | 0.37 | 2.20 | 1.57 | 0.40 | 0.47 | 3.18 | 6.74 | 2.95 | 0 | 19.06 | 6.58 | 3.34 | 0 | 24.27 |
| 2% | 1.53 | 0.24 | 0.74 | 2.56 | 2.25 | 0.42 | 0.89 | 4.07 | 9.88 | 3.09 | 1.87 | 23.80 | 9.79 | 3.62 | 1.14 | 27.40 |
| 4% | 2.14 | 0.27 | 1.16 | 3.27 | 3.17 | 0.46 | 1.61 | 5.04 | 14.00 | 3.18 | 3.50 | 26.85 | 14.07 | 3.81 | 3.85 | 30.88 |
| 8% | 2.97 | 0.31 | 1.87 | 4.31 | 4.41 | 0.50 | 2.81 | 6.60 | 19.53 | 3.36 | 7.25 | 34.08 | 19.73 | 3.90 | 8.08 | 36.12 |
| 16% | 4.02 | 0.36 | 2.69 | 5.39 | 5.97 | 0.59 | 3.98 | 8.31 | 26.23 | 3.66 | 13.64 | 42.57 | 26.69 | 3.95 | 13.32 | 42.15 |
1 GCAI,popB, GCXI,popB, GCYI,popB, and GCMI,popB average genetic contribution of individual I to target population B with respect to genes on autosomes, X chromosome, Y chromosome, and mitochondrial DNA, respectively. SD: standard deviation; Min: minimum value; Max: maximum value.
Publisher’s Note: MDPI stays neutral with regard to jurisdictional claims in published maps and institutional affiliations. |
© 2022 by the authors. Licensee MDPI, Basel, Switzerland. This article is an open access article distributed under the terms and conditions of the Creative Commons Attribution (CC BY) license (https://creativecommons.org/licenses/by/4.0/).
Share and Cite
MDPI and ACS Style
Ogawa, S.; Satoh, M. Genetic Contributions of Genes on Sex Chromosomes and Mitochondrial DNA in a Pedigreed Population. Diversity 2022, 14, 142. https://0-doi-org.brum.beds.ac.uk/10.3390/d14020142
AMA Style
Ogawa S, Satoh M. Genetic Contributions of Genes on Sex Chromosomes and Mitochondrial DNA in a Pedigreed Population. Diversity. 2022; 14(2):142. https://0-doi-org.brum.beds.ac.uk/10.3390/d14020142
Chicago/Turabian StyleOgawa, Shinichiro, and Masahiro Satoh. 2022. "Genetic Contributions of Genes on Sex Chromosomes and Mitochondrial DNA in a Pedigreed Population" Diversity 14, no. 2: 142. https://0-doi-org.brum.beds.ac.uk/10.3390/d14020142
Note that from the first issue of 2016, this journal uses article numbers instead of page numbers. See further details here.