
Population Genetic Structure and Biodiversity Conservation of a Relict and Medicinal Subshrub Capparis spinosa in Arid Central Asia


State Key Laboratory of Desert and Oasis Ecology, Xinjiang Institute of Ecology and Geography, Chinese Academy of Sciences, Urumqi 830011, China
*
Author to whom correspondence should be addressed.
Diversity 2022, 14(2), 146; https://0-doi-org.brum.beds.ac.uk/10.3390/d14020146
Submission received: 24 November 2021
/
Revised: 10 February 2022
/
Accepted: 14 February 2022
/
Published: 17 February 2022
(This article belongs to the Special Issue Ecology, Evolution and Diversity of Plants)
Abstract
:As a Tertiary Tethyan relict, Capparis spinosa is a typical wind-preventing and sand-fixing deciduous subshrub in arid central Asia. Due to its medicinal and energy value, this species is at risk of potential threat from human overexploitation, habitat destruction and resource depletion. In this study, our purpose was to evaluate the conservation strategies of C. spinosa according to its genetic structure characteristics and genetic diversity pattern among 37 natural distributional populations. Based on genomic SNP data generated from dd-RAD sequencing, genetic diversity analysis, principal component analysis, maximum likelihood phylogenetic trees and ADMIXTURE clustering, the significant population structure and differentiation were explored. The results showed the following: (1) Six distinct lineages were identified corresponding to geographic locations, and various levels of genetic diversity existed among the lineages for the natural habitat heterogeneity or human interferences; (2) The lineage divergences were influenced by isolation by distances, vicariance and restricted gene flow under complex topographic and climatic conditions. Finally, for the preservation of the genetic integrity of C. spinosa, we suggest that conservation units should be established corresponding to different geographic groups, and that attention should be paid to isolated and peripheral populations that are experiencing biodiversity loss. Simultaneously, monitoring and reducing anthropogenic disturbances in addition to rationally and sustainably utilizing wild resources would be beneficial to guarantee population resilience and evolutionary potential of this xerophyte in response to future environmental changes.
1. Introduction
Arid central Asia is deemed to be the largest arid region in the temperate zones of the northern hemisphere and even the world [1]. The floristic compositions here are mostly descended from Tethyan xerophytic vegetation flora and have been phenoecological plant taxa shaped by the long-term continental–arid desert climate [2,3]. Because of the specific geomorphologic landscapes comprising the vertical and horizontal convergence of several major Asian tectonic mountains (Himalayas, Karakoram, Kunlun and Tianshan Mountains) and plateaus (Pamirs and Tibet Plateau), as well as the mosaic distribution of many large basins (Tarim, Turpan-Hami and Junggar basins) and deserts (Taklimakan, Kumtag and Gurbantunggut deserts), the monsoon current and moisture from the Indian and Pacific Oceans have been blocked and intercepted, and the amount of precipitation is low and unevenly distributed, which has constituted the complexity of the extreme geographic and climatic conditions, consequently forming a very fragile ecological environment [1]. The types of vegetation are relatively sparse and simple in this region. To adapt to environment variability, desert species from oligotypic genera and a monotypic genus with drought resistance and barren tolerance have mainly occurred and been discontinuously distributed [2,4,5]. It is speculated that the formation of this pattern is the result of intense orogeny during the geological period, coupled with extensive Quaternary glaciation, as well as the long-term process of aridification in central Asia [5,6,7]. Most xerophytic plants have exerted their advantages in the maintenance and restoration of desert vegetation ecosystems [8]. Given this, scientists and departments of environmental protection have paid increasing attention to studying and persisting the complex and unique community structure characteristics, as well as the vegetation diversification pattern in arid central Asia in recent years [9,10,11].
Capparis spinosa L. is considered to be a relict taxon that originated from arid Tethyan flora during the middle to late Tertiary [3,4]. It is widely distributed in southern Europe, northern Africa, western and southern Asia in addition to arid central Asia. The family, Capparaceae, to which it belongs, currently has polytypic genera mostly in the tropics and subtropics [12], with oligotypic genera in the transitional regions from western to central Asia, but a residual monotypic genus (C. spinosa) remains in eastern central Asia (arid region of western China) [13,14]. In arid central Asia, its natural populations inhabit heterogeneous quality landscapes with higher desert plateaus, mid-altitudinal warm dry valleys or proluvial fans and lower desert basins (Figure 1). As a representative xerophyte in desert regions, its perennial plants have shown excellent ecological value in terms of wind prevention, sand fixation and water as well as soil preservation [8]. However, due to its commercial and economic value in view of its medicinal and oil-bearing fruits and seeds [8], this wild subshrub has been suffering from long-term over-exploitation, such as excessive harvesting and grazing, without being reasonably and effectively protected, combined with complex natural habitat isolation, agricultural reclamation and industrial pollution, putting it under multiple pressures, resulting in range shrinkage with concomitant local biodiversity loss. Hence, to avoid the hidden danger of resource exhaustion or even the verge of extinction, it is urgent to formulate appropriate conservation strategies to reduce resource plundering and habitat destruction caused by anthropogenic activity.
A number of previous studies have hitherto been carried out on the genetic variation and diversity of C. spinosa [15,16,17,18,19,20,21]. Earlier on, scholars mainly devoted their efforts to morphological taxonomy and subspecies or variety identification [15,16,17]. In recent years, with the development of molecular marker technology, researchers have achieved certain advancements in intraspecific diversity and infraspecific differentiation by virtue of methodologies such as RAPD, AFLP, ISSR, IRAP and EST-SSR [18,19,20,21]. Nonetheless, most of these studies have focused on Mediterranean coastal regions with a subtropical dry summer climate. However, the relict wild populations remaining in arid central Asia, dominated by a temperate continental desert climate, have been shown a lack of concern. Valuable information on the genetic structure and diversity conservation of C. spinosa in this region is relatively scarce and is of significant biogeographical and conservation interest to phytologists in the fields of plant genetic diversity and biodiversity conservation.
The conservation of genetic diversity is of great importance to the maintenance of biological species and ecosystem diversification, which provides a crucial foundation for the survival and development of species and enhances their long-term adaptive evolution to environmental changes, reducing the risk of extinction [22,23,24]. The evaluation of levels of genetic diversity based on integrated population structures is a critical prerequisite for species protection [25]. For source-sink metapopulations of terrestrial plants, the genetic structures and divergences are not only dominated by their own species and population characteristics, such as growth rates, effective population sizes and dispersal capacities, but are also closely related to their demographic responses to external spatial and temporal variability of environment [26,27]. Drivers of isolation by distances (IBD), vicariance and landscape heterogeneity influence the species’ evolutionary processes (genetic drift effects, gene exchanges, natural selection and local adaptation), thereby determining the genetic diversity patterns of metapopulations [28,29]. Human disturbance is also a contributory external factor influencing biodiversity. Since the beginning of the Anthropocene in the latter part of the 18th century, hazards of wild habitat destruction and loss caused by expansions in the range of anthropogenic activities have been becoming increasingly serious [30,31]. Under the background of global environmental and climatic changes, mankind’s excessive pursuits of economic benefits are causing the growing reduction in biological resources, the extinction of species and populations, as well as the modification of natural landscapes [32]. Notably for small-scale isolated or peripheral populations, due to lack of connectivity with source populations, they are particularly prone to genetic depletion through genetic drift and inbreeding [33], whereas anthropogenic interference undoubtedly further weakens their fitness, decreasing survivorship and reproduction, and increasing extinction risks [34]. Therefore, research on and the protection of these sink populations are considered to be essential for maintaining the genetic integrity of large-scale metapopulations. Hitherto, the conservation of genetic resources has mainly focused on native or endemic rare and endangered species in global biodiversity hotspots, such as the Andes Mountains, Mediterranean Basin, eastern Himalayas and Hengduan Mountains in the tropics and subtropics [35,36,37,38]. However, some widespread natural resources, typically with medicinal or economic value, experiencing diversity reduction in temperate arid regions have not been sufficiently recognized and effectively protected [39]. If this continues, these species would not escape from the hidden dangers of resource exhaustion or even extinction.
Compared with traditional molecular genetic markers, genome-wide single-nucleotide polymorphisms (SNPs) have the characteristics of higher genotyping efficiency and data quality, analytical simplicity, broader genome coverage and sheer abundance, as well as advantages in further analyzing complex population structures and distinguishing the evolutionary relationship of genetic polymorphisms [40,41]. In recent years, they have been increasingly widely applied in research fields of phylogenetics, molecular ecology, conservation genetics and biogeography [41,42,43]. As a high-efficiency next-generation high-throughput sequencing technology (NGS) that has been developed and commonly used, restriction-site-associated DNA sequencing (RAD-Seq) can rapidly identify and score high-resolution SNP data from thousands of orthologous sites, while reducing the complexity of genomic sequences, even in the absence of reference genomes [44,45], becoming one of the main effective methods to address critical issues in the fields of evolution and genetics at the genomic level [46], especially for studies of species groups with ancient origins and complex evolutionary and genetic structures [47,48].
In the present study, for the first time, we used the SNP marker from dd-RAD sequencing, ADMIXTURE clustering, principal component analysis (PCoA) and maximum likelihood (ML) phylogenetic analysis methods to fully explore the integrated genetic diversity mechanisms and conservation significance of C. spinosa across large-scale environmental gradients in arid central Asia, based on spatial source-sink theory of metapopulation dynamics. Thus, we aimed to: (1) elucidate the population structure and intraspecific divergence of the lineages of this species; (2) to adequately reveal the spatial pattern of genetic diversity among identified geographical groups and, accordingly, formulate feasible conservation strategies for maintaining the genetic integrity and population resilience of this xerophytic subshrub; and (3) to provide a referential understanding for future research on the diversity conservation of relict plants in arid regions.
2. Materials and Methods
2.1. Sampling, DNA Extraction and dd-RAD Library Construction
We located and collected a total of 37 natural populations (5–12 individuals for each population) of C. spinosa in arid central Asia during 2019–2020 (Figure 2, Table S1), according to the distribution described in Flora of China, Flora Xinjiangensis and Flora of Tibet as references [12,13,14]. The sampling spacing was at least 100 m between the neighboring individuals within each population. We also collected Capparis erythrocarpos Isert (northeastern Kenya, Africa) and Capparis bodinieri Lévl. (Xishuangbanna, China) as outgroups for the subsequent phylogenetic analysis. Total genomic DNA was extracted from silica-dried leaf tissues using a DNeasy Plant Mini Kit (Qiagen, Valencia, CA, USA), following the manufacturer’s protocol. The cleaned DNA had previously conducted simulated double digestion with 15 combinations among seven common or rare restriction enzymes to predict enzyme cutting sites (Table S2). Considering the yielded tag numbers and average sequencing depths, we finally selected the optimal combination of BfaI (5′-C↓TAG-3′) and DpnII (5′-↓GATC-3′) (New England Biolabs, Ipswich, MA, USA) to construct the dd-RAD library, following a modified approach of Peterson et al. [45]. The library with an inserted fragment between 200 and 600 bp was recovered for sequencing. All the qualified samples’ sequencing was performed on the Illumina Hiseq X Ten platform (Illumina, San Diego, CA, USA) with paired-end reads of 2 × 150 bp in length. Library preparation and sequencing were performed by Shanghai Personalbio Biotechnology Co., Ltd.
2.2. Data Processing and SNP Calling
Raw data produced by Illumina were processed to yield RAD tags and to obtain SNPs using the Stacks v1.4.8 program [49]. Initially, paired-end reads were cleaned and filtered for quality control and then trimmed to 140 bp × 2 in length using the process_radtags module. Individuals with sufficient RAD tags and coverage depth were used for SNP calling. Since there were no available reference genome data for C. spinosa, we next chose the ustack module to assemble reads per individual into RAD tags following the protocol of de novo workflow [49]. To remove high-repetitive stacks via a deleveraging algorithm, we set coverage depth to at least m = 3, the maximum distance allowed between stacks as M = 2 and the maximum number of mismatches allowed between loci as n = 1. Then, we combined the consensus loci among all 263 samples to build a catalog file in a cstacks module and aligned each loci sequence with the catalog to generate alleles in an sstacks module. Finally, filtered SNP matrices were identified and exported using a populations module, where the optimal operation parameters were set as follows: complete degree > 0.5 (individuals where the same RAD locus was detected accounted for at least 50% of each population), minor allele frequency (MAF) > 0.05 and minimum stack depth m = 4, p = 100 (one locus appeared in at least 100 populations). Based on the above calculations, the resulting high-quality SNP dataset was used for further analysis.
2.3. Genetic Structure Analysis
Population genetic structure, phylogenetic analysis and principal component analysis (PCoA) were comprehensively considered to evaluate the spatial distribution pattern of genetic variation. We performed a maximum likelihood estimation to analyze the genetic structure of C. spinosa using the ADMIXTURE program, version 1.3.0 [50], in order to identify the group clustering of each individual based on unlinked SNP datasets via a block relaxation algorithm. When the numbers of grouping (K value) were preset as 1 ≤ K ≤ 10, ten replicated runs were implemented in ADMIXTURE to compute the mean cross-validation (CV) error for each K. The optimal K value was determined in conditions of the lowest CV error. For the analysis of phylogenetic relationships, we then reconstructed a maximum likelihood (ML) tree based on the unlinked genomic SNPs among these 263 individuals using the PhyML program, version 3.0 [51]. Capparis erythrocarpos Isert and Capparis bodinieri Lévl were chosen as the outgroups to root the tree. After the tree topology with maximum likelihood was established, the reliability of the branches was verified through a bootstrap (BP) with 1000 replications. Lastly, principal component analysis (PCoA) was performed to exhibit the first two axes of population variation in the species using GCTA software, version 1.93.2 [52]. After removing SNPs with MAF values of less than 0.05, genomic SNP data of different individuals were formed into a genetic matrix where the feature vectors that made a major contribution to variance were extracted, and then a scatter plot was drawn using the first two of the eigenvectors. According to the distribution characteristics of the principal components, the clustering relationship of individuals could be inferred.
2.4. Genetic Diversity and IBD Analysis
Based on the results of genetic grouping, population genetic statistics, including observed heterozygosity (Ho), expected heterozygosity (He), nucleotide diversity (Pi) and inbreeding coefficient (FIS), were computed using the populations command in the Stacks v1.4.8 package [49] at the group and population levels of the species. Degrees of deviations from the Hardy–Weinberg equilibrium were measured for all 37 populations. Hierarchical AMOVA (analysis of molecular variance) in the ARLEQUIN version 3.5.2.2 program was used to classify the total genetic variation partitioning within and across groups by calculating the evolutionary distance between alleles or genotypes [53]. Pairwise genetic differentiation indices (FST) among populations were also calculated in the populations module in the Stacks. Additionally, the significance of isolation by distance (IBD) was further tested to compare Pearson’s correlation between the genetic distance (FST) matrix and geographic distances matrix among these 37 populations using the cor.test function in the R v3.3.3 package [54].
3. Results
3.1. SNPs from dd-RAD Analysis of C. spinosa
A total of 263 C. spinosa individuals from 37 populations were sequenced using the dd-RAD library construction methodology. Both the base content and quality distribution across all the sequences were uniform and optimal, considering that the average proportion of bases whose recognition accuracy exceeded 99.9% (Q30) was greater than 90% and that the peak value was around Q36. The numbers of raw reads for each sample ranged from 6,455,458 to 26,065,222. After filtering out low-quality reads, the numbers of high-quality reads ranged from 5,995,376 to 24,640,428, and the mapping rate ranged from 90.24% to 97.98%. According to the clustering algorithm through the Stacks procedure, the obtained tag number per sample ranged from 247,350 to 823,581, and the average depth of sequencing was from 10× to 31×. Via mutation spectrum analysis, C:G > T:A and T:A > C:G account for the overwhelming majority of mutation types of SNPs (Figure S1). The final dataset, which contained 559,586 high-integrity SNPs, could be used for the subsequent population genetics analyses.
3.2. Population Genetic Structure of C. spinosa
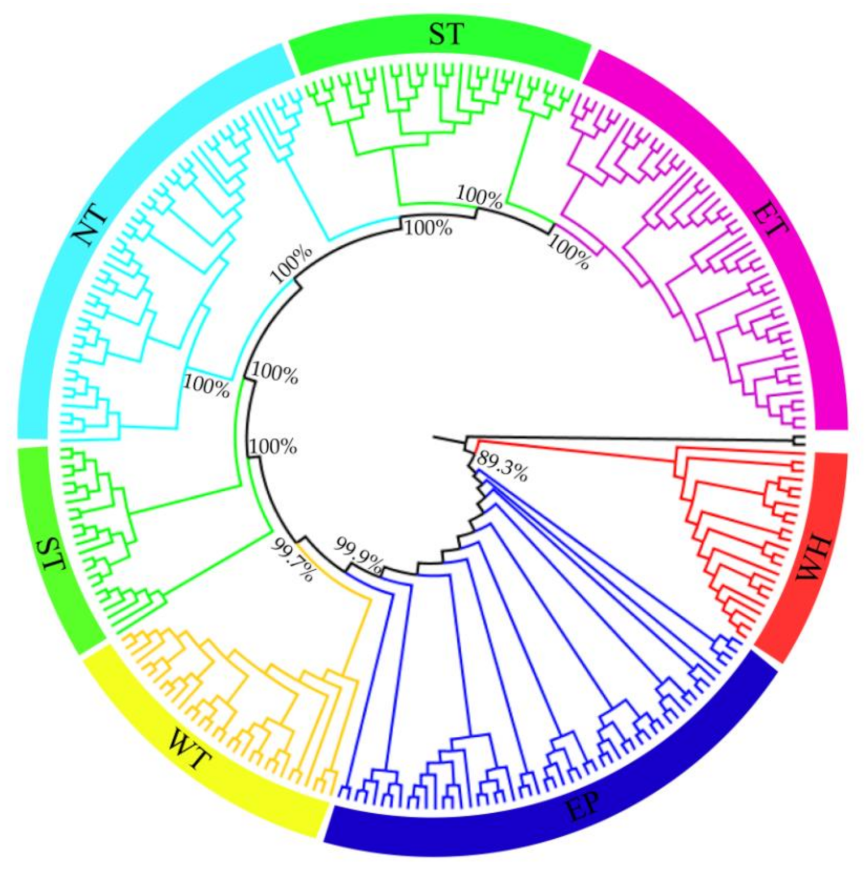
The ADMIXTURE analysis showed that, when K = 6, the minimal value of the cross-validation (CV) error was detected (Figure S2), indicating that the best-fit number of genetic groupings of C. spinoca was six: (1) group WH (C01-C03, western Himalayas); (2) group EP (C04-C10, eastern Pamirs); (3) group WT (K01, K02, U01, U02, T01, C30-C32, western Tianshan Mountains); (4) group ST (C11-C17, the southern foothills of Tianshan); (5) group NT (C24-C29, the northern piedmont of Tianshan); and (6) group ET (C18-C23, eastern Tianshan) (Figure 2 and Figure 3, Table S1). This pattern of population genetic structure was also supported by the topological relationship of the ML phylogenetic tree, with the main nodal bootstrap values exceeding 89.3% at the intraspecific level (Figure 4). Populations from group WH (red) always diverged first from all other populations, whether in the ADMIXTURE clustering or in the phylogenetic tree (Figure 3 and Figure 4). Then, group EP (blue) branched off, followed by group WT (yellow) and group ST (green). Group NT (azure) was nested within group ST, and populations from group ET (purple) formed one clade (Figure 4).
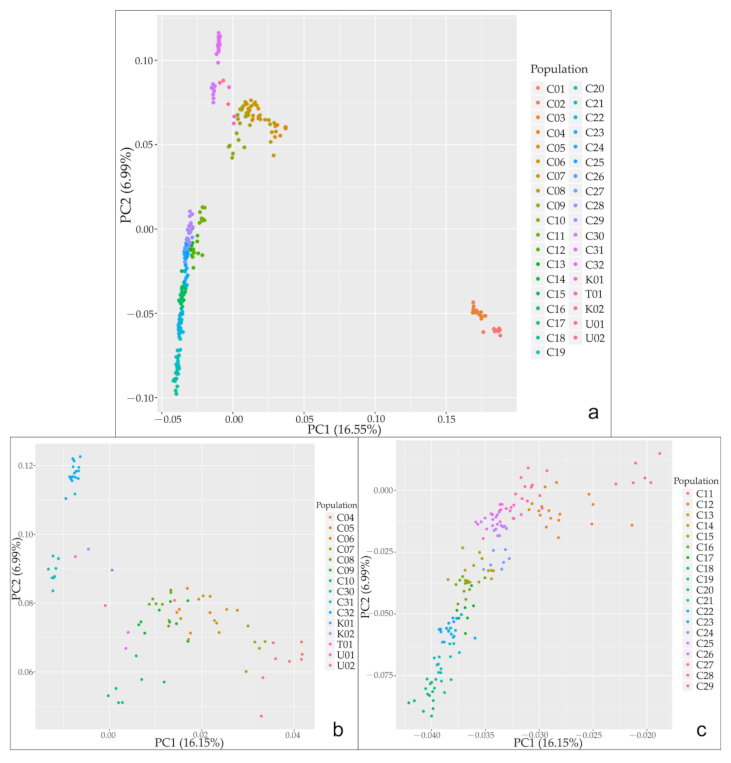
The first two coordinate axes of PCoA identified three major clusters, and corresponding principal components explained 16.55% (PC1) and 6.99% (PC2) of the total genetic variation, respectively (Figure 5a). Considering the preliminary results, group WH formed the first cluster, which was completely separated from the rest of the groups; group EP and group WT were generally merged into the second cluster; and group ST, group NT and group ET were broadly integrated into the third cluster. Then, we conducted further PCoA analyses on the latter two clusters, separately. The substructure within the second cluster showed that group EP was gradually split from group WT, with 16.15% (PC1) and 6.99% (PC2) of the total variation (Figure 5b). The substructure within the third cluster showed that populations in groups ST, NT and ET were mostly divided from each other (PC1, 16.15% vs. PC2, 6.99%), whereas admixed populations crossed among them (Figure 5c), which was also evident in the ADMIXTURE diagram (Figure 3).
3.3. Genetic Diversity Pattern and IBD
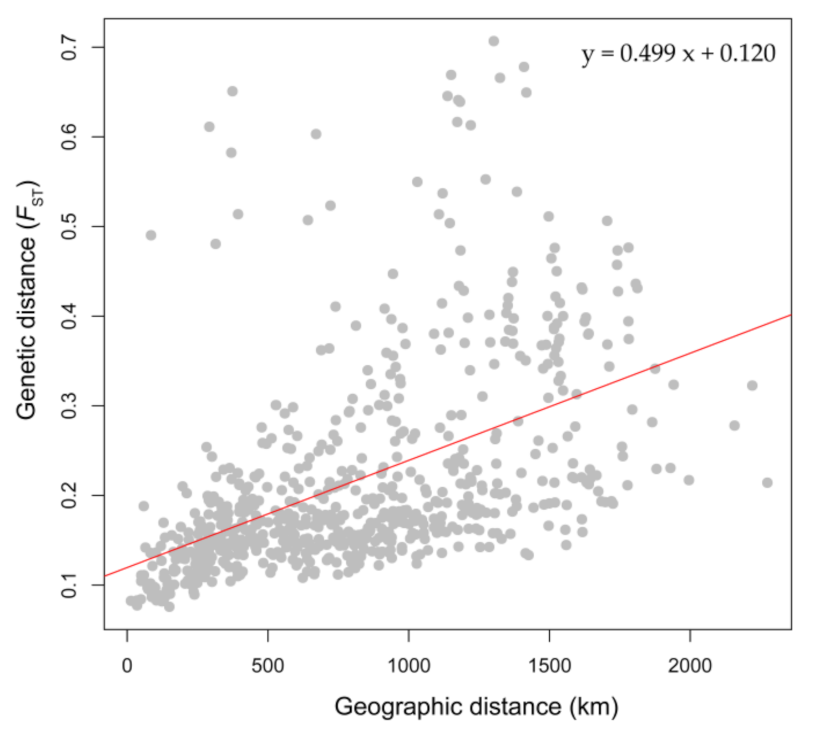
The results of the genetic diversity analysis showed that the overall genetic diversity among geographical groups was ranked as follows: EP > ST > NT > WT > ET > WH, which exhibited distinct differences in various degrees (Table 1). At the population level, the maximum observed heterozygosity (Ho), expected heterozygosity (He) and nucleotide diversity indices (Pi) were in Manas (C26) and Jiashi (C10), while the minimum Ho, He and He values were in Zabrang (C01) (Table 1). Inbreeding coefficients (FIS) that measured degrees of deviation from the Hardy–Weinberg equilibrium were positive for all 37 populations. The results of the AMOVA showed that the percentage of variation among the six geographical groups was relatively low; the variation was mainly from individuals within the populations, and the variation rate across populations within groups was the lowest (Table 2). Significant genetic differentiation existed among geographic populations (Figure S3, Table S3), with FST values on a scale from 0.076 to 0.707 (Table S3). The maximum genetic differentiation was detected between C02 (Sarang population) and K01 (Bishkek population) (FST = 0.707), while the minimum genetic differentiation existed between C27 (Shihezi population) and C29 (Wusu population) (FST = 0.076) (Table S3). Nei’s genetic distance was roughly synchronous with pairwise FST between populations (Figure S3). Furthermore, the result of isolation by distance (IBD) analysis displayed a considerable correlated pattern between genetic divergence and geographical distance among these 37 populations, given that the two-tailed test of the Pearson correlation coefficient was of significance (r = 0.499, p < 0.001) (Figure 6).
4. Discussion
4.1. Relationships between Genetic Structure, Lineage Differentiation and Geographic Distribution
In this study, we obtained a clear genetic structure of C. spinosa through RAD-seq and identified six clustering results corresponding to geographic locations (Figure 2 and Figure 3, Table S1). For this Tertiary relic plant, the effects of isolation by distance and vicariance has caused long-term shaping of local ecological environments, which had a profound influence on population structure and lineage differentiation among different geographic units. It is speculated that the formation of this disjunction is the result of intense and frequent orogeny during the geological period, coupled with extensive Quaternary glaciation, as well as the long-term process of aridification in central Asia [5,6,7]. The allopatric divergence and local adaptive evolution among distant geographical groups, especially for the isolated populations, are probably attributed to the incapability of long-distance genetic exchange and being hindered by mountains and immense deserts. Similar disjunctive or fragmented population structure patterns have also been reported in other Tethyan relicts that occur in this area, such as Gymnocarpos przewalskii, Amygdalus mongolica and Ammopiptanthus, owing to the influence of long-term aridification [9,10,11]. The constantly extended deserts and climatic changes have led to the fragmentation and separation of suitable habitats for those xerophytic taxa, thereby restricting the migration among distant geographic populations [55].
The relatively isolated populations distributed in the northern piedmont of the western Himalayas (Group WH, C01–C03) have the maximum genetic distance from other populations. Plant taxon located in this desert plateau region is related to the sub-frigid arid climate, precipitous terrain and topography, as well as abnormally barren soil conditions (Figure 1a). Due to the complex and discontinuous natural environment, the sink populations here, to a certain extent, are differentiated by hereditary and habitat variability. Compared to populations distributed at high altitudes, populations in medium-altitudinal valleys and low-altitudinal desert basins have different habitat requirements (Figure 1). Among the eastern Pamir region and the southern piedmonts of the Tianshan Mountains, we found that population structures were associated with spatial geographic distribution, as well as heterogeneous environments [29]. For instance, the Jiashi population (C10) is geographically nearby the Kalpin (C12) and Tumxuk (C11) populations, but due to the hereditary differences and landscape heterogeneity (gravel Gobi vs. dried clay desert) they belong, respectively, to group EP and group ST, although some of the mixed genotypes were found in these divergent populations (Figure 3). On the contrary, according to research results from Mims et al. (2016), among populations within the same geographic unit, the habitat preferences are of continuity and similarity, where high degree of gene flow could exist among them in a relatively flatter and more expansive range [56]. For example, source populations that inhabit piedmont proluvial fans on the southern side of the Tianshan Mountains (Group ST, C11–C17) are more closely distributed, and the connectivity of high-quality breeding habitats may play a role in facilitating closer reduced genetic distance between these populations.
4.2. Genetic Diversity Pattern of Species Metapopulations
The genetic diversity of C. spinosa (Pi = 0.2644) (Table 1) through RAD-seq is higher than that of other relic species (such as Euptelea pleiosperma and Gymnocarpos przewalskii) [11,48] because widespread species have a higher genetic diversity than species with endemic distribution. The total diversity index in arid central Asia is also different from that obtained by previous research using AFLP, RAPD and EST-SSR for C. spinosa in the Mediterranean coast (southern Europe, north Africa and west Asia) [18,20,21]. The primary reasons may be the different systematic molecular markers and the varying regional environments and weather conditions. In the arid region of central Asia, the distribution of C. spinosa covers most of the mountain piedmont, warm dry valley and Gobi desert terrains. Based on the results of SNPs, the range of this species is divided into six geographic groups with various levels of genetic diversity, indicating the levels of geographic isolation and environment gradients. According to the observed heterozygosity, the genetic diversity of source populations in groups ST and NT remained at relatively high and stable levels (Table 1), indicating that populations within these two groups are both likely to have experienced long-term migration of gene flow. In these geographic units, the high-quality piedmont alluvial or diluvial fan habitats are usually continuous, which is likely conducive to maintaining a high level of genetic diversity throughout these regions. In contrast, sink populations in group WH (western Himalayas) inhabit low-quality desert plateaus with high altitudes and low temperatures, especially the isolated Zabrang population (C01) with lowest genetic diversity (Table 1) adjacent to the middle reaches of the Sutlej River Basin, which grows on steep rocky slopes and seems a bit far away from the water source (Figure 1a); even worse, natural disasters, such as landslides and mudslides, occur frequently during the annual flowering and fruiting phases. In addition, because of insufficient visits by pollinators, inbreeding or self-breeding dominate the reproduction of C. spinosa under this situation, resulting in significant population depression (current effective size of <50 individuals). Many previous studies have demonstrated that, in nature, isolated populations with smaller effective sizes often have more genetic depletion and extinction risks due to genetic drift and inbreeding, which are, to a large extent, disadvantageous to the persistence of population diversity [57,58]. In the process of evolutionary history, the Zabrang population survives in a separate habitat but has not adapted to the extreme environment, which may be one of the reasons why its population scale is declining and even endangered. Nevertheless, it is noteworthy that the Taxkorgan (C04, 2855 m alt) and Akto (C05, 2845 m alt) populations, which are also located at high altitudes, could maintain certain high levels of genetic diversity because they are not completely isolated in the eastern Pamirs region (group EP). These populations have continuous extension and buffer along the descending elevation gradients, and they also have a certain degree of gene exchange with the Yegisar population (C06) in the piedmont belt.
Researchers have proved that, compared with diffusion within short distances, the long-distance dispersal of gene flow plays a more pivotal role in the persistence of the entire connectivity and genetic diversity of plant metapopulations [59,60]. Simultaneously, the contributions of wind, pollinators and river water help the pollen flow to spread farther. However, within some geographic groups (group ET, group WT), moderate degrees of genetic differentiation (FST > 0.1) (Table S3) have appeared in neighboring populations, indicating that anthropogenic activities may have encroached into these natural territories, leading to the discontinuous gene flow. Driven by economic interests and commercial purposes, human over-exploitation has weakened the reproductive capacity of C. spinosa populations and has arbitrarily cut off the long-distance dispersal chains of gene flow, making short-distance spreading predominant, increasing the rates of inbreeding depression and resulting in population decline, thereby making it difficult for them to maintain their genetic diversity and evolutionary potential. Some populations near human activity areas, such as Toksun (C18), Hami (C21), Dunhuang (C22), Yining (C31) and Gongliu (C32), are frequently threatened by natural resource plundering and other disturbances, such as riverway- or highway-widening, agricultural reclamation and industrial expansion, etc. The relatively low genetic heterozygosity and diversity levels (Table 1) found in these populations may be primarily caused by the results of the above depredations.
4.3. Implications for Conservation
Evaluating the spatial genetic structure and survival situation of metapopulations across regional environment variability could efficiently and effectively support and improve the management measures of biodiversity conservation, thereby conducing to maintain the evolutionary potential of widespread species in response to changing environments [33,56]. In this study, most of the central source populations with large effective sizes are located in the expansive piedmonts of north and south Tianshan Mountains, where multiple hotspots of biodiversity have been shaped in their long evolution history in the arid region. In contrast, isolated populations on the desert plateau of western Himalayas, as well as peripheral populations in the desert basin adjacent to eastern Tianshan, are experiencing a decrease in or even disappearance of biodiversity. As a result of the adverse effects of hereditary factors or human disturbance, these sink populations are extremely vulnerable to habitat fragmentation and resource exhaustion [34], so it is particularly important to monitor population trajectories, minimize human disturbances and restore natural landscapes [27]. Given the limited manpower and material resources, in addition to relevant policies for protecting xeromorphic vegetations in arid regions, we recommend that conservation management units should be established that are consistent with the six effective evolutionary groups and that the emphasis of preservation work should be laid on the genetic rescue of isolated populations and habitat restoration of peripheral populations in order to persist the genetic integrity of this plant species.
Conservation of sink populations has been described as an important part of biodiversity persistence of integrated metapopulations because they often contain certain rare alleles or genotypes in the process of historic immigration [61]. The Zabrang population (C01) is distributed in more sparse and localized low-quality habitats, resulting in its greater genetic differentiation with other populations within group WH (FST = 0.1357–0.1878) (Table S3). However, due to a lack of corresponding attention and conservation, the genetic diversity and uniqueness of such isolated population are being threatened and almost disappearing. Empirical studies have illustrated that inputting a certain level of stable gene flow from large source populations to small sinks may counter the negative effects of inbreeding depression and genetic drift [26,33]. Currently, we suggest that genetic rescue such as immigration, exchange of pollen flow and hybridization, might reduce the extinction risk of isolated populations of C. spinosa. If conditions permit, ex situ preservation and reintroduction instead of natural dispersal may be more effective protection strategies to increase local effective population sizes.
The disturbance of human activities, such as the expansion of farmland, makes this subshrub lose its competitive advantage, which could consequently lead to its habitat shrinking. Additionally, the industrial waste generated by newly built factories in the suburbs has caused serious pollution to the soil environment and increased the saline–alkali stresses on its habitat, whereupon the mortality rates of plant individuals have also risen. If these trends persist, the relic species would scarcely escape from the hidden danger of resource exhaustion or even the verge of extinction. Populations in the Tuha Basin–Hexi Corridor (Group EP) are located on the edge of the Kumtag Desert, where water shortages and soil salinization are becoming increasingly serious. These findings are the consequences of continuous increasing human pressure on the barren habitats of xerophytes. According to our field investigation conducted from 2011 to 2020, the population sizes within group EP in the desert basin were originally large (>300 individuals per population in 2011). Nevertheless, over the past decade, due to humans’ immoderate harvesting and unceasing expansion of agriculture and industry, the living space of C. spinosa in this region has decreased sharply. In particular, the genetic diversity of the peripheral Hami and Dunhuang populations (C21 and C22) has been gradually decreasing, and the plant morphology and population sizes (<100 individuals per population in 2020) here have also been shrinking under these dual pressures, which weaken the plant’s ability to prevent wind and sand and preserve water and soil (Figure 1c). This region has been trapped in a vicious circle of natural desert vegetation destruction, water loss and soil erosion, as well as aggravated saline–alkali desertification. In order to realize the sustainable development of the ecological economy in arid regions, we should rationally conduct agricultural production on the basis of protecting natural desert landscapes, reduce the pollution of industrial waste to primitive habitats and limit the predatory exploitation of germplasm resources, therefore protecting the biodiversity of wild drought-resistant species to ultimately slow down the processes of desertification and salinization.
5. Conclusions
In this study, we analyzed the population genetic structure and biodiversity conservation management of C. spinosa, a Tethyan relic medicinal subshrub in arid central Asia. Six geographical units with differences in genetic diversity and lineage differentiation were distinguished. This excellent wind-preventing, sand-fixing and soil- and water-conserving xerophyte is at potential risk of natural resource depletion. Populations at high altitudes of the western Himalayas have been experiencing a gradual decline in genetic diversity and effective scales as a result of inbreeding depression by IBD and habitat isolation. On the other hand, peripheral populations at low altitudes in eastern desert basins with original rich genetic diversity are suffering from the plundering of germplasm resources and the destruction of survival environment. Therefore, to restore the genetic integrity of the metapopulations, we suggest that central source populations should be preserved in situ corresponding to different geographical units and that conservation priority should be focused on the genetic rescue of isolated populations and the habitat restoration of peripheral populations. Meanwhile, minimizing human activities in addition to the rational and sustainable utilization of natural resources will be of significance to the population resilience and evolutionary potential of C. spinosa in response to the long-term aridification and future changing environment, and it will eventually maintain the ecosystem balance, as well as slow the desertification process in arid regions.
Supplementary Materials
The following are available online at https://0-www-mdpi-com.brum.beds.ac.uk/article/10.3390/d14020146/s1, Table S1: Details of geographical locations, altitude and effective sizes of natural populations of C. spinosa. Table S2: Digestion sites of several common or rare restriction enzymes, as well as their combinations for screening schemes in this study. Table S3: Pairwise genetic differentiation indices (FST) among the 37 populations. Figure S1: Mutation spectrum of genome-wide single-nucleotide polymorphism (SNP) dataset of C. spinosa. Mutation types of SNPs are distinguished by different colors. T:A > C:G and C:G > T:A account for the overwhelming majority. Figure S2: Distribution of cross-validation (CV) error in the ADMIXTURE analysis. K = 6 is the optimal K value in condition of the lowest CV error. Figure S3: Pairwise Nei’s genetic distance among populations of C. spinosa.
Author Contributions
Conceptualization, Q.W.; data curation, H.-X.Z. and Q.W.; formal analysis, H.-X.Z. and Q.W.; funding acquisition, Q.W.; investigation, Q.W.; methodology, H.-X.Z.; project administration, Q.W.; visualization, H.-X.Z. and Q.W.; writing—original draft, Q.W.; and writing—review and editing, Q.W. and H.-X.Z. All authors have read and agreed to the published version of the manuscript.
Funding
This research was funded by National Natural Science Foundation of China (31700287, 31870323, 32170391 and 31770227).
Institutional Review Board Statement
Not applicable.
Data Availability Statement
All RAD-seq data of C. spinosa were submitted to the NCBI (SRA accession: SAMN24698411–SAMN24698673).
Acknowledgments
The authors are grateful to Qing-Song Pu, Ke-Jing Ouyang and Ze-Run Zhu for their kind help and guidance in the field investigation in Tibet Autonomous Region for this paper.
Conflicts of Interest
The authors declare no conflict of interest.
References
- Chen, X.; Jiang, F.Q.; Wang, Y.J.; Li, Y.M.; Hu, R.J. Characteristics of the eco-geographical pattern in arid land of Central Asia. Arid Zone Res. 2013, 30, 385–390, (In Chinese with English Abstract). [Google Scholar]
- Yong, S.P.; Zhu, Z.Y. A certain fundamental characteristics of gobi desert vegetation in the Centre Asia. Acta Sci. Nat. Univ. Intramongol. 1992, 23, 235–244, (In Chinese with English Abstract). [Google Scholar]
- Wu, Z.Y.; Sun, H.; Zhou, Z.K.; Li, D.Z.; Peng, H. Floristics of Seed Plants from China; Science Press: Beijing, China, 2010. (In Chinese) [Google Scholar]
- Liu, Y.X. A study on origin and formation of the Chinese desert floras. Acta Phyt. Sin. 1995, 33, 131–143, (In Chinese with English Abstract). [Google Scholar]
- Sun, H.; Li, Z.M. Qinghai-Tibet Plateau uplift and its impact on Tethys Flora. Adv. Earth Sci. 2003, 18, 852–862. [Google Scholar]
- Fang, X.M.; Lv, L.Q.; Yang, S.L.; Li, J.J.; An, Z.S.; Jiang, P.A.; Chen, X.L. Loess in Kunlun Mountain and its implications on desert development and Tibetan Plateau uplift in west China. Sci. China Ser. D 2002, 45, 289–299. [Google Scholar] [CrossRef]
- Guan, Q.Y.; Pan, B.T.; Li, N.; Zhang, J.D.; Xue, L.J. Timing and significance of the initiation of present day deserts in the northeastern Hexi Corridor, China. Palaeogeogr. Palaeoclimatol. Palaeoecol. 2011, 306, 70–74. [Google Scholar]
- Zhang, L.Y.; Hai, Y. Plant communities excluded in the book of “The Vegetation and its Utilization in Xinjiang”: I. The desert plant communities. Arid Land Geogr. 2002, 25, 84–89. [Google Scholar]
- Su, Z.H.; Pan, B.R.; Zhang, M.L.; Shi, W. Conservation genetics and geographic patterns of genetic variation of endangered shrub Ammopiptanthus (Fabaceae) in northwestern China. Conserv. Genet. 2016, 17, 485–496. [Google Scholar] [CrossRef]
- Ma, S.M.; Nie, Y.B.; Jiang, X.L.; Xu, Z.; Ji, W.Q. Genetic structure of the endangered, relict shrub Amygdalus mongolica (Rosaceae) in arid northwest China. Aust. J. Botany 2019, 67, 128–139. [Google Scholar] [CrossRef]
- Zhang, H.X.; Wang, Q.; Jia, S.W. Genomic phylogeography of Gymnocarpos przewalskii (Caryophyllaceae): Insights into habitat fragmentation in arid Northwestern China. Diversity 2020, 12, 335. [Google Scholar] [CrossRef]
- Zhang, M.L.; Tucker, G.C. Capparaceae. In Flora of China; Wu, Z.Y., Raven, P.H., Eds.; Science Press: Beijing, China; Missouri Botanical Garden Press: St. Louis, MO, USA, 2008; Volume 7, pp. 433–450. [Google Scholar]
- Wu, S.K. Capparidaceae. In Flora of Tibet; Wu, Z.Y., Ed.; Science Press: Beijing, China, 1985; Volume 2, pp. 322–323. (In Chinese) [Google Scholar]
- An, Z.X. Capparidaceae. In Flora Xinjiangensis; Mao, Z.M., Ed.; Xinjiang Science, Technology and Hygiene Publishing House: Urumqi, China, 1995; Volume 2, pp. 35–36. (In Chinese) [Google Scholar]
- Fici, S.; Gianguzzi, L. Diversity and conservation in wild and cultivated Capparis in Sicily. Bocconea 1997, 7, 437–443. [Google Scholar]
- Saadaoui, E.; Khaldi, A.; Khouja, M.L.; Mohamed, E.G. Intraspecific variation of Capparis spinosa L. in Tunisia. J. Herbs Spices Med. Plants 2009, 15, 9–15. [Google Scholar] [CrossRef]
- Fici, S. A taxonomic revision of the Capparis spinosa group (Capparaceae) from the Mediterranean to Central Asia. Phytotaxa 2014, 174, 001–024. [Google Scholar] [CrossRef] [Green Version]
- Özbek, Ö.; Kara, A. Genetic variation in natural populations of Capparis from Turkey, as revealed by RAPD analysis. Plant Syst. Evol. 2013, 299, 1911–1933. [Google Scholar] [CrossRef]
- Al-Safadi, B.; Faouri, H.; Elias, R. Genetic diversity of some Capparis L. species growing in Syria. Braz. Arch. Biol. Technol. 2014, 57, 916–926. [Google Scholar] [CrossRef]
- Aichi-Yousfi, H.; Bahri, B.A.; Medini, M.; Rouz, S.; Rejeb, M.N.; Ghrabi-Gammar, Z. Genetic diversity and population structure of six species of Capparis in Tunisia using AFLP markers. Comptes Rendus Biol. 2016, 339, 442–453. [Google Scholar] [CrossRef]
- Mercati, F.; Fontana, I.; Gristina, A.S.; Martorana, A.; El Nagar, M.; De Michele, R.; Fici, S.; Carimi, F. Transcriptome analysis and codominant markers development in caper, a drought tolerant orphan crop with medicinal value. Sci. Rep. 2019, 9, 10411. [Google Scholar] [CrossRef] [Green Version]
- Futuyma, D.J. Evolutionary Biology, 2nd ed.; Sinauer Associates: Sunderland, MA, USA, 1986. [Google Scholar]
- Vellend, M.; Geber, M.A. Connections between species diversity and genetic diversity. Ecol. Lett. 2005, 8, 767–781. [Google Scholar] [CrossRef]
- Frankham, R. Genetics and extinction. Biol. Conserv. 2005, 126, 131–140. [Google Scholar] [CrossRef]
- Sakai, A.K.; Allendorf, F.W.; Holt, J.S.; Lodge, D.M.; Molofsky, J.; With, K.A.; Baughman, S.; Cabin, R.J.; Cohen, J.E.; Ellstrand, N.C.; et al. The population biology of invasive species. Annu. Rev. Ecol. Syst. 2001, 32, 305–332. [Google Scholar] [CrossRef] [Green Version]
- Pulliam, R.H. Sources, sinks, and population regulation. Am. Nat. 1988, 132, 652–661. [Google Scholar] [CrossRef]
- Heinrichs, J.A.; Lawler, J.J.; Schumaker, N.H. Intrinsic and extrinsic drivers of source–sink dynamics. Ecol. Evol. 2016, 6, 892–904. [Google Scholar] [CrossRef] [PubMed] [Green Version]
- Wright, S. Isolation by distance. Genetics 1943, 28, 114–138. [Google Scholar] [CrossRef] [PubMed]
- Walters, S. Landscape pattern and productivity effects on source–sink dynamics of deer populations. Ecol. Model. 2001, 143, 17–32. [Google Scholar] [CrossRef]
- Crutzen, P.J. Geology of mankind. Nature 2002, 415, 23. [Google Scholar] [CrossRef]
- Lewis, S.L.; Maslin, M.A. Defining the Anthropocene. Nature 2015, 519, 171–180. [Google Scholar] [CrossRef]
- Meng, H.H.; Zhou, S.S.; Li, L.; Tan, Y.H.; Li, J.W.; Li, J. Confict between biodiversity conservation and economic growth: Insight into rare plants in tropical China. Biodivers. Conserv. 2019, 28, 523–537. [Google Scholar] [CrossRef]
- Hanski, I. Metapopulation dynamics. Nature 1998, 396, 41–49. [Google Scholar] [CrossRef]
- Nunes, F.; Norris, R.D.; Knowlton, N. Implications of isolation and low genetic diversity in peripheral populations of an amphi-Atlantic coral. Mol. Ecol. 2009, 18, 4283–4297. [Google Scholar] [CrossRef]
- Myers, N.; Mittermeier, R.A.; Mittermeier, C.G.; da Fonseca, G.A.B.; Kent, J. Biodiversity hotspots for conservation priorities. Nature 2000, 403, 853–858. [Google Scholar] [CrossRef]
- Kessler, M. Patterns of diversity and range size of selected plant groups along an elevational transect in the Bolivian Andes. Biodivers. Conserv. 2001, 10, 1897–1921. [Google Scholar] [CrossRef]
- Liu, J.; Moller, M.; Provan, J.; Gao, L.M.; Poudel, R.M.; Li, D.Z. Geological and ecological factors drive cryptic speciation of yews in a biodiversity hotspot. New Phytol. 2013, 199, 1093–1108. [Google Scholar] [CrossRef] [PubMed]
- Fernández-Mazuecos, M.; Jiménez-Mejías, P.; Rotllan-Puig, X.; Vargas, P. Narrow endemics to Mediterranean islands: Moderate genetic diversity but narrow climatic niche of the ancient, critically endangered Naufraga (Apiaceae). Perspect. Plant Ecol. Evol. Syst. 2014, 16, 190–202. [Google Scholar] [CrossRef]
- Millar, C.I.; Libby, W.J. Strategies for conserving clinal, ecotypic, and disjunct population diversity in widespread species. In Genetics and Conservation of Rare Plants; Falk, D.A., Holsinger, K.E., Eds.; Oxford University Press: New York, NY, USA, 1991; Volume 10, pp. 149–170. [Google Scholar]
- Brumfield, R.T.; Beerli, P.; Nickerson, D.A.; Edwards, S.V. The utility of single nucleotide polymorphisms in inferences of population history. Trends Ecol. Evol. 2003, 18, 249–256. [Google Scholar] [CrossRef]
- Morin, P.A.; Luikart, G.; Wayne, R.K.; The SNP Workshop Group. SNPs in ecology, evolution and conservation. Trends Ecol. Evol. 2004, 19, 208–216. [Google Scholar] [CrossRef]
- Leaché, A.D.; Oaks, J.R. The utility of single nucleotide polymorphism (SNP) data in phylogenetics. Annu. Rev. Ecol. Evol. Syst. 2017, 48, 69–84. [Google Scholar] [CrossRef]
- Zhang, H.X.; Li, X.S.; Wang, J.C.; Zhang, D.Y. Insights into the aridification history of Central Asian Mountains and international conservation strategy from the endangered wild apple tree. J. Biogeogr. 2021, 48, 332–344. [Google Scholar] [CrossRef]
- Davey, J.W.; Blaxter, M.L. RADSeq: Next-generation population genetics. Brief. Funct. Genom. 2011, 9, 416–423. [Google Scholar] [CrossRef]
- Peterson, B.K.; Weber, J.N.; Kay, E.H.; Fisher, H.S.; Hoekstra, H.E. Double digest RADseq: An inexpensive method for de novo SNP discovery and genotyping in model and non-model species. PLoS ONE 2012, 7, e37135. [Google Scholar] [CrossRef] [Green Version]
- Andrews, K.R.; Good, J.M.; Miller, M.R.; Luikart, G.; Hohenlohe, P.A. Harnessing the power of RADseq for ecological and evolutionary genomics. Nat. Rev. Genet. 2016, 17, 81–92. [Google Scholar] [CrossRef] [Green Version]
- Jiang, X.L.; Gardner, E.M.; Meng, H.H.; Deng, M.; Xu, G.B. Land bridges in the Pleistocene contributed to flora assembly on the continental islands of South China: Insights from the evolutionary history of Quercus championii. Mol. Phylogenet. Evol. 2019, 132, 36–45. [Google Scholar] [CrossRef] [PubMed]
- Cao, Y.N.; Zhu, S.S.; Chen, J.; Comes, H.P.; Wang, I.J.; Chen, L.Y.; Sakaguchi, S.; Qiu, Y.X. Genomic insights into historical population dynamics, local adaptation, and climate change vulnerability of the East Asian Tertiary relict Euptelea (Eupteleaceae). Evol. Appl. 2020, 13, 2038–2055. [Google Scholar] [CrossRef] [PubMed]
- Catchen, J.; Hohenlohe, P.A.; Bassham, S.; Amores, A.; Cresko, W.A. Stacks: An analysis tool set for population genomics. Mol. Ecol. 2013, 22, 3124–3140. [Google Scholar] [CrossRef] [PubMed] [Green Version]
- Alexander, D.H.; Novembre, J.; Lange, K. Fast model-based estimation of ancestry in unrelated individuals. Genome Res. 2009, 19, 1655–1664. [Google Scholar] [CrossRef] [PubMed] [Green Version]
- Guindon, S.; Dufayard, J.-F.; Lefort, V.; Anisimova, M.; Hordijk, W.; Gascuel, O. New algorithms and methods to estimate maximum-likelihood phylogenies: Assessing the performance of PhyML 3.0. Syst. Biol. 2010, 59, 307–321. [Google Scholar] [CrossRef] [PubMed] [Green Version]
- Yang, J.; Lee, S.H.; Goddard, M.E.; Visscher, P.M. GCTA: A tool for genome-wide complex trait analysis. Am. J. Hum. Genet. 2011, 88, 76–82. [Google Scholar] [CrossRef] [Green Version]
- Excoffier, L.; Lischer, H.E. Arlequin suite ver 3.5: A new series of programs to perform population genetics analyses under Linux and Windows. Mol. Ecol. Res. 2010, 10, 564–567. [Google Scholar] [CrossRef]
- R Core Team. R: A Language and Environment for Statistical Computing; R Foundation for Statistical Computing: Vienna, Austria, 2013. [Google Scholar]
- Meng, H.H.; Gao, X.Y.; Huang, J.F.; Zhang, M.L. Plant phylogeography in arid Northwest China: Retrospectives and perspectives. J. Syst. Evol. 2015, 53, 33–46. [Google Scholar] [CrossRef]
- Mims, M.C.; Hauser, L.; Goldberg, C.S.; Olden, J.D. Distance, and metapopulation dynamics of the Arizona Treefrog (Hyla wrightorum) in an isolated portion of its range. PLoS ONE 2016, 11, e0160655. [Google Scholar] [CrossRef] [Green Version]
- Frankham, R.; Ballou, J.D.; Briscoe, D.A. Introduction to Conservation Genetics; Cambridge University Press: Cambridge, UK, 2002. [Google Scholar]
- Beebee, T.J.C. Conservation genetics of amphibians. Heredity 2005, 95, 423–427. [Google Scholar] [CrossRef]
- Tero, N.; Aspi, J.; Siikamäki, P.; Jäkäläniemi, A.; Tuomi, J. Genetic structure and gene flow in a metapopulation of an endangered plant species, Silene tatarica. Mol. Ecol. 2003, 12, 2073–2085. [Google Scholar] [CrossRef] [PubMed] [Green Version]
- O’Connell, L.M.; Mosseler, A.; Rajora, O.P. Extensive long-distance pollen dispersal in a fragmented landscape maintains genetic diversity in white spruce. J. Hered. 2007, 98, 640–645. [Google Scholar] [CrossRef] [PubMed]
- Howe, R.W.; Davis, G.J.; Mosca, G.J. The demographic significance of sink populations. Biol. Conserv. 1991, 57, 239–255. [Google Scholar] [CrossRef]
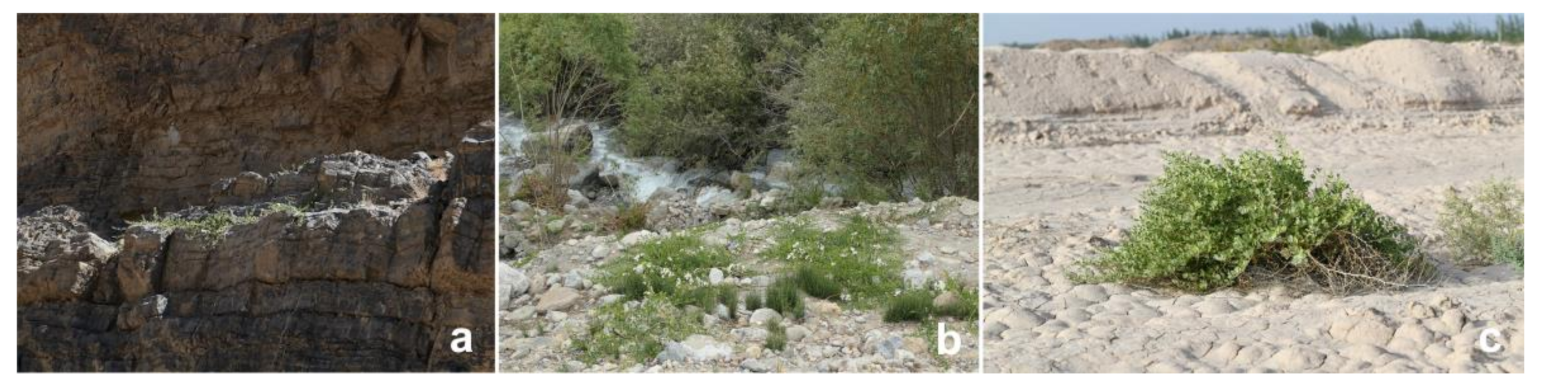
Figure 1.
Different habitat requirements of C. spinosa: (a) high-altitudinal desert plateau, (b) medium-altitudinal valleys and (c) low-altitudinal desert basins.
Figure 1.
Different habitat requirements of C. spinosa: (a) high-altitudinal desert plateau, (b) medium-altitudinal valleys and (c) low-altitudinal desert basins.

Figure 2.
Natural geographical distribution of C. spinosa populations in arid central Asia. Different colors distinguish different geographic groups with red (western Himalayas), blue (eastern Pamirs), yellow (western Tianshan), azure (northern piedmont of Tianshan), green (southern piedmont of Tianshan) and purple (eastern Tianshan). The SRTM elevation data at a resolution of 30 s was downloaded from the WorldClim (https://www.worldclim.org/ accessed on 22 October 2021).

Figure 3.
Population genetic structure of C. spinosa according to posterior probabilities assigned to the Bayesian clusters in the ADMIXTURE analysis. The patterns are shown with different K values (K = 3–6). The six groups are delimited by gray lines. Group WH, western Himalayas; group EP, eastern Pamirs; group ST, the southern piedmont of Tianshan; group NT, the northern piedmont of Tianshan; group ET, eastern Tianshan; group WT, western Tianshan. *, K02 (Almaty population), K01 (Bishkek population), U01 (Osh population), U02 (Batken population), T01 (Nurek population).

Figure 4.
Maximum likelihood (ML) phylogenetic tree of 263 individuals from 37 sampled populations and two outgroup species (C. erythrocarpos and C. bodinieri) constructed with the genome-wide SNP dataset. The color-coded clades indicate different geographic groups of C. spinosa with red (western Himalayas), blue (eastern Pamirs), yellow (western Tianshan), azure (the northern piedmont of Tianshan), green (the southern piedmont of Tianshan) and purple (eastern Tianshan).

Figure 5.
PCA analysis based on SNP dataset. (a) PC1 and PC2 (16.55% vs. 6.99%) are the distributions of the two main principal components of the genetic variation of C. spinosa, (b) substructures within group EP and group WT (PC1, 16.15% vs. PC2, 6.99%) in addition to (c) substructures within groups ST (the southern piedmont of Tianshan), NT (the northern piedmont of Tianshan) and ET (eastern Tianshan Mountains) (PC1, 16.15% vs. PC2, 6.99%). The individuals are color coded according to different populations.

Figure 6.
Isolation by distance (IBD) analysis: correlation between genetic distance and geographical distance among 37 populations (r = 0.499, p < 0.001).
Figure 6.
Isolation by distance (IBD) analysis: correlation between genetic distance and geographical distance among 37 populations (r = 0.499, p < 0.001).


Table 1.
Genetic diversity indices for natural populations of C. spinosa.
| Code | Pop. Locality | Ho | He | Pi |
|---|---|---|---|---|
| Group WH | (Western Himalayas) | 0.0455 | 0.0648 | 0.0671 |
| C01 | Zabrang, Tibet, China | 0.0394 | 0.0429 | 0.0465 |
| C02 | Sarang, Tibet, China | 0.0512 | 0.0448 | 0.0594 |
| C03 | Diya, Tibet, China | 0.0528 | 0.0637 | 0.0687 |
| Group EP | (Eastern Pamirs) | 0.1169 | 0.2283 | 0.2318 |
| C04 | Taxkorgan, Xinjiang, China | 0.1109 | 0.1822 | 0.2003 |
| C05 | Akto, Xinjiang, China | 0.1154 | 0.1665 | 0.1932 |
| C06 | Yengisar, Xinjiang, China | 0.1168 | 0.1805 | 0.1989 |
| C07 | Yecheng, Xinjiang, China | 0.1220 | 0.1420 | 0.1703 |
| C08 | Wuqia, Xinjiang, China | 0.1026 | 0.1665 | 0.1858 |
| C09 | Artux, Xinjiang, China | 0.1234 | 0.1946 | 0.2134 |
| C10 | Jiashi, Xinjiang, China | 0.1273 | 0.1991 | 0.2234 |
| Group WT | (Western Tianshan) | 0.1025 | 0.1914 | 0.1965 |
| K02 | Almaty, Kazakhstan | 0.0932 | 0.0466 | 0.0932 |
| K01 | Bishkek, Kyrgyzstan | 0.0561 | 0.0281 | 0.0561 |
| U01 | Osh, Kyrgyzstan | 0.1057 | 0.0529 | 0.1057 |
| U02 | Batken, Kyrgyzstan | 0.1115 | 0.0558 | 0.1115 |
| T01 | Nurek, Khatlon, Tajikistan | 0.0940 | 0.0769 | 0.1154 |
| C30 | Bole, Xinjiang, China | 0.1150 | 0.1693 | 0.1866 |
| C31 | Yining, Xinjiang, China | 0.1021 | 0.1367 | 0.1539 |
| C32 | Gongliu, Xinjiang, China | 0.1020 | 0.1475 | 0.1602 |
| Group ST | (southern piedmont of Tianshan) | 0.1125 | 0.2223 | 0.2255 |
| C11 | Tumxuk, Xinjiang, China | 0.0911 | 0.1372 | 0.1585 |
| C12 | Kalpin, Xinjiang, China | 0.1178 | 0.1840 | 0.2042 |
| C13 | Wensu, Xinjiang, China | 0.1145 | 0.1739 | 0.1945 |
| C14 | Baicheng, Xinjiang, China | 0.1208 | 0.1745 | 0.1885 |
| C15 | Lunnan, Xinjiang, China | 0.0956 | 0.1321 | 0.1555 |
| C16 | Korla, Xinjiang, China | 0.1135 | 0.1714 | 0.1897 |
| C17 | Hejing, Xinjiang, China | 0.1178 | 0.1691 | 0.1904 |
| Group NT | (northern piedmont of Tianshan) | 0.1206 | 0.2214 | 0.2245 |
| C24 | Jimsar, Xinjiang, China | 0.1155 | 0.1623 | 0.1827 |
| C25 | Urumqi, Xinjiang, China | 0.1120 | 0.1850 | 0.2020 |
| C26 | Manas, Xinjiang, China | 0.1288 | 0.1783 | 0.1925 |
| C27 | Shihezi, Xinjiang, China | 0.1161 | 0.1873 | 0.2046 |
| C28 | Shawan, Xinjiang, China | 0.1298 | 0.1692 | 0.1940 |
| C29 | Wusu, Xinjiang, China | 0.1198 | 0.1915 | 0.2069 |
| Group ET | (Eastern Tianshan) | 0.0999 | 0.1910 | 0.1944 |
| C18 | Toksun, Xinjiang, China | 0.0973 | 0.1270 | 0.1455 |
| C19 | Turpan, Xinjiang, China | 0.1060 | 0.1479 | 0.1631 |
| C20 | Shanshan, Xinjiang, China | 0.1059 | 0.1549 | 0.1699 |
| C21 | Hami, Xinjiang, China | 0.0920 | 0.1310 | 0.1473 |
| C22 | Dunhuang, Gansu, China | 0.1029 | 0.1286 | 0.1516 |
| C23 | Guazhou, Gansu, China | 0.0942 | 0.1595 | 0.1749 |
Ho, observed heterozygosity; He, expected heterozygosity; Pi, nucleotide diversity.
Table 2.
AMOVA among different geographic groups, inter- and intra-populations of C. spinosa.
| Source of Variation | df | Sum of Squares | Variance Components | Percentage of Variation (%) | Φ-Statistics |
|---|---|---|---|---|---|
| Among groups | 5 | 99,228.136 | 212.66396 | 27.36 | ΦCT = 0.27 ** |
| Among populations within groups | 29 | 39,934.919 | 59.33213 | 7.63 | ΦSC = 0.11 ** |
| Within populations | 491 | 248,090.120 | 505.27519 | 65.01 | ΦST = 0.35 ** |
| Total | 525 | 387,253.175 | 777.27128 |
df, degrees of freedom; **, p < 0.001.
Publisher’s Note: MDPI stays neutral with regard to jurisdictional claims in published maps and institutional affiliations. |
© 2022 by the authors. Licensee MDPI, Basel, Switzerland. This article is an open access article distributed under the terms and conditions of the Creative Commons Attribution (CC BY) license (https://creativecommons.org/licenses/by/4.0/).
Share and Cite
MDPI and ACS Style
Wang, Q.; Zhang, H.-X. Population Genetic Structure and Biodiversity Conservation of a Relict and Medicinal Subshrub Capparis spinosa in Arid Central Asia. Diversity 2022, 14, 146. https://0-doi-org.brum.beds.ac.uk/10.3390/d14020146
AMA Style
Wang Q, Zhang H-X. Population Genetic Structure and Biodiversity Conservation of a Relict and Medicinal Subshrub Capparis spinosa in Arid Central Asia. Diversity. 2022; 14(2):146. https://0-doi-org.brum.beds.ac.uk/10.3390/d14020146
Chicago/Turabian StyleWang, Qian, and Hong-Xiang Zhang. 2022. "Population Genetic Structure and Biodiversity Conservation of a Relict and Medicinal Subshrub Capparis spinosa in Arid Central Asia" Diversity 14, no. 2: 146. https://0-doi-org.brum.beds.ac.uk/10.3390/d14020146
Note that from the first issue of 2016, this journal uses article numbers instead of page numbers. See further details here.