
Bycatch Dynamics from a Small-Scale Shrimp Trap Fishery in the Mediterranean Sea

 , ,
, ,  ,
,
Abstract
:1. Introduction
2. Materials and Methods
2.1. Definitions
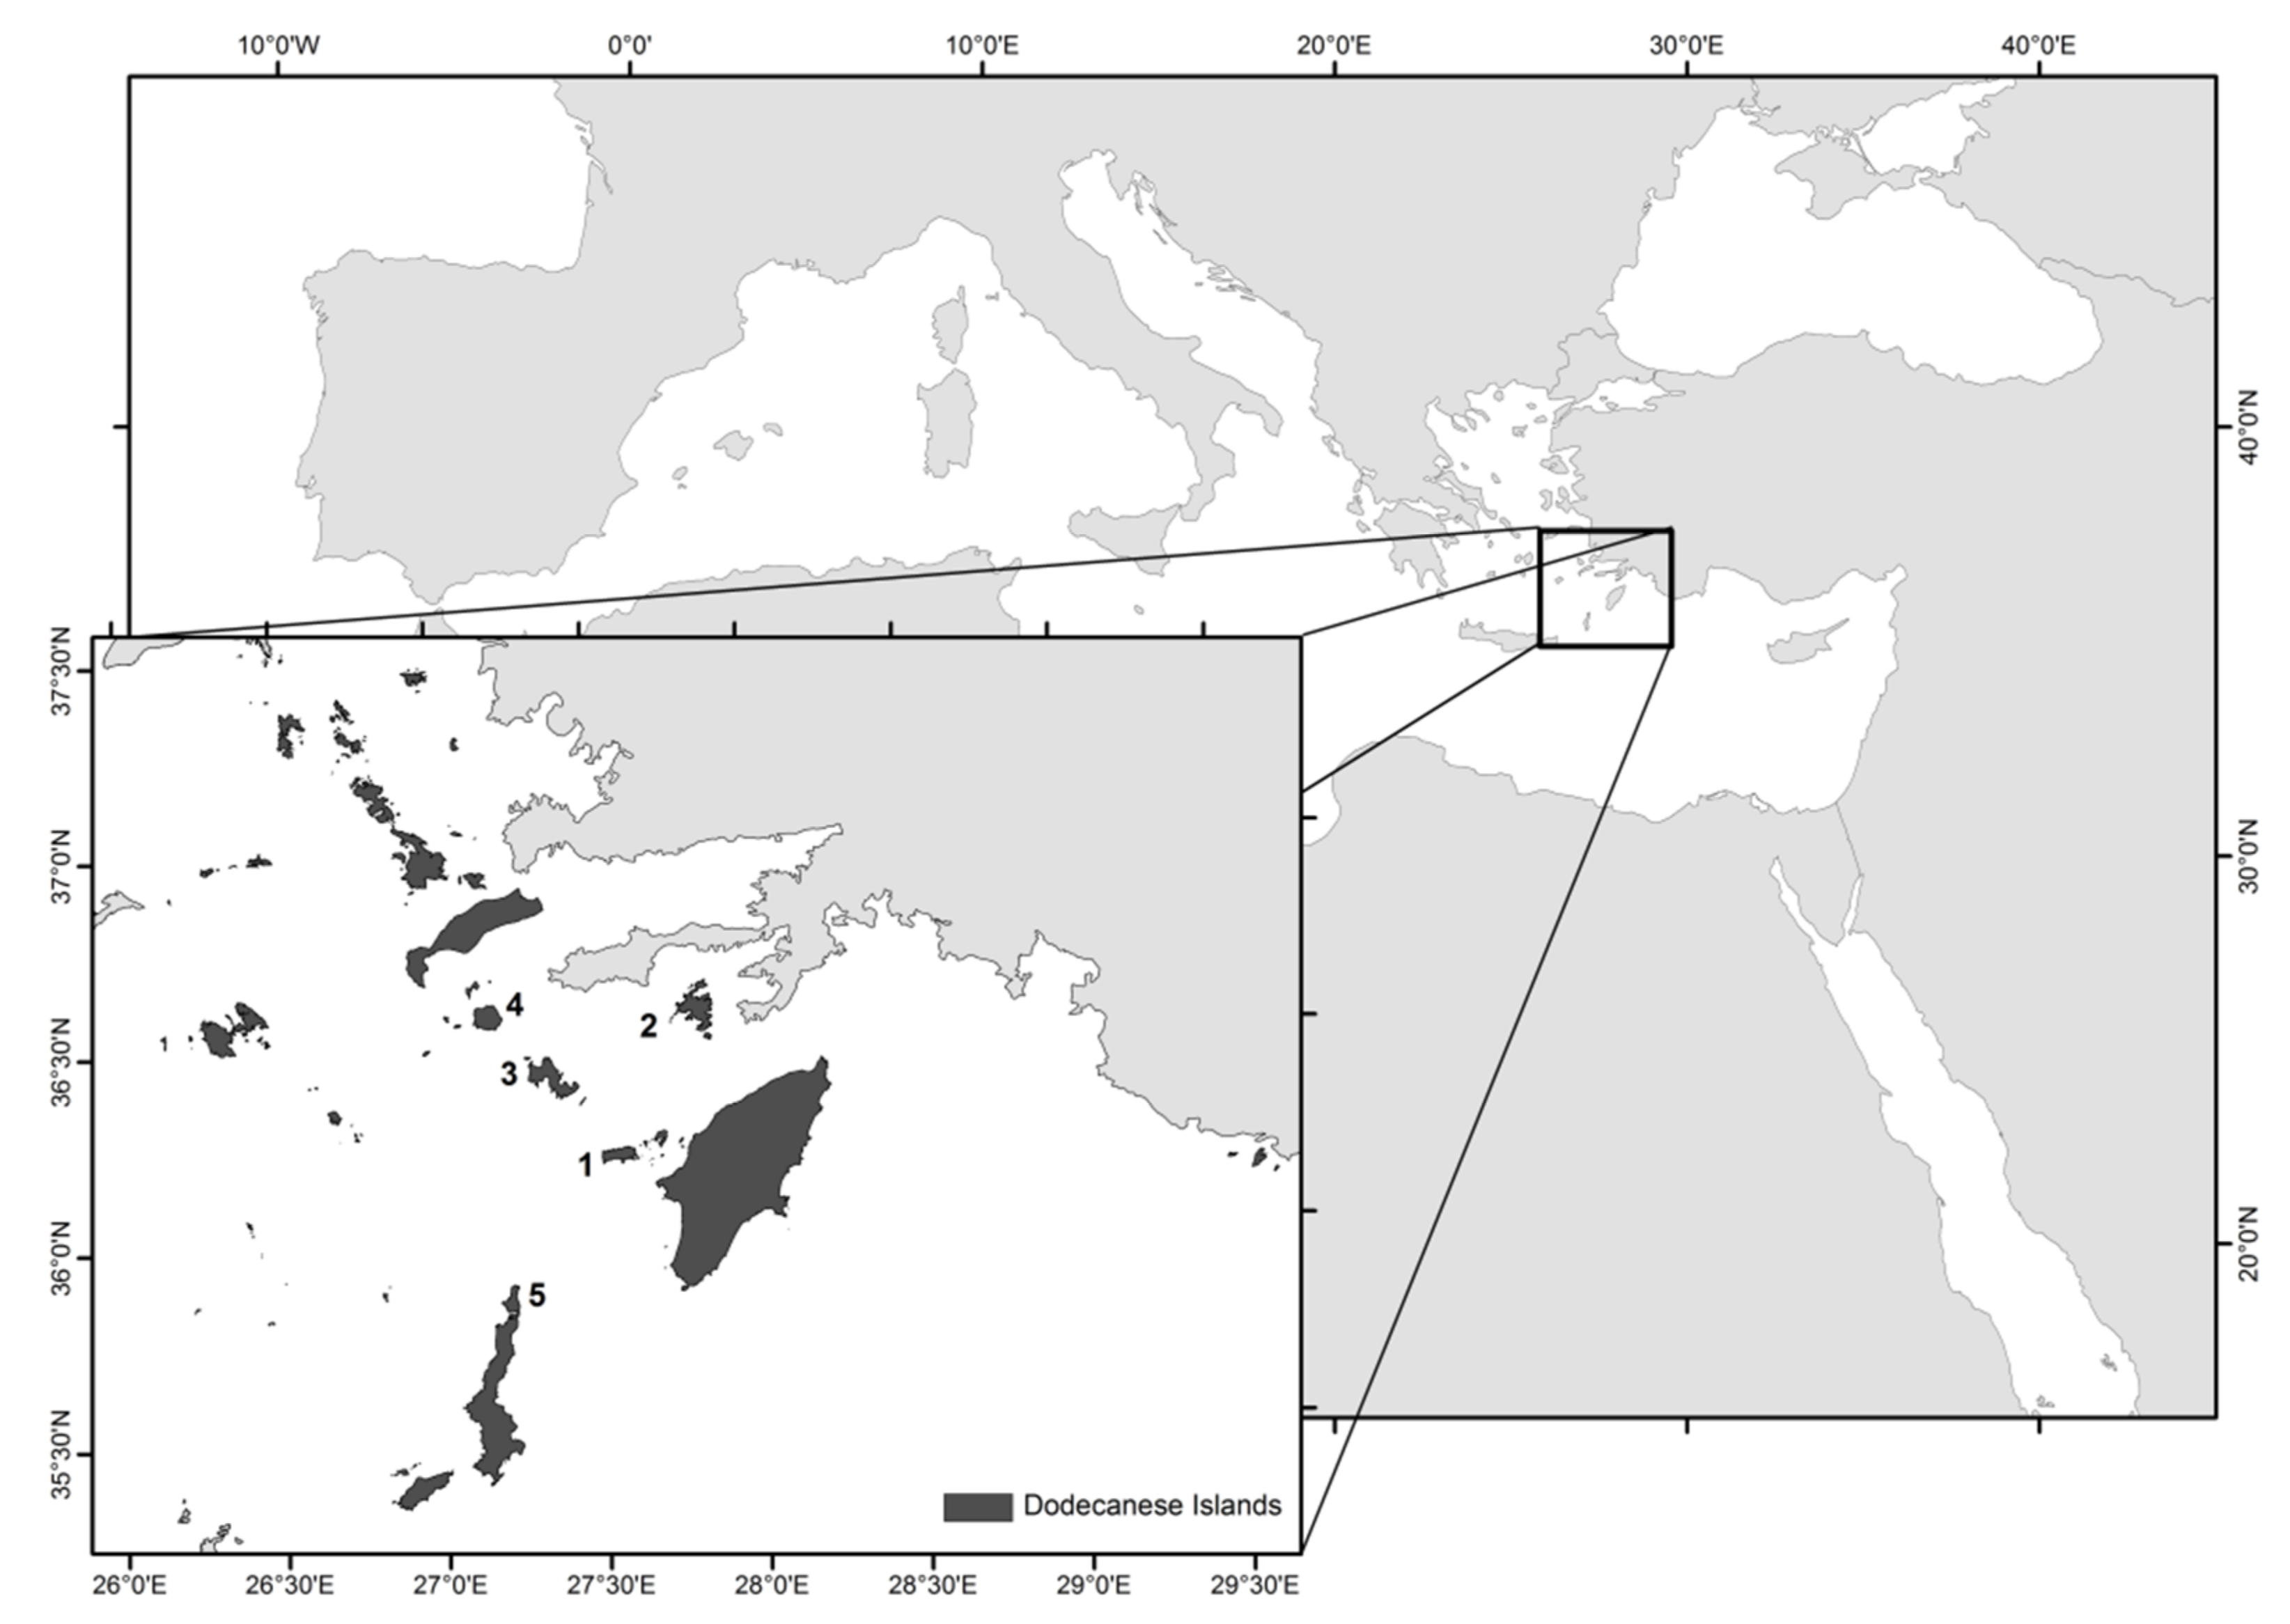
2.2. Sampling
2.3. Revenues and Economic Value of Catch and Bycatch
2.4. Data Analysis
- Contribution of incidental catch biomass, expressed as the ratio of incidental catch to target species;
- Revenues from incidental catch.
2.5. Assemblage Structure
2.6. Haul Time
3. Results
3.1. Catch and Revenues of Incidental Catch
3.2. Variation in the Species Diversity of the Bycatch
3.3. Variation in the Density and Biomass of Bycatch
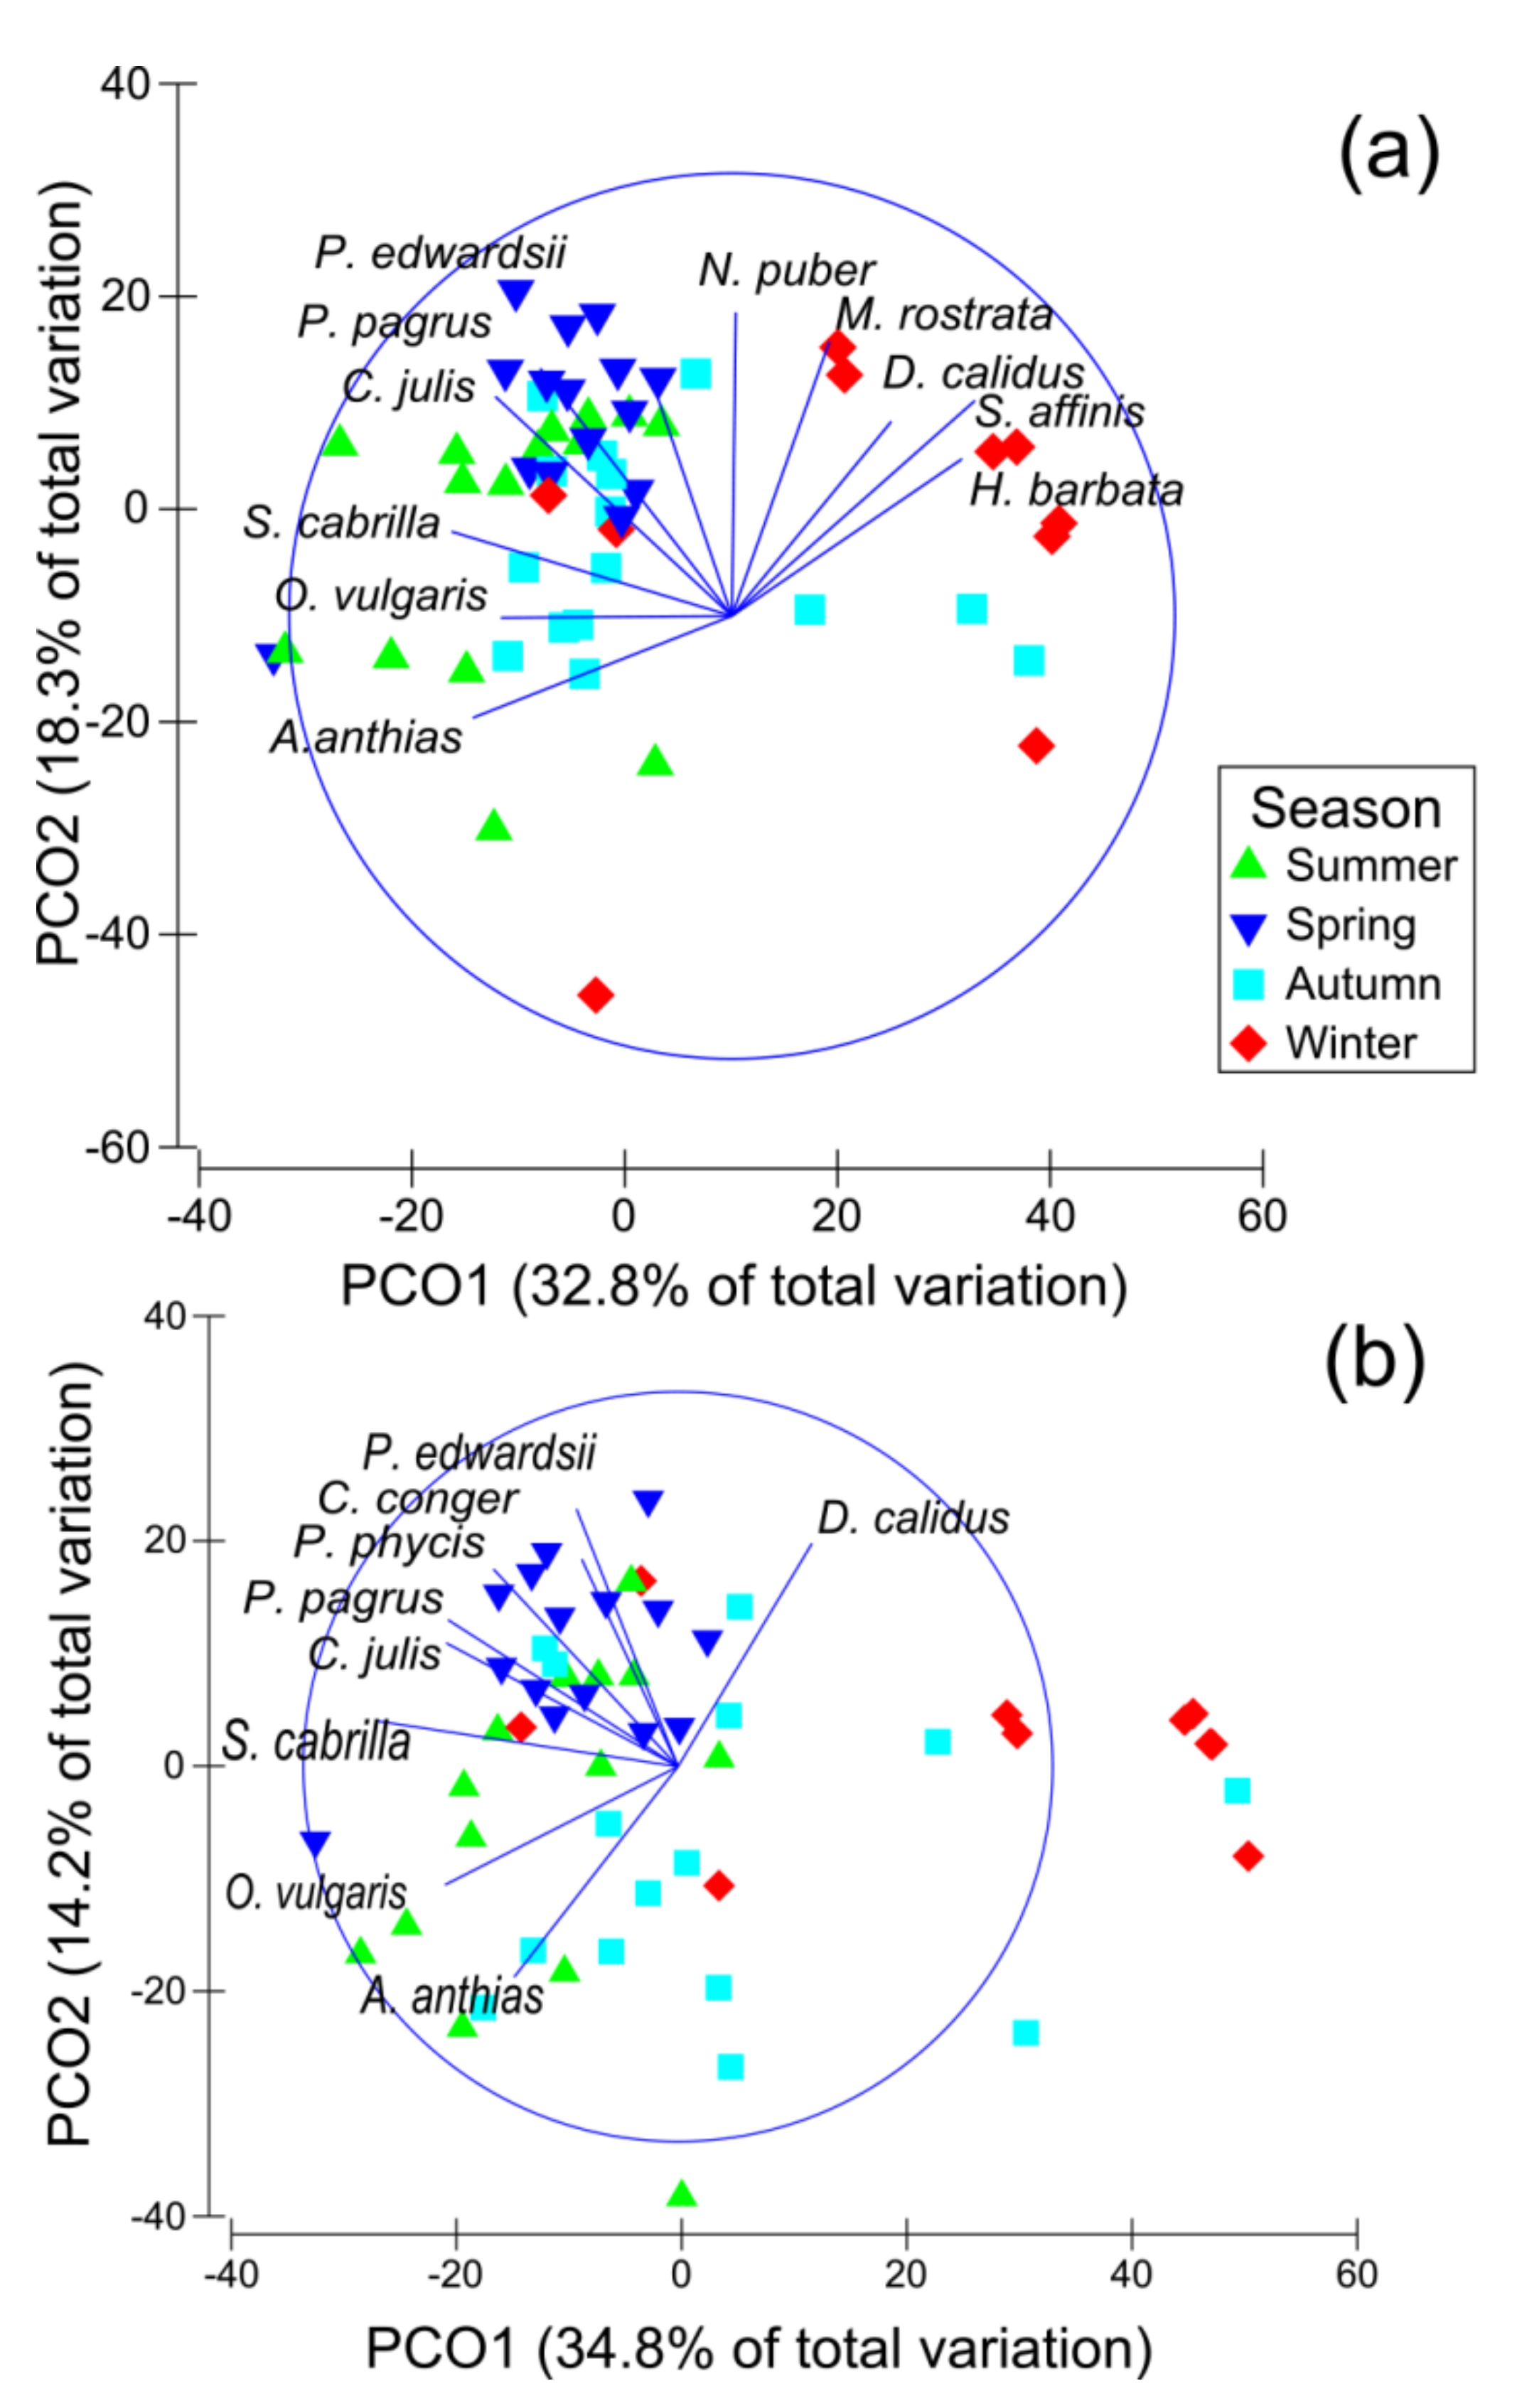
3.4. Assemblage Structure of Incidental Catches and Discards
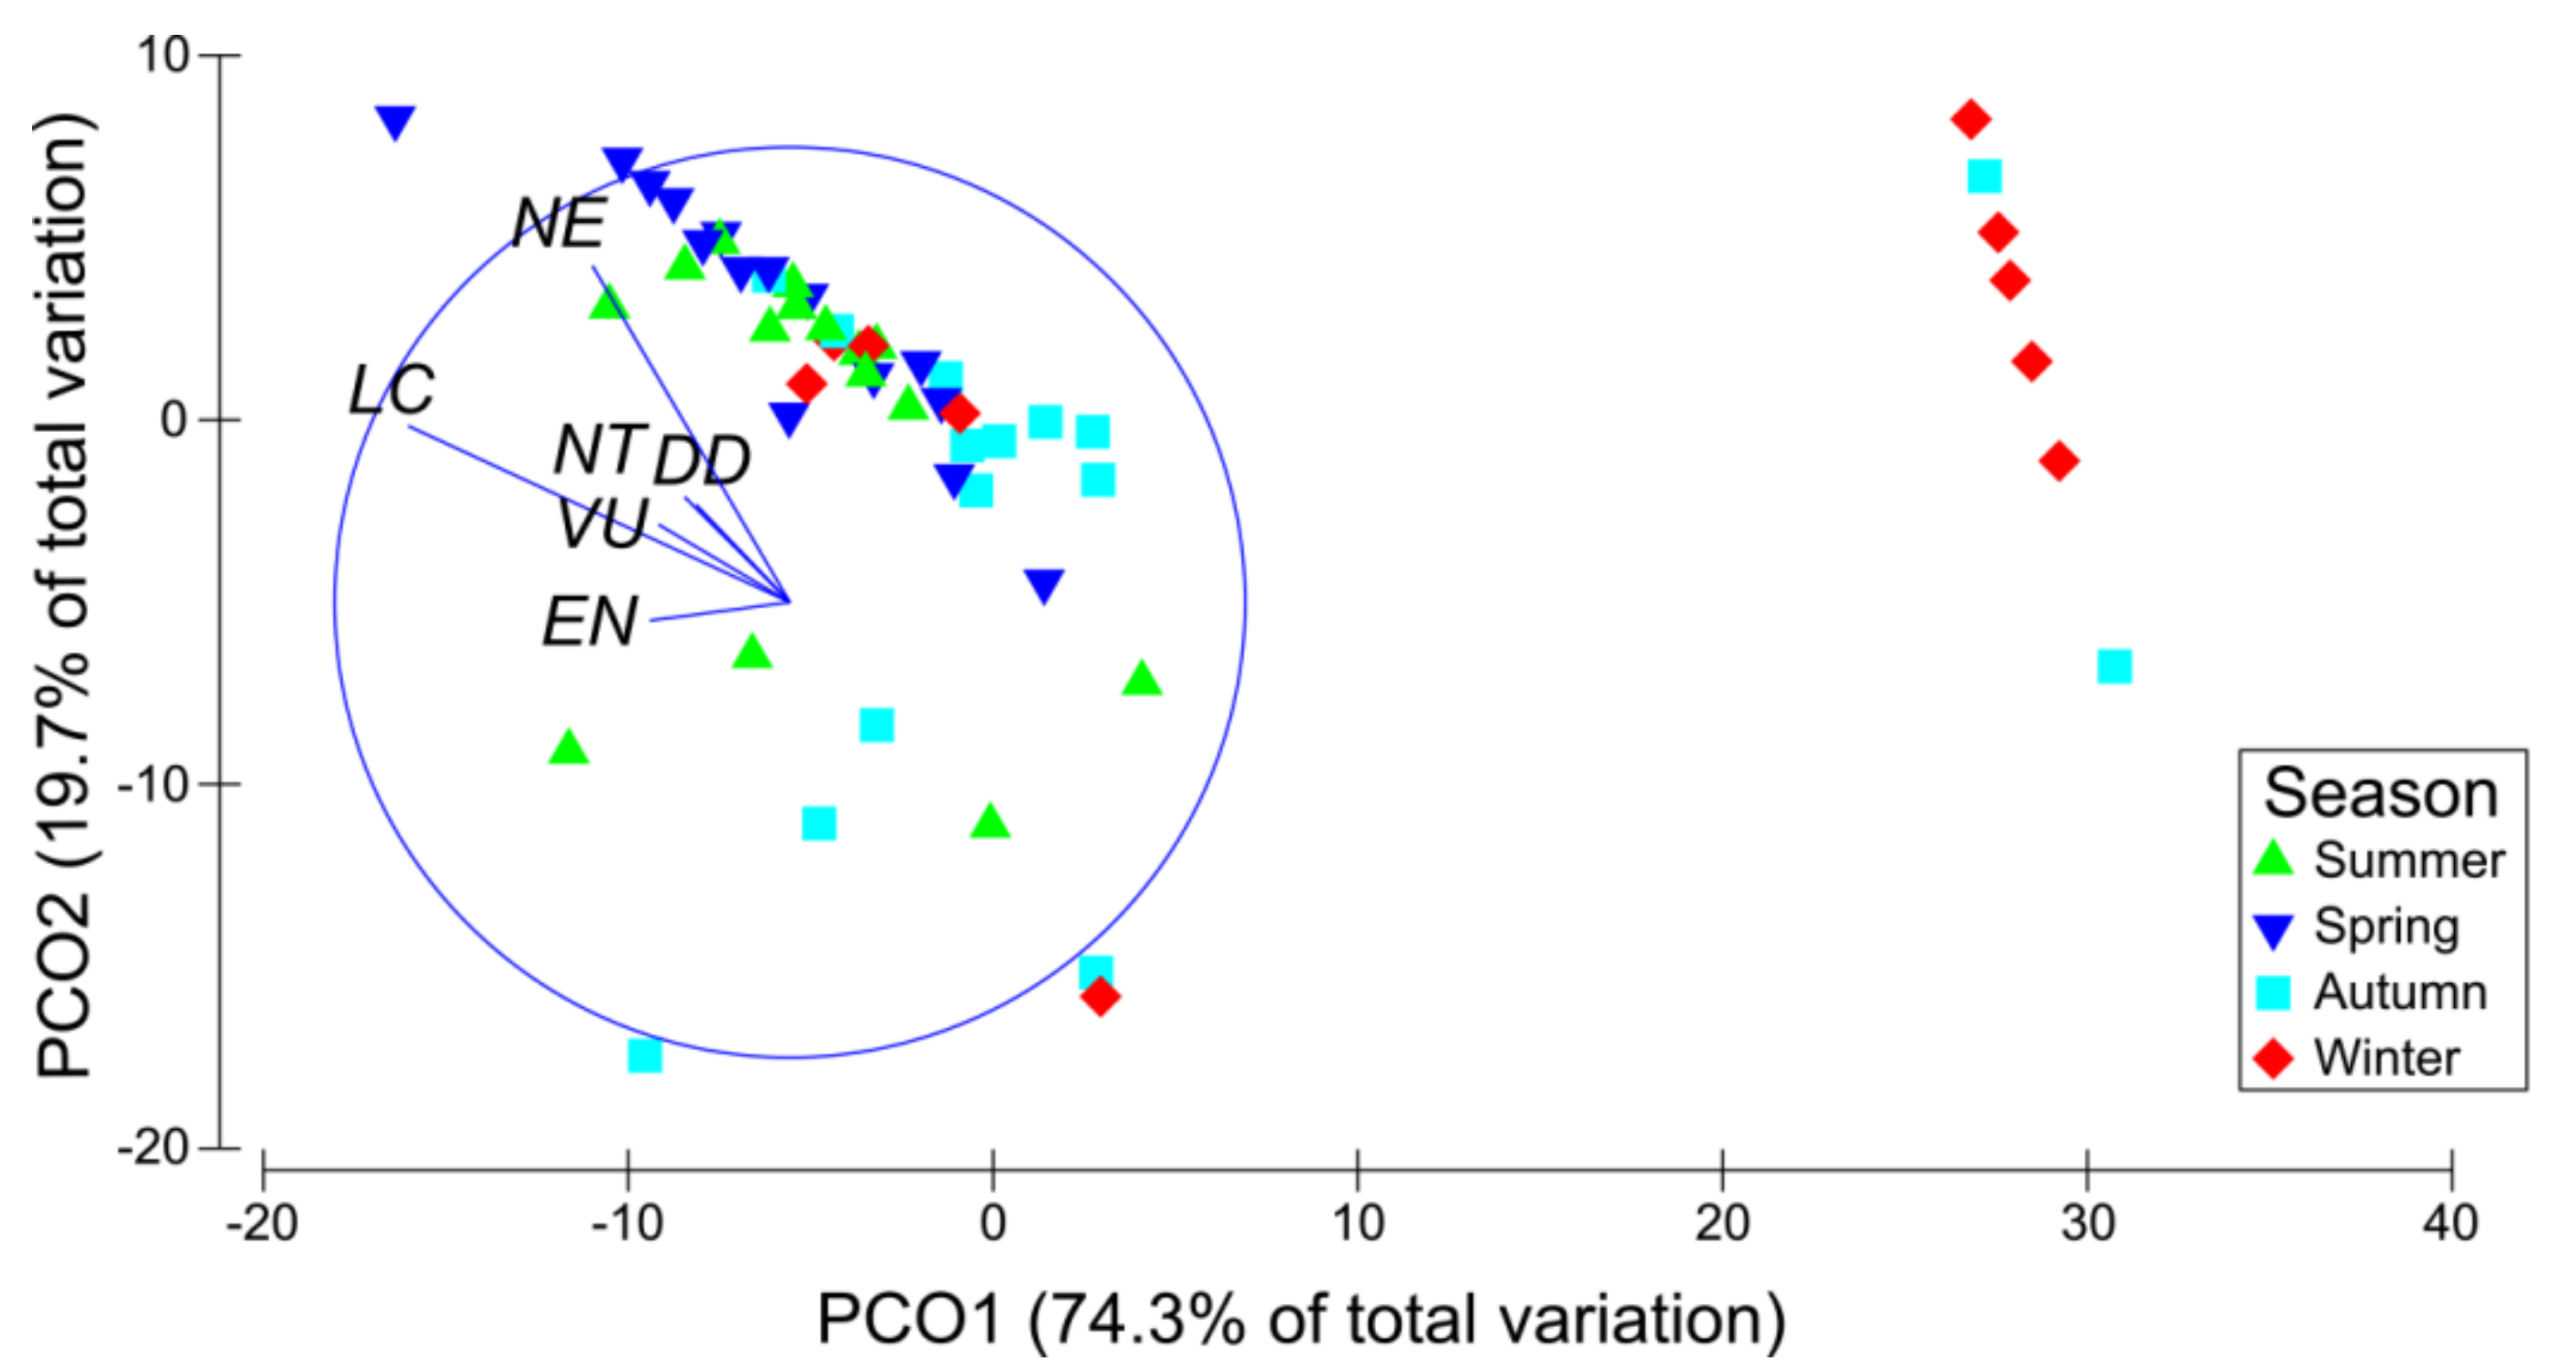
3.5. Vulnerability Status
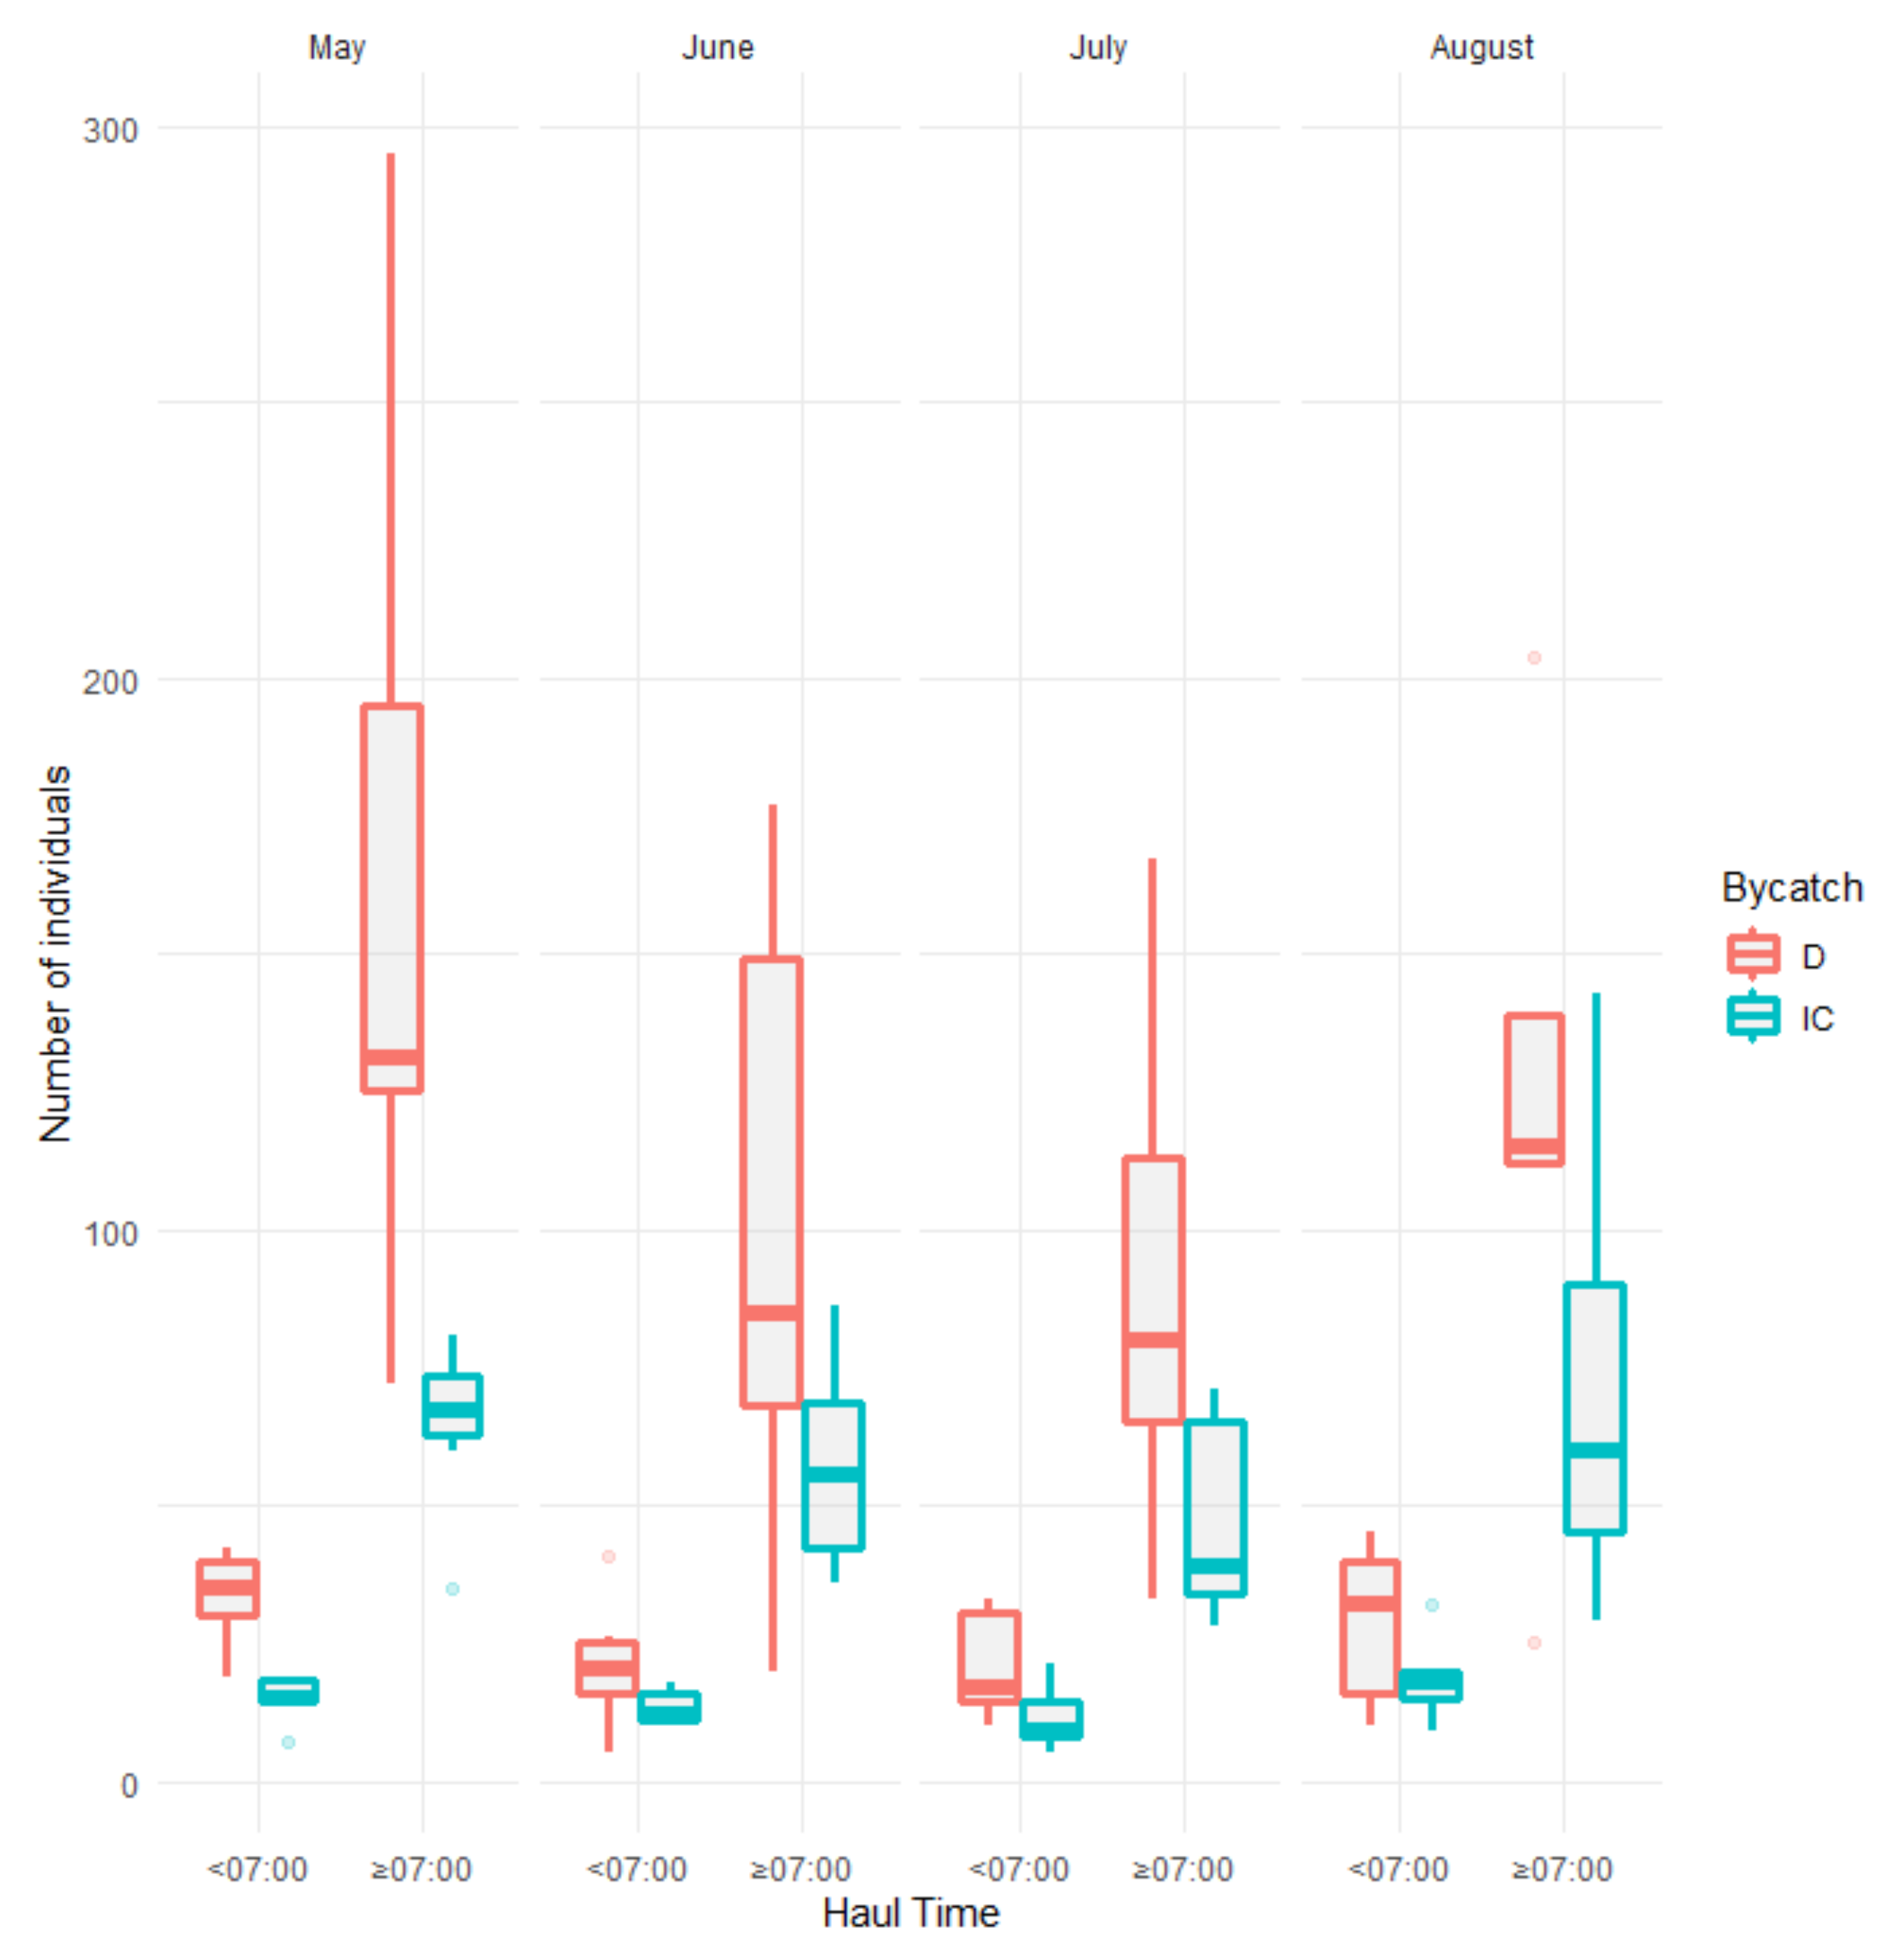
3.6. Haul Time
4. Discussion
Supplementary Materials
Author Contributions
Funding
Institutional Review Board Statement
Data Availability Statement
Acknowledgments
Conflicts of Interest
Appendix A

| Number of incidentally caught species | F | p value | Pair-wise LSD | ||
| Fixed effects | Intercept | 317.03 | 0.001 | ||
| Season | 12.98 | 0.001 | A vs. S; A vs. W; Sp vs. W; S vs. W | ||
| Estimate | SE | Wald Z | pvalue | ||
| Random effects | Location | 0.03 | 0.24 | 0.12 | 0.901 |
| Number of Chordata species | F | pvalue | Pair-wise LSD | ||
| Fixed effects | Intercept | 268.64 | 0.001 | ||
| Season | 15.49 | 0.001 | A vs. S; A vs. W; Sp vs. W; S vs. W; Sp vs. A | ||
| Estimate | SE | Wald Z | pvalue | ||
| Random effects | Location | 0.01 | 0.001 | 5.05 | 0.680 |
| Number of Echinodermata species | F | pvalue | Pair-wise LSD | ||
| Fixed effects | Intercept | 152.03 | 0.001 | ||
| Season | 8.90 | 0.001 | A vs. W; Sp vs. S; Sp vs. W; S vs. W | ||
| Estimate | SE | Wald Z | pvalue | ||
| Random effects | Location | 0.06 | 0.07 | 0.81 | 0.418 |
| Number of Arthropoda species | F | pvalue | Pair-wise LSD | ||
| Fixed effects | Intercept | 71.83 | 0.001 | ||
| Season | 1.71 | 0.178 | |||
| Estimate | SE | Wald Z | pvalue | ||
| Random effects | Location | 0.89 | 0.74 | 1.13 | 0.251 |
| Number of Mollusca species | F | pvalue | Pair-wise LSD | ||
| Fixed effects | Intercept | 57.28 | 0.001 | ||
| Season | 1.62 | 0.195 | |||
| Estimate | SE | Wald Z | pvalue | ||
| Random effects | Location | 0.30 | 0.06 | 5.05 | 0.344 |
| Number of Discarded species | F | pvalue | Pair-wise LSD | ||
| Fixed effects | Intercept | 140.15 | 0.001 | ||
| Season | 3.43 | 0.024 | |||
| Estimate | SE | Wald Z | pvalue | ||
| Random effects | Location | 1.14 | 1.08 | 1.05 | 0.290 |
| Density of incidental catches | F | p value | Pair-wise LSD | ||
| Fixed effects | Intercept | 120.20 | 0.001 | ||
| Season | 7.18 | 0.001 | AvsW;SpvsW;SvsW | ||
| Estimate | SE | Wald Z | pvalue | ||
| Random effects | Location | 0.01 | 0 | 0.50 | 0.720 |
| Density of discards | F | pvalue | Pair-wise LSD | ||
| Fixed effects | Intercept | 49.79 | 0.002 | ||
| Season | 3.59 | 0.020 | AvsSp | ||
| Estimate | SE | Wald Z | pvalue | ||
| Random effects | Location | 617.39 | 573.08 | 1.07 | 0.284 |
| Density of targeted P. narval | F | pvalue | Pair-wise LSD | ||
| Fixed effects | Intercept | 36.15 | 0.004 | ||
| Season | 14.55 | 0.001 | SpvsA;SpvsS;SpvsW | ||
| Estimate | SE | Wald Z | pvalue | ||
| Random effects | Location | 8157215 | 6287164 | 1.29 | 0.194 |
| Density of Chordata | F | pvalue | Pair-wise LSD | ||
| Fixed effects | Intercept | 10.26 | 0.033 | ||
| Season | 7.85 | 0.001 | AvsSp;AvsS;SpvsA;SpvsW;SvsW | ||
| Estimate | SE | Wald Z | pvalue | ||
| Random effects | Location | 15946.01 | 12425.47 | 1.28 | 0.199 |
| Density of Echinodermata | F | pvalue | Pair-wise LSD | ||
| Fixed effects | Intercept | 11.01 | 0.002 | ||
| Season | 6.63 | 0.001 | All comparisons were statistically significant | ||
| Estimate | SE | Wald Z | pvalue | ||
| Random effects | Location | 0.002 | 0 | 5.05 | 0.456 |
| Density of Arthropoda | F | pvalue | Pair-wise LSD | ||
| Fixed effects | Intercept | 16.531 | 0.015 | ||
| Season | 2.104 | 0.112 | |||
| Estimate | SE | Wald Z | pvalue | ||
| Random effects | Location | 3037.74 | 2890.31 | 1.05 | 0.293 |
| Density of Mollusca | F | pvalue | Pair-wise LSD | ||
| Fixed effects | Intercept | 4.20 | 0.106 | ||
| Season | 0.78 | 0.510 | |||
| Estimate | SE | Wald Z | pvalue | ||
| Random effects | Location | 75.020 | 294.52 | 0.255 | 0.799 |
| Biomass of incidental catch | F | p value | Pair-wise LSD | ||
| Fixed effects | Intercept | 103.83 | 0.0001 | ||
| Season | 4.36 | 0.008 | WvsA; WvsSp; WvsS | ||
| Estimate | SE | Wald Z | pvalue | ||
| Random effects | Location | 7054.81 | 1396.92 | 5.050 | 0.0001 |
| Biomass of discards | F | pvalue | Pair-wise LSD | ||
| Fixed effects | Intercept | 103.89 | 0.001 | ||
| Season | 2.189 | 0.101 | |||
| Estimate | SE | Wald Z | pvalue | ||
| Random effects | Location | 0.005 | 0.001 | 5.050 | 0.523 |
| Biomass of Chordata | F | pvalue | Pair-wise LSD | ||
| Fixed effects | Intercept | 61.61 | 0.001 | ||
| Season | 6.10 | 0.001 | SpvsA;SpvsW;SpvsS;WvsS | ||
| Estimate | SE | Wald Z | pvalue | ||
| Random effects | Location | 841589.48 | 1189576 | 0.707 | 0.479 |
| Biomass of Echinodermata | F | pvalue | Pair-wise LSD | ||
| Fixed effects | Intercept | 10.54 | 0.002 | ||
| Season | 5.90 | 0.002 | WvsA;WvsSp;WvsS | ||
| Estimate | SE | Wald Z | pvalue | ||
| Random effects | Location | 4463.2 | 838.8 | 5.050 | 0.254 |
| Biomass of Arthropoda | F | pvalue | Pair-wise LSD | ||
| Fixed effects | Intercept | 43.07 | 0.003 | ||
| Season | 11.89 | 0.001 | SpvsA;SpvsS;SpvsW | ||
| Estimate | SE | Wald Z | pvalue | ||
| Random effects | Location | 258835.17 | 201202.1 | 1.286 | 0.198 |
| Biomass of Mollusca | F | pvalue | Pair-wise LSD | ||
| Fixed effects | Intercept | 31.14 | 0.001 | ||
| Season | 1.96 | 0.131 | |||
| Estimate | SE | Wald Z | pvalue | ||
| Random effects | Location | 1146.18 | 226.97 | 5.040 | 0.524 |
| Biomass of targeted P. narval | F | pvalue | Pair-wise LSD | ||
| Fixed effects | Intercept | 37.54 | 0.004 | ||
| Season | 17.01 | 0.001 | AvsSp,AvsS;SpvsS;SpvsW;SvsA | ||
| Estimate | SE | Wald Z | pvalue | ||
| Random effects | Location | 39079083 | 2992340 | 1.306 | 0.192 |
| Biomass ratio of bycatch to target species | F | p value | Pair-wise LSD | ||
| Fixed effects | Intercept | 54.74 | 0.001 | ||
| Season | 51.00 | 0.205 | |||
| Estimate | SE | Wald Z | pvalue | ||
| Random effects | Location | 0.11 | 0.02 | 5.04 | 0.351 |
| Revenus | F | pvalue | Pair-wise LSD | ||
| Fixed effects | Intercept | 149.03 | 0.001 | ||
| Season | 8.12 | 0.001 | SpvsA;SpvsW; WvsA; WvsS | ||
| Estimate | SE | Wald Z | pvalue | ||
| Random effects | Location | 9.79 | 69.52 | 0.14 | 0.888 |
| Estimate | SE | p Value | 95% CI | |
| Number of incidentally caught species | ||||
| Intercept | 2.00 | 0.58 | 0.001 | 0.81, 3.18 |
| Autumn | 2.53 | 0.74 | 0.001 | 1.02, 4.03 |
| Spring | 4.33 | 0.74 | 0.001 | 2.82, 5.83 |
| Summer | 3.86 | 0.74 | 0.001 | 2.36, 5.37 |
| Number of discarded species | ||||
| Intercept | 6.60 | 0.80 | 0.001 | 4.89, 8.30 |
| Autumn | −0.60 | 0.83 | 0.477 | −2.28, 1.08 |
| Spring | 1.33 | 0.83 | 0.117 | −0.34, 3.01 |
| Summer | −0.86 | 0.83 | 0.305 | −2.54, 0.81 |
| Number of Chordata species | ||||
| Intercept | 1.60 | 0.68 | 0.023 | 0.23, 0.96 |
| Autumn | 2.73 | 0.87 | 0.003 | 0.96, 4.49 |
| Spring | 5.60 | 0.87 | 0.001 | 3.83, 7.36 |
| Summer | 4.60 | 0.87 | 0.001 | 2.83, 6.36 |
| Number of Echinodermata species | ||||
| Intercept | 2.70 | 0.25 | 0.001 | 2.18, 3.21 |
| Autumn | −1.16 | 0.28 | 0.001 | −1.74, −0.58 |
| Spring | −0.83 | 0.28 | 0.001 | −1.41, −0.25 |
| Summer | −1.43 | 0.28 | 0.001 | −2.01, −0.85 |
| Density of incidental catches | ||||
| Intercept | 8.10 | 6.24 | 0.200 | −4.43, 20.63 |
| Autumn | 20.30 | 8.06 | 0.015 | 4.11, 36.48 |
| Spring | 34.30 | 8.06 | 0.001 | 18.11, 50.48 |
| Summer | 31.56 | 8.06 | 0.001 | 15.38, 47.74 |
| Density of discards | ||||
| Intercept | 95.40 | 18.26 | 0.001 | 56.57, 134.22 |
| Autumn | −32.93 | 18.72 | 0.085 | −70.59, 4.72 |
| Spring | 21.33 | 18.72 | 0.260 | -16.32, 58.99 |
| Summer | −9.73 | 18.72 | 0.606 | −47.39, 27.92 |
| Density of targeted P. narval | ||||
| Intercept | 6440.30 | 1560.83 | 0.004 | 2791.92, 10088 |
| Autumn | −239.23 | 1158.14 | 0.837 | −2569, 2090.65 |
| Spring | 5809.70 | 1158.14 | 0.001 | 3479.81, 8139.58 |
| Summer | 779.23 | 1158.14 | 0.504 | −1550.65, 3109.11 |
| Density of Chordata | ||||
| Intercept | 103.10 | 70.50 | 0.182 | −59.87, 266.07 |
| Autumn | 5.43 | 54.49 | 0.921 | −104.19, 115.06 |
| Spring | 205.30 | 54.49 | 0.001 | 95.66, 314.93 |
| Summer | 137.36 | 54.49 | 0.015 | 27.73, 246.99 |
| Density of Echinodermata | ||||
| Intercept | 47.80 | 9.32 | 0.001 | 29.08, 66.51 |
| Autumn | −46.53 | 12.03 | 0.001 | −70.70, −22.36 |
| Spring | −43.93 | 12.03 | 0.001 | −68.10, −19.76 |
| Summer | −47.13 | 12.03 | 0.001 | −71.30, −22.96 |
| Density of Mollusca | ||||
| Intercept | 0.40 | 19.44 | 0.984 | −38.88, 39.68 |
| Autumn | 24.60 | 24.60 | 0.323 | −24.89, 74.09 |
| Spring | 13.29 | 24.60 | 0.592 | −36.23, 62.76 |
| Summer | 35.33 | 24.60 | 0.158 | −14.16, 84.83 |
| Biomass of incidental catches | ||||
| Intercept | 1385.40 | 839.88 | 0.105 | −300.75, 3071.54 |
| Autumn | 2871.40 | 1084.28 | 0.110 | 694.60, 5048.20 |
| Spring | 3862.20 | 1084.28 | 0.001 | 1685.39, 6039.00 |
| Summer | 2548.26 | 1084.28 | 0.023 | 371.46, 4725.06 |
| Biomass of Discards | ||||
| Intercept | 1166.51 | 284.66 | 0.001 | 595.03, 1737.99 |
| Autumn | −206.48 | 367.49 | 0.577 | −944.26, 531.29 |
| Spring | 588.96 | 367.49 | 0.115 | −148.80, 1326.74 |
| Summer | −22.94 | 367.49 | 0.950 | −760.71, 714.83 |
| Biomass of Chordata | ||||
| Intercept | 2182.84 | 1036.41 | 0.044 | 64.00, 4301.67 |
| Autumn | 1779.89 | 1228.70 | 0.154 | −691.94, 4251.73 |
| Spring | 5022.55 | 1228.70 | 0.001 | 2550.71, 7494.39 |
| Summer | 2724.02 | 1228.70 | 0.031 | 252.18, 5195.86 |
| Biomass of Echinodermata | ||||
| Intercept | 325.42 | 66.80 | 0.001 | 191.40, 459.64 |
| Autumn | −317.09 | 86.24 | 0.001 | −490.24, −143.94 |
| Spring | −287.46 | 86.24 | 0.002 | −460.61, −114.31 |
| Summer | −321.82 | 86.24 | 0.001 | −494.97, −148.67 |
| Biomass of Arthropoda | ||||
| Intercept | 1266.52 | 282.73 | 0.002 | 611.45, 1921,59 |
| Autumn | −31.25 | 216.68 | 0.886 | −467.15, 404.65 |
| Spring | 1006.07 | 216.68 | 0.001 | 570.17, 1441.98 |
| Summer | 229.19 | 216.68 | 0.296 | −207.71, 665.10 |
| Biomass of Mollusca | ||||
| Intercept | 395.00 | 338.55 | 0.249 | −284.67, 1074.67 |
| Autumn | 965.12 | 437.07 | 0.320 | −87.67, 1842.58 |
| Spring | 230.50 | 437.07 | 0.600 | −646.95, 1107.95 |
| Summer | 496.84 | 437.07 | 0.261 | −380.60, 1374.30 |
| Biomass ratio of bycatch to targeted P. narval | ||||
| Intercept | 0.22 | 0.10 | 0.041 | 0.09, 0.43 |
| Autumn | 0.27 | 0.13 | 0.054 | −0.05; 0.54 |
| Spring | 0.06 | 0.13 | 0.656 | −0.21; 0.33 |
| Summer | 0.13 | 0.13 | 0.315 | −0.13; 0.41 |
| Revenues | ||||
| Intercept | 20.62 | 9.46 | 0.035 | 1.51, 39.74 |
| Autumn | 30.21 | 12.08 | 0.016 | 5.88, 54.53 |
| Spring | 58.80 | 12.08 | 0.001 | 34.47, 83.12 |
| Summer | 39.33 | 12.25 | 0.002 | 14.66, 64.00 |
References
- Shester, G.G.; Micheli, F. Conservation challenges for small-scale fisheries: Bycatch and habitat impacts of traps and gillnets. Biol. Conserv. 2011, 144, 1673–1681. [Google Scholar] [CrossRef]
- Anger, K.; Moreira, G. Morphometric and reproductive traits of tropical Caridean shrimps. J. Crustacean Biol. 1998, 18, 823–838. [Google Scholar] [CrossRef] [Green Version]
- Ye, Y.; Alsaffar, A.H.; Mohammed, H.M.A. Bycatch and discards of the Kuwait shrimp fishery. Fish. Res. 2000, 45, 9–19. [Google Scholar] [CrossRef]
- Pauly, D.; Zeller, D. The best catch data that can possibly be? Rejoinder to Ye et al. “FAO’s statistic data and sustainability of fisheries and aquaculture. Mar. Policy 2017, 81, 406–410. [Google Scholar] [CrossRef]
- Pauly, D.; Zeller, D. Comments on FAOs State of World Fisheries and Aquaculture (SOFIA 2016). Mar. Policy 2017, 77, 176–181. [Google Scholar] [CrossRef]
- Popov, S.; Zeller, D. Reconstructed Russian Fisheries Catches in the Barents Sea: 1950–2014. Front. Mar. Sci. 2018, 5, 266. [Google Scholar] [CrossRef] [Green Version]
- Tzanatos, E.; Somarakis, S.; Tserpes, G.; Koutsikopoulos, C. Discarding practices in a Mediterranean small-scale fishing fleet (Patraikos Gulf, Greece). Fish. Manag. Ecol. 2007, 14, 277–285. [Google Scholar] [CrossRef]
- Tsagarakis, K.; Palialexis, A.; Vassilopoulou, V. Mediterranean fishery discards: Review of the existing knowledge. ICES J. Mar. Sci. 2013, 71, 1219–1234. [Google Scholar] [CrossRef] [Green Version]
- Zeller, D.; Cashion, T.; Palomares, M.; Pauly, D. Global marine fisheries discards: A synthesis of reconstructed data. Fish Fish. 2018, 19, 30–39. [Google Scholar] [CrossRef] [Green Version]
- Davies, R.W.D.; Cripps, S.J.; Nickson, A.; Porter, G. Defining and estimating global marine fisheries bycatch. Mar. Policy 2009, 33, 661–672. [Google Scholar] [CrossRef]
- Lewison, R.L.; Crowder, L.B.; Read, A.J.; Freeman, S.A. Understanding impacts of fisheries bycatch on marine megafauna. Trends Ecol. Evol. 2004, 19, 598–604. [Google Scholar] [CrossRef]
- Karris, G.; Ketsilis-Rinis, V.; Kalogeropoulou, A.; Xirouchakis, S.; Machias, A.; Maina, I.; Kavadas, S. The use of demersal trawling discards as a food source for two scavenging seabird species: A case study of an eastern Mediterranean oligotrophic marine ecosystem. Avian Res. 2018, 9, 26. [Google Scholar] [CrossRef]
- Pascoe, S. Bycatch Management and the Economics of Discarding; FAO: Rome, Italy, 1997; p. 137. [Google Scholar]
- Vasilakopoulos, P.; Maravelias, C.D.; Tserpes, G. The Alarming Decline of Mediterranean Fish Stocks. Curr. Biol. 2014, 24, 1643–1648. [Google Scholar] [CrossRef] [Green Version]
- Hall, S.J.; Mainprize, B.M. Managing by-catch and discards: How much progress are we making and how can we do better? Fish Fish. 2005, 6, 134–155. [Google Scholar] [CrossRef]
- FAO. Code of Conduct for Responsible Fisheries; FAO: Rome, Italy, 1995; 41p. [Google Scholar]
- Garcia, S.M.; Zerbi, A.; Aliaume, C.; Do Chi, T.; Lasserre, G. The Ecosystem Approach to Fisheries. Issues, Terminology, Principles, Institutional Foundations, Implementation and Outlook; FAO Fisheries Technical Paper; FAO: Rome, Italy, 2003; 71p. [Google Scholar]
- FAO. Report of the Technical Consultation to Develop International Guidelines on Bycatch Management and Reduction of Discards; FAO: Rome, Italy, 2010; 32p. [Google Scholar]
- Rochet, M.-J.; Catchpole, T.; Cadrin, S. Bycatch and discards: From improved knowledge to mitigation programmes. ICES J. Mar. Sci. 2014, 71, 1216–1218. [Google Scholar] [CrossRef] [Green Version]
- Guyader, O.; Berthou, P.; Koutsikopoulos, C.; Alban, F.; Demanèche, S.; Gaspar, M.B.; Eschbaum, R.; Fahy, E.; Tully, O.; Reynal, L.; et al. Small scale fisheries in Europe: A comparative analysis based on a selection of case studies. Fish. Res. 2013, 140, 1–13. [Google Scholar] [CrossRef] [Green Version]
- Lleonart, J.; Maynou, F. Fish stock assessments in the Mediterranean: State of the art. Sci. Mar. 2003, 67, 37–49. [Google Scholar] [CrossRef] [Green Version]
- Vasilakopoulos, P.; Maravelias, C.D.; Anastasopoulou, A.; Kapiris, K.; Smith, C.J.; Kalogirou, S. Premium small scale: The trap fishery for Plesionika narval (Decapoda, Pandalidae) in the eastern Mediterranean Sea. Hydrobiologia 2019, 826, 279–290. [Google Scholar] [CrossRef] [Green Version]
- Kalogirou, S.; Anastasopoulou, A.; Kapiris, K.; Maravelias, C.D.; Margaritis, M.; Smith, C.; Pihl, L. Spatial and temporal distribution of narwal shrimp Plesionika narval (Decapoda, Pandalidae) in the Aegean Sea (eastern Mediterranean Sea). Reg. Stud. Mar. Sci. 2017, 16, 240–248. [Google Scholar] [CrossRef]
- Kalogirou, S.; Pihl, L.; Maravelias, C.D.; Herrmann, B.; Smith, C.J.; Papadopoulou, N.; Notti, E.; Sala, A. Shrimp trap selectivity in a Mediterranean small-scale-fishery. Fish. Res. 2019, 211, 131–140. [Google Scholar] [CrossRef]
- González, J.A.; Tuset, V.M.; Lozano, I.J.; Santana, J.I. Biology of Plesionika narval (Crustacea, Decapoda, Pandalidae) Around the Canary Islands (Eastern Central Atlantic). Estuar. Coast. Shelf Sci. 1997, 44, 339–350. [Google Scholar] [CrossRef]
- Pantazi, V.; Mannini, A.; Vasilakopoulos, P.; Kapiris, K.; Megalofonou, P.; Kalogirou, S. That’s All I Know: Inferring the Status of Extremely Data-Limited Stocks. Front. Mar. Sci. 2020, 7, 904. [Google Scholar] [CrossRef]
- Bordbar, L.; Kapiris, K.; Kalogirou, S.; Anastasopoulou, A. First evidence of ingested plastics by a high commercial shrimp species (Plesionika narval) in the eastern Mediterranean. Mar. Pollut. Bull. 2018, 136, 472–476. [Google Scholar] [CrossRef]
- Bordbar, L.; Kapiris, K.; Anastasopoulou, A.; Maravelias, C.D.; Smith, C.J.; Voutsinas, E.; Kalogirou, S. Diet composition and temporal changes in the trophic patterns of Plesionika narval (Crustacea-Decapoda) in the Aegean Sea (Eastern Mediterranean Sea). Reg. Stud. Mar. Sci. 2019, 30, 100739. [Google Scholar] [CrossRef]
- Anastasopoulou, A.; Makantasi, P.; Kapiris, K.; Smith, C.J.; Maravelias, C.; Kalogirou, S. Reproductive biology of Plesionika narval in the SE Aegean Sea (Eastern Mediterranean). Mediterr. Mar. Sci. 2017, 18, 454–467. [Google Scholar] [CrossRef] [Green Version]
- FAO. The State of Mediterranean and Black Sea Fisheries. General Fisheries Commission for the Mediterranean; FAO: Rome, Italy, 2018; 172p. [Google Scholar]
- Maravelias, C.D.; Vasilakopoulos, P.; Kalogirou, S. Participatory management in a high value small-scale fishery in the Mediterranean Sea. ICES J. Mar. Sci. 2018, 75, 2097–2106. [Google Scholar] [CrossRef]
- IUCN. The IUCN Red List of Threatened Species. Version 2018-2. 2019. Available online: https://www.iucnredlist.org/species/104651572/104651577 (accessed on 4 March 2019).
- Nakagawa, S.; Schielzeth, H. Repeatability for Gaussian and Non-Gaussian data: A practical guide for biologists. Biol. Rev. 2010, 85, 935–956. [Google Scholar] [CrossRef]
- Anderson, M.J. Permutational multivariate analysis of variance (PERMANOVA). In StatsRef: Statistics Reference Online; Balakrishnan, N., Colton, T., Everitt, B., Piegorsch, W., Ruggeri, F., Teugels, J.L., Eds.; Wiley: Hoboken, NJ, USA, 2017. [Google Scholar]
- Clarke, K.R.; Gorley, R.N. Change in Marine Communities: An Approach to Statistical Analysis and Interpretation; PRIMER-E Ltd.: Plymouth, UK, 2006. [Google Scholar]
- Arrasate-López, M.; Tuset, V.M.; Santana, J.I.; Garcia-Mederos, A.; Ayza, O.; González, J.A. Fishing methods for sustainable shrimp fisheries in the Canary Islands (North-West Africa). Afr. J. Mar. Sci. 2012, 34, 331–339. [Google Scholar] [CrossRef]
- Pajuelo, J.G.; Triay-Portella, R.l.; Delgado, J.; Góis, A.R.; Correia, S.; Martins, A.; González, J.A. Changes in catch and bycatch composition and in species diversity of a semi-floating shrimp-trap fishery in three eastern Atlantic island ecosystems with different degrees of human alteration. Sci. Mar. 2018, 82, 107–114. [Google Scholar] [CrossRef] [Green Version]
- Lobo, A.S.; Balmford, A.; Arthur, R.; Manica, A. Commercializing bycatch can push a fishery beyond economic extinction. Conserv. Lett. 2010, 3, 277–285. [Google Scholar] [CrossRef]
- Sousa, R.; Pinho, M.R.; Delgado, J.; Biscoito, M.; Pinto, A.R.; Dellinger, T.; Gouveia, L.; Carvalho, D.; Henriques, P. Prospective study of the fishery of the shrimp Plesionika narval (Fabricius, 1787) in the Northeastern Atlantic. Braz. J. Biol. 2017, 77, 585–593. [Google Scholar] [CrossRef] [PubMed] [Green Version]
- Horsten, M.B.; Kirkegaard, E. Bycatch from a Perspective of Sustainable Use; IUCN SSC European Sustainable Use Specialist Group: Fisheries Working Group; IUCN: Gland, Switzerland, 2003; pp. 1–16. [Google Scholar]
- Arculeo, M.; Brutto, S.L. Growth and reproduction data of Plesionika narval (Decapoda, Caridea, Pandalidae) off the Island of Ustica (southern Tyrrhenian Sea). Crustaceana 2011, 84, 1367–1375. [Google Scholar] [CrossRef] [Green Version]
- Castriota, L.; Falautano, M.; Romeo, T.; Florio, J.; Pelusi, P.; Finoia, M.G.; Andaloro, F. Crustacean fishery with bottom traps in an area of the southern Tyrrhenian Sea: Species composition, abundance and biomass. Mediterr. Mar. Sci. 2004, 5, 15–22. [Google Scholar] [CrossRef] [Green Version]
- Eichert, M.; Campos, A.; Fonseca, P.; Henriques, V.; Castro, M. Preliminary results on the use of semi-floating shrimp traps for the striped soldier shrimp, Plesionika edwardsii (Crustacea: Decapoda: Pandalidae), off the Algarve coast (southern Portugal). Sci. Mar. 2018, 82, 209–214. [Google Scholar] [CrossRef] [Green Version]
- FAO. Mapping of SSF Initiatives. Available online: https://maritime-spatial-planning.ec.europa.eu/events/mapping-small-scale-fisheries-initiatives (accessed on 1 September 2021).
- Chapman, C.J.; Shelton, P.M.J.; Shanks, A.M.; Gaten, E. Survival and growth of the Norway lobster Nephrops norvegicus in relation to light-induced eye damage. Mar. Biol. 2000, 136, 233–241. [Google Scholar] [CrossRef]
- Bergmann, M.; Moore, P.G. Survival of decapod crustaceans discarded in the Nephrops fishery of the Clyde Sea area, Scotland. ICES J. Mar. Sci. 2001, 58, 163–171. [Google Scholar] [CrossRef] [Green Version]
- Donnan, D. Effects of fishing on non-target species and habitats: Biological, conservation and socio-economic issues. Aquat. Conserv. Mar. Freshw. Ecosyst. 2001, 11, 488. [Google Scholar] [CrossRef]
- Long, R.D.; Charles, A.; Stephenson, R.L. Key principles of marine ecosystem-based management. Mar. Policy 2015, 57, 53–60. [Google Scholar] [CrossRef]
- Morato, T.; Solà, E.; Grós, M.; Menezes, G. Diets of forkbeard (Phycis phycis) and conger eel (Conger conger) off the Azores during spring of 1996 and 1997. Arquipél 1999, 17, 51–64. [Google Scholar]
- Papaconstantinou, C.; Caragitsou, E. Feeding interaction between two sympatric species Pagrus pagrus and Phycis phycis around Kastellorizo Island (Dodecanese, Greece). Fish. Res. 1989, 7, 329–342. [Google Scholar] [CrossRef]
- Ajana, R.; Techetach, M.; Saoud, Y. Diet of Octopus vulgaris from the Moroccan Mediterranean Coast. Thalass. Int. J. Mar. Sci. 2018, 34, 415–420. [Google Scholar] [CrossRef]
- Silva, A.R.; Vieira, A.R.; Sequeira, V.; Paiva, R.B.; Gordo, L.S.; Neves, A. Diet and feeding strategy of the forkbeard Phycis phycis (Pisces: Phycidae) from the Portuguese continental coast. J. Mar. Biol. Assoc. U. K. 2017, 98, 1–9. [Google Scholar] [CrossRef]
- Ambrose, R.F.; Nelson, B.V. Predation by Octopus vulgaris in the Mediterranean. Mar. Ecol. 1983, 4, 251–261. [Google Scholar] [CrossRef]
- Suuronen, P.; Chopin, F.; Glass, C.; Løkkeborg, S.; Matsushita, Y.; Queirolo, D.; Rihan, D. Low impact and fuel efficient fishing—Looking beyond the horizon. Fish. Res. 2012, 119–120, 135–146. [Google Scholar] [CrossRef]
- Kroodsma, D.A.; Mayorga, J.; Hochberg, T.; Miller, N.A.; Boerder, K.; Ferretti, F.; Wilson, A.; Bergman, B.; White, T.D.; Block, B.A.; et al. Tracking the global footprint of fisheries. Science 2018, 359, 904–908. [Google Scholar] [CrossRef] [Green Version]
- Vasilakopoulos, P.; Maravelias, C.D. A tale of two seas: A meta-analysis of crustacean stocks in the NE Atlantic and the Mediterranean Sea. Fish Fish. 2016, 17, 617–636. [Google Scholar] [CrossRef]
- FAO. Voluntary Guidelines for Securing Sustainable Small-Scale Fisheries in the Context of Food Security and Poverty Eradication; Food and Agriculture Organization of the United Nations: Rome, Italy, 2015; 20p. [Google Scholar]
- Malta Medfish4Ever Declaration. Malta MedFish4Ever Ministerial Declaration Strengthening Fisheries Governance in the Mediterranean. Available online: https://ec.europa.eu/fisheries/sites/fisheries/files/2017–03–30-declaration-malta.pdf (accessed on 7 April 2017).


| Landings (kg) | Value (EUR) | |
|---|---|---|
| Target Species Plesionika narval | 999.47 | 14,252 |
| Incidental catch | 479.98 | 4737.50 |
| Chordata | 326.18 | 3424 |
| Mollusca | 82.80 | 580 |
| Arthropoda | 71.00 | 733.5 |
| Plesionika edwardsii | 70.15 | 701.50 |
| Total Catch and Value | 1612.80 | 18,989.5 |
| Discards | 133.35 | |
| Fish | 105.27 | |
| Crustacea | 25.24 | |
| Echinodermata | 2.84 |
| Taxonomic Classification | IUCN | Karpathos | Nisyros | Symi | Tilos | Halki |
|---|---|---|---|---|---|---|
| Arthropoda | 4294 (25.81) | 2974 (17.36) | 2541 (16.01) | 3375 (19.04) | 1520 (9.50) | |
| Malacostraca | ||||||
| Dardanus arrosor d | NE | 32 (0.48) | 18 (0.14) | 51 (0.63) | 41 (0.22) | 13 (0.14) |
| Dardanus calidus d | NE | 73 (1.04) | 42 (0.55) | 18 (0.13) | 36 (0.38) | 6 (0.04) |
| Galathea strigose d | NE | 2 (0.03) | - | - | - | - |
| Gonioinfradens paucidentatus d | NE | 1 (0.02) | 11 (0.15) | 2 (0.03) | 2 (0.08) | - |
| Homola barbata d | NE | 298 (1.90) | 232 (1.31) | 347 (2.29) | 540 (3.40) | 139 (1.04) |
| Macropodia rostrata d | NE | 38 (0.14) | 41 (0.10) | 77 (0.22) | 77 (0.22) | 48 (0.11) |
| Maja crispate d | NE | 1 (0.05) | 1 (0.05) | - | - | - |
| Maja squinado d | NE | - | - | 1 (0.11) | - | 1 (0.11) |
| Munida curvimana d | NE | 4 (0.02) | 4 (0.02) | 9 (0.05) | 13 (0.07) | 1 (<0.01) |
| Necora puber d | NE | 36 (0.35) | 36 (0.31) | 14 (0.18) | 12 (0.13) | - |
| Palinurus elephas i | VU | - | - | 1 (1.00) | - | - |
| Paractaea monodi d | NE | 1 (0.19) | - | - | - | - |
| Paragalene longicrura d | NE | 2 (0.05) | 1 (0.04) | 1 (0.05) | - | - |
| Plesionika edwardsii i | NE | 3806 (21.54) | 2588 (14.69) | 2020 (11.31) | 2555 (14.54) | 1411 (8.05) |
| Scyllarides latus i | DD | - | - | 1 (0.01) | - | - |
| Chordata | 907 (53.40) | 648 (45.25) | 1082 (46.02) | 911 (47.35) | 606 (32.49) | |
| Actinopterygii (Fish) | ||||||
| Anthias anthias d | LC | 12 (0.35) | 4 (0.10) | 40 (1.03) | 10 (0.25) | 35 (0.77) |
| Apogon imberbis d | LC | - | - | - | - | 3 (0.10) |
| Balistes capriscus d | VU | - | - | 4 (0.20) | - | - |
| Chromis chromis d | LC | 10 (0.19) | 1 (0.02) | 6 (0.25) | - | - |
| Conger conger i | LC | 3 (2.10) | 4 (2.60) | 2 (1.30) | - | 2 (1.70) |
| Coris julis d | LC | 487 (5.26) | 326 (3.53) | 624 (6.46) | 563 (5.95) | 304 (3.60) |
| Diplodus annularis i | LC | - | 1 (0.30) | 1 (0.30) | 1 (0.18) | - |
| Diplodus puntazzo i | LC | - | 1 (0.14) | - | - | - |
| Diplodus sargus sargus i | LC | - | - | - | 2 (0.35) | - |
| Diplodus vulgaris i | LC | 1 (0.30) | 2 (0.70) | 2 (0.60) | - | - |
| Epinephelus aeneus i | NT | - | - | - | 1 (1.20) | - |
| Epinephelus marginatus i | VU | - | - | 1 (0.50) | - | 2 (0.80) |
| Labrus viridis i | VU | - | - | - | 1 (0.80) | - |
| Muraena Helena d | LC | 8 (4.32) | 10 (8.80) | 4 (3.05) | 3 (2.10) | 9 (5.08) |
| Pagellus acarne i | LC | - | 1 (0.10) | 5 (0.55) | - | - |
| Pagrus pagrus i | LC | 15 (3.30) | 21 (4.60) | 24 (7.00) | 22 (4.85) | 8 (2.01) |
| Phycis phycis i | LC | 53 (24.75) | 30 (14.83) | 18 (9.00) | 46 (21.01) | 19 (9.62) |
| Pteragogus pelycus d | LC | - | 1 (0.08) | 1 (0.08) | - | - |
| Sargocentron rubrum d | LC | - | - | 1 (0.04) | - | 1 (0.15) |
| Scorpaena notata i | LC | 1 (0.05) | 2 (0.18) | 3 (0.50) | 1 (0.05) | - |
| Scorpaena scrofa i | LC | 2 (0.60) | - | 1 (0.04) | - | - |
| Serranus cabrilla i | LC | 298 (10.45) | 194 (6.70) | 291 (11.28) | 249 (8.94) | 204 (7.59) |
| Serranus hepatus i | LC | 9 (0.65) | 6 (0.20) | 12 (0.45) | 3 (0.10) | 3 (0.45) |
| Serranus scriba i | LC | 6 (0.26) | 38 (1.51) | 34 (1.40) | 5 (0.20) | 10 (0.26) |
| Siganus luridus i | NE | - | - | 2 (0.18) | - | - |
| Siganus rivulatus i | LC | - | - | 1 (0.01) | - | - |
| Sparisoma cretense i | LC | - | - | 2 (0.80) | 1 (0.60) | 3 (0.45) |
| Sparus aurata i | LC | - | 2 (0.49) | - | - | - |
| Spondyliosoma cantharus i | LC | 1 (0.74) | 1 (0.08) | 1 (0.40) | 2 (0.70) | - |
| Stephanolepis diaspros d | NE | - | 2 (0.23) | - | - | - |
| Symphodus mediterraneus d | LC | - | 1 (0.70) | 1 (0.70) | - | - |
| Thalassoma pavo d | LC | 1 (0.08) | - | - | 1 (0.06) | 2 (0.30) |
| Xyricthys novacula d | LC | - | - | 1 (0.08) | - | - |
| Echinodermata | 27 (0.31) | 46 (0.32) | 15 (0.11) | 37 (0.27) | 5 (0.05) | |
| Asteroidea | ||||||
| Echinaster sepositus d | NE | 3 (0.02) | 4 (0.03) | - | 1 (<0.01) | - |
| Hacelia attenuate d | NE | 1 (0.03) | 1 (0.03) | - | - | - |
| Peltaster placenta d | NE | - | - | 2 (0.03) | 2 (0.02) | - |
| Echinoidea | ||||||
| Cidaris cidaris d | NE | 1 (0.01) | 1 (0.01) | - | - | - |
| Stylocidaris affinis d | NE | 22 (0.24) | 40 (0.24) | 13 (0.08) | 34 (0.25) | 5 (0.05) |
| Mollusca | 10 (7.49) | 13 (9.70) | 16 (11.10) | 8 (3.85) | 10 (9.30) | |
| Cephalopoda | ||||||
| Eledone cirrhosa i | NE | - | - | 1 (0.02) | - | 2 (1.55) |
| Octopus vulgaris i | NE | 10 (7.49) | 13 (9.70) | 15 (10.96) | 8 (3.75) | 8 (7.85) |
| Fixed | Random | |||
|---|---|---|---|---|
| Number of Species | Season | Location | Pairwise Comparisons of Fixed Effect Levels | |
| Bycatch | Incidental catch | + | - | A vs. S; A vs. W; Sp. vs. W; S vs. W |
| Discards | + | - | ||
| Phyla | Chordata (fish) | + | - | A vs. S; A vs. S; A vs. W; Sp. vs. A; Sp. vs. W; S vs. W |
| Echinodermata | + | - | A vs. W; Sp. vs. S; Sp. vs. W; S vs. W | |
| Arthropoda | - | - | ||
| Mollusca | - | - |
| Fixed | Random | ||
|---|---|---|---|
| Density | Season | Location | Pairwise Comparisons of Fixed Effect Levels |
| Incidental catch | + | - | A vs. W; Sp. vs. W; S vs. W |
| Discards | + | - | W vs. all other seasons |
| P. narval | + | - | Sp. vs. A; Sp. vs. S; Sp. vs. W |
| Chordata (Fish) | + | - | A vs. Sp.; A vs. S; Sp. vs. A; Sp. vs. W; S vs. W |
| Echinodermata | + | - | W vs. all other seasons |
| Arthropoda | - | - | |
| Mollusca | - | - |
| Fixed | Random | ||
|---|---|---|---|
| Biomass | Season | Location | Pairwise Comparisons of Fixed Effect Levels |
| Incidental catch | + | - | W vs. A; W vs. Sp.; W vs. S |
| Discards | - | - | |
| P. narval | + | - | A vs. Sp.; A vs. S; Sp. vs. S; Sp. vs. W; S vs. A |
| Chordata (fish) | + | - | Sp. vs. A; Sp. vs. W; Sp. vs. S; W vs. S |
| Echinodermata | + | - | W vs. A; W vs. Sp.; W vs. S |
| Arthropoda | + | - | Sp. vs. A; Sp. vs. S; Sp. vs. W |
| Mollusca | - | - |
| Fixed | Random | ||
|---|---|---|---|
| Variable | Season | Location | Pair–wise comparisons of fixed effect levels |
| Biomass ratio of incidental catch to target species | - | - | |
| Revenues | + | - | Sp. vs. A.; Sp. vs. W.; W. vs. A.; W. vs. S. |
Publisher’s Note: MDPI stays neutral with regard to jurisdictional claims in published maps and institutional affiliations. |
© 2022 by the authors. Licensee MDPI, Basel, Switzerland. This article is an open access article distributed under the terms and conditions of the Creative Commons Attribution (CC BY) license (https://creativecommons.org/licenses/by/4.0/).
Share and Cite
Kalogirou, S.; Dimitriadis, C.; Maravelias, C.D.; Poursanidis, D.; Margaritis, M.; Miliou, H.; Pihl, L. Bycatch Dynamics from a Small-Scale Shrimp Trap Fishery in the Mediterranean Sea. Diversity 2022, 14, 292. https://0-doi-org.brum.beds.ac.uk/10.3390/d14040292
Kalogirou S, Dimitriadis C, Maravelias CD, Poursanidis D, Margaritis M, Miliou H, Pihl L. Bycatch Dynamics from a Small-Scale Shrimp Trap Fishery in the Mediterranean Sea. Diversity. 2022; 14(4):292. https://0-doi-org.brum.beds.ac.uk/10.3390/d14040292
Chicago/Turabian StyleKalogirou, Stefanos, Charalampos Dimitriadis, Christos D. Maravelias, Dimitrios Poursanidis, Mihalis Margaritis, Helen Miliou, and Leif Pihl. 2022. "Bycatch Dynamics from a Small-Scale Shrimp Trap Fishery in the Mediterranean Sea" Diversity 14, no. 4: 292. https://0-doi-org.brum.beds.ac.uk/10.3390/d14040292