Article

Bacterial and Archaeal Water and Sediment Communities of Two Hot Spring Streams in Tengchong, Yunnan Province, China

1
Bioengineering Center, College of Life Science and Technology, Huazhong Agricultural University, Wuhan 430070, China
2
State Key Laboratory of Agricultural Microbiology, Huazhong Agricultural University, Wuhan 430070, China
*
Authors to whom correspondence should be addressed.
Submission received: 30 March 2022 / Revised: 28 April 2022 / Accepted: 10 May 2022 / Published: 11 May 2022
(This article belongs to the Special Issue Diversity in Extreme Environments)

Abstract

:
In Tengchong County, springs with wide physicochemical diversity provide a multitude of niches for extremophilic microorganisms. In this study, eight middle-low temperature spring sites along two continuous small streams with low water flow and slow speed in the fourth geothermal experience area of Rehai scenic spot were chosen, and geochemical characteristics and HTS of the 16S rRNA V4 region were used to analyze the prokaryotic community structure and diversity in the water and sediment of these sites. The effect of environmental factors on the microbial communities was explored via redundancy analysis (RDA). All sediment samples had higher alpha diversity values than the corresponding water samples. Twenty-five phyla were annotated; Euryarchaeota, Crenarchaeota, Aquificae, Thermotogae and Proteobacteria were the dominant phyla, accounting for 95.31% of all prokaryotes, with relative abundances above 5%. Aquificae dominated in water samples, while Euryarchaeota dominated in sediment samples. RDA indicated that temperature was the main factor influencing the microbial communities in the two streams. The study expands the current understanding of the microbiology of Tengchong hot springs and provides a basis for further mining of hot spring microbial and functional gene resources.

1. Introduction

Tengchong County, located in Baoshan city, Yunnan Province, southwestern China, is known for its geothermal features [1,2]. Tectonically, the Tengchong volcanic area is situated in the mini-Tengchong block located in the eastern collision boundary between India and Eurasia [3]. As one of the most active areas of geothermal energy in the world, it has many hot springs with different hydrothermal characteristics, such as hydrothermal explosion pits, geysers, fumaroles and boiling springs [4]. In terms of diversity and scale, the Tengchong hot springs are comparable to the geothermal systems of Yellowstone National Park (YNP) [5], Kamchatka, Russia [6] and Nigorikawa, Japan [7]. In Tengchong County, a wide physicochemical diversity of springs (temperature ranging from 55 °C to 97 °C; pH from ≤1.8 to ≥9.3) provides a multitude of niches for extremophilic microorganisms [8].
The 16S rRNA gene high-throughput sequencing (HTS) approach was first applied to assess the bacterial diversity of soils in 2007 [9]. Soil DNA was extracted, and pyrosequencing was performed following the amplification of the hypervariable V9 region of the highly conserved 16S rRNA gene [9]. In 16S tag sequencing experiments, primer specificity introduces a bias as no primer pair is universal [10], and many reports have documented that primer choice is a crucial factor in the design of a study [11,12,13,14]. Tremblay et al. [10] found that HTS of the 16S rRNA V4 region showed the most remarkable similarity to community profiles determined by metagenome shotgun sequencing. In the Tengchong geothermal area, various studies have focused on the cultivation, identification, basic physiology, microbial community structure and biotechnological potential of thermophilic microorganisms [9]. Hou et al. [2] reported a comprehensive, cultivation-independent census of microbial communities in 37 samples collected from both the Ruidian and Rehai locations, encompassing sites ranging in temperature from 55.1 to 93.6 °C, pH from 2.5 to 9.4 and mineralogy from silicates in Rehai to carbonates in Ruidian using pyrosequencing of the V4–V8 region of the 16S rRNA gene. Wang et al. [15] studied the temporal changes of microbial communities in Tengchong hot springs with geochemical variations by using the V4–V8 region of the 16S rRNA gene. Jiang et al. [16] chose Zhenzhuquan in the Tengchong geothermal area, a representative acid sulfate hot spring with low chloride, to study arsenic geochemistry and microbial community structure using HTS of the V4 region of the 16S rRNA gene from water and sediment samples. However, there have been few studies focusing on microbial communities of spring sites in small watersheds with middle-low temperature.
In our study, eight hot spring sites with temperature ranging from 34 °C to 63 °C along two hot spring streams (X and Y) in the fourth geothermal experience area of Rehai, Tengchong County, Yunnan Province, were selected. These streams are located near Dagunguo [2], with water features of low water flow and slow speed. Microbial community differences in the two types of streams were explored via HTS of the V4 region of the 16S rRNA gene from water and sediment samples.

2. Materials and Methods

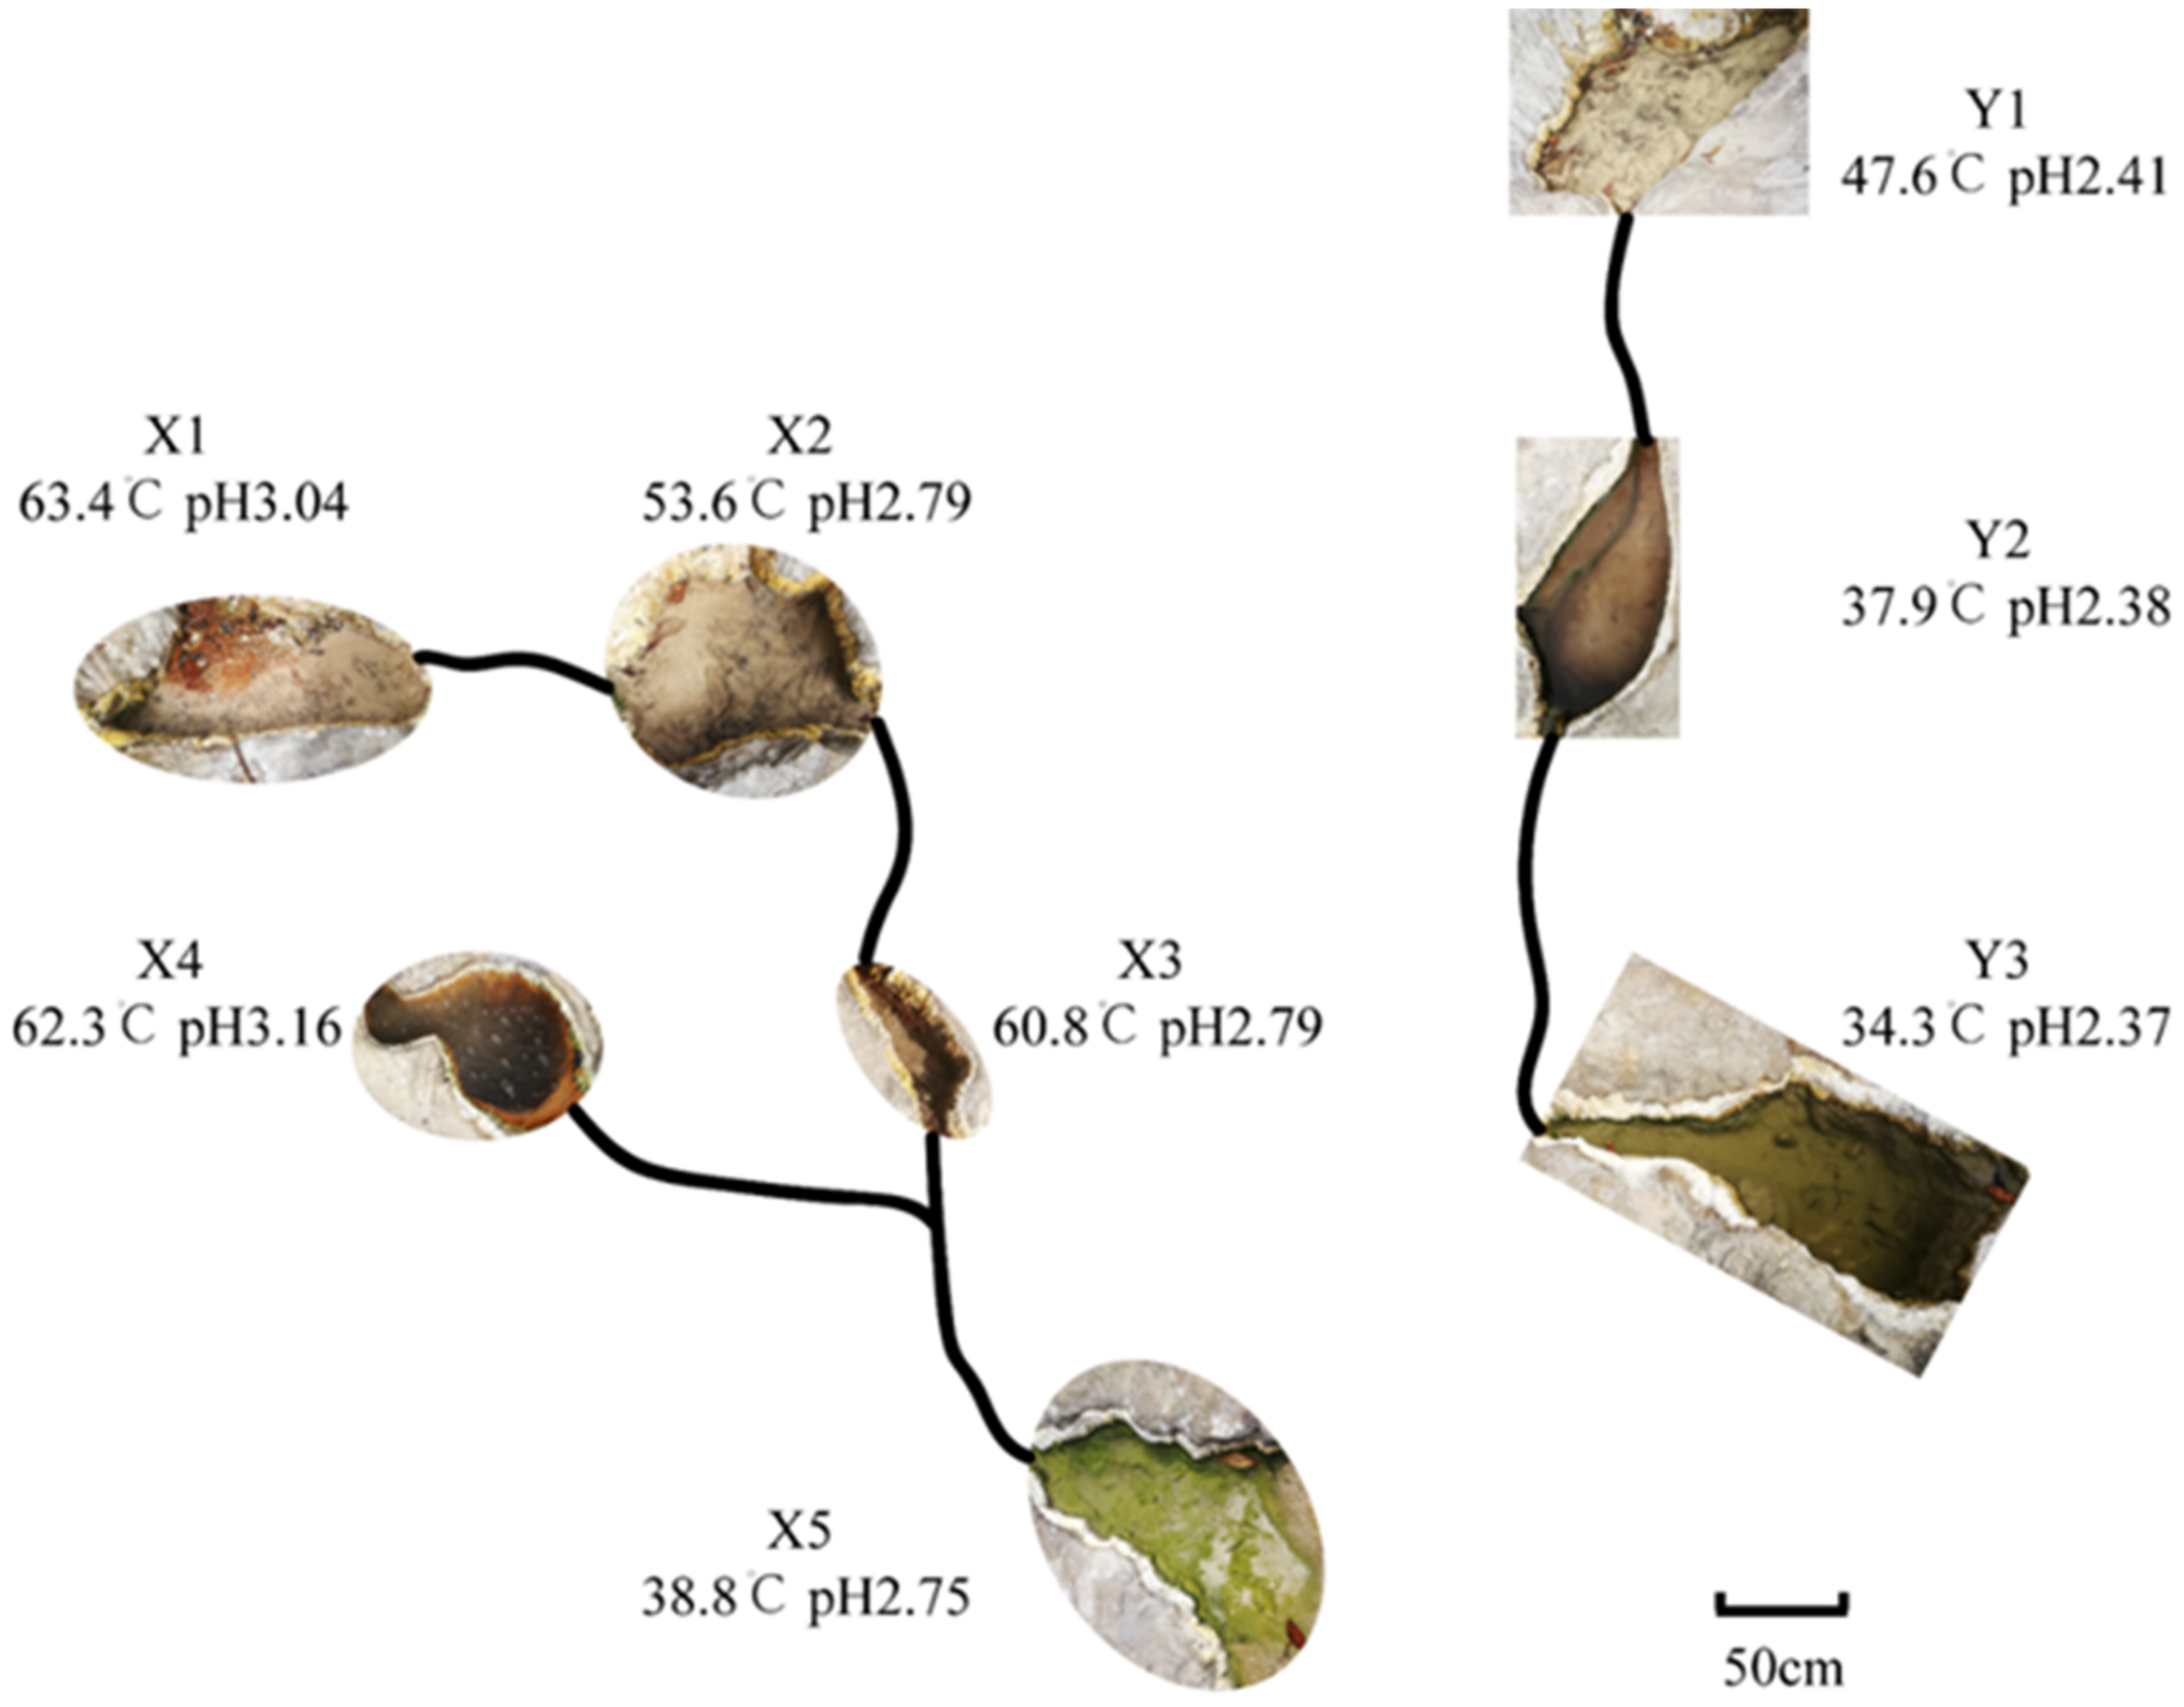
2.1. Sample Collection

As shown in Figure 1, on stream X, the water flows from the tiny hot spring X1 to X3, merges with another branch from the tiny hot spring X4 and flows to X5. On stream Y, the water flows directly from the little hot spring Y1 to Y3. The corresponding temperature and pH from the eight sites were measured (Figure 1). Three biological replicates were collected of the water and sediment at each site (namely, X1.W.1, X1.W.2, X1.W.3…Y3.W.1, Y3.W.2, Y3.W.3 and X1.S.1, X1.S.2, X1.S.3…Y3.S.1, Y3.S.2, Y3.S.3). For each water sample, 20 L water was filtered through a filter (0.22 mm pore size, 25 mm diameter, Millipore, Burlington, MA, USA) to collect biomass. The filters of water together with sediment samples from the eight sites were collected, sealed and stored in a 50 mL sterile centrifuge tube. These tubes were quickly stored on dry ice and transported to a −80 °C refrigerator in the laboratory for temporary storage.

2.2. DNA Extraction and Sequencing

The DNA of the water and sediment samples was extracted using a MOBIO PowerSoil® DNA Isolation Kit (MO BIO, Carlsbad, CA, USA) according to the manufacturer’s protocol. The V4 region of the 16S rRNA gene was amplified with the universal primers 515F (5′-GTGYCAGCMGCCGCGGTAA-3′) and 806R (5′-GGACTACNVGGGTWTCTAAT-3′), modified from Li et al. [17]. PCRs containing 25 μL 2× Premix Taq (Takara Biotechnology, Dalian Co., Ltd., Dalian, China), 1 μL of each primer (10 mM) and 3 μL DNA (20 ng/μL) template in a volume of 50 µL were amplified via the following thermocycling program: 5 min at 94 °C for initialization; 30 cycles of 30 s denaturation at 94 °C, 30 s annealing at 52 °C and 30 s extension at 72 °C; followed by a 10 min final elongation at 72 °C. Amplicons were purified with an EZNA Gel Extraction Kit (Omega, Dallas, TX, USA).
Sequencing libraries were generated using the NEBNext® Ultra™ DNA Library Prep Kit for Illumina® (New England Biolabs, Ipswich, MA, USA) following the manufacturer’s recommendations, and index codes were added. The library quality was assessed on the Qubit 2.0 Fluorometer (Thermo Scientific, Waltham, MA, USA) and Agilent Bioanalyzer 2100 system. Finally, the library was sequenced on an Illumina HiSeq 2500 platform, and 250 bp paired-end (PE) reads were generated. All 16S rRNA amplicon sequencing data have been deposited in the CNGB Sequence Archive (https://db.cngb.org/cnsa/ (accessed on 6 January 2022)) under project accession number CNP0002580.

2.3. Processing of Sequence Data

Quality filtering of the sequences obtained from the HiSeq 2500 sequencing platform was performed under specific filtering conditions to obtain high-quality clean reads according to the Trimmomatic V0.33 [18] quality-controlled process. PE reads were assigned to each sample based on their unique barcode and primer via Mothur V1.35.1 (http://www.mothur.org (accessed on 10 April 2018)), after which the barcodes and primers were removed, and the PE clean reads were obtained. Then, these clean reads were merged using FLASH V1.2.11 [19] according to the overlapping relationship of the PE reads. At least 10 of the reads overlapped the reads generated from the opposite end of the same DNA fragment, the maximum allowable error ratio of the overlap region was 0.2 and the spliced sequences were called raw tags. After quality filtering was performed by Trimmomatic software, effective clean tags were used for operational taxonomic unit (OTU) clustering.
De novo OTU clustering was performed with USEARCH V8.0.1517 (http://www.drive5.com/usearch/ (accessed on 12 April 2018)). Sequences with ≥97% similarity were assigned to the same OTU. Singleton OTUs were removed, and a representative sequence for each OTU was screened for species annotation in the GreenGene database (http://greengenes.secondgenome.com/ (accessed on 15 April 2018)) by the assign_taxonomy.py script (http://qiime.org/scripts/assign_taxonomy.html (accessed on 15 April 2018)) in QIIME with a confidence threshold to default of 0.5 or more.

2.4. Statistical Analysis

The alpha diversity based on the Shannon index for each sample and the beta diversity based on weighted UniFrac distances were calculated via QIIME (V1.9.1) and displayed with R software (V2.15.3) [20]. Principal coordinate analysis (PCoA) was performed to obtain principal coordinates and to visualize the complex; these findings were displayed by using QIIME (V1.9.1) and the ggplot2 package in R software. Redundancy analysis (RDA) and parameter correlation were carried out using the R programming language [20] and the Vegan package [21].

3. Results

3.1. Sample Characteristics

Two types of streams with low water flow and slow speed were selected. For stream X, samples were collected from the branches and confluence, while for stream Y, samples were collected upstream and downstream. Temperature and pH ranged from 38.3 to 63.4 °C and 2.75 to 3.16 in stream X and 34.3 to 47.6 °C and 2.37 to 2.41 in stream Y, respectively (Figure 1). These findings indicate that regardless of temperature or pH, the fluctuation in the X stream was more remarkable than that in the Y stream. As the water flowed, the temperature decreased, and the color of the sediments gradually turned to green.

3.2. Microbial Community Composition and Diversity

A total of 5,537,604 clean reads were obtained from the 48 samples, and the clean tags ranged from 86,435 to 136,671, with an average length of 253 bp (Additional file: Table S1). The largest number of OTUs was observed in the sediment samples from the X1 site, with an average of 1531, while the smallest number of OTUs was observed in the sediment samples from the Y2 site, with an average of 485. Interestingly, these results indicated that the sediment samples had more OTUs than the water samples in stream X and stream Y, except at site Y2 (Supplementary Materials Table S1). Figure 2 shows the distribution of OTUs across the streams and sample types. A total of 115 and 238 OTUs and 146 and 207 OTUs were shared across all the sediment and water samples in streams X and Y, respectively (Figure 2). Regarding the proportions of shared OTUs, the proportion of shared OTUs was higher in the water samples than in the sediment samples from two streams. Notably, in stream X, the proportion of shared OTUs in the water samples was approximately three times higher than that in the sediment samples.
In addition, all the sediment samples had higher average alpha diversity values than the corresponding water samples (water vs. sediment, X1: 3.098 vs. 3.585, X2: 2.86 vs. 3.145, X3: 2.769 vs. 3.154, X4: 2.799 vs. 3.431, X5: 4.489 vs. 4.803, Y1: 2.643 vs. 3.474, Y2: 3.095 vs. 3.218, Y3: 2.562 vs. 3.446) (Figure 3A), and the samples from the X5 site had the highest microbial diversity. In the beta diversity analyses (Figure 3B), the eight water samples clustered together in the left lower quadrant, especially the X3 and X4 samples and the X2 and X5 samples. Although the sediment samples were more scattered, the Y2, X5 and Y3 sediment samples clustered tightly.

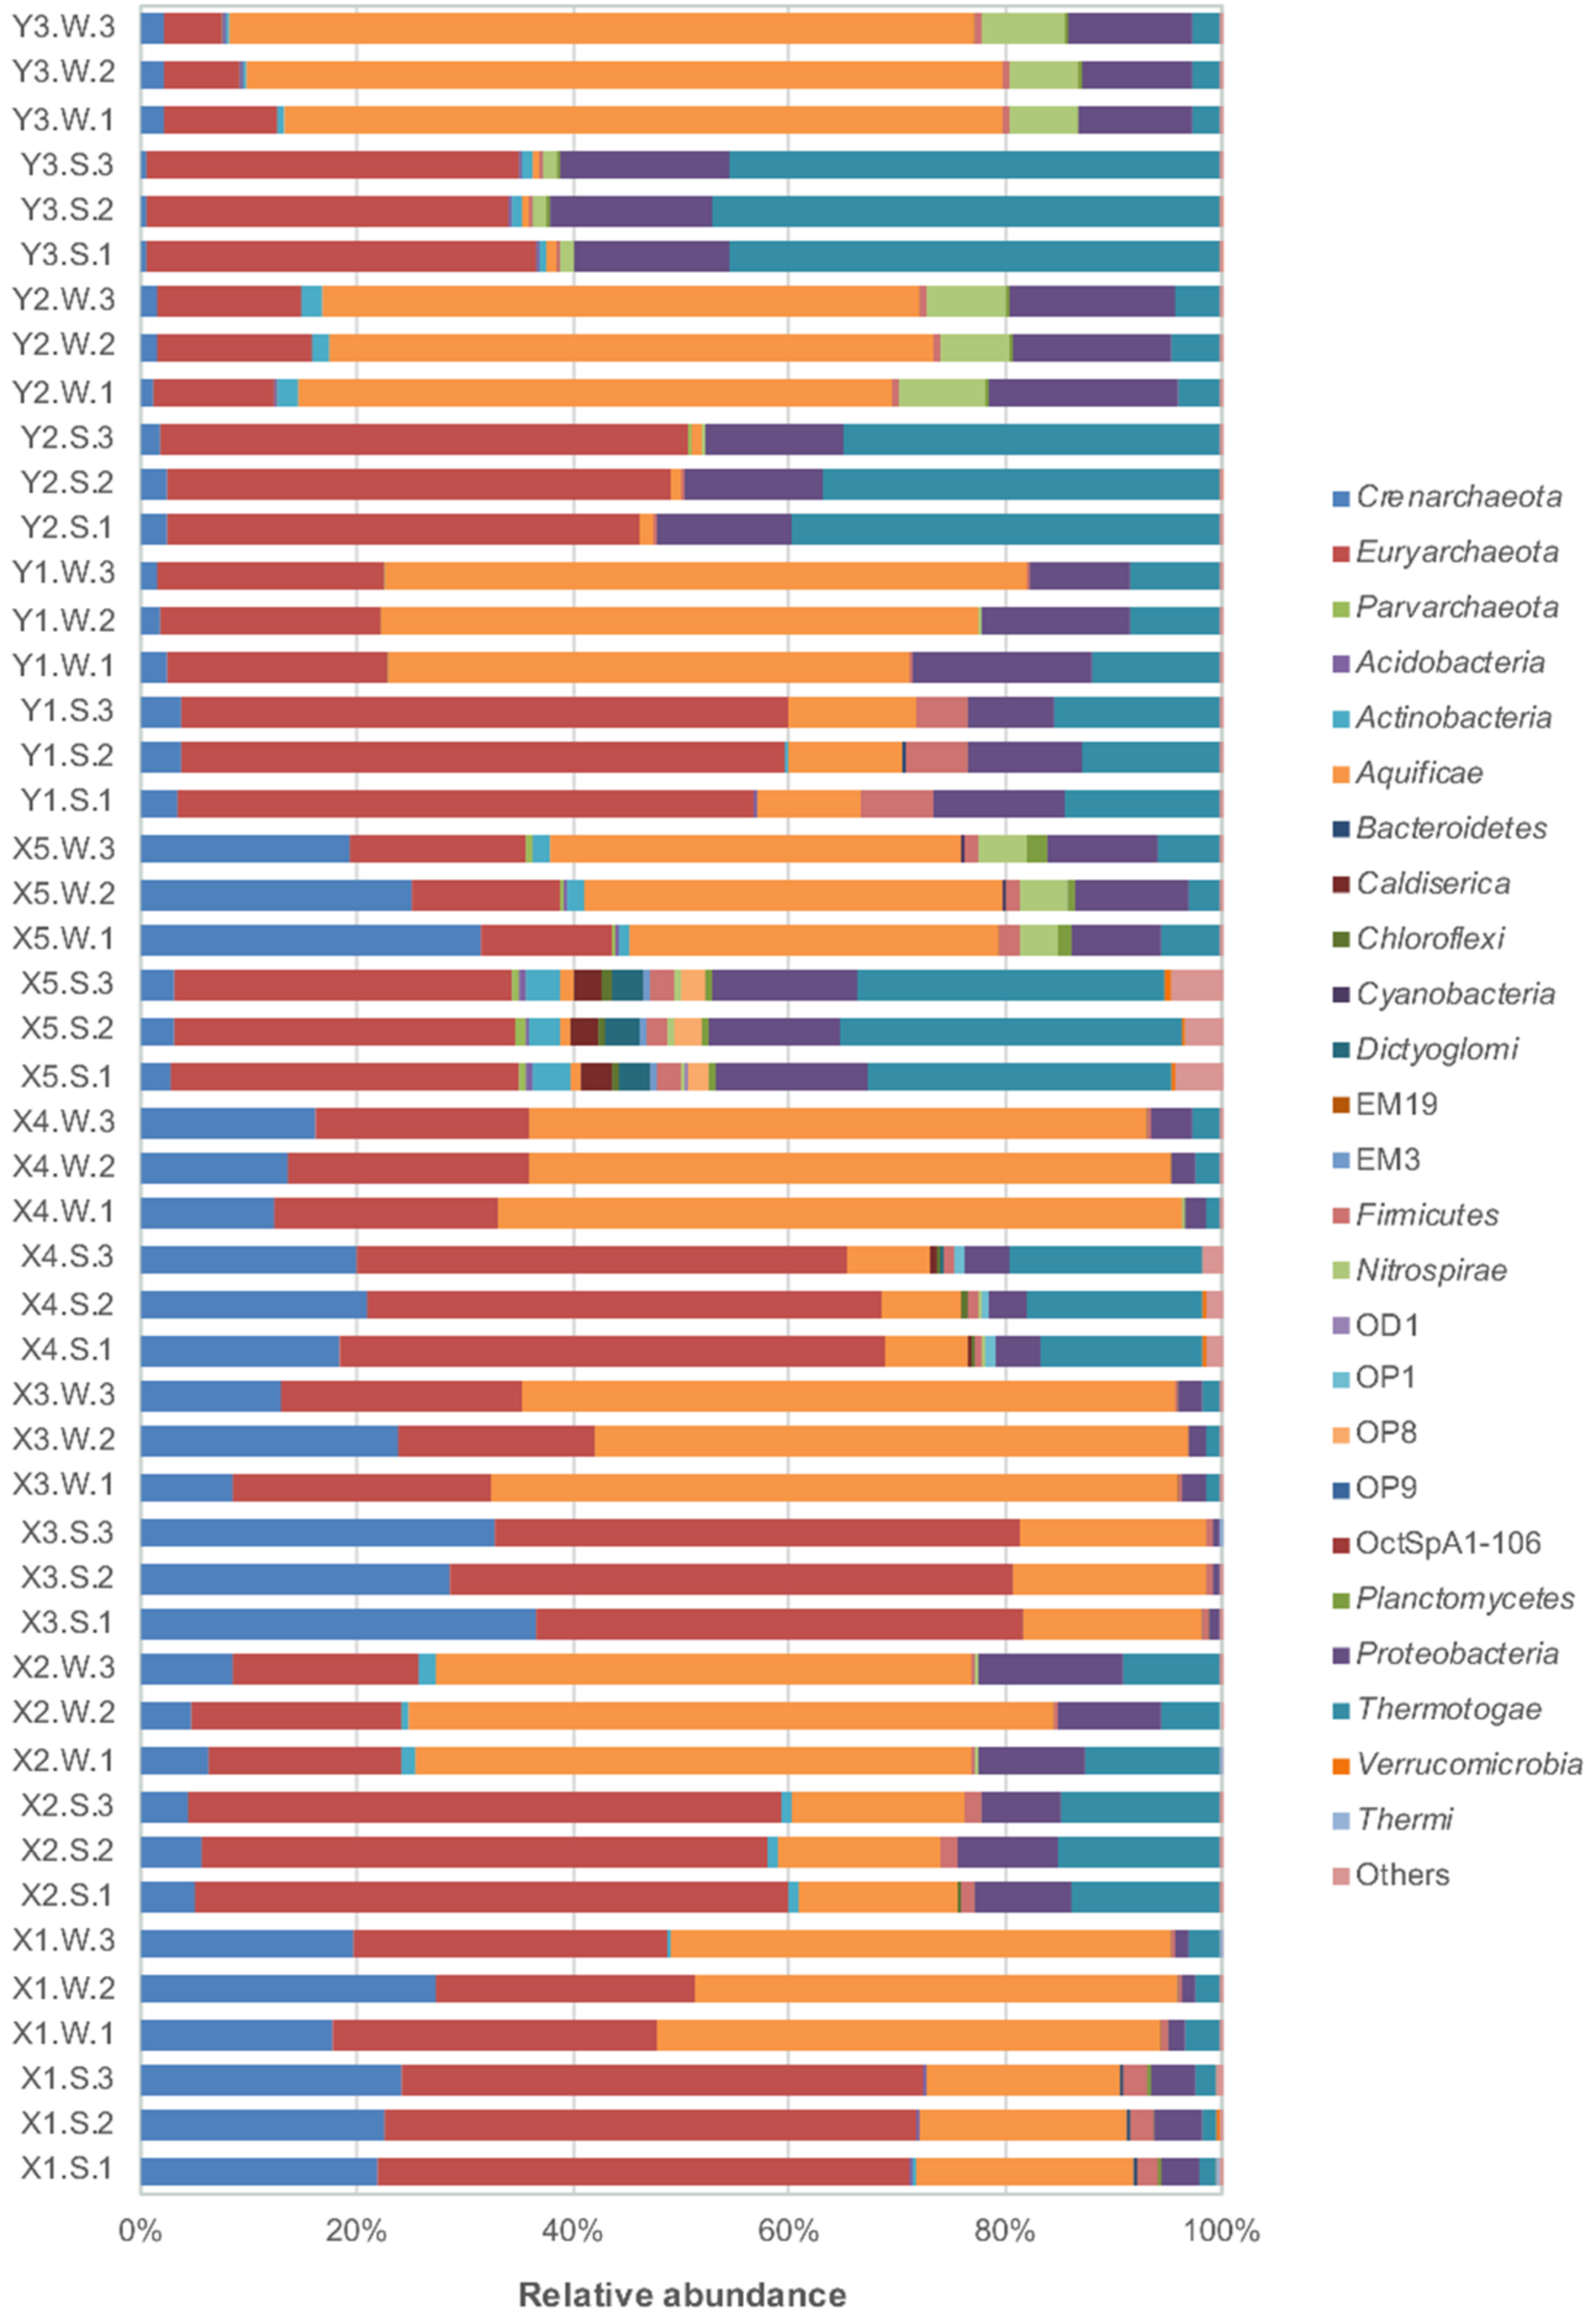
3.3. Bacterial Taxonomic Composition Analysis

Species annotation showed that bacterial OTUs (81.87%) were dominant and that archaeal OTUs accounted for 17.95% of the total. The relative abundances at the phylum level of all 48 samples are shown in Figure 4. The taxonomic compositions of the three biological replicates for each type of sample at each site were relatively close. Furthermore, the OTU annotation numbers for the three biological replicates from kingdom to genus were quite consistent (Supplementary Materials Figure S1). A total of 25 phyla were annotated, among which the names of 3 archaeal phyla and 15 bacterial phyla were determined. Euryarchaeota, Crenarchaeota, Aquificae, Thermotogae and Proteobacteria were the dominant phyla with relative abundances above 5%, accounting for 95.31% of the total prokaryotes. Aquificae dominated in the water samples, while Euryarchaeota dominated in most sediment samples.
For stream X, five sampling points, except confluence site X5, the compositions of bacteria and archaea between the water and sediment samples were quite different (Figure 4). In addition, the top three highest relative abundances of bacterial phyla in the water samples were Aquificae (34.06–63.48%), Proteobacteria (1.06–13.66%) and Thermotogae (1.33–12.71%). The sediment groups with the highest relative abundances also belonged to the three phyla mentioned above with different ranks, namely, Aquificae (1.05–20.20%), Thermotogae (0.02–31.84%) and Proteobacteria (0.84–14.11%). For stream Y, the top three bacterial phyla in the water samples were Aquificae (47.94–69.82%), Proteobacteria (9.22–17.59%) and Thermotogae (2.49–11.90%). In contrast, the top three bacterial phyla in the sediment samples were Aquificae (0.60–11.59%), Proteobacteria (8.09–15.67%) and Nitrospirae (0.01–1.37%). In the upstream sediment samples, four phyla, Aquificae, Proteobacteria, Thermotogae and Firmicutes, were dominant, accounting for approximately 40% of the total. However, in the sediment samples of the middle and lower reaches of stream Y, only two phyla, Thermotogae and Proteobacteria, were considered primary.
At the order level, the OTUs were distributed across 25 orders, with the most abundant belonging to Aquificales, which exhibited an average relative abundance of up to 54.21% in all the water samples, followed by V5 (mean 12.25%), Desulfurellales (mean 4.11%) and Rhodospirillales (mean 3.96%) (Figure 5A). There were 308 families belonging to 22 bacterial phyla, and the top five families were Aquificaceae (0.60–69.82%), Desulfurellaceae (0.006–11.78%), Acetobacteraceae (0.34–6.66%), Leptospirillaceae (0.001–7.95%) and Acidithiobacillaceae (0.005–5.92%) (Supplementary Materials Table S2). At the genus level, hierarchical clustering of the heatmap was performed based on the Euclidian similarity index of the relative abundance in top 30 observed genera (Figure 5B). The results showed that 27 genera belonged to bacteria and three genera were archaea. From right to left, the water samples from Y2, Y3 and X5 clustered together, depicting similar bacterial and archaeal communities. Another cluster included water samples from sites X1, X3 and X4 and sediment samples from sites X1 and X3, which indicated that the water and sediment samples of sites X1 and X3 had similar microbial communities. Additionally, the water samples from sites X2 and Y1 clustered together, while the sediment samples from sites Y2 and Y3 clustered together. Moreover, the sediment samples of sites Y1 and X5 were separate clusters.

3.4. Archaeal Taxonomic Composition Analysis

The OTUs were distributed among three archaeal phyla, Euryarchaeota (5.39–54.98%), Crenarchaeota (0.41–36.58%) and Parvarchaeota across all the samples (Figure 4). Except for the water samples at confluence site X5, the relative abundances of Euryarchaeota were higher than those of Crenarchaeota, with average values of 31.9% and 11.1%, respectively. At the order level, there were five orders, with the most abundant belonging to Thermoplasmatales (up to 53.64%) in the sediment sample upstream of stream Y and Sulfolobales (0.011–20.798%) across all samples (Figure 5A). There were 28 families belonging to three archaeal phyla, and the most abundant families were Sulfolobaceae (mean 8.71%), A10 (mean 24.90%) and BSLdp215 (Supplementary Materials Table S2). Interestingly, the relative abundance of family A10 in all the sediments was higher than the mean value. In contrast, in family BSLdp215, only four sediment groups (X2, X5, Y1 and Y2) and one water group Y1 had higher relative abundances than the mean value. These two families belonged to Thermoplasmatales. In Figure 5B, the top 30 genera were illustrated in a heatmap, and three were archaeal genera, namely, Metallosphaera, Thermogymnomonas and Sulfophobococcus.

3.5. Effect of Environmental Factors on the Microbial Communities

Temperature and pH were two main factors assessed in the two streams, the effects of which were tested via RDA. Between the two canonical ordinates, RDA1 and RDA2, which were the linear combinations of the explanatory variables, RDA1 was far more critical than RDA2 in the four groups (Figure 6). In the sediment samples of stream Y, RDA1 explained 94.06% of the variation. Temperature and pH were positively correlated in the four groups and were the most highly correlated in the water samples of stream Y. In addition, temperature and pH had similar explanatory power to both RDA1 and RDA2 in this group. This result indicated that temperature and pH had similar explanatory power to RDA1, while the effect of temperature was primarily represented in RDA2 of the sediment group in stream Y. Therefore, temperature was the main factor influencing the community. In stream X, RDA1 was primarily explained by temperature (Figure 6A,B), and RDA2 only weighted 6.3% and 3.06%. Therefore, temperature was the main factor influencing the microbial community in streams X and Y.

3.6. Effect of Different Stream Sites on the Microbial Communities

According to the top 30 genera with the highest abundance, clustering of the samples was performed at different locations in the two streams. Each group, including more than three species, was selected and is shown in Figure 7. In stream X, there were four groups for the sediment sample and only two groups for the water sample, while in stream Y, there were three groups in either water or sediment samples. The greatest number of species that clustered to form the trend were found in the sediment samples in stream Y, while in stream X, the sediment and water groups had similar numbers of clustered species. Along the direction of the flow in stream X, the relative abundances of Desulfurella, Acidisphaera and Acidimicrobium exhibited similar trends, namely, increase-decrease-increase-increase, in water or sediment (Figure 7A,E). The relative abundances of Thermodesulfobium and Acidiphilium remained unchanged at the four stream sites in the upper and middle of stream X (Figure 7C,F). After the two branches merged, the relative abundances of Caldisericum, Thermoanaerobacterium, Thermodesulfovibrio and Thermodesulforhabdus increased in the sediment (Figure 7B). This indicates that these four genera were mainly from tributary X4. In stream Y, along the flow of the water, the largest cluster included 11 genera, which decreased at midstream and remained constant downstream (Figure 7G). Figure 7J shows that Acidisphaera, Acidithiobacillus, Leptospirillum and Thermus increased at midstream and decreased downstream, similar to the water or sediment samples of the stream X primary current (X1 to X3).

4. Discussion

The Earth is a substantial thermal reservoir, and extreme ecosystems such as hot springs that formed on the Earth’s surface by geothermal activities are considered to be the cradle of the origin of life and evolution [22]. Research on the physiological and biochemical functions and applications of extremophiles has been widely carried out worldwide, especially in Tengchong, Yunnan [2,6,8,16,17,23,24,25]. The related technologies and research results are commonly used in industry and environmental conservation, such as in the applications of thermostable enzymes [26] and bioleaching of electronic waste [27]. Microbial diversity research can aid in the discovery of species with potential applications. These studies focused on the structure and diversity of the microbial communities in water and sediments sample with different temperature and pH and geochemical variations. However, there are few studies in small watersheds with middle-low temperature, low water flow and slow speed. In this study, eight middle-low temperature (34.3 °C~63.4 °C) and acidic (pH 2.37~3.16) hot spring sites in two continuous small watersheds in the fourth geothermal experience area of Rehai scenic spot, Tengchong County, Yunnan Province, were selected to explore community structure and species diversity.
Euryarchaeota, Crenarchaeota, Aquificae, Thermotogae and Proteobacteria were the dominant phyla with relative abundances above 5%, accounting for 95.31% of the total prokaryotes. The bacterial phylum Aquificae dominated in the water samples, while the archaeal phylum Euryarchaeota dominated in the sediment samples. On average, the bacterial order Aquificales and the archaeal order Thermoplasmatales with relative abundances above 30% dominated in the water and sediment samples, respectively.
The Aquificae phylum is a diverse collection of bacteria that live in harsh environmental settings [28,29]. In the 16S rRNA gene trees, Aquificae species branch in the proximity of the phylum Thermotogae close to the archaeal-bacterial branch point [30,31]. Notably, many archaeal species live in ultrahigh temperature environments. Two genera of Aquificales, Hydrogenobacter and Hydrogenobaculum, are common in terrestrial geothermal environments and have been previously observed in YNP [32,33,34,35,36] and nine springs from both the Ruidian and Rehai locations in Tengchong [2]. Hou et al. [2] found that Hydrogenobacter and Hydrogenobaculum were abundant in high temperature (73.8~93.6 °C), circumneutral to alkaline pH (6.7~9.4) springs and low-temperature (55.1~64.5 °C), acidic (pH: 2.5~2.6) and sulfur-rich springs, respectively. Hydrogenobaculum was mainly dominant in sediment, with the highest relative abundance of close to 70% (Figure 7K) in the Y3 site of stream Y (34.3 °C, pH 2.37). Some members of Aquificales can grow heterotrophically; however, all members can fix CO2 using the reductive tricarboxylic acid (TCA) cycle. Hydrogenobaculum has the “B-type” reductive TCA cycle [37]. The genus-species designation Hydrogenobaculum acidophilus, isolated from a solfataric mud in Japan, can use CO2 as the sole carbon source [38]. Additional strains of the genus Hydrogenobaculum have been isolated. At YNP, an arsenite-oxidizing Hydrogenobaculum sp. strain H55 [39], thermoacidophilic Hydrogenobaculum sp. strain Y04AAS1 [40], and four closely related Hydrogenobaculum sp. isolates (≥99.7% 16S rRNA gene identity) have been isolated [41]. Hydrogenobaculum sp. T-6 can use both H2 and reduced S compounds as electron donors and was isolated in the Rehai Geothermal Field, Tengchong [42]. Thus, distinguishing species of the genus Hydrogenobaculum that carry out oxidation of fixed CO2, arsenite, H2 or reduced S compounds is an important research direction.
The phylum Euryarchaeota contains most species of Archaea, including methanogens often found in animal guts, Halobacteriaceae living in extremely high salt concentrations [43], and some hyperthermophilic aerobic and anaerobic archaea; there are also marine taxa. On the 16S rRNA phylogenetic tree, this phylum forms a monophyletic group. Thermoplasmatales is an order of the Euryarchaeota, and these microbes grow optimally at pH values below 2; additionally, most members of this order are thermophilic [44]. The most abundant Thermoplasmatales occurred in sediment samples upstream of stream X or Y (Figure 5A) at relatively higher temperatures in each stream (Figure 1). We found that the genus Thermogymnomonas dominated Thermoplasmatales, and it is monospecific at present; the type species is Thermogymnomonas acidicola. T. acidicola was isolated from a sample of solfataric soil collected from Ohwaku-dani, Hakone, Japan [45], which grows at temperatures in the range 38~68 °C (optimum, 60 °C) and pH 1.8~4.0 (optimum, pH 3.0). The growth environment of T. acidicola was similar to that of the two streams in this study.
The Crenarchaeota order Sulfolobales was abundant in stream X (Figure 5A) and at high-temperature, acidic and sulfur-rich sites in both water and sediment in Diretiyanqu of Tengchong [2].
The genus Metallosphaera of the order Sulfolobales was the most abundant Archaea in the two streams, while the dominant genus Sulfolobus at Diretiyanqu [2] was also distributed in acidic sulfataras at YNP and elsewhere [46]. In addition, the genus Thermogymnomonas of the order Thermoplasmata was also present in the top 30 genera (Figure 5B). Most members of the genus Metallosphaera have the ability to mobilize metals; Metallosphaera sedula [47,48], Metallosphaera prunae [49], Metallosphaera cuprina [50], Metallosphaera hakonensis [51] and Metallosphaera tengchongensis were isolated from muddy water samples of a sulfuric hot spring located in Tengchong County [52].
A previous study found that small volume flows may only be effective in recharging deep ground water with no direct contribution to soil water to a depth of 2 m [2]. Another study found that a much higher microbial diversity in sediment than in water may be related to long water residence time [53]. As the water flowed downward, the water samples of lower hot spring sites possessed more OTUs (Figure 2). The Venn diagrams (Figure 2) also made it clear that there were more OTUs jointly owned by water samples rather than sediment samples in each stream, and the sediment samples possessed more specific OTUs. According to the cluster in Figure 7, we can infer that also the water flow affected the microbial composition of spring sites downstream.

5. Conclusions

Similar to previous research, this study showed that temperature was the main factor influencing the microbial communities in two streams. In addition, water flow may also affect the Bacterial and Archaeal communities of the eight hot springs, and sediment samples had significantly higher alpha diversity values than the corresponding water samples. Of the twenty-five phyla annotated, Aquificae dominated in water samples, while Euryarchaeota dominated in sediment samples. The study expands the current understanding of the microbiology of Tengchong hot springs and provides a basis for further mining of hot spring microbial and functional gene resources.

Supplementary Materials

The following supporting information can be downloaded at: https://0-www-mdpi-com.brum.beds.ac.uk/article/10.3390/d14050381/s1, Figure S1. OTU number of all 48 samples at the six-taxa level. Different colors represent kingdom, phylum, class, order, family and genus; Table S1. Sequences reads and tag statistics of all 48 samples; Table S2. Relative abundance of microbial taxa at family level in various samples collected from the two streams.

Author Contributions

Conceptualization, N.P. and Y.L.; Data curation, J.L. and Z.Z.; Formal analysis, J.L.; Funding acquisition, J.L.; Investigation, Z.Z.; Methodology, S.Z. and Y.M.; Project administration, Y.L.; Resources, Z.Z.; Software, Z.Z.; Supervision, N.P.; Validation, H.X.; Visualization, J.L.; Writing—original draft, J.L.; Writing—review and editing, T.L. and N.P. All authors have read and agreed to the published version of the manuscript.

Funding

This research was supported by the National Natural Science Foundation of China, grant number 91751104 and the APC was funded by the Bioengineering Center, College of Life Science and Technology, Huazhong Agricultural University.

Institutional Review Board Statement

Not applicable.

Informed Consent Statement

Not applicable.

Data Availability Statement

Not applicable.

Conflicts of Interest

The authors declare no conflict of interest.

References

  1. Wang, F.; Peng, Z.; Chen, W.; Wang, Z.; Yang, J.; Zhang, Z.; Hu, Y. High-precision thermal ionization mass spectrometry dating of young volcanic rocks by using U-series method. Chin. Sci. Bull. 2000, 45, 83–87. [Google Scholar] [CrossRef]
  2. Hou, W.; Wang, S.; Dong, H.; Jiang, H.; Briggs, B.R.; Peacock, J.P.; Huang, Q.; Huang, L.; Wu, G.; Zhi, X.; et al. A comprehensive census of microbial diversity in hot springs of Tengchong, Yunnan Province China using 16S rRNA gene pyrosequencing. PLoS ONE 2013, 8, e53350. [Google Scholar] [CrossRef] [PubMed]
  3. Du, J.; Liu, C.; Fu, B.; Ninomiya, Y.; Zhang, Y.; Wang, C.; Wang, H.; Sun, Z. Variations of geothermometry and chemical-isotopic compositions of hot spring fluids in the Rehai geothermal field, Southwestern China. J. Volcanol. Geotherm. Res. 2005, 142, 243–261. [Google Scholar] [CrossRef]
  4. Kearey, P.; HongBing, W. Geothermal fields of China. J. Volcanol. Geotherm. Res. 1993, 56, 415–428. [Google Scholar] [CrossRef]
  5. Fournier, R.O. Geochemistry and dynamics of the Yellowstone National Park hydrothermal system. Annu. Rev. Earth Planet. Sci. 1989, 17, 13–53. [Google Scholar] [CrossRef]
  6. Kyle, J.E.; Schroeder, P.A.; Wiegel, J. Microbial silicification in sinters from two terrestrial hot springs in the Uzon Caldera, Kamchatka, Russia. Geomicrobiol. J. 2007, 24, 627–641. [Google Scholar] [CrossRef]
  7. Yoshida, Y. Geochemistry of the Nigorikawa geothermal system, Southwest Hokkaido, Japan. Geochem. J. 1991, 25, 203–222. [Google Scholar] [CrossRef]
  8. Hedlund, B.P.; Cole, J.K.; Williams, A.J.; Hou, W.; Zhou, E.; Li, W.; Dong, H. A review of the microbiology of the Rehai geothermal field in Tengchong, Yunnan Province, China. Geosci. Front. 2012, 3, 273–288. [Google Scholar] [CrossRef] [Green Version]
  9. Roesch, L.F.W.; Fulthorpe, R.R.; Riva, A.; Casella, G.; Hadwin, A.K.M.; Kent, A.D.; Daroub, S.H.; Camargo, F.A.O.; Farmerie, W.G.; Triplett, E.W. Pyrosequencing enumerates and contrasts soil microbial diversity. ISME J. 2007, 1, 283–290. [Google Scholar] [CrossRef]
  10. Tremblay, J.; Singh, K.; Fern, A.; Kirton, E.S.; He, S.; Woyke, T.; Lee, J.; Chen, F.; Dangl, J.L.; Tringe, S.G. Primer and platform effects on 16S rRNA tag sequencing. Front. Microbiol. 2015, 6, 771. [Google Scholar] [CrossRef] [Green Version]
  11. Lee, C.K.; Herbold, C.W.; Polson, S.W.; Wommack, K.E.; Williamson, S.J.; McDonald, I.R.; Cary, S.C. Groundtruthing next-gen sequencing for microbial ecology-biases and errors in community structure estimates from PCR amplicon pyrosequencing. PLoS ONE 2012, 7, e44224. [Google Scholar] [CrossRef] [PubMed] [Green Version]
  12. Pinto, A.J.; Raskin, L. PCR biases distort bacterial and archaeal community structure in pyrosequencing datasets. PLoS ONE 2012, 7, e43093. [Google Scholar] [CrossRef] [PubMed] [Green Version]
  13. He, Y.; Zhou, B.J.; Deng, G.H.; Jiang, X.T.; Zhang, H.; Zhou, H.W. Comparison of microbial diversity determined with the same variable tag sequence extracted from two different PCR amplicons. BMC Microbiol. 2013, 13, 208. [Google Scholar] [CrossRef] [PubMed] [Green Version]
  14. Klindworth, A.; Pruesse, E.; Schweer, T.; Peplies, J.; Quast, C.; Horn, M.; Glöckner, F.O. Evaluation of general 16S ribosomal RNA gene PCR primers for classical and next-generation sequencing-based diversity studies. Nucleic Acids Res. 2013, 41, e1. [Google Scholar] [CrossRef] [PubMed]
  15. Wang, S.; Dong, H.; Hou, W.; Jiang, H.; Huang, Q.; Briggs, B.R.; Huang, L. Greater temporal changes of sediment microbial community than its waterborne counterpart in Tengchong hot springs, Yunnan Province, China. Sci. Rep. 2014, 4, 7479. [Google Scholar] [CrossRef] [PubMed]
  16. Jiang, Z.; Li, P.; Jiang, D.; Dai, X.; Zhang, R.; Wang, Y.; Wang, Y. Microbial community structure and arsenic biogeochemistry in an acid vapor-formed spring in Tengchong geothermal area, China. PLoS ONE 2016, 11, e0146331. [Google Scholar] [CrossRef]
  17. Li, F.; Leu, A.; Poff, K.; Carlson, L.T.; Ingalls, A.E.; DeLong, E.F. Planktonic archaeal ether lipid origins in surface waters of the North Pacific subtropical gyre. Front. Microbiol. 2021, 12, 610675. [Google Scholar] [CrossRef]
  18. Bolger, A.M.; Lohse, M.; Usadel, B. Trimmomatic: A flexible trimmer for illumina sequence data. Bioinformatics 2014, 30, 2114–2120. [Google Scholar] [CrossRef] [Green Version]
  19. Magoč, T.; Salzberg, S.L. FLASH: Fast length adjustment of short reads to improve genome assemblies. Bioinformatics 2011, 27, 2957–2963. [Google Scholar] [CrossRef]
  20. R Development Core Team R. A Language and Environment for Statistical Computing; R Foundation for Statistical Computing: Vienna, Austria, 2012. [Google Scholar]
  21. Oksanen, J.; Blanchet, F.G.; Kindt, R.; Legendre, P.; Minchin, P.R.; O’Hara, R.B.; Simpson, G.L.; Solymos, P.; Stevens, M.H.H.; Wagner, H. Vegan: Community Ecology Package; R Package Version: 2.0-3. Available online: http://cran.r-project.org/ (accessed on 24 May 2012).
  22. Des Marais, D.J.; Walter, M.R. Terrestrial hot spring systems: Introduction. Astrobiology 2019, 19, 1419–1432. [Google Scholar] [CrossRef]
  23. Kambura, A.K.; Mwirichia, R.K.; Kasili, R.W.; Karanja, E.N.; Makonde, H.M.; Boga, H.I. Bacteria and archaea diversity within the hot springs of Lake Magadi and Little Magadi in Kenya. BMC Microbiol. 2016, 16, 136. [Google Scholar] [CrossRef] [PubMed] [Green Version]
  24. Schuler, C.G.; Havig, J.R.; Hamilton, T.L. Hot spring microbial community composition, morphology, and carbon fixation: Implications for interpreting the ancient rock record. Front. Earth Sci. 2017, 5, 97. [Google Scholar] [CrossRef] [Green Version]
  25. Song, Z.Q.; Wang, F.P.; Zhi, X.Y.; Chen, J.Q.; Zhou, E.M.; Liang, F.; Xiao, X.; Tang, S.K.; Jiang, H.C.; Zhang, C.L.; et al. Bacterial and archaeal diversities in Yunnan and Tibetan hot springs, China. Environ. Microbiol. 2013, 15, 1160–1175. [Google Scholar] [CrossRef]
  26. Mohammad, B.T.; Al Daghistani, H.I.; Jaouani, A.; Abdel-Latif, S.; Kennes, C. Isolation and characterization of thermophilic bacteria from Jordanian hot springs: Bacillus licheniformis and Thermomonas hydrothermalis isolates as potential producers of thermostable enzymes. Int. J. Microbiol. 2017, 2017, 6943952. [Google Scholar] [CrossRef] [PubMed] [Green Version]
  27. Bryan, C.G.; Watkin, E.L.; McCredden, T.J.; Wong, Z.R.; Harrison, S.T.L.; Kaksonen, A.H. The use of pyrite as a source of lixiviant in the bioleaching of electronic waste. Hydrometallurgy 2015, 152, 33–43. [Google Scholar] [CrossRef]
  28. Griffiths, E.; Gupta, R.S. Molecular signatures in protein sequences that are characteristics of the phylum Aquificae. Int. J. Syst. Evol. Microbiol. 2006, 56, 99–107. [Google Scholar] [CrossRef]
  29. Horiike, T.; Miyata, D.; Hamada, K.; Saruhashi, S.; Shinozawa, T.; Kumar, S.; Chakraborty, R.; Komiyama, T.; Tateno, Y. Phylogenetic construction of 17 bacterial phyla by new method and carefully selected orthologs. Gene 2009, 429, 59–64. [Google Scholar] [CrossRef] [Green Version]
  30. Huber, R.; Hannig, M. Thermotogales. In The Prokaryotes: Volume 7: Proteobacteria: Delta, Epsilon Subclass; Dworkin, M., Falkow, S., Rosenberg, E., Schleifer, K.H., Stackebrandt, E., Eds.; Springer: New York, NY, USA, 2006; pp. 899–922. [Google Scholar]
  31. Reysenbach, A.L.; Banta, A.; Civello, S.; Daly, J.; Mitchel, K.; Lalonde, S.; Konhauser, K.; Rodman, A.; Rusterholtz, K.; Takacs-Vesbach, C. The Aquificales in Yellowstone National Park. In Geothermal Biology and Geochemistry in Yellowstone National Park; Inskeep, W.P., McDermott, T.R., Eds.; Montana State University: Bozeman, MT, USA, 2005; pp. 129–142. [Google Scholar]
  32. Spear, J.R.; Walker, J.J.; McCollom, T.M.; Pace, N.R. Hydrogen and bioenergetics in the Yellowstone geothermal ecosystem. Proc. Natl. Acad. Sci. USA 2005, 102, 2555–2560. [Google Scholar] [CrossRef] [Green Version]
  33. Meyer-Dombard, D.R.; Shock, E.L.; Amend, J.P. Archaeal and bacterial communities in geochemically diverse hot springs of Yellowstone National Park, USA. Geobiology 2005, 3, 211–227. [Google Scholar] [CrossRef]
  34. Boyd, E.S.; Leavitt, W.D.; Geesey, G.G. CO2 uptake and fixation by a thermoacidophilic microbial community attached to precipitated sulfur in a geothermal spring. Appl. Environ. Microbiol. 2009, 75, 4289–4296. [Google Scholar] [CrossRef] [Green Version]
  35. Macur, R.E.; Langner, H.W.; Kocar, B.D.; Inskeep, W.P. Linking geochemical processes with microbial community analysis: Successional dynamics in an arsenic-rich, acid-sulphate-chloride geothermal spring. Geobiology 2004, 2, 163–177. [Google Scholar] [CrossRef]
  36. Meyer-Dombard, D.R.; Swingley, W.; Raymond, J.; Havig, J.; Shock, E.L.; Summons, R.E. Hydrothermal ecotones and streamer biofilm communities in the Lower Geyser Basin, Yellowstone National Park. Environ. Microbiol. 2011, 13, 2216–2231. [Google Scholar] [CrossRef] [PubMed]
  37. Hügler, M.; Huber, H.; Molyneaux, S.J.; Vetriani, C.; Sievert, S.M. Autotrophic CO2 fixation via the reductive tricarboxylic acid cycle in different lineages within the phylum Aquificae: Evidence for two ways of citrate cleavage. Environ. Microbiol. 2007, 9, 81–92. [Google Scholar] [CrossRef] [PubMed]
  38. Stohr, R.; Waberski, A.; Völker, H.; Tindall, B.J.; Thomm, M. Hydrogenothermus marinus gen. nov., sp. nov., a novel thermophilic hydrogen-oxidizing bacterium, recognition of Calderobacterium hydrogenophilum as a member of the genus Hydrogenobacter and proposal of the reclassification of Hydrogenobacter acidophilus as Hydrogenobaculum acidophilum gen. nov., comb. nov., in the phylum ‘Hydrogenobacter/Aquifex’. Int. J. Syst. Evol. Microbiol. 2001, 51, 1853–1862. [Google Scholar] [CrossRef]
  39. Donahoe-Christiansen, J.; D’Imperio, S.; Jackson, C.R.; Inskeep, W.P.; McDermott, T.R. Arsenite-oxidizing Hydrogenobaculum strain isolated from an acid-sulfate-chloride geothermal spring in Yellowstone National Park. Appl. Environ. Microbiol. 2004, 70, 1865–1868. [Google Scholar] [CrossRef] [Green Version]
  40. Reysenbach, A.L.; Hamamura, N.; Podar, M.; Griffiths, E.; Ferreira, S.; Hochstein, R.; Heidelberg, J.; Johnson, J.; Mead, D.; Pohorille, A.; et al. Complete and draft genome sequences of six members of the Aquificales. J. Bacteriol. 2009, 191, 1992–1993. [Google Scholar] [CrossRef] [Green Version]
  41. Romano, C.; D’Imperio, S.; Woyke, T.; Mavromatis, K.; Lasken, R.; Shock, E.L.; McDermott, T.R. Comparative genomic analysis of phylogenetically closely related Hydrogenobaculum sp. isolates from Yellowstone National Park. Appl. Environ. Microbiol. 2013, 79, 2932–2943. [Google Scholar] [CrossRef] [Green Version]
  42. Hedlund, B.P.; Reysenbach, A.L.; Huang, L.; Ong, J.C.; Liu, Z.; Dodsworth, J.A.; Ahmed, R.; Williams, A.J.; Briggs, B.R.; Liu, Y.; et al. Isolation of diverse members of the Aquificales from geothermal springs in Tengchong, China. Front. Microbiol. 2015, 6, 157. [Google Scholar] [CrossRef]
  43. Oren, A. Taxonomy of the family Halobacteriaceae: A paradigm for changing concepts in prokaryote systematics. Int. J. Syst. Evol. Microbiol. 2012, 62, 263–271. [Google Scholar] [CrossRef] [Green Version]
  44. Schleper, C.; Puehler, G.; Holz, I.; Gambacorta, A.; Janekovic, D.; Santarius, U.; Klenk, H.P.; Zillig, W. Picrophilus gen. nov., fam. nov.: A novel aerobic, heterotrophic, thermoacidophilic genus and family comprising archaea capable of growth around pH 0. J. Bacteriol. 1995, 177, 7050–7059. [Google Scholar] [CrossRef] [Green Version]
  45. Itoh, T.; Yoshikawa, N.; Takashina, T. Thermogymnomonas acidicola gen. nov., sp. nov., a novel thermoacidophilic, cell wall-less archaeon in the order Thermoplasmatales, isolated from a solfataric soil in Hakone, Japan. Int. J. Syst. Evol. Microbiol. 2007, 57, 2557–2561. [Google Scholar] [CrossRef] [PubMed]
  46. Whitaker, R.J.; Grogan, D.W.; Taylor, J.W. Geographic barriers isolate endemic populations of hyperthermophilic archaea. Science 2003, 301, 976–978. [Google Scholar] [CrossRef] [PubMed]
  47. Huber, G.; Spinnler, C.; Gambacorta, A.; Stetter, K.O. Metallosphaera sedula gen, and sp. nov. represents a new genus of aerobic, metal-mobilizing, thermoacidophilic archaebacteria. Syst. Appl. Microbiol. 1989, 12, 38–47. [Google Scholar] [CrossRef] [Green Version]
  48. Auernik, K.S.; Maezato, Y.; Blum, P.H.; Kelly, R.M. The genome sequence of the metal-mobilizing, extremely thermoacidophilic archaeon Metallosphaera sedula provides insights into bioleaching-associated metabolism. Appl. Environ. Microbiol. 2008, 74, 682–692. [Google Scholar] [CrossRef] [PubMed] [Green Version]
  49. Fuchs, T.; Huber, H.; Teiner, K.; Burggraf, S.; Stetter, K.O. Metallosphaera prunae, sp. nov., a novel metal-mobilizing, thermoacidophilic Archaeum, isolated from a uranium mine in Germany. Syst. Appl. Microbiol. 1995, 18, 560–566. [Google Scholar] [CrossRef]
  50. Liu, L.J.; You, X.Y.; Guo, X.; Liu, S.J.; Jiang, C.Y. Metallosphaera cuprina sp. nov., an acidothermophilic, metal-mobilizing archaeon. Int. J. Syst. Evol. Microbiol. 2011, 61, 2395–2400. [Google Scholar] [CrossRef] [PubMed]
  51. Kurosawa, N.; Itoh, Y.H.; Itoh, T. Reclassification of Sulfolobus hakonensis Takayanagi et al., 1996 as Metallosphaera hakonensis comb. nov. based on phylogenetic evidence and DNA G+C content. Int. J. Syst. Evol. Microbiol. 2003, 53, 1607–1608. [Google Scholar] [CrossRef]
  52. Peng, T.J.; Liu, L.J.; Liu, C.; Yang, Z.F.; Liu, S.J.; Jiang, C.Y. Metallosphaera tengchongensis sp. nov., an acidothermophilic archaeon isolated from a hot spring. Int. J. Syst. Evol. Microbiol. 2015, 65, 537–542. [Google Scholar] [CrossRef]
  53. Dodsworth, J.A.; Hungate, B.A.; Hedlund, B.P. Ammonia oxidation, denitrification and dissimilatory nitrate reduction to ammonium in two US Great Basin hot springs with abundant ammonia-oxidizing archaea. Environ. Microbiol. 2011, 13, 2371–2386. [Google Scholar] [CrossRef]
Figure 1. Map showing the eight sampling sites along the two streams.
Diversity 14 00381 g001
Figure 2. Venn diagrams showing the distribution of unique and shared OTUs within various sample types. (A) Sediment sample and (B) water sample in stream X; (C) sediment sample and (D) water sample in stream Y. (A) 1012, 486, 433, 524 and 666 OTUs were owned by each sediment sample in stream X while 549, 78, 73, 118 and 285 OTUs were unique OTUs and 115 OTUs were shared by 5 samples. (B) 464, 439, 514, 526 and 675 OTUs were owned by each water sample in stream X while 42, 55, 43, 49 and 189 OTUs were unique OTUs and 238 OTUs were shared by 5 samples. (C) 565, 325 and 520 OTUs were owned by each sediment sample in stream Y while 332, 55 and 247 OTUs were unique OTUs and 146 OTUs were shared by 3 samples. (D) 350, 427 and 463 OTUs were owned by each water sample in stream Y while 75, 84 and 146 OTUs were unique OTUs and 207 OTUs were shared by 3 samples.
Diversity 14 00381 g002
Figure 3. Alpha and beta diversity in all 48 samples. (A) Boxplots of the Shannon index values of the eight sites, where S indicates a sediment sample and W indicates a water sample. (B) First two axes of weighted UniFrac principal coordinate analysis (PCoA) at the OTU level of beta diversity analysis. Each group color coding is the same as for panel a.
Diversity 14 00381 g003
Figure 4. Relative abundances of microbes in all 48 samples at the phylum level.
Diversity 14 00381 g004
Figure 5. (A) Relative abundances of the top 30 most abundant bacterial and archaeal taxa at the order level. ‘Others’ represent all taxa that scored a relative abundance of below 1% across all samples in both data sets. (B) Heatmap of Z-score-transformed relative abundances at the genus level. The heatmap scale displays the row Z score (Z score = [actual relative abundance of bacterial taxa at the class level at a specific depth of one sample—mean relative abundance of the same taxa in all samples]/standard deviation). Thus, the positive Z scores in red indicate values above the mean, while the negative Z score values in blue are below the mean in units of standard deviation.
Diversity 14 00381 g005
Figure 6. Redundancy analysis (RDA) ordination biplot for environmental factors and microbial communities. (A) X stream sediment samples, (B) water samples, (C) Y stream sediment samples, (D) water samples. T is the temperature.
Diversity 14 00381 g006
Figure 7. The trends of microbial community abundance with the current of stream. Panel one and two for stream X sediments group, (A) increase-decrease-increase-increase model, (B) constant-constant-increase-increase model, (C) constant-constant-constant-increase model, (D) decrease-decrease-constant-constant model. Panel two for stream X water group, (E) increase-decrease-increase-increase model, (F) constant-constant-constant-increase model. Panel three for stream Y sediments group, (G) decrease-constant model, (H) increase-increase model, (I) constant-increase model. Panel four for stream Y water group, (J) increase-decrease model, (K) increase-increase model, (L) constant-increase model.
Diversity 14 00381 g007
Publisher’s Note: MDPI stays neutral with regard to jurisdictional claims in published maps and institutional affiliations.

