Article

Molecular Identification and Novel Mitochondrial COI Gene Haplotypes of Nesting Kemp’s Ridley Turtles (Lepidochelys kempii) in Rancho Nuevo Sanctuary, Mexico

by
Fátima Yedith Camacho-Sánchez
1,2,
José Alberto Narváez-Zapata
3,
Héctor Hugo Acosta-Sánchez
4,5,
Martha López-Hernández
6,
Agusto Luzariaga-Neira
7,
Hervey Rodríguez-González
8,
A. Alonso Aguirre
2 and
Miguel Angel Reyes-López
1,*
1
Conservation Medicine Laboratory, Centro de Biotecnología Genómica, Instituto Politécnico Nacional, Reynosa 88700, Mexico
2
Department of Environmental Science and Policy, George Mason University, Fairfax, VA 22030, USA
3
Centro de Biotecnología Genómica, Laboratorio de Biotecnología Industrial, Instituto Politécnico Nacional, Reynosa 88700, Mexico
4
Terra Asesoría Ambiental S. C., Programa de Conservación de Tortugas Marinas en el Santuario Playa de Rancho Nuevo, Ciudad Victoria 87050, Mexico
5
Fondo Mexicano para la Conservación de la Naturaleza-Rancho Nuevo, Aldama 89678, Mexico
6
Planicie Costera y Golfo de México, SEMARNAT-CONANP Tamaulipas, Ciudad Victoria 87000, Mexico
7
Department of Biology, University of Nevada, Reno, NV 89557, USA
8
Laboratorio Nutrición Acuícola, Departamento de Acuacultura, Centro Interdisciplinario de Investigación para el Desarrollo Integral Regional-Unidad Sinaloa, Instituto Politécnico Nacional, Guasave 81049, Mexico
*
Author to whom correspondence should be addressed.
Submission received: 5 April 2022 / Revised: 4 May 2022 / Accepted: 10 May 2022 / Published: 14 May 2022
(This article belongs to the Special Issue Reproductive Biology and Molecular Ecology of Turtles)

Abstract

:
One hundred new COI sequences of nesting female Kemp’s ridley turtles (Lepidochelys kempii) were obtained in the Rancho Nuevo Sanctuary (RNS). The COI sequences were analyzed and contrasted with others retrieved from BOLD and GenBank with the aim of investigating genetic variability, genetic divergence, and haplotypes of the nesting female population at RNS. Four new COI haplotypes for Kemp’s ridley were described; two are redundant with (LK-RN01) 97 and (LK-COI-01) 17 specimens belonging to the RNS and other localities, respectively. Nucleotide (0.00052) and haplotype (0.303) diversity showed low and conserved COI values The fixation index (FST) between these main redundant haplotypes showed a high degree of differentiation with ~1. Genetic divergence clearly demonstrated two different Kemp’s ridley nesting populations, one from RNS and a second outside Mexico. Phylogenetic COI analysis was useful to differentiate these redundant (LK-COI-01 and RNS LK-RN01) haplotypes and, therefore, these different Kemp’s ridley populations. In addition, phylogenetic COI analysis clearly separates Kemp’s ridley turtles from other sea turtle species, supporting its use as a barcode marker.

1. Introduction

Mexico is home to extremely important nesting and foraging habitats for six of the seven recognized species of sea turtles distributed worldwide, including leatherback (Dermochelys coriacea); green (Chelonia mydas); hawksbill (Eretmochelys imbricata); loggerhead (Caretta caretta); olive ridley (Lepidochelys olivacea); and Kemp’s ridley (Lepidochelys kempii) turtles. All six species are classified as endangered by the Mexican Government and other civil international organizations [1,2]. Efforts for their conservation and management have expanded over more than five decades [3,4,5].
Kemp’s ridley and olive ridley turtles are the two species that nest in ‘arribadas,’ an evolutionary strategy of synchronized massive turtle nesting events where tens of thousands of turtles converge on very specific beaches to lay millions of eggs simultaneously [6]. Kemp’s ridley has the most restricted nesting range, with the primary nesting site in the Rancho Nuevo Sanctuary (RNS), Tamaulipas, Mexico, with few exceptions [7]. After 50 intense years of recovery actions [2,3,4,5], numbers have bounced to 12,000 to 13,000 turtles a year between the 2014 and 2021 nesting seasons [8,9,10].
Today, 80–90% of the global nesting for the species continues in the RNS [3,7,10]. Other documented nesting sites include Soto la Marina, Tepehuajes, Barra del Tordo, Altamira, and Miramar, all in Tamaulipas; a few nests have been identified outside of Mexico, in South Padre Island, Texas, USA [5,11,12].
DNA barcoding has been extensively used to study species diversity [13]. It can be implemented by the molecular analysis of mitochondrial or nuclear regions, strengthening results. For instance, mitochondrial DNA (mtDNA) is often used in animals as a global identification system to investigate phylogeographic history [14,15,16,17]. These genes include a 16s rDNA, cytochrome C oxidase subunit 1 (COI), and D-loop regions [18]. These genes are highly conserved but can present changes in their sequence that distinguish between specific populations within a species [19]. The D-loop region has been widely used in variability genetic studies in different sea turtle populations [20,21]. However, when the efforts focus on distinguishing between different sea turtle species, COI analysis becomes useful as a molecular barcode [22,23]. COI sequences have also been used to construct haplotype networks and phylogenetic trees to investigate DNA divergence and population genetic parameters [19,24,25,26,27]. This gene is a common barcoding technique used to perform high-throughput taxonomic assignments [19,28]. It provides an important tool to support taxonomic studies in different species. Therefore, COI sequences have opened an opportunity to study sea turtles that arrive on Mexican coasts. These molecular techniques provide a better understanding of the ancestral demographic connections across ocean basins in sea turtles [19,24,25].
Traditional morphometric and genetic studies have been previously described for Kemp’s ridley turtles [1,11,29,30,31]. However, few studies have used COI as a molecular marker to evaluate the genetic parameters of the species. Some specimens [2,3,4,5,6,7,8,9,10] collected in the United States have been evaluated by COI [22,26]; however, no specimens have been tested at RNS. The main objective of this study was to use the COI gene to generate Kemp’s ridley DNA barcodes from nesting females and to evaluate their usefulness in accessing the genetic variability and divergence of this endangered species at RNS.

2. Materials and Methods

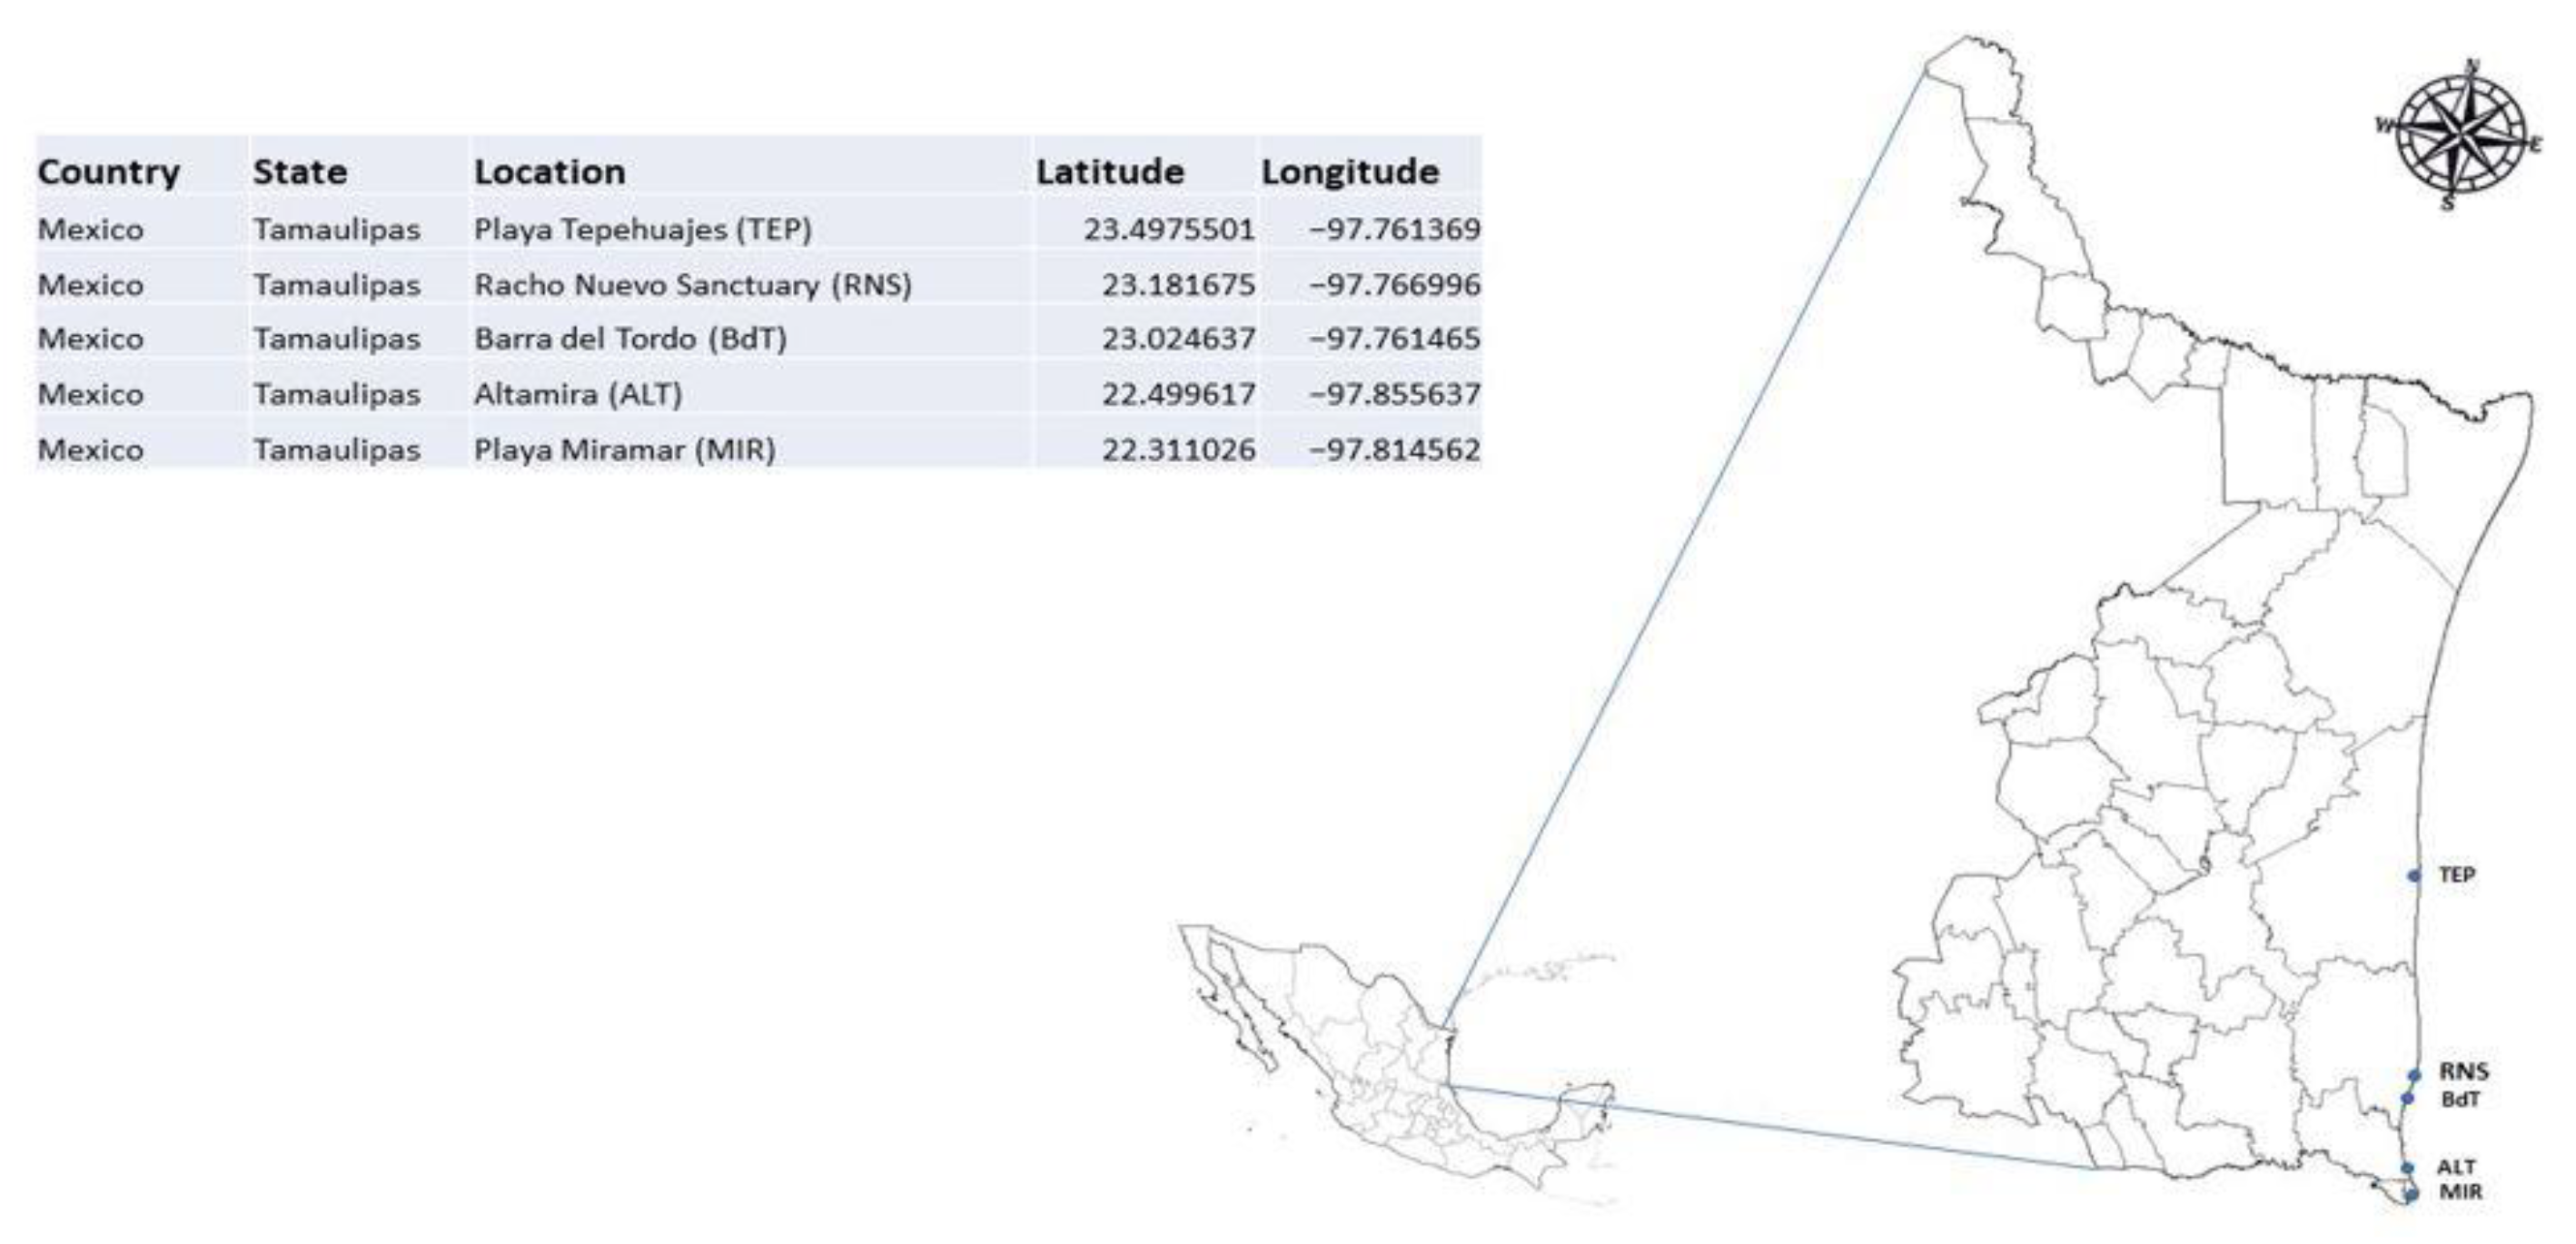
2.1. Field Specimens and DNA Biobank

Blood and biopsy samples were collected at the following locations: RNS, 23.181675, −97.766996; Playa Miramar (MIR) 22.311026, −97.814562; Playa Tepehuajes (TEP) 23.4975501, −97.7613688; Barra del Tordo (BdT) 23.024637, −97.761465; and Altamira (ALT) 22.499617, −97.855637, all in the State of Tamaulipas, Mexico (Figure 1). Whole blood was collected from the occipital sinus of females using sterile heparin tubes (Vacutainer, Bristol Circle, Oakville, ON, Canada). Skin biopsies were collected from the rear flipper using a human-grade 6-mm dermal biopsy punch (Surgical Design Inc., Lorton, VA, USA). All procedures were performed after nesting as previously described [32]. One to three cm biopsies were collected from the hind flippers of dead hatchlings. Blood specimens were preserved at 4 °C before total DNA extraction [33], and biopsies were immediately fixed in 70% ethanol. All turtles were released unharmed after sampling.

2.2. Amplification and Sequence of Gene Segments

Genomic DNA was extracted with the Qiagen DNeasy® blood and tissue kit (QIAGEN, Valencia, CA) according to the manufacturer’s protocol. All DNA samples were stored at 4 °C until use. The primers used to amplify the COI gene were VF 5′-TCAACCAACCACAAAGACATTGGCAC-3′ y VR 5′-TAGACTTCTGGGTGGCCAAAGAATCA -3′ [13,34,35,36]. A 25 µL PCR reaction containing 17.05 µL PCR water, 1 μL of 10 ng/μL DNA, 0.1 μL of 5 U of Taq polymerase (Bioline), 1.25 μL of 25 mM of MgCl2, 0.2 μL of 10 μM of each primer, 0.2 μL of 10 mM of dNTPs, and 5 μL of 5X Tris-KCl as a regulator was performed. PCR conditions were 95 °C for 5 min; 30–35 cycles of 95 °C for 45 s, 54 °C for 45 s, 72 °C for 35 s, 42 °C for 45 s; and 72 °C for 6 min, followed by storage at 4 °C until use. PCR products obtained were purified by standard ethanol purification and resuspended in sterile water. The samples were then sent to Eurofins Scientific (Eurofins Genomics LLC., Louisville, KY, USA) for sequencing.

2.3. Data and Quality Sequence Analysis

All retrieved sequences were analyzed using FASTQC software (Babraham Bioinformatics, Cambridge, UK) for quality control and BioEdit v7.2.5 software [37] to analyze each sequence. Manual editions of the sequence were performed when necessary. Analysis was complemented with 17 Kemp’s ridley sequences retrieved from BOLD or GenBank. These accessions came from the United States, two from the east coast, five from the New York area, and 10 from South Padre Island (SPI). In addition, the full COI gene sequence from GenBank (ID: MN136061) was used as the control sequence. This analysis also included available sequences of other turtle species and a sequence of a tortoise (GenBank ID: MW996700) as an outgroup. All sequences were transformed, aligned, and analyzed in FASTA format using BioEdit v7.2.5 for Clustal W software [38]. Sequence information and access numbers from BOLD were annotated. All public sequences from BOLD and GenBank were loaded. New sequences documented herein were deposited in BOLD with access numbers LKRNC002-20–LKRNC100-21.

2.4. Haplotype Analysis

A parsimonious network of unrooted haplotypes was created with PopART v. 1.7 software [39] using the TCS method [40] (Figure 2, Table 1). Following all sequence alignments using Clustal X, a full consensus sequence of the COI gene was obtained, approximately 1547 bp of Kemp’s ridley tagged as GBMTG044-16.COI-5P or NC_000886 from BOLD ID or GenBank [20], respectively. The consensus sequence from this work was 624 bp, which is useful for considering the nucleotide variations in these sequences. Divergence and p-distance [23] among these sequences were determined with MEGA X v.10.2.4 using Kimura 2-Parameters and a K2P nucleotide distance model [41,42].

2.5. Tree-Building for COI

IQ-Tree v. 1.6.12 software [43] was used to infer phylogenetic trees of the COI gene sequences (Figure 1) using the best-fit model by ModelFinder [44,45], according to Bayesian Information Criteria—BIC [43]. In addition, a complementary Maximum Likelihood tree (ML) was built using IQ-Tree with 1000 ultrafast bootstrap (BS) repetitions [44]. MEGA X was used to visualize the phylogenetic tree.

2.6. Population Gene Parameters

DNA Sequence Polymorphism (DnaSP v6.12.03) software (Barcelona, Spain) by Rosas [46] was used to determine the fixation index or Fst [47] and to measure haplotype and nucleotide diversity. Then, multiple DNA sequence variation values were determined, for example, the number of variable sites (S), the G + C content, and the haplotype/nucleotide diversity. The analysis using DnaSP was divided into three parts: a) analysis of all Kemp’s ridley sequences by MEGA; b) grouping sequences by haplotype, then a comparative analysis between 2 groups (haplotype diversity values higher than 0); and c) haplotype grouping based on the location. Two main groups, one from the RNS (n = 97) sequences, and another with all sequences (n = 17) from outside Mexico (excluding the RNS) and only one sequence from BdT. Also, the number of segregating and parsimony-informative sites was determined usingPopART. The levels of haplotype variation for Kemp’s ridley archived in BOLD were analyzed using an R logarithm called HACSim—Haplotype Accumulation Curve Simulator [48].

3. Results

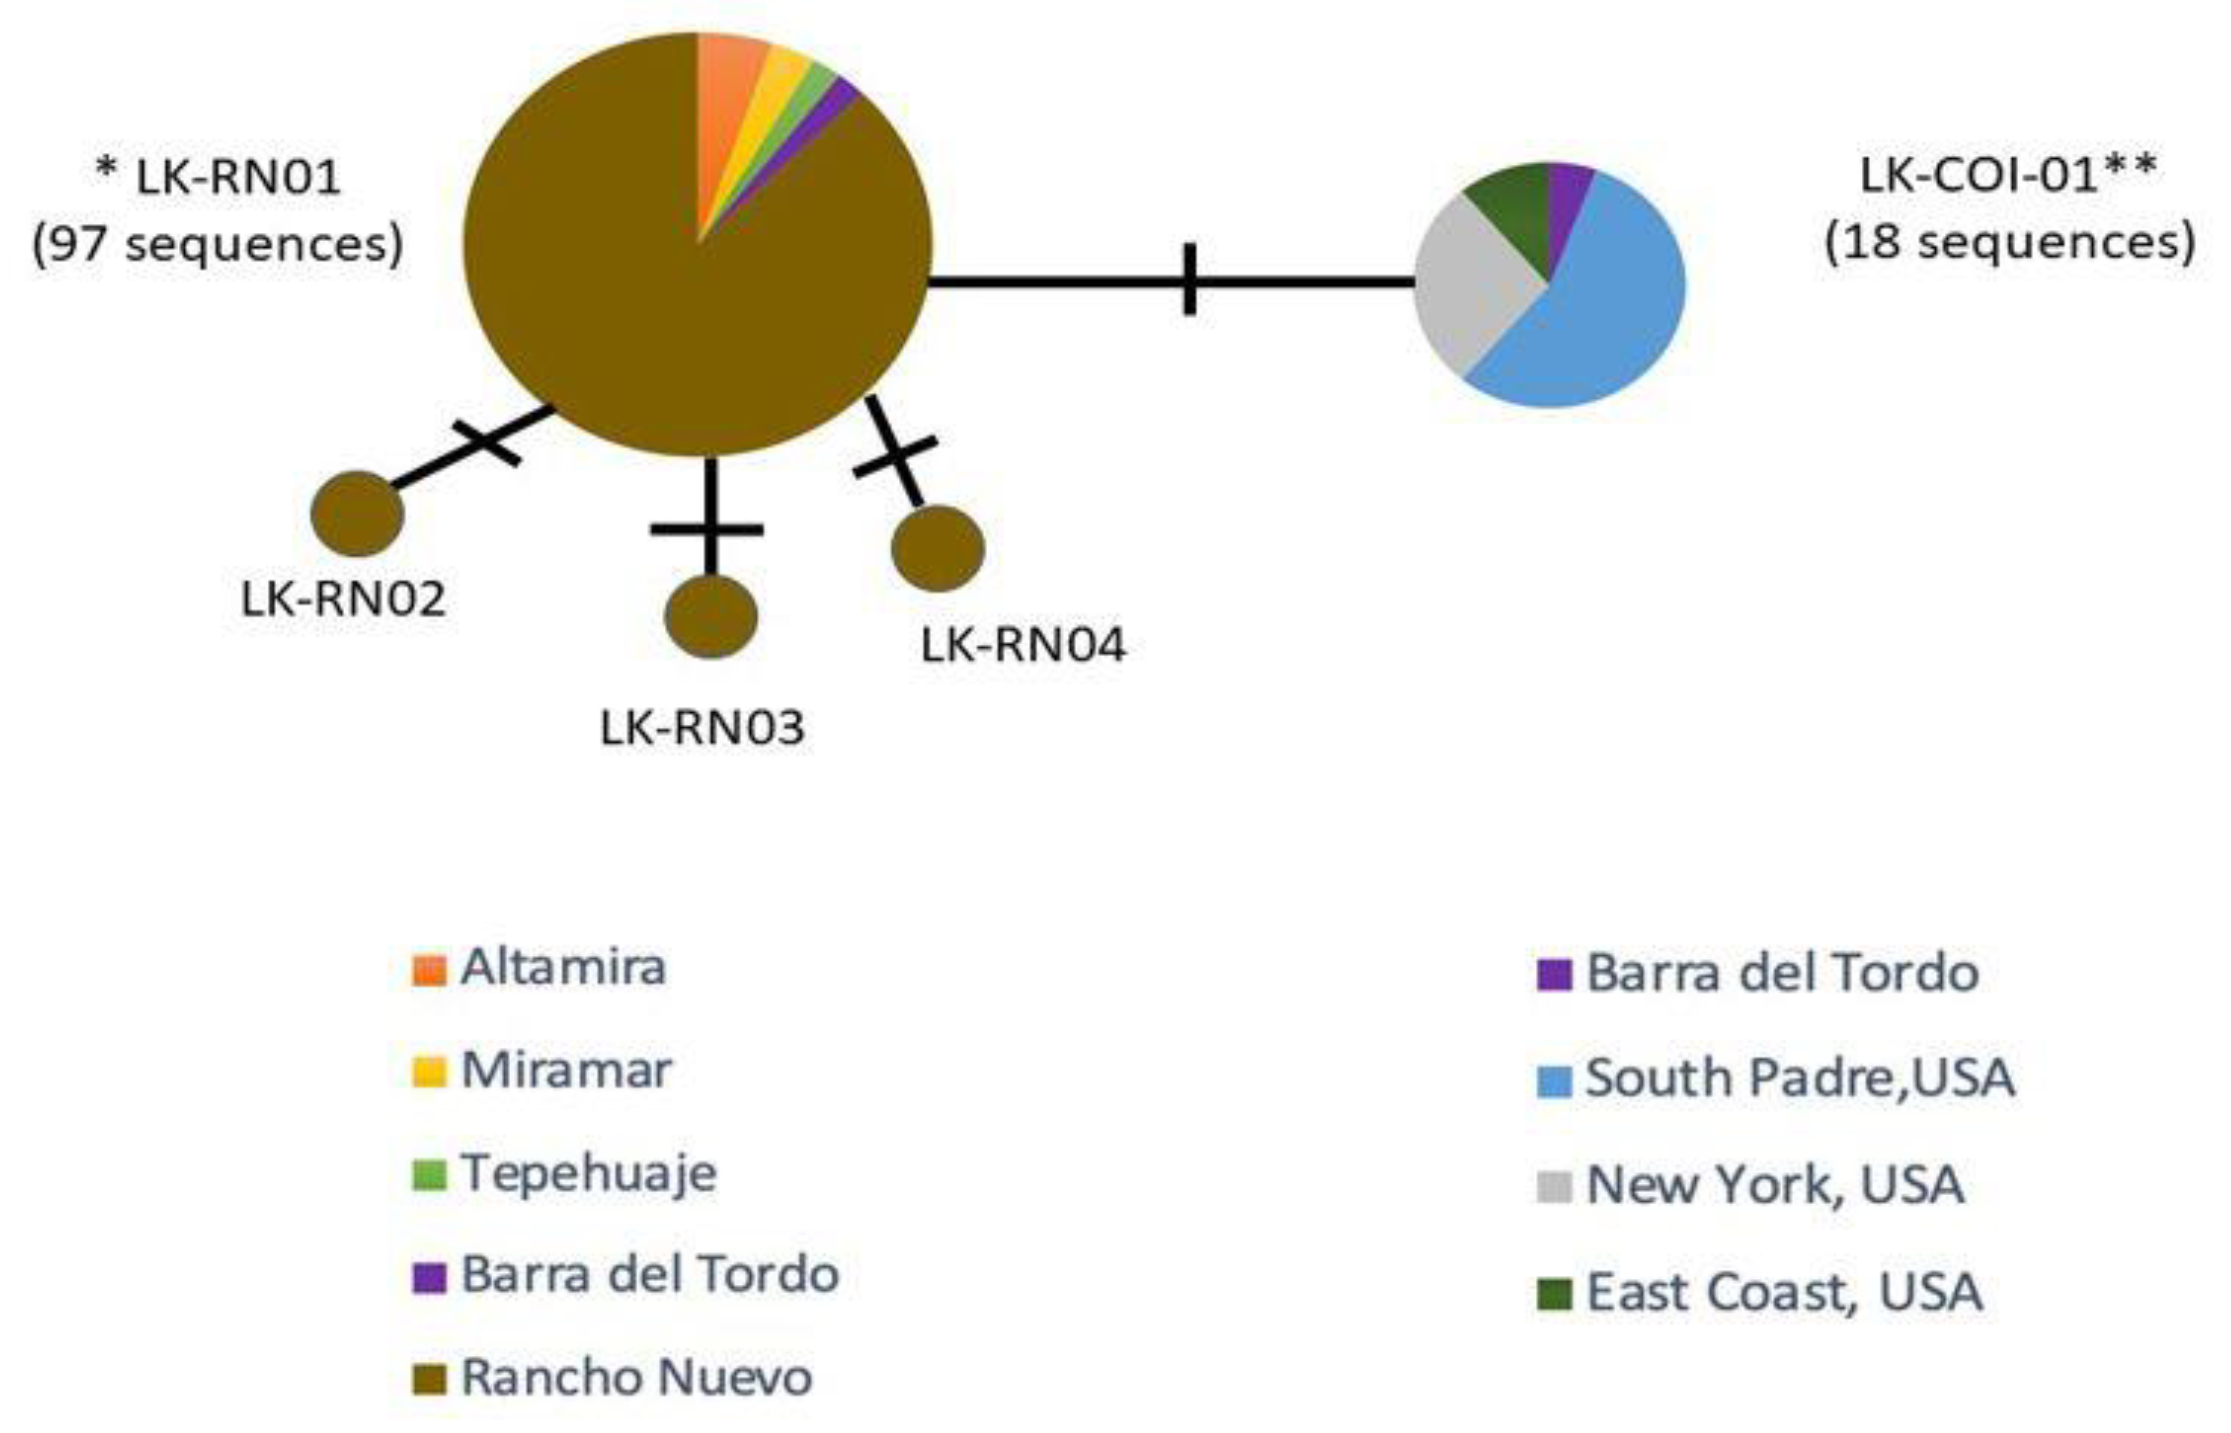
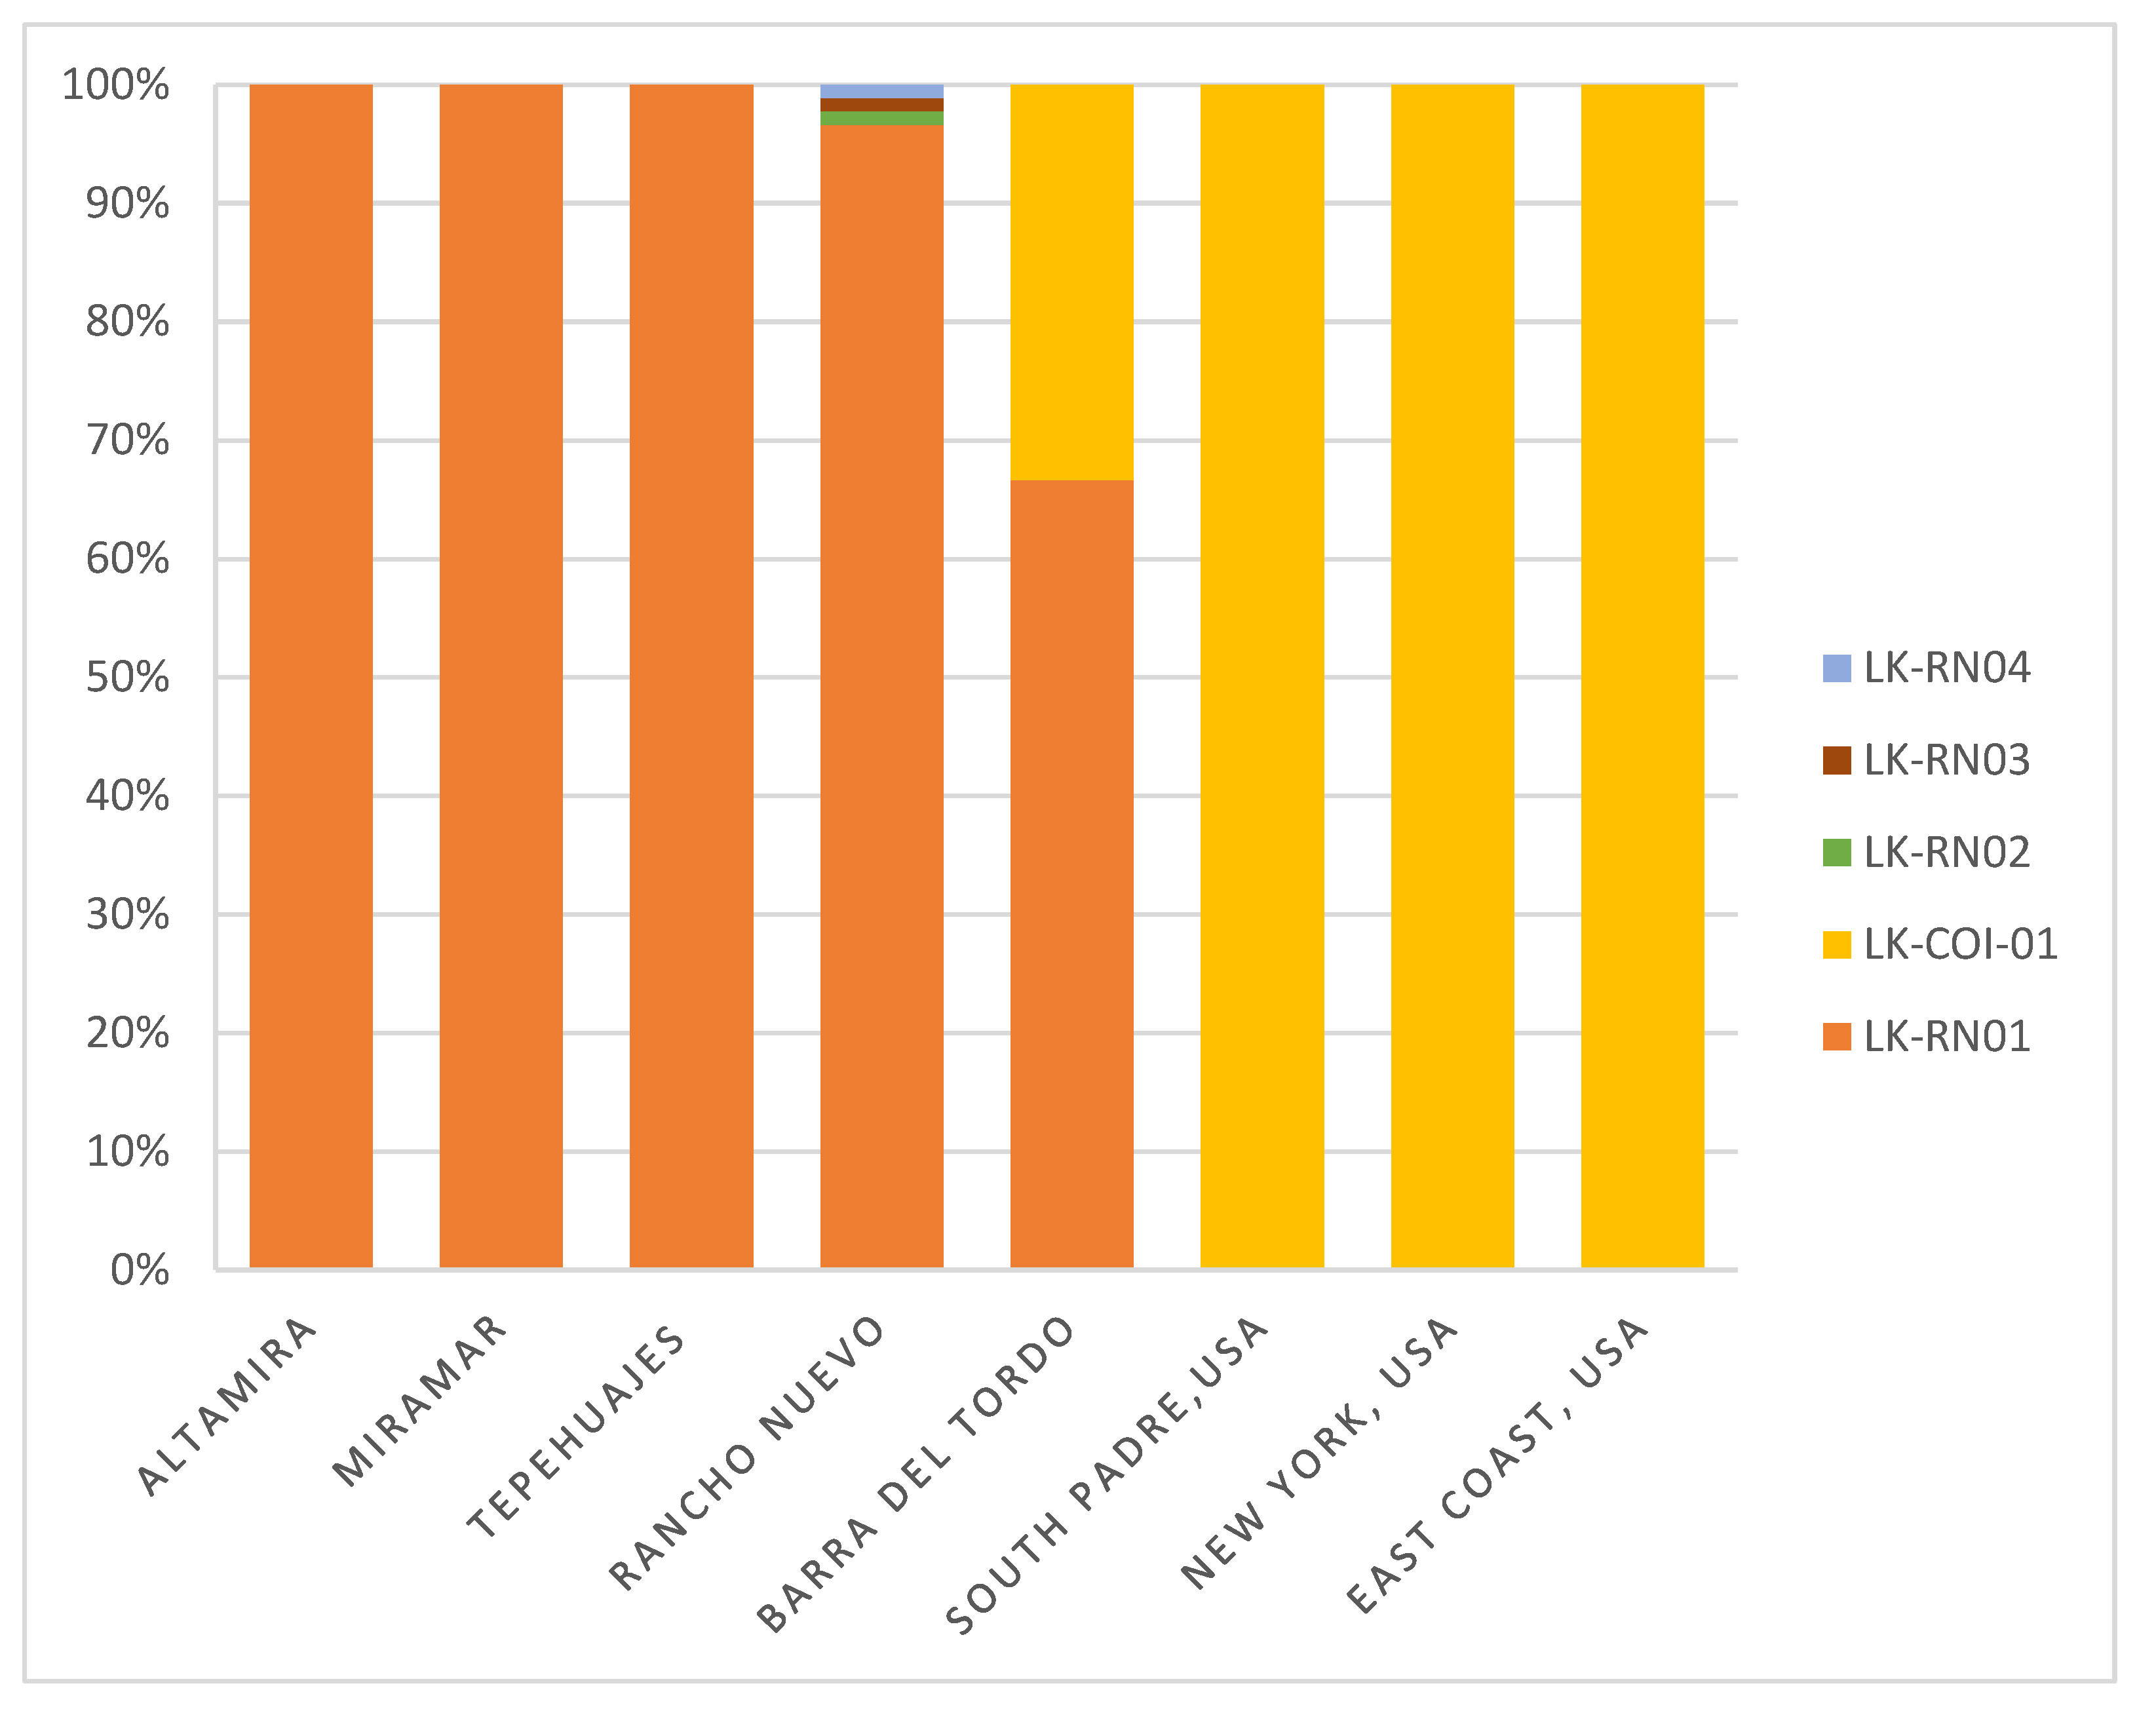
3.1. Haplotype Diversity

A total of 101 field specimens from different locations were analyzed and sequenced, 91 from the RNS and 10 from other field sites, including TEP, BdT, MIR, and ALT (Figure 1). COI gene size was 1547 bp [20].
Positions 1 and 604 of the analyzed sequences corresponded to positions 113 and 716 of the reference sequence (ID: MN136061). The haplotype network shows five different haplotypes, of which four have not been previously described. The different sequences analyzed were grouped by assigned haplotype based on their sequence. Likewise, those sequences were correlated with other features such as their ID, previous haplotype, BOLD ID, GenBank accession, locations and reference (Table S1).
The analysis of all sequences using PopART (Figure 2, Table 1) showed changes between the aligned sequences and their potential haplotypes. The nomenclature used during this study correlated to the one established by DNA barcodes for globally threatened marine turtles [26] and the Archie Carr Center for Sea Turtle Research (ACCSTR) of the University of Florida [26,49] with some modifications. For instance, the first letters for the genus and species remained the same, Lepidochelys kempii (Lk); however, the changing variable established by ACCSTR was the use of the nesting beach where the sample was obtained, i.e., Rancho Nuevo (RN) Sanctuary, instead of the COI gene. Finally, we listed the number of identified haplotypes (01, 02, etc.). The nomenclature proposed is summarized as Lk-RN-01, Lk-RN-02, etc.
Four out of five haplotypes were assigned to the RNS as those sequences originated from this location. One of them, haplotype LK-RN01, grouped sequences from five localities, RNS, MIR, ALT, TEP, and BdT, as they share the same haplotype, regardless of the beach they were nesting. The haplotypes LK-RN02 to LK-RN04 were non-redundant, including single sequences. Here, it is important to mention that the polymorphism of these single sequences was confirmed by sequence double-checking. These non-redundant haplotypes were specific to the RNS location (Figure 3; Table 2).
Additionally, Table 2 shows the number of sequences analyzed in this study by location and correlated 100% with the number of field samples obtained. Previous COI genes retrieved from databases were grouped in the redundant LK-COI-01 haplotype previously reported [26]. Sequences belonging to this haplotype originated primarily from different USA locations, except for a Mexican sequence belonging to the BdT location.

3.2. Genetic Divergence

Genetic divergence values (K2P and p-distance) among the species are summarized in Table 3. Kemp’s ridley sequence values (K2P) ranged between 2% to 9% within the same turtle’s family and 12% when compared to leatherback turtles. Divergence values (p-distance) among sea turtles and a tortoise were 14% to 17% and 14% to 16%, respectively (Table 3).
In general, the population genetic parameters demonstrated a high G + C content (0.422) in all COI sequences. Haplotype diversity (H) was 0.303 ± 0.049, the nucleotide diversity (Pi) was 0.00052 ± 0.00009, and the mean value of nucleotide differences (k) was 0.31160. FST values were only determined among the main redundant haplotypes (LK-RN01 and LK-COI-01). An interspecific sample size for the haplotype accumulation curve was calculated (Figure 4) to determine genetic diversity with an initial sample size of N = 118 individuals; the initial estimate for sampling sufficiency was N = 18 individuals. The algorithm converged after eight iterations.
The estimate of sampling sufficiency for p = 95% haplotype recovery was N * = 38 individuals (95% CI: 36.6068–39.3932). The number of additional specimens required to be sampled for p = 95% haplotype recovery was N * − N = 20 individuals.
Finally, a phylogenetic ML tree (Figure 5) with the wide nucleotide substitution model (TN + F + G4) highlighted the sequence divergence among species. All the Kemp’s ridley sequences belonged to the main clade, whereas other sea turtle sequences exhibited different clades (distance > 0.7) and the tortoise sequence a distant (>5) specific clade.

4. Discussion

Molecular gene markers can be used to identify sea turtle species [22,23]. The COI gene can be used as a universal molecular marker [50] to generate Barcodes or can be used in divergence studies to determine population structure and gene flow in other animal species [19,24,26]. Specifically, in Kemp’s ridley turtles, there are 7 BOLD records and a full mitochondrial genome (GenBank: MN136061.1) with assembled sequences from South Padre Island, TX [51].
Kemp’s ridley turtles are considered native to the Gulf of Mexico, where essential feeding, growing, and nesting sites are located, demonstrating high fidelity (82%) to this region, specifically in the RNS location [52,53]. In the current study, 101 COI DNA barcodes mainly from nesting females in the RNS were added to the BOLD system. This contribution has increased the usefulness of this gene marker in the complementary analysis of previous data [22,26] to strengthen molecular studies and provide a better understanding of genetic divergence. Considering the redundant haplotypes, the LK-RN01 haplotype was highly represented and is distributed in specimens from all Tamaulipas locations. In contrast, the LK-COI-01 haplotype was limited to specimens from SPI and New York [26,51] and a BT specimen, indicating differences among nesting beaches far from the primary nesting beach in the RNS. Three new non-redundant haplotypes are described for the RNS in addition to the redundant LK-RN01 haplotype.
Sequences analyzed using DnaSP software [46], FST [47], and nucleotide diversity demonstrated a polymorphic region compared to the reference collected in SPI [51] with 4 segregating sites and 1 parsimony-informative site. In general, the COI gene tends to be a more conserved sequence showing low intraspecific divergence and a low evolutionary rate, regardless of the multiple sequences provided [26]. Still, in the current study, the number of polymorphic sites is relatively low. This outcome may be a consequence of the limited distance and the kinship between samples for one population and among specimens since the RNS is near other nesting beaches in Tamaulipas, Mexico.
The dispersion of pelagic juvenile Kemp’s ridley turtles has been observed in northeast Florida, the Mississippi river basin, SPI, Terminos Lagoon in Campeche, and sporadically in the Yucatan peninsula [54]. Recently, rare events were documented in the Atlantic Ocean and Spanish Mediterranean waters [8,55]. Strandings of Kemp’s ridleys linked to cold-stunning events have been frequently documented in Cape Cod, Massachusetts [56]. Finally, due to the dramatic population decline of Kemp’s ridleys after 1947 [9], a Mexico-USA program was vigorously established to protect the nesting population [57]. A massive number of eggs were transplanted to SPI [10], followed by a population recovery from 700 to approximately 13,000 nesting females per year by 2020 [58,59]. The artificial or natural occurrence of other nesting sites, even with few specimens, might contribute to the occurrence of two redundant haplotypes suggesting the establishment of two apparent Kemp’s ridley turtle populations. Nevertheless, it is important to emphasize that the nucleotide differences remain very low (0.31160) compared to other sea turtle species [26]. In fact, during this study, interspecific divergence was identified between the two turtle families, and the divergence values split all six species of the Cheloniidae family.
Genetic species divergence is supported by the ML tree, where there are clear separations among the primary species clades. All Kemp’s ridley sequences are grouped within a clade with two slightly separated subclades, corresponding to the redundant haplotypes. COI haplotype variability is reduced compared with wide haplotype variability identified in the CR region [51]. In fact, haplotype curve accumulation shows that asymptotic curves reached saturation, suggesting that new individuals sampled would not contribute to newly discovered haplotypes. In addition, the FST value between the subclades was high (~1), suggesting low levels of interbreeding between these populations.
COI gene analysis allows the identification of new haplotypes and the early establishment of a new Kemp’s ridley population outside of the RNS. However, the low number of haplotypes, the low nucleotide difference, and the low number of polymorphic sites in this mitochondrial marker demonstrates the need to combine their use with other mitochondrial genes such as CR (the D-loop region) for the nuclear microsatellites to support any further genetic analysis [18,60]. As previously mentioned, there are other molecular markers with potential use in population genetics in various species, but not as DNA barcode markers. COI was successfully used in freshwater turtles as a DNA barcode and genetic divergence [61], although for various species of sea turtles, it was not very informative [22,23,26]. However, it is worth mentioning that for the Kemp’s ridley study, there is no robust study (limited number of sequences or works in this species of sea turtles) using the COI as a barcode marker in nesting females in any main camp or even in the RNS that shows its usefulness nor which shows the opposite. This work tries for the first time to establish the barcode to confirm the usefulness of the COI for the study of genetic divergence within and between sea turtle species, and between Kemp’s ridley and tortoise. For example, COI haplotype diversity showed approximately half (0.303) of the CR value obtained in other Kemp’s ridley studies [51,62]; therefore, a larger research effort is needed to increase the CR database in the female nesting population of the RNS. Nevertheless, the COI gene was useful for identifying separate Kemp’s ridley populations.

5. Conclusions

The 101 sequences of nesting Kemp’s ridleys in the RNS substantially enriched the BOLD database. Two redundant COI haplotypes (LK-RN01 and LK-COI-01) were identified. The first corresponds exclusively to the RNS specimens and the second to specimens of other locations. FST values (~1) between these groups suggest low levels of interbreeding between these locations. Nucleotide variation and informative sites were low in COI sequences. Therefore, COI genetic analysis in combination with other mitochondrial or nuclear gene markers is widely desirable. Finally, the COI gene as a DNA barcode is highly useful for identification and discrimination studies of sea turtle populations.

Supplementary Materials

The following supporting information can be downloaded at: https://0-www-mdpi-com.brum.beds.ac.uk/article/10.3390/d14050390/s1, Table S1: Relationship of COI sequences for haplotypes, ID, previous haplotypes, BOLD ID, GenBank accession, and countries for Kemp’s ridley (Lepidochelys kempii) in Mexico, 2018–2019 and other previously published sequences.

Author Contributions

M.A.R.-L.: writing-original draft preparation, methodology, investigation; F.Y.C.-S.: methodology, investigation; H.H.A.-S.: methodology; M.L.-H.: resources; J.A.N.-Z.: methodology, writing-reviewing and editing; A.A.A.: validation, writing-reviewing and editing; A.L.-N.: resources, supervision; H.R.-G.: resources, supervision. All authors have read and agreed to the published version of the manuscript.

Funding

This research was supported by SIP-20110067, 20161179, 20171851, 20196213, and 20200840 projects from the Instituto Politécnico Nacional (IPN). The Economic support from the Commission of Operation and Promotion of Academic Activities (Apoyos económicos de la Comisión de Operación y Fomento de Actividades Académicas -COFAA), Researcher Development Grants (Estímulos al Desempeño de los Investigadores -EDI), and the Institutional Scholarship for Researcher Development (Beca de Estímulo Institucional de Formación de Investigadores -BEIFI) provided by the IPN; the National Researcher System (SNI); and the National Council of Science and Technology (CONACyT) provided fellowships and scholarships for M.A.R.-L., F.Y.C.-S., H.R.-G., and J.A.N.-Z., H.H.A.-S., is part of the UNDP-GEF Project: species at risk and SEMARNAT/CONANP Tamaulipas.

Institutional Review Board Statement

The research meets all applicable standards and Mexican laws regarding the ethics of experimentation and research integrity, and the following is being certified/declared true. All turtle specimens were managed following laws and regulations of Mexican authorities under permits issued by SEMARNAT: SGPA/DGVS/04674/10 and SGPA/DGVS/003769/18.

Informed Consent Statement

Not applicable.

Data Availability Statement

All data in this work will be available in BOLD under the next IDs LKRNC002-20–LKRNC100-21 once the paper is accepted.

Acknowledgments

We are grateful to J. Martínez Ortíz and the entire community of Rancho Nuevo, Aldama, Tamaulipas. Special thanks to B. M. Zapata Nájera, CONANP. Finally, we thank X. F. de la Rosa-Reyna, who kindly provided the DNA of GBGC11768-13, and GBGC11769-13.

Conflicts of Interest

The authors declare that they have no conflict of interest.

References

  1. CIT, Convención Interamericana para la Protección y Conservación de las Tortugas Marinas. 2006. Available online: http://www.iacseaturtle.org/docs/resolucionesCOP3CT/Informe-Final-COP3CIT-ESP.pdf (accessed on 2 April 2022).
  2. IUCN. The IUCN Red List of Threatened Species. Version 2021-3. 2021. Available online: https://www.iucnredlist.org (accessed on 2 April 2022).
  3. Morreale, S.J.; Meylan, A.B.; Sadove, S.S.; Standora, E.A. Annual occurrence of winter mortality of marine turtles in New York waters. J. Herpetol. 1992, 26, 301–308. [Google Scholar] [CrossRef]
  4. Gaona Pineda, O.; Barragán, A.R. Las tortugas marinas en México: Logros y perspectivas para su conservación. Cienc. Y Mar. 2017, XXI, 73–74. [Google Scholar]
  5. Liceaga Correa, M.d.l.Á. Hábitats críticos y hotspots de tortugas marinas. In Atlas de Línea Base Ambiental del Golfo de México, 2020th ed.; Herzka, S.Z., Alfonso, R., Álvarez, Z., Peters Recagno, E.M., Hernández, G., Coordinación, C., Vii, T., Uribe Martínez Y Edgar, A., Castro, R., Cartografía, P., et al., Eds.; CICESE: Mexico City, México, 2020; pp. 6–29. [Google Scholar]
  6. Bernardo, J.; Plotkin, P.T. An evolutionary perspective on the arribada phenomenon and reproductive behavioral polymorphism of olive ridley sea turtles (Lepidochelys olivacea). In The Biology and Conservation of Ridley Sea Turtles; Plotkin, P.T., Ed.; JHU Press: Baltimore, MD, USA, 2007; pp. 58–87. [Google Scholar]
  7. Márquez, M.R. Synopsis of Biological Data on the Kemp’s Ridley Turtle, Lepidochelys kempi (Garman, 1880); Southeast Fisheries Science Center: Miami, FL, USA, 1994. [Google Scholar]
  8. Caillouet, C.W., Jr. Interruption of the Kemp’s ridley population’s pre-2010 exponential growth in the Gulf of Mexico and its aftermath: One hypothesis. Mar. Turt. Newsl. 2014, 143, 1–7. [Google Scholar]
  9. Bevan, E.; Wibbels, T.; Najera, B.M.Z.; Sarti, L.; Martinez, F.I.; Cuevas, J.M.; Gallaway, B.J.; Pena, L.J.; Burchfield, P.M. Estimating the historic size and current status of the Kemp’s ridley sea turtle (Lepidochelys kempii) population. Ecosphere 2016, 7, e01244. [Google Scholar] [CrossRef] [Green Version]
  10. Reyes-López, M.A.; Camacho-Sánchez, F.Y.; Hart, C.E.; Leal-Sepúlveda, V.; Zavala-Felix, K.A.; Ley-Quiñónez, C.P.; Aguirre, A.A.; Zavala-Norzagaray, A.A. Rediscovering Kemp’s Ridley Sea Turtle Lepidochelys kempii: Molecular Analysis and Threats. In Natural History and Ecology of Mexico and Central America; IntechOpen: London, UK, 2021; Available online: https://www.intechopen.com/chapters/75625 (accessed on 2 April 2022). [CrossRef]
  11. Lara-Uc, M.; Mota-Rodríguez, C. Conociendo a la Tortuga Golfina, Lepidochelys olivacea (Eschscholtz, 1829). Bioma 2014, 5, 9. [Google Scholar]
  12. Avens, L.; Goshe, L.R.; Coggins, L.; Shaver, D.J.; Higgins, B.; Landry, A.M., Jr.; Bailey, R. Variability in age and size at maturation, reproductive longevity, and long-term growth dynamics for Kemp’s ridley sea turtles in the Gulf of Mexico. PLoS ONE 2017, 12, e0173999. [Google Scholar] [CrossRef]
  13. Ward, R.D. DNA barcode divergence among species and genera of birds and fishes. Mol. Ecol. Resour. 2009, 9, 1077–1085. [Google Scholar] [CrossRef]
  14. Beebe, N.W. DNA barcoding mosquitoes: Advice for potential prospectors. Parasitology 2018, 145, 622–633. [Google Scholar] [CrossRef]
  15. Nneji, L.M.; Adeola, A.C.; Ayoola, A.O.; Oladipo, S.O.; Wang, Y.Y.; Malann, Y.D.; Anyaele, O.; Nneji, I.C.; Rahman, M.M.; Olory, C.S. DNA barcoding and species delimitation of butterflies (Lepidoptera) from Nigeria. Mol. Biol. Rep. 2020, 47, 9441–9457. [Google Scholar] [CrossRef]
  16. Jamaluddin, J.A.F.; Mohammed Akib, N.A.; Ahmad, S.Z.; Abdul Halim, S.A.A.; Abdul Hamid, N.K.; Mohd Nor, S.A. DNA barcoding of shrimps from a mangrove biodiversity hotspot. Mitochondrial DNA Part A DNA Mapp. Seq. Anal. 2019, 30, 618–625. [Google Scholar] [CrossRef] [PubMed]
  17. Tikochinski, Y.; Carreras, C.; Tikochinski, G.; Vilaça, S.T. Population-specific signatures of intra-individual mitochondrial DNA heteroplasmy and their potential evolutionary advantages. Sci. Rep. 2020, 10, 1–14. [Google Scholar]
  18. Zhang, T.; Lin, L.; Gaillard, D.; Chen, F.; Chen, H.; Li, M.; Wu, S.; Wang, Z.; Shi, H. Rapid authenticity testing of artificially bred green turtles ( Chelonia mydas) using microsatellite and mitochondrial DNA markers. PeerJ 2021, 9, e12410. [Google Scholar] [CrossRef] [PubMed]
  19. Hebert, P.D.N.; Cywinska, A.; Ball, S.L.; DeWaard, J.R. Biological identifications through DNA barcodes. Proc. Biol. Sci. 2003, 270, 313–321. [Google Scholar] [CrossRef] [Green Version]
  20. Duchene, S.; Frey, A.; Alfaro-Núñez, A.; Dutton, P.H.; Thomas, M.; Morin, P.A. Marine turtle mitogenome phylogenetics and evolution. Mol. Phylogenet. Evol. 2012, 65, 241–250. [Google Scholar] [CrossRef]
  21. Vargas, S.M.; Jensen, M.P.; Ho, S.Y.; Mobaraki, A.; Broderick, D.; Mortimer, J.A.; Whiting, S.D.; Miller, J.; Prince, R.I.; Bell, I.P.; et al. Phylogeography, genetic diversity, and management units of hawksbill turtles in the indo-pacific. J. Hered. 2016, 107, 199–213. [Google Scholar] [CrossRef] [Green Version]
  22. Naro-Maciel, E.; Le, M.; FitzSimmons, N.N.; Amato, G. Evolutionary relationships of marine turtles: A molecular phylogeny based on nuclear and mitochondrial genes. Mol. Phylogenet. Evol. 2008, 49, 659–662. [Google Scholar] [CrossRef]
  23. Vargas, S.M.; Araújo, F.C.F.; Santos, F.R. DNA barcoding of Brazilian sea turtles (Testudines). Genet. Mol. Biol. 2009, 32, 608. [Google Scholar] [CrossRef]
  24. Hebert, P.D.N.; Gregory, T.R. The promise of DNA barcoding for taxonomy. Syst. Biol. 2005, 54, 852–859. [Google Scholar] [CrossRef]
  25. Komoroske, L.M.; Jensen, M.P.; Stewart, K.R.; Shamblin, B.M.; Dutton, P.H. Advances in the application of genetics in marine turtle biology and conservation. Front. Mar. Sci. 2017, 4, 156. [Google Scholar] [CrossRef] [Green Version]
  26. Naro-Maciel, E.; Reid, B.; Fitzsimmons, N.N.; Le, M.; Desalle, R.; Amato, G. DNA barcodes for globally threatened marine turtles: A registry approach to documenting biodiversity. Mol. Ecol. Resour. 2010, 10, 252–263. [Google Scholar] [CrossRef] [PubMed]
  27. Morgada, M.N.; Abriata, L.A.; Cefaro, C.; Gajda, K.; Banci, L.; Vila, A.J. Loop recognition and copper-mediated disulfide reduction underpin metal site assembly of CuA in human cytochrome oxidase. Proc. Natl. Acad. Sci. USA 2015, 112, 11771–11776. [Google Scholar] [CrossRef] [PubMed] [Green Version]
  28. Porter, T.M.; Hajibabaei, M. Automated high throughput animal CO1 metabarcode classification. Sci. Rep. 2018, 8, 1–10. [Google Scholar] [CrossRef]
  29. Eckert, K.L.; Bjorndal, K.A.; Abreu-Grobois, F.A.; Donnelly, M. (Eds.) Técnicas de Investigación y Manejo para la Conservación de las Tortugas Marinas; Grupo Especialista en Tortugas Marinas (Spanish); SSC/IUCN Marine Turtle Specialist Group: Washington, DC, USA, 2000; Volume 4. [Google Scholar]
  30. Carreras, C.; Rees, A.F.; Broderick, A.C.; Godley, B.J.; Margaritoulis, D. Mitochondrial DNA markers of loggerhead marine turtles (Caretta caretta) (Testudines: Cheloniidae) nesting at Kyparissia Bay, Greece, confirm the western Greece unit and regional structuring. Sci. Mar. 2014, 78, 115–124. [Google Scholar] [CrossRef] [Green Version]
  31. Craven, K.S.; Hodgson, J.Y.S.; Shaver, D.J.; Walker, J.S.; Villalba-Guerra, M.R.; Owens, D.W. Evaluation of gonadal tissue to validate size at reproductive maturity in Kemp’s ridley sea turtles found stranded in Texas, USA. Diversity 2019, 11, 76. [Google Scholar] [CrossRef] [Green Version]
  32. Owens, W.; Ruiz, G.J. New Methods of Obtaining Blood and Cerebrospinal Fluid From Marine Turtles. Herpetologica 1980, 36, 17–20. [Google Scholar]
  33. FitzSimmons, N.N.; Moritz, C.; Bowen, B. Population identification. In Research and management techniques for the conservation of sea turtles, 1st ed.; Eckert, K.L., Bjorndal, K.A., Abreu-Grobois, F.A., Donnelly, M., Eds.; SSC/IUCN Marine Turtle Specialist Group: Washington, DC, USA, 1999; pp. 82–88. [Google Scholar]
  34. Ivanova, N.V.; Zemlak, T.S.; Hanner, R.H.; Hebert, P.D.N. Universal primer cocktails for fish DNA barcoding. Mol. Ecol. Notes 2007, 7, 544–548. [Google Scholar] [CrossRef]
  35. Becker, S.; Hanner, R.; Steinke, D. Five years of FISH-BOL: Brief status report. Mitochondrial DNA 2011, 22, 3–9. [Google Scholar] [CrossRef] [Green Version]
  36. Camacho-Sánchez, F.Y.; Aguirre, A.A.; Narváez-Zapata, J.A.; Zavala-Norzagaray, A.A.; Ley-Quiñónez, C.P.; Acosta-Sánchez, H.H.; Rodriguez-González, H.; Delgado-Trejo, C.; Reyes-López, M.A. DNA barcode analysis of the endangered green turtle (Chelonia mydas) in Mexico. Genome 2021, 64, 879–891. [Google Scholar] [CrossRef]
  37. Hall, T.A. BioEdit: A user-friendly biological sequence alignment editor and analysis program for Windows 95/98/NT. Nucleic Acids Symp. Ser. 1999, 41, 95–98. [Google Scholar]
  38. Larkin, M.A.; Blackshields, G.; Brown, N.P.; Chenna, R.; McGettigan, P.A.; McWilliam, H.; Valentin, F.; Wallace, I.M.; Wilm, A.; Lopez, R.; et al. Clustal W and Clustal X version 2.0. Bioinformatics 2007, 23, 2947–2948. [Google Scholar] [CrossRef] [PubMed] [Green Version]
  39. Leigh, J.W.; Bryant, D. Popart: Full-feature software for haplotype network construction. Methods Ecol. Evol. 2015, 6, 1110–1116. [Google Scholar] [CrossRef]
  40. Clement, M.; Posada, D.; Crandall, K.A. TCS: A computer program to estimate gene genealogies. Mol. Ecol. 2000, 9, 1657–1659. [Google Scholar] [CrossRef] [PubMed] [Green Version]
  41. Kimura, M. A simple method for estimating evolutionary rates of base substitutions through comparative studies of nucleotide sequences. J. Mol. Evol. 1980, 16, 111–120. [Google Scholar] [CrossRef] [PubMed]
  42. Kumar, S.; Stecher, G.; Li, M.; Knyaz, C.; Tamura, K. MEGA X: Molecular evolutionary genetics analysis across computing platforms. Mol. Biol. Evol. 2018, 35, 1547–1549. [Google Scholar] [CrossRef] [PubMed]
  43. Nguyen, L.T.; Schmidt, H.A.; Von Haeseler, A.; Minh, B.Q. IQ-TREE: A fast and effective stochastic algorithm for estimating maximum-likelihood phylogenies. Mol. Biol. Evol. 2015, 32, 268–274. [Google Scholar] [CrossRef] [PubMed]
  44. Minh, B.Q.; Nguyen, M.A.T.; Von Haeseler, A. Ultrafast approximation for phylogenetic bootstrap. Mol. Biol. Evol. 2013, 30, 1188–1195. [Google Scholar] [CrossRef]
  45. Kalyaanamoorthy, S.; Minh, B.Q.; Wong, T.K.F.; Von Haeseler, A.; Jermiin, L.S. ModelFinder: Fast model selection for accurate phylogenetic estimates. Nat. Methods 2017, 14, 587–589. [Google Scholar] [CrossRef] [Green Version]
  46. Rozas, J.; Ferrer-Mata, A.; Sánchez-DelBarrio, J.C.; Guirao-Rico, S.; Librado, P.; Ramos-Onsins, S.E.; Sánchez-Gracia, A. DnaSP 6: DNA sequence polymorphism analysis of large data sets. Mol. Biol. Evol. 2017, 34, 3299–3302. [Google Scholar] [CrossRef]
  47. Hudson, R.R.; Slatkin, M.; Maddison, W.P. Estimation of levels of gene flow from DNA sequence data. Genetics 1992, 132, 583–589. [Google Scholar] [CrossRef]
  48. Phillips, J.D.; French, S.H.; Hanner, R.H.; Gillis, D.J. HACSim: An R package to estimate intraspecific sample sizes for genetic diversity assessment using haplotype accumulation curves. PeerJ Comput. Sci. 2020, 6, e243. [Google Scholar] [CrossRef] [PubMed] [Green Version]
  49. Archie Carr Center for Sea Turtle Research, “mtDNA Sequences”. Available online: https://accstr.ufl.edu/resources/mtdna-sequences/ (accessed on 15 March 2022).
  50. Pentinsaari, M.; Salmela, H.; Mutanen, M.; Roslin, T. Molecular evolution of a widely-adopted taxonomic marker (COI) across the animal tree of life. Sci. Rep. 2016, 6, 1–12. [Google Scholar] [CrossRef]
  51. Frandsen, H.R.; Figueroa, D.F.; George, J.A. Mitochondrial genomes and genetic structure of the Kemp’s ridley sea turtle (Lepidochelys kempii). Ecol. Evol. 2020, 10, 249–262. [Google Scholar] [CrossRef] [PubMed] [Green Version]
  52. Gredzens, C.; Shaver, D.J. Satellite Tracking Can Inform Population-Level Dispersal to Foraging Grounds of Post-nesting Kemp’s Ridley Sea Turtles. Front. Mar. Sci. 2020, 7, 559. [Google Scholar] [CrossRef]
  53. Shaver, D.J.; Hart, K.M.; Fujisaki, I.; Rubio, C.; Sartain, A.R.; Peña, J.; Burchfield, P.M.; Gamez, D.G.; Ortiz, J. Foraging area fidelity for Kemp’s ridleys in the Gulf of Mexico. Ecol. Evol. 2013, 3, 2002–2012. [Google Scholar] [CrossRef]
  54. Uribe-Martínez, A.; Liceaga-Correa, M.A.; Cuevas, E. Critical in-water habitats for post-nesting sea turtles from the southern gulf of mexico. J. Mar. Sci. Eng. 2021, 9, 793. [Google Scholar] [CrossRef]
  55. Covelo, P.; Nicolau, L.; López, A. Four new records of stranded Kemp’s ridley turtle Lepidochelys kempii in the NW Iberian Peninsula. Mar. Biodivers. Rec. 2016, 9, 1–5. [Google Scholar] [CrossRef] [Green Version]
  56. Bean, S.B.; Logan, J.M. Stable isotope analyses of cold-stunned Kemp’s ridley (Lepidochelys kempii) sea turtles at the northern extent of their coastal range. Mar. Biol. 2019, 166, 1–10. [Google Scholar] [CrossRef]
  57. Gallaway, B.J.; Gazey, W.J.; Caillouet, C.W., Jr.; Plotkin, P.T.; Grobois, F.A.A.; Amos, A.F.; Burchfield, P.M.; Carthy, R.R.; Martínez, M.A.C.; Cole, J.G.; et al. Development of a Kemp’s ridley sea turtle stock assessment model. Gulf Mex. Sci. 2016, 33, 138–157. [Google Scholar] [CrossRef] [Green Version]
  58. Caillouet, C.W., Jr.; Gallaway, B.J. Kemp’s Ridley Sea Turtle Emigration and Immigration Between The Gulf Of Mexico And North Atlantic Ocean Should Not Be Ignored In Age-Structured Population Modeling. Mar. Turt. Newsl. 2020, 161, 9–14. [Google Scholar]
  59. Caillouet, C.W.J. Substantial Reduction in Annual Production of Kemp’s Ridley Sea Turtle Hatchlings on Beaches of Tamaulipas, Mexico May Allow Abundance of Adults to Increase. Mar. Turt. Newsl. 2021, 163, 1–7. [Google Scholar]
  60. Miller, J.M.; Quinzin, M.C.; Edwards, D.L.; Eaton, D.A.R.; Jensen, E.L.; Russello, M.A.; Gibbs, J.P.; Tapia, W.; Rueda, D.; Caccone, A. Genome-Wide Assessment of Diversity and Divergence Among Extant Galapagos Giant Tortoise Species. J. Hered. 2018, 109, 611–619. [Google Scholar] [CrossRef] [PubMed]
  61. Bhaskar, R.; Mohindra, V. Variability in DNA COI sequences reveals new haplotypes in freshwater turtles from northern region of India. Mitochondrial DNA Part B Resour. 2018, 3, 317–323. [Google Scholar] [CrossRef] [PubMed] [Green Version]
  62. Lamont, M.M.; Moreno, N.; Camacho-Sánchez, F.Y.; Acosta-Sánchez, H.H.; Glaberman, S.; Reyes-Lopez, M.A.; Chiari, Y. Genetic diversity of immature Kemp’s ridley (Lepidochelys kempii) sea turtles from the northern Gulf of Mexico. Aquat. Conserv. Mar. Freshw. Ecosyst. 2021, 31, 3003–3010. [Google Scholar] [CrossRef]
Figure 1. Location of the main Kemp’s ridley nesting beaches in Tamaulipas, Mexico. The figure shows the name and abbreviations of the nesting beaches and their respective Latitude and Longitude.
Diversity 14 00390 g001
Figure 2. Haplotype network of the 5 haplotypes found for Kemp’s ridley (Lepidochelys kempii) using COI sequences obtained from BOLD and specimens collected in Mexico, 2010, 2016, 2018. The size of the circle indicates the number of individuals that share the same haplotype, and the colors correspond to different sampling locations. The small line indicates a mutation step. * New Haplotypes. ** Previously reported haplotype.
Diversity 14 00390 g002
Figure 3. Distribution of the 5 Lepidochelys kempii haplotypes based on the mitochondrial COI gene.
Diversity 14 00390 g003
Figure 4. Haplotype accumulation curve. (A) Haplotype accumulation curve; (B) Haplotype frequency distribution. The data obtained were made using the HACSim function in the R package with 1000 permutations (Phillips et al., 2020).
Diversity 14 00390 g004
Figure 5. The maximum likelihood phylogenetic tree for Kemp’s ridley representing the phylogenetic relationships for the 624 bp COI sequence with the marine turtle outer cluster.
Diversity 14 00390 g005
Table 1. Mitochondrial haplotypes were obtained for 118 COI sequences from Kemp’s ridley (Lepidochelys kempii) in BOLD and field samples collected in Mexico, 2018–2019; Nucleotides change positions related to the consensus sequence (113 or 716, GenBank accession, respectively), number of sequences (n), number of haplotypes (H), nucleotide (Pi), and haplotype (h) diversities, and G + C.
ID SequencePositionNumber of Sequences
(n)
Number of Haplotypes
(H)
hPiG + C
71550590604
Population
(LK-COI-01 */LK-RN01)
NANANANA11820.3030.000520.422
LK-COI-01 *CTTA97100ND
LK-RN01 C18100ND
LK-RN02 C C11NDNDND
LK-RN03 CC11NDNDND
LK-RN04T C11NDNDND
* Control sequence. NA: Not Applicable. ND: Not Determined.
Table 2. The number of Lepidochelys kempii individuals for each haplotype found in each locality.
HAPLOTYPESAltamira
MEX
Miramar
MEX
Tepehuajes
MEX
Barra del Tordo
MEX
Rancho Nuevo
MEX
South Padre
USA
New York
USA
East Coast
USA
TOTAL
LK-RN0153228500097
LK-COI-0100010105218
LK-RN02000010001
LK-RN03000010001
LK-RN04000010001
TOTAL5323881052118
Table 3. Interspecific distance established between COI gene sequences among Kemp’s ridley (Lepidochelys kempii) collected in Mexico and sequences described in BOLDSystem from other sea turtle species, 2010, 2018–2019. Mean pairwise divergences between species are below (K2P) and above (p-distance) the diagonal.
SpeciesLkLoCcCmPCmAEiDcNdCs
Lepidochelys kempii (Lk) 0.020.050.080.080.070.100.080.14
Lepidochelys olivacea (Lo)0.02 0.050.080.080.070.110.080.15
Caretta caretta (Cc)0.050.06 0.090.080.070.110.080.14
Chelonia mydas (CmP)0.080.080.10 0.010.080.120.060.14
Chelonia mydas (CmA)0.090.080.090.01 0.080.110.060.13
Eretmochelys imbricata (Ei)0.070.080.080.080.08 0.100.080.13
Dermochelys coriacea (Dc)0.120.120.130.130.130.11 0.110.15
Natator depressus (Nd)0.090.090.080.080.070.090.12 0.13
Centrochelys sulcata (Cs)0.160.170.160.160.150.150.170.14
Publisher’s Note: MDPI stays neutral with regard to jurisdictional claims in published maps and institutional affiliations.

