Article

Diet Metabarcoding Reveals Extensive Dietary Overlap between Two Benthic Stream Fishes (Zingel asper and Cottus gobio) and Provides Insights into Their Coexistence

1
Aix Marseille Université, CNRS, IRD, Avignon Université, IMBE, 13007 Marseille, France
2
Centre Universitaire de Formation et de Recherche de Mayotte, 97660 Dembeni, France
3
MARBEC, University of Montpellier, CNRS, Ifremer, IRD, 34090 Montpellier, France
4
INRAE, Aix Marseille Université, RECOVER, 13100 Aix-en-Provence, France
*
Author to whom correspondence should be addressed.
Submission received: 7 April 2022 / Revised: 27 April 2022 / Accepted: 20 May 2022 / Published: 23 May 2022

Abstract

:
Niche partitioning studies are essential to understand the mechanisms that allow ecologically similar species to coexist. The Rhone streber (Zingel asper) and the European bullhead (Cottus gobio) are both benthic riverine fishes that consume macroinvertebrates. Both species are protected under European legislature. We focused on trophic niche partitioning between these species, as sufficient access to trophic resources is an important requirement for long-term coexistence. We used a combination of faeces metabarcoding dietary data and prey community data to evaluate dietary overlap, trophic niche variation and dietary preferences. Sampling was performed in three sites along the Durance River (France). Both species consumed a wide range of macroinvertebrates but neither C. gobio nor Z. asper selected the most abundant taxa (chironomids and simuliids). Both species selected larger mayfly (Baetis and Ecdyonurus) and caddisfly (Hydropsyche) taxa. Dietary overlap was generally high but declined when large mayflies were rare. Contrasting secondary prey preferences and trophic niche variation may allow these species to exploit the same preferred mayflies in periods of abundance and to avoid competition during resource scarcity. We propose that dietary partitioning may support the coexistence of these two ecologically similar, benthic predators.

1. Introduction

Understanding how species successfully coexist despite competitive pressures is a fundamental question of trophic ecology [1,2,3,4,5]. When resources are scarce, competition for resources should lead to the extinction of less efficient competitors via competitive exclusion [1]. However, classic niche theory predicts that species that share similar fundamental niches differentiate in terms of their realized niches, thus promoting coexistence. This so-called resource partitioning is an important ecological process that can prevent competitive exclusion and promote the maintenance of species diversity and complex food webs [6]. Resource partitioning can arise due to various trade-offs in species’ realised niches, such as prey preferences, habitat-use and/or periods of activity (e.g., diurnal vs. nocturnal) [7,8,9,10]. These trade-offs promote differential resource use and thus coexistence when shared resources are scarce. The degree of dietary overlap was originally suggested as a measurement of interspecific competition between similar predators [11]. However, it has since become clear that dietary overlap should be interpreted in the context of prey community data [12]. Many researchers have investigated how fluctuations in resource availability affect dietary overlap, and responses appear to be highly context-dependent. For example, in temperate streams, competitors may coexist with high overlap in resource-rich periods but specialise according to species-specific resource preferences in depauperate periods [7,13]. In tropical streams, high resource availability during the wet season can lead to specialisation, while during the dry period resource limitation can be so great that high dietary overlap cannot be avoided [14]. It is, therefore, important to evaluate prey preferences in the context of resource availability in order to properly interpret variation in resource partitioning.
This study investigates the trophic interaction between two native benthic fish predators: the Rhone streber (Zingel asper (L.)) [Actinopterygii: Perciformes: Percidae] and the European bullhead (Cottus gobio L.) [Actinopterygii: Scorpaeniformes: Cottidae]. Zingel asper and C. gobio are riverine fishes that coexist across the Rhone river basin in south-eastern France and Switzerland [15]. Zingel asper was historically found throughout the Rhone basin, but following population declines in the 20th century, it is now limited to five disconnected populations [16]. It is currently found in the Durance, Verdon, Ardeche, Loue and Doubs river systems. Zingel asper is a small, short-lived species, with the adult size typically varying from 12 to 20 cm [17,18] and a life-span ranging from 3 to 6 years [19,20]. The typical habitat of Z. asper is characterised by small to medium-sized rivers, with gravel bottoms [17,21,22]. Zingel asper populations exhibit low density (maximum ~110 individuals ha−1) [18,23]. In contrast, C. gobio is widespread throughout most of Europe with the exception of Ireland and northern parts of the United Kingdom. Cottus gobio is not considered to be declining overall, but evidence of local population decline has been observed in a number of countries [24,25,26]. Cottus gobio is smaller than Z. asper, with individuals reaching a maximum of 12.5 cm and an average life-span estimated at 3–4 years [27]. It is found in small to medium-sized rivers as well as on rocky or gravel shores of cold lakes [27]. Contrary to Z. asper, C. gobio populations can reach high densities (e.g., 3400 individuals ha−1) in certain conditions [27,28]. Both Z. asper and C. gobio display a preference for shallow, gravel river habitats and subsist on a diet mainly composed of benthic macroinvertebrates [17,22,27,29]. If these shared ecological characteristics translate to similar trophic niches, Z. asper and C. gobio could potentially compete for resources when facing resource limitation. Furthermore, C. gobio has been shown to be capable of significantly reducing key local prey densities [28,30,31]. Determining the potential for competition between these coexisting species is of particular conservation concern for Z. asper, which is listed as “critically endangered” on the IUCN red-list [32].
Until recently, most studies aimed to quantify resource partitioning at the species level [2]. However, this overlooks ecologically significant variation within populations, such as variation in prey preferences [33], habitat use [34] and competitive ability [35]. Within-population variability in diet can modify predator–prey interactions (e.g., Jensen’s inequality [2]) and thus competitive interactions. At the population level, ecological release from interspecific competition is expected to lead to a niche expansion [36]. However, at the individual level, population niche expansions can result from broader individual niches (generalisation) or from higher between-individual dietary variation (e.g., specialisation) [37]. The importance of accounting for individual-level trophic niche variation is becoming increasingly recognised, as these two individual-level responses have different ecological consequences [36,38,39]. Previous studies that incorporate both intraspecific and interspecific trophic niche variation have yielded important insights into the mechanisms of coexistence between potentially competing species [40,41].
Dietary studies based on metabarcoding data are becoming increasingly common and provide a valuable alternative to traditional morphological-based and stable isotope dietary analyses [42,43]. The main advantage of using metabarcoding data over traditional methods is related to its capacity to provide high taxonomic resolution of prey taxa, often to the species level [42]. Metabarcoding approaches have already proven to provide exhaustive descriptions of dietary overlap between freshwater fishes [44]. Metabarcoding is also particularly well-suited for determining prey preferences. Like morphological gut-content analyses, metabarcoding data correspond to 1–3 days of foraging [45], which facilitates comparisons between diet and short-term prey community data.
Due to the critically endangered status of Z. asper, we aimed to evaluate the potential for resource competition between Z. asper and C. gobio. As competition is only expected to occur when resources are limited [1], we related local prey availability to variation in dietary overlap, prey preferences and trophic traits to determine the potential for competition. The expected response of trophic traits to interspecific competition is well-established within the framework of optimal foraging theory [46] and by experimental studies [36]. Thus, in order to determine whether competitive forces drive trophic niche variation in these species, we estimated individual and population trophic traits for Z. asper and C. gobio. We then interpreted variation in trophic traits in the context of variation in the prey community. By studying several dimensions of trophic variation between Z. asper and C. gobio, this study aimed to highlight the mechanisms of coexistence between these potentially competing species.

2. Materials and Methods
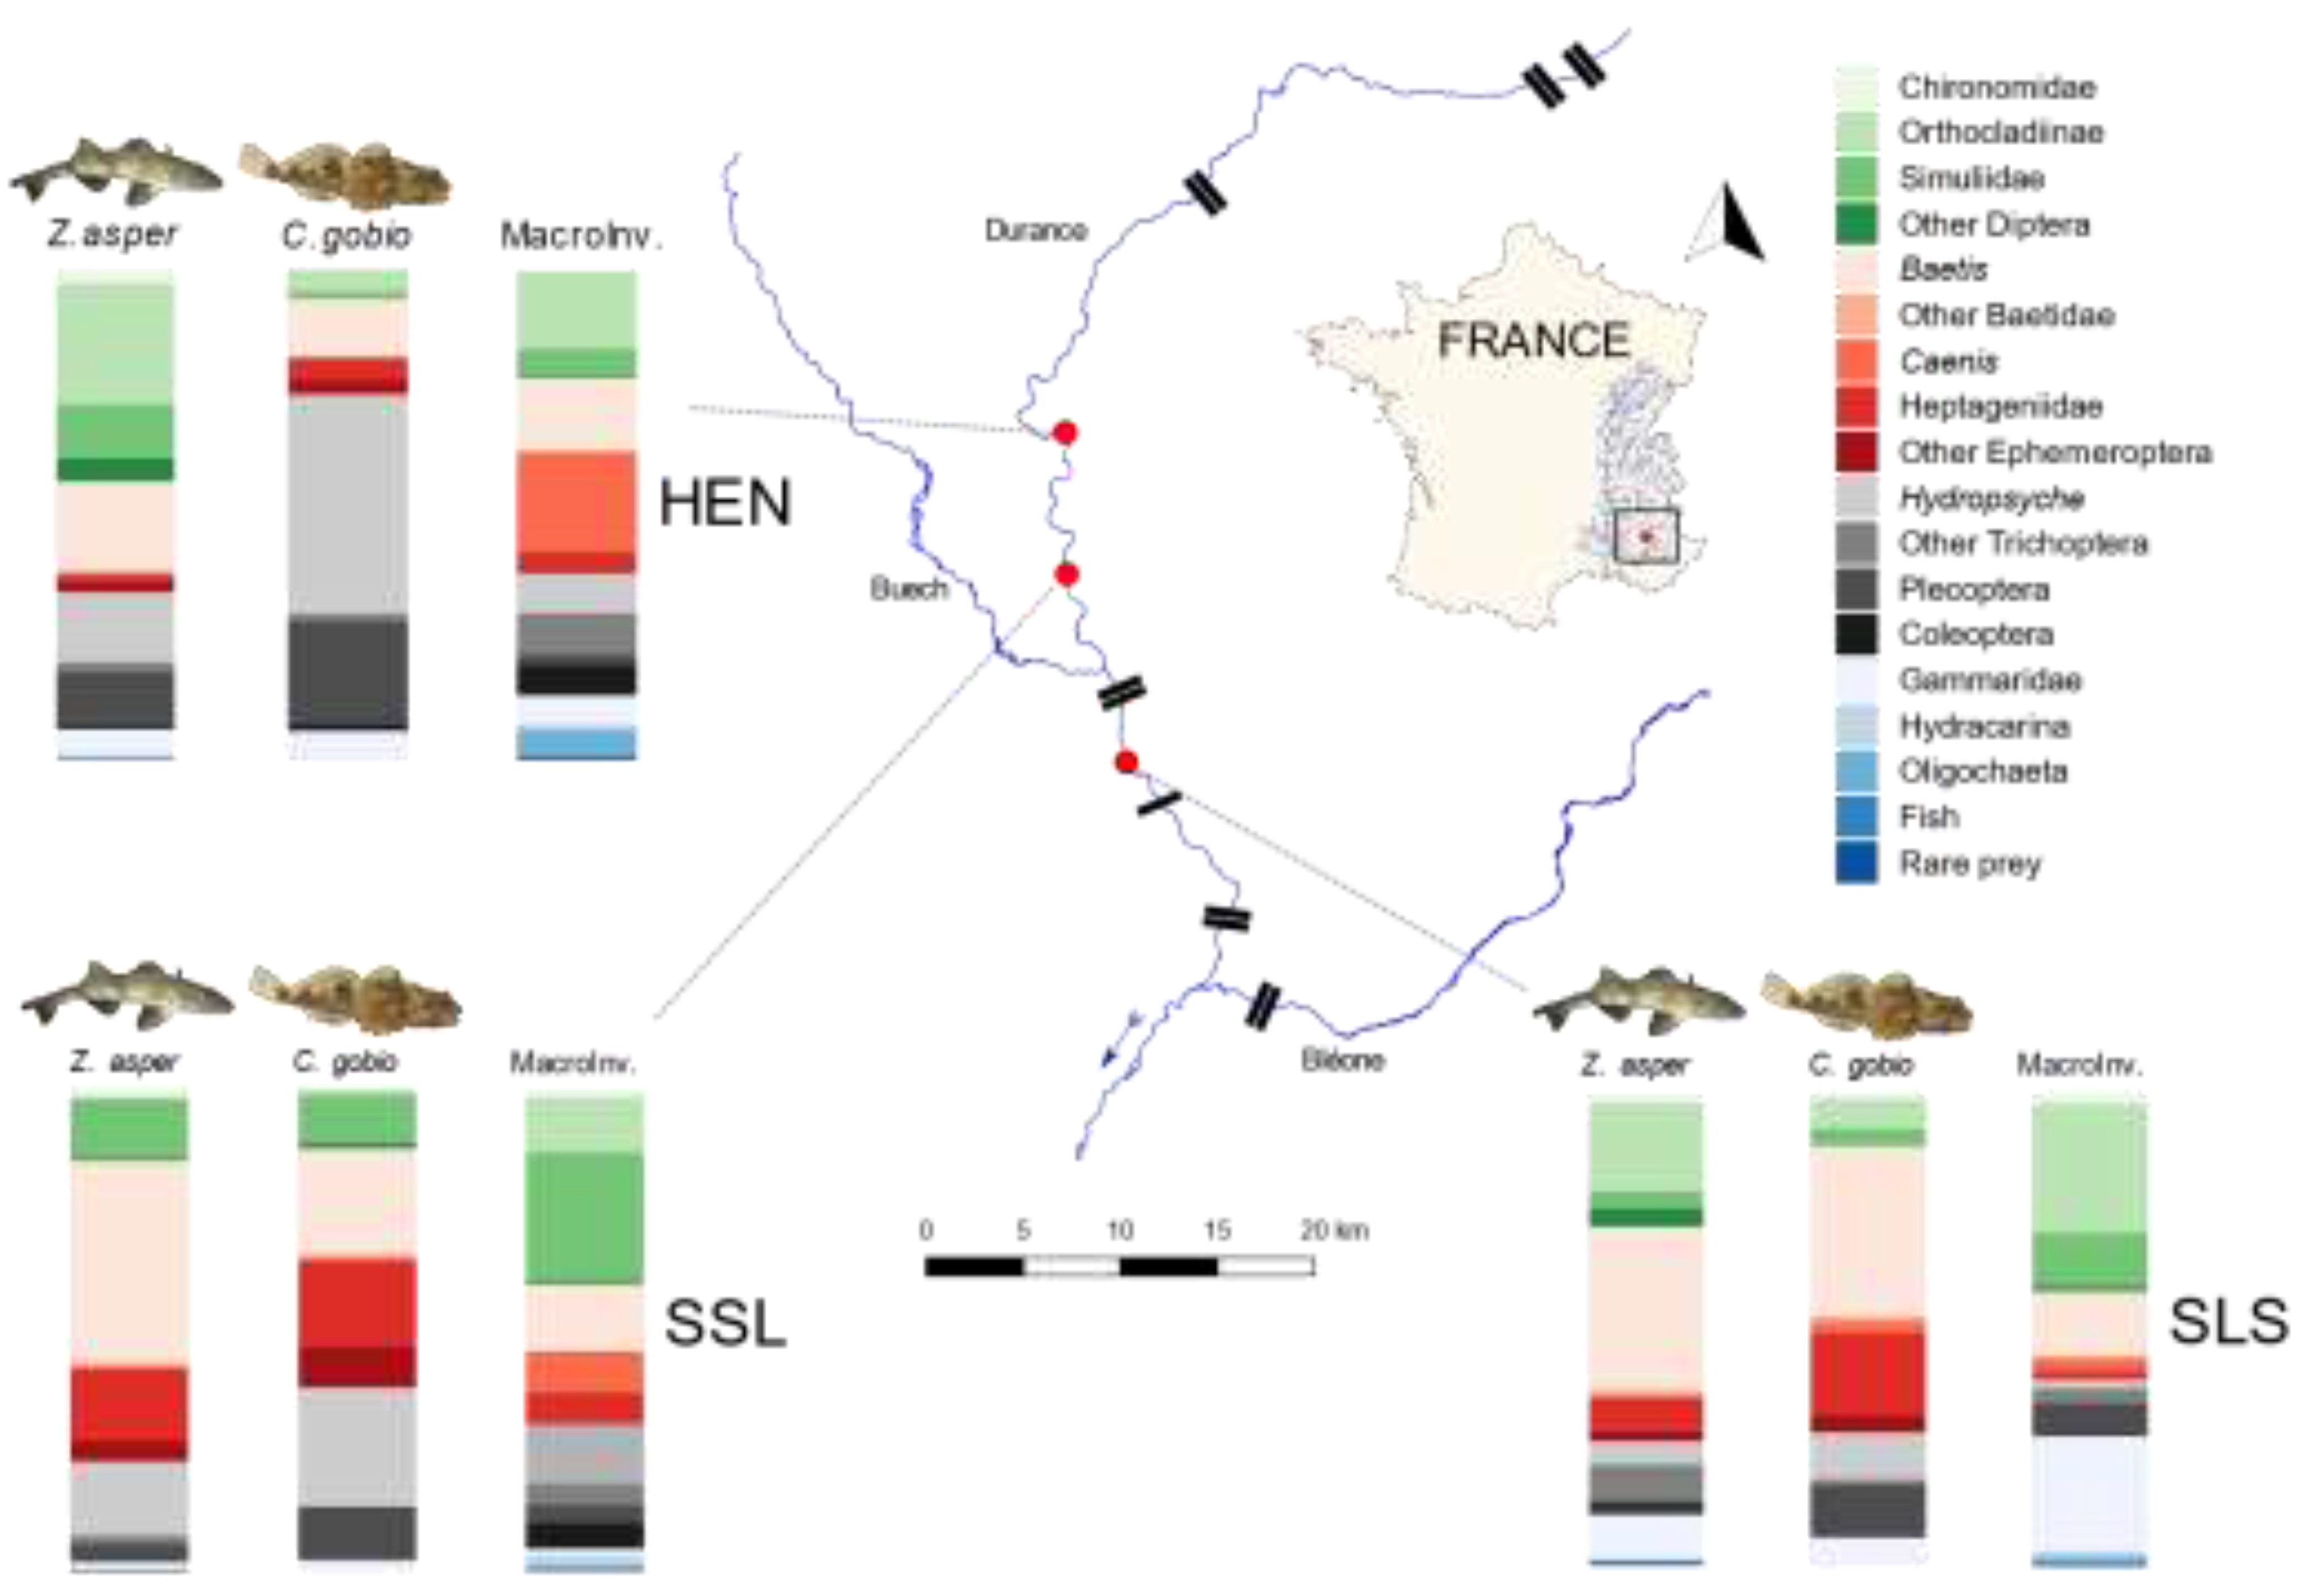
2.1. Sampling Sites

We investigated dietary overlap, prey preferences and trophic traits at three sites along the Durance River in the southern section of the Rhone basin, southeast France. Sampling was performed at three sites where Z. asper and C. gobio coexist, in summer and autumn 2015 (Table 1). River flow at the sampling sites is regulated by upstream dams [47] (Figure 1). The average water temperature was of 17.6 °C (min 14.3 °C; max 24.9 °C), 15.4 °C (min 13 °C; max 17.3 °C) and 12.5 °C (min 10.5 °C; max 15.1 °C) for SSL SLS and HEN, respectively.

2.2. Macroinvertebrate Community Sampling

As Z. asper and C. gobio are described as benthic invertivores, the sampling of the prey community aimed to characterize benthic macroinvertebrate community composition, density and diversity. The macroinvertebrate sampling effort was distributed among the representative habitats (i.e., riffles, runs, glides and rare pools) in the river segment. Samples were collected using a Surber sampler by perpendicular transects between riverbanks, from downstream to upstream (Figure S1). One to five Surber samples (0.05 m2) were collected per transect in all accessible habitats (i.e., <80 cm depth; <2 m s−1 water velocity). Surber samples were immediately stored in 90% ethanol for subsequent taxonomic identification. Samples were collected at between 60 and 90 sampling points in each river segment (Table 1).

2.3. Taxonomic Assignment of Macroinvertebrates

To characterise the global composition of the prey community at each site, the taxonomic assignment of macroinvertebrates aimed to resolve taxa to low taxonomic levels (i.e., genus). However, when this was not possible due to technical limitations, taxa were aggregated at higher taxonomic levels (i.e., family or subfamily). The final macroinvertebrate inventory comprised 58 taxa (Table S1).
The size of potential prey has been identified as a key driver of prey selectivity in benthic fishes [8]. Therefore, we identified two taxa that may be positively selected by Z. asper and C. gobio (Baetis and Heptageniidae mayflies [17]) and described their size distribution across the three sampling campaigns. Mayfly species undergo variable emergence events that can greatly modify the density of large individuals [48]. We specifically described the density (inv.m−2) of individuals greater than and inferior to 5 mm, with 5 mm being a threshold beyond which mayflies may be considered large [49].

2.4. Dietary Data Sampling

Fishes were caught by electrofishing and then laid in a plastic, wire mesh fishpond until faeces collection was performed. Faeces were collected by pressing the fish abdomen by hand in order to drain out faeces. Faeces were immediately placed in a 2 mL vial containing 96% ethanol and stored at −20 °C. After faeces collection, fishes were released within the sampling area. A total of 115 and 64 faeces samples were collected for Z. asper and C. gobio, respectively.

2.5. Metabarcoding Protocol

Faecal DNA extractions and metabarcoding protocol were performed as described by [50,51]. Our metabarcoding protocol included a PCR-enrichment step based on the one-locus-several-primers (OLSP) strategy developed by Corse et al. (2019), which aims to minimize false negatives in metabarcoding data by using three distinct primer sets that target an overlapping region of the 5’ end of the Cytochrome c oxidase subunit I gene (COI) (Table 2). PCRs were conducted in triplicates, and amplicons were then processed and sequenced on an Illumina MiSeq v3 platform (as detailed in [50]). Our protocol also included a series of negative controls and two distinct mock sample communities (described in [51]) as positive controls.
High-throughput sequencing (HTS) data were then filtered using the amplicon sequence variant (ASV)-based procedure developed by [50], which is now implemented in VTAM [54]. In short, this procedure explicitly uses the sequencing outputs of negative and positive controls and exogenous samples in order to minimize false positives in faecal samples (i.e., experimental/molecular artefacts such as PCR/sequencing errors, tag switching and cross-sample contaminations). Reproducibility of ASVs was further ensured by explicitly using the sequencing outputs of technical (PCR) replicates. We also discarded chimeras and pseudogenes. Finally, the ASVs obtained from the different primer sets that were identical in their overlapping regions (~130 bp) were combined into contigs (further details in: [50,51]).
The taxonomic assignment of ASVs/contigs was conducted as detailed in [50]. As Z. asper mainly feed on macroinvertebrates but can also feed on fishes [17,51,55], we considered macroinvertebrates and fishes as relevant prey and collectively referred to them as Macrometazoans. All other taxa (listed in [51]) were excluded from the analyses. Prey abundance in each diet was estimated using the minimal number of individuals (MNI) statistic ([56]; MNI is a quantitative statistic that corresponds to the number of distinct ASVs/contigs validated in each sample for a given prey taxon (see [50]). A complete list of validated ASVs/contigs after filtration is available in Table S2.

2.6. Statistical Analyses

All statistical analyses and data manipulations were performed in R v 4.0.0 [57]. All dietary analyses were performed using the final taxonomic assignment (FTA) of prey acquired via metabarcoding, except for prey electivity analyses that were grouped at macroinvertebrate taxonomic assignment (Table S3).

2.6.1. Macroinvertebrate Community Composition

The taxonomic diversity of the macroinvertebrate community was estimated for each sampling site using a coverage-based rarefaction approach. In order to standardize the estimates for variation in sample coverage, rarefaction estimates were conducted at 95% sample coverage using the function EstimateD from the package iNEXT [58]. Taxonomic diversity was calculated using the Hill number equivalent of the Shannon index (q = 1;1D; [59]). Variation in macroinvertebrate composition between and within sites was visualized using principal component analysis (function PCA, package FactoMineR [60]). PCA visualisations were based on log10 (x + 1) transformed macroinvertebrate abundances.

2.6.2. Electivity

We evaluated prey preferences for Z. asper and C. gobio using the econullnetr package, which estimates electivity based on the discrepancy between observed prey consumption and neutral prey consumption according to null model simulations [61]. To avoid false positives (type-I errors) we only considered prey species that constituted a significant proportion of either Z. asper or C. gobio diets (>5% abundance) and/or the prey community (>5% abundance). This selection criterion was applied separately for each sampling site. The null model was calculated using the generate_null_net function based on mean population diets (sims = 1000). Electivity tests were performed using the test_interactions function.

2.6.3. Trophic Niche Traits

We calculated two individual trophic traits for Z. asper and C. gobio: the individual diet niche width (INW; related to α-diversity) and the between-individual component of diet niche width (BIC; related to β-diversity). The INW is related to the within-individual component (WIC) of the trophic niche width when using diet data [38]. Both INW and BIC were estimated using Hill number diversity indices [62,63]. The sensitivity of Hill numbers (qD) to rare prey taxa can be adjusted with the order of diversity parameter q [64]. INW was estimated using Hill number 1D (INW) [64], using hilldiv [65], which is related to the Shannon–Weaver index. BIC was estimated by calculating pairwise dissimilarity measurements from Hill number (1D) β-diversities and averaging the mean dissimilarity between each individual and other individuals in its population. Differences in INW and BIC between species were determined for each sampling campaign using Welch’s t-tests, which account for differences in sample sizes.
In addition to individual trophic traits, we estimated the total niche width (TNW; related to γ-diversity) for Z. asper and C. gobio at all sites using a coverage-based rarefaction approach [66]. In order to standardize the TNW estimates for variation in sample coverage, 1D rarefaction and extrapolation estimates were conducted at 85% sample coverage using the function EstimateD from the package iNEXT [58].

2.6.4. Dietary Overlap

Dietary overlap between Z. asper and C. gobio was estimated using Pianka’s overlap index [67]. We compared observed overlap at each sampling campaign to simulated values based on a null model to determine statistical significance (function niche_null_mode, package EcoSimR; [68]). The null model (N = 5000 simulations) was based on the most conservative algorithm (ra4), which shuffles resource use between and within each predator species. Lastly, we tested for differences in dietary overlap between sampling campaigns by comparing pairwise Bray–Curtis distances between Z. asper and C. gobio diets (function vegdist, package vegan). Due to the non-normal distribution of distance data, we performed a non-parametric Kruskal–Wallis test (function kruskal.test) followed by a Dunn’s test (function Dunntest, package FSA) post hoc comparison.

3. Results

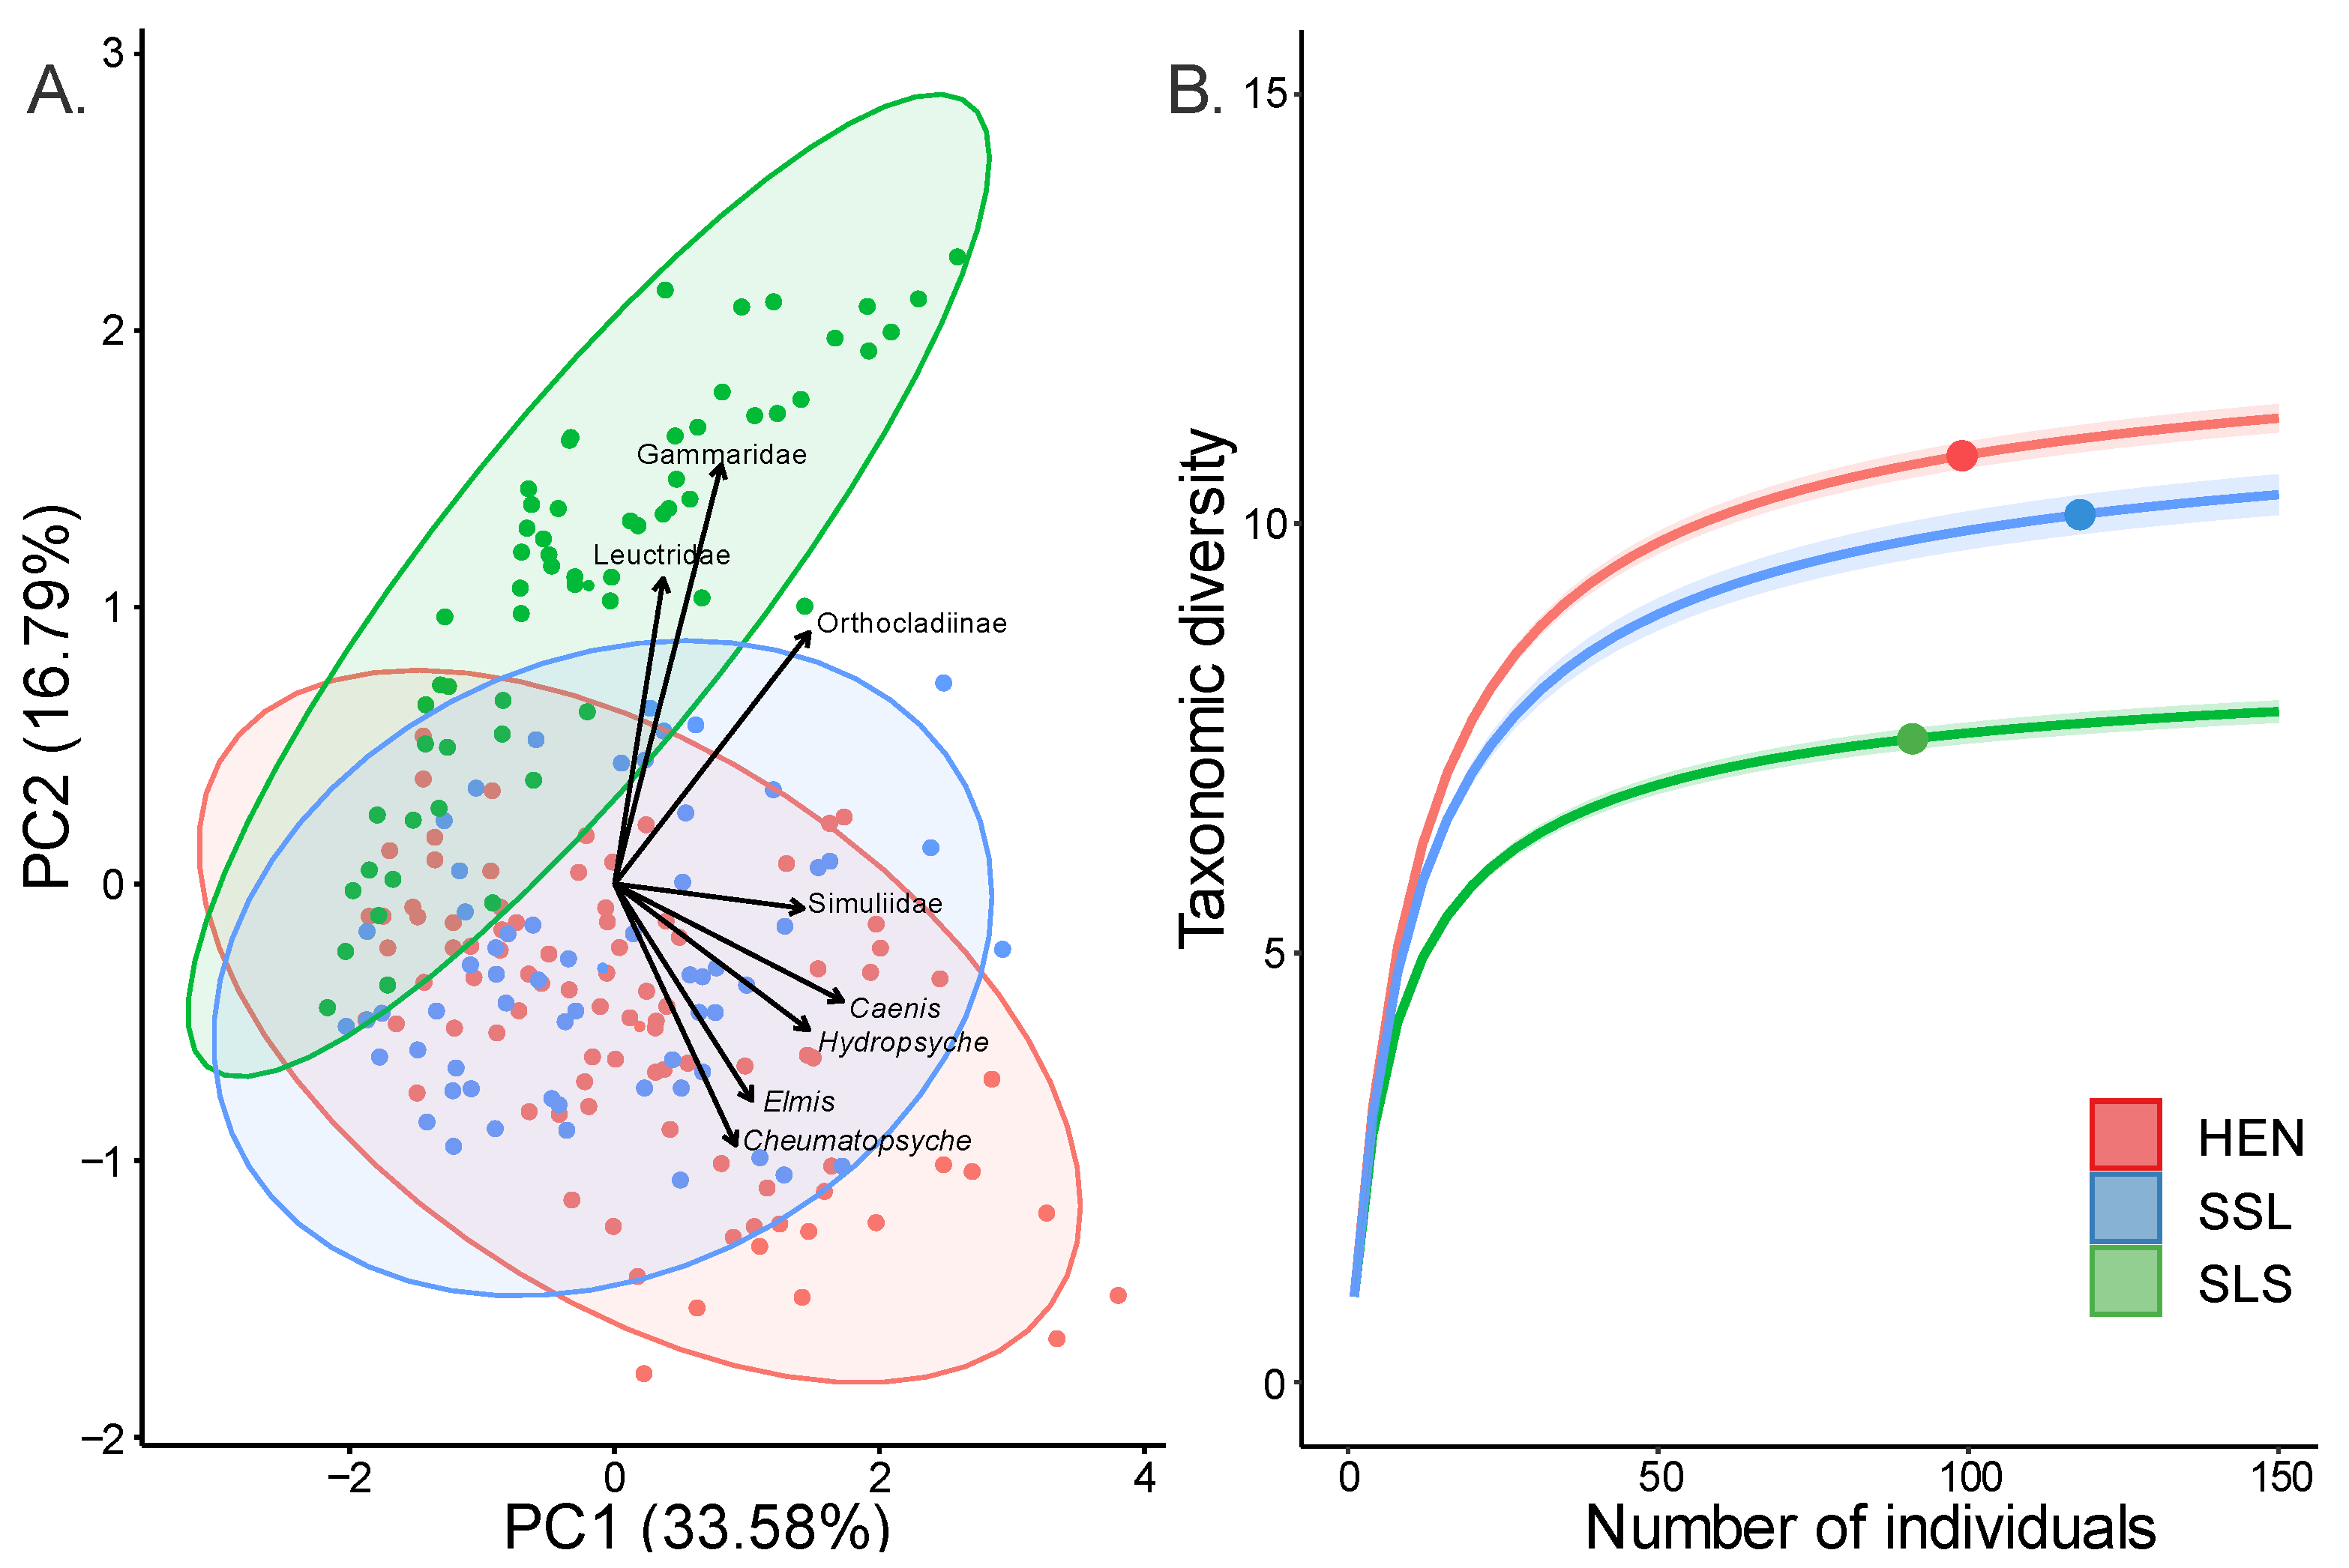
3.1. Macroinvertebrate Community Composition

Macroinvertebrate community composition varied greatly between sites. HEN was characterized by high Caenis (745 inv.m−2), Orthocladiinae (570 inv.m−2) and Baetis (550 inv.m−2) abundance (Figure 1), respectively constituting 20, 16 and 15% of the total prey abundance. At SSL, Simuliidae was the major macroinvertebrate group (792 inv.m−2), constituting 26% of total abundance. The next most abundant groups, Baetis (420 inv.m−2), Hydropsyche (374 inv.m−2) and Orthocladiinae (343 inv.m−2), only constituted 14%, 13% and 11% of the total macroinvertebrate abundance, respectively. Lastly, SLS was strongly characterized by Orthocladiinae (1414 inv.m−2) and Gammaridae (1266 inv.m−2), respectively constituting 27% and 24% of the total abundance, followed by Baetis (698 inv.m−2), Simuliidae (590 inv.m−2) and Plecoptera (Leuctridae; 336 inv.m−2), which accounted for 13%, 11% and 7% of the total abundance, respectively. For a complete inventory of macroinvertebrate assemblages, see Table S1.
According to principal component analysis, SLS exhibited the most distinct prey assemblage, rarely overlapping with HEN and SSL sampling points. The majority of SLS sampling points were characterized by high Gammaridae and Orthocladiinae abundance (Figure 2A). In comparison, SSL and HEN exhibited a higher degree of overlap and were characterized by high Hydropsyche and Caenis abundance. Rarefaction diversity estimates revealed that HEN exhibited the most taxonomically diverse macroinvertebrate assemblage (1D = 10.95), closely followed by SSL (1D = 10.11) (Figure 2B). SLS exhibited the lowest macroinvertebrate taxonomic diversity (1D = 7.49) but the highest average macroinvertebrate density (5194 inv.m−2), compared to 3004 inv.m−2 and 3659 inv.m−2 at SSL and HEN, respectively (see Table 3 for more details).
We observed spatial variation in the size-classes of potentially selected mayfly (Baetis and Heptageniidae) taxa (Table 4). The large Baetis (>5 mm) size-class was markedly less abundant in HEN (5 inv.m−2) compared to SSL and SLS (30 and 121 inv.m−2, respectively), whereas the small Baetis size-class (<5 mm) remained abundant in the three sites (545 inv.m−2 at HEN; 390 inv.m−2 at SSL; and 577 inv.m−2 at SLS). Variation in the abundance of large Heptageniidae between sites was less marked than for Baetis. We observed similar densities of large Heptageniidae at HEN (9 inv.m−2) and SSL (10 inv.m−2), with the highest abundances observed at SLS (21 inv.m−2). The opposite was observed for the small Heptageniidae size-class: HEN and SSL exhibited the highest densities (HEN and SSL; 124 and 159 inv.m−2, respectively), while SLS was notably less dense (67 inv.m−2).

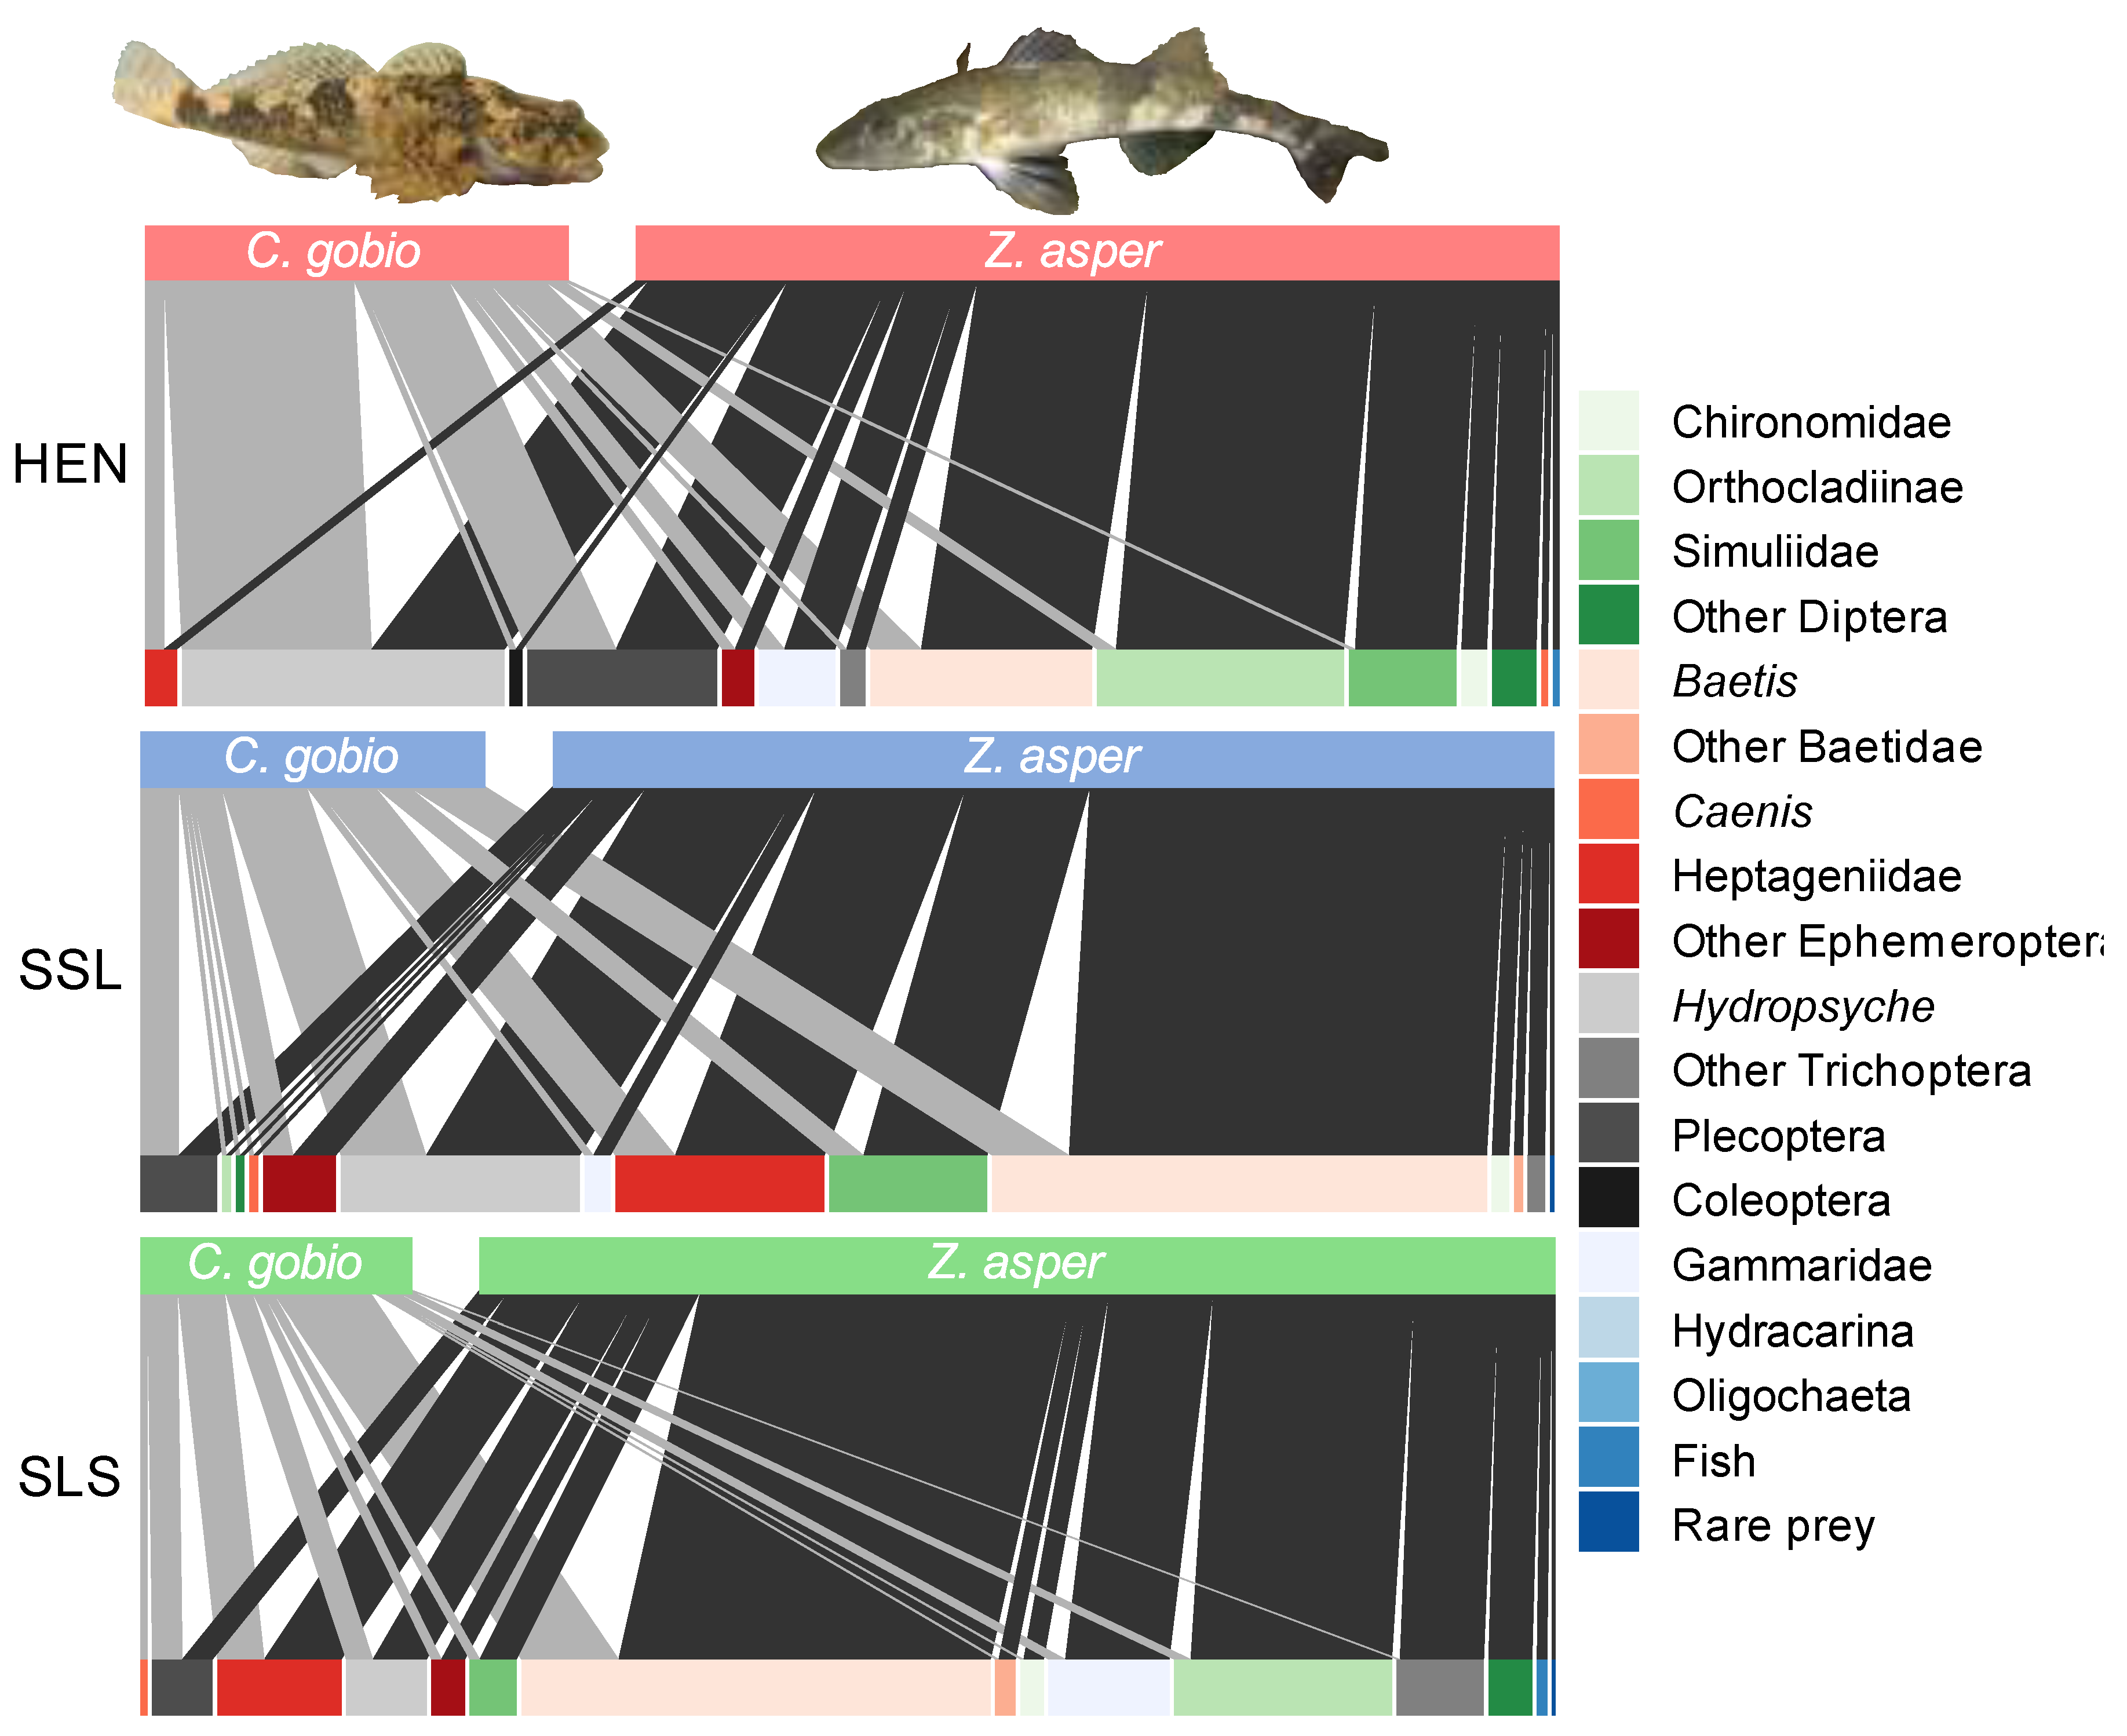
3.2. Z. asper and C. gobio Diet Composition

The metabarcoding approach employed in this study led to high taxonomic resolution, with 84 prey taxa identified: 75% at species level, 14% at genus level, 2% at sub-family level, 5% at family level and 2% at the phylum level (Table S2). Based on minimum number of individuals (MNI), feeding events varied across sampling campaigns, though they were consistently higher in Z. asper compared to C. gobio. MNI was lower at HEN (Z. asper; 5.03 ± 0.95, C. gobio; 2.74 ± 0.39) and SSL (Z. asper; 5.43 ± 0.37, C. gobio; 4.00 ± 0.58), and notably higher at SLS (Z. asper; 7.47 ± 0.64, C. gobio; 5.31 ± 0.57).
Baetis species constituted a main prey group for both the Z. asper and C. gobio diets (Figure 1; 32 and 24% of total consumption, respectively). Within the Baetis genus, B. fuscatus was clearly a main prey species for both predators (16% and 10% of total consumption for Z. asper and C. gobio, respectively), though other species such as B. lutheri and B. rhodani were also consumed. Hydropsyche was also consumed in high proportion by both species, but particularly by C. gobio, constituting 26% of overall diet, compared to 12% for Z. asper. Various Hydropsyche species appeared in both diets, but the main prey species was H. modesta. There was marked spatial variation in Hydropsyche consumption, with the highest consumption being observed at HEN where they constituted 45% of the C. gobio diet and 14% of the Z. asper diet.
Both species consumed Ecdyonurus (Heptageniidae) prey but with minimal consumption at HEN. Notable differences between the Z. asper and C. gobio diets included higher Orthocladiinae consumption by Z. asper (12% versus 4%, respectively) and higher Plecoptera consumption by C. gobio (14% versus 6%, respectively). Diet compositions also varied between sites. HEN was characterized by comparatively lower Baetis consumption for both species (Z. asper: 18% compared to 43% and 35% in SSL and SLS; C. gobio: 12% compared to 22% and 37% in SSL and SLS). Coinciding with lower Baetis consumption, both species exhibited higher Plecoptera consumption in HEN compared to other sites. For a complete summary of Z. asper and C. gobio diets, see Table S4.

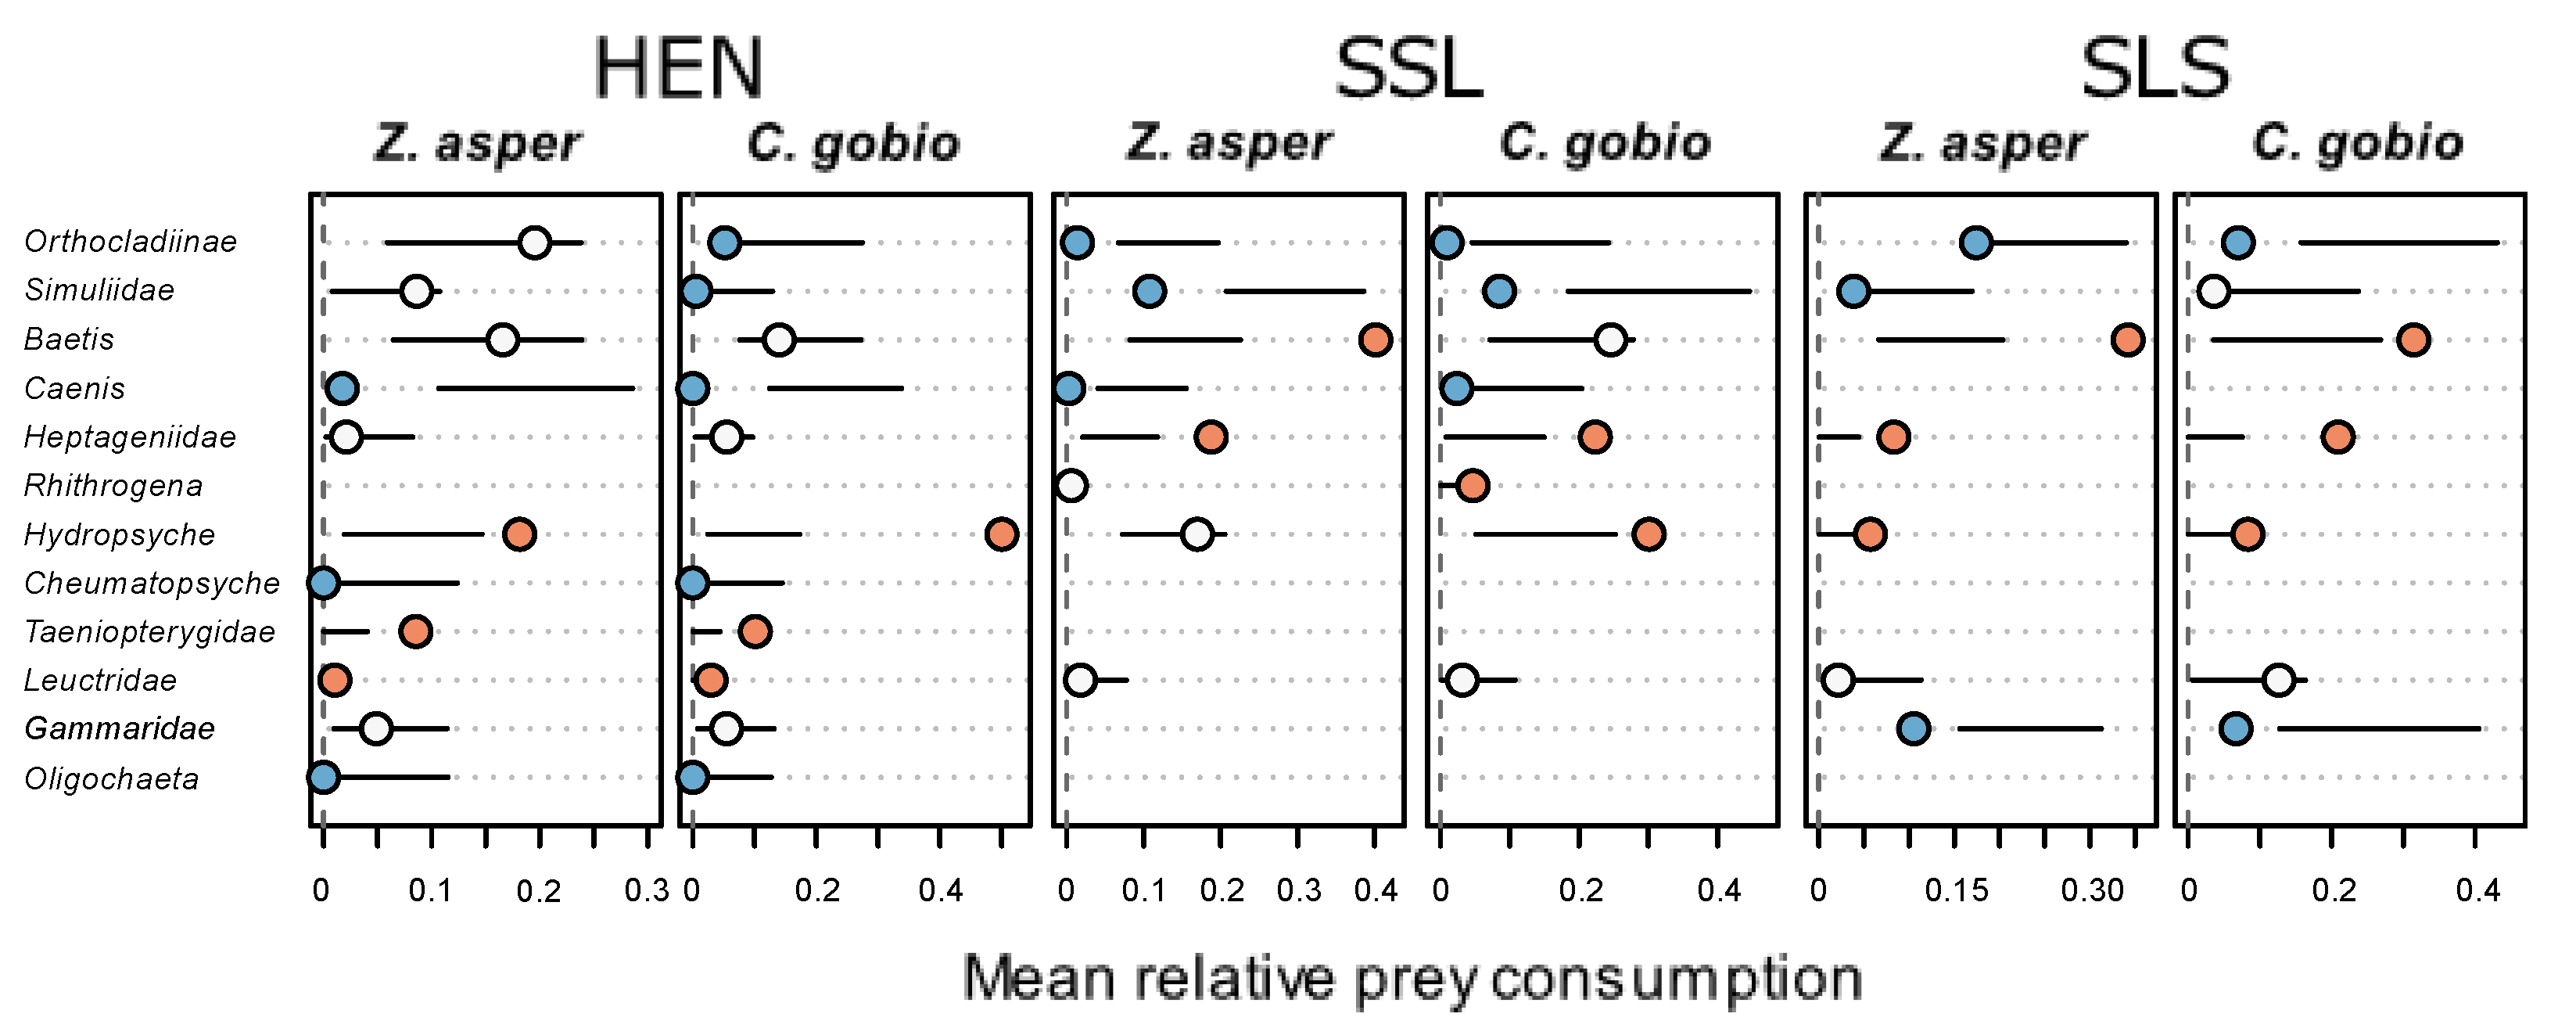
3.3. Prey Preferences

Electivity tests showed that Z. asper and C. gobio shared comparable prey preferences within each respective sampling campaign (Figure 3). At SSL and SLS, both Z. asper and C. gobio shared strong preferences for Baetis and Heptageniidae, and to a lesser extent for Hydropsyche, while Dipteran chironomids and simuliids were almost uniformly selected against. This pattern of prey preferences differed greatly from HEN, where both Z. asper and C. gobio shifted towards a preference for Hydropyche and two Plecoptera families (Taeniopterygidae and Leuctridae). While Baetis and Heptageniidae were still neutrally consumed by both Z. asper and C. gobio, they were not positively selected at HEN. It is also at HEN that we observed the most marked differences between Z. asper and C. gobio selection. Though both species positively selected Hydropyche at HEN, C. gobio consumed twice as much Hydropsyche than the null model prediction. In comparison, Z. asper consumption of Hydropsyche only marginally exceeded the null prediction. Instead, Z. asper neutrally selected Orthocladiinae and Simuliidae (Diptera) at HEN, while C. gobio negatively selected these taxa.

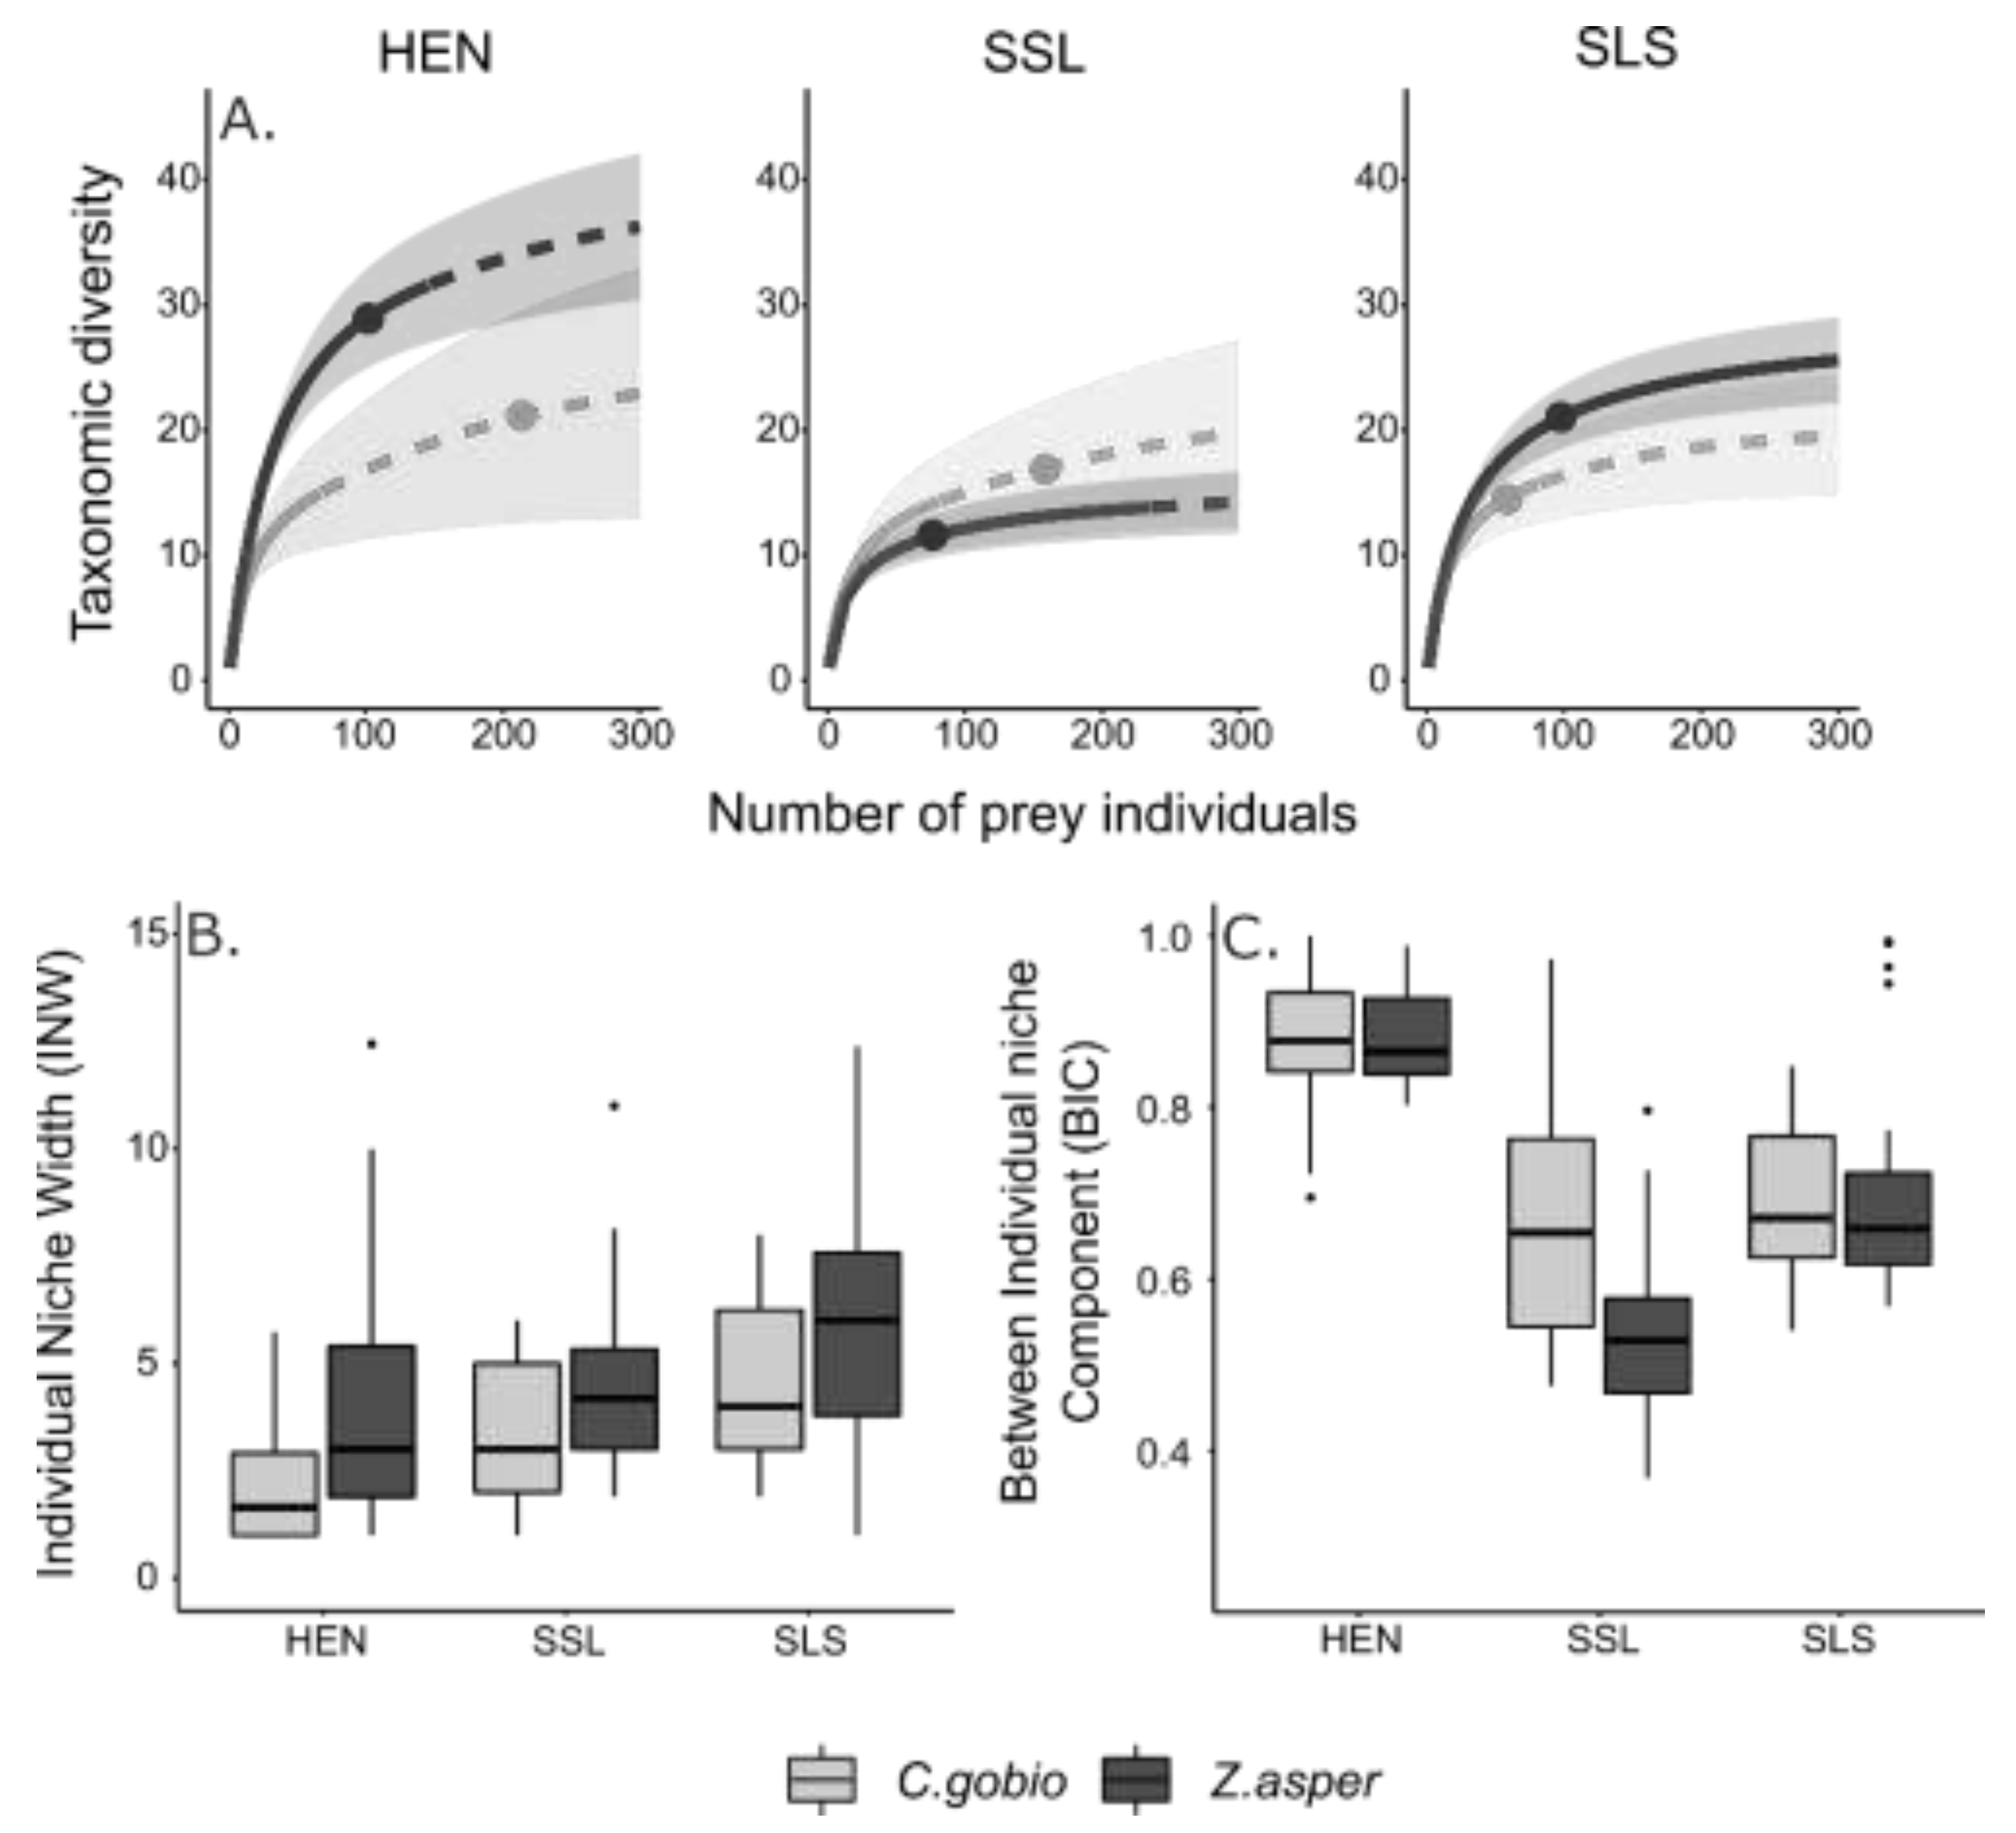
3.4. Comparison of Z. asper and C. gobio Trophic Traits

Variation in individual and population trophic traits appeared to follow a similar pattern for both C. gobio and Z. asper (Figure 4, Table 2). At HEN, both species exhibited smaller individual niche widths (INW) and higher between-individual niche variation (BIC) in relation to SSL and SLS (summer). Summer sites (SSL and SLS) were associated with narrower TNW and BIC, and wider INW.
Both C. gobio and Z. asper exhibited a broader population niche width (TNW) at HEN. However, while the TNW of Z. asper at HEN fell outside of the 95% CIs of those measured at SSL and SLS, the TNW of C. gobio at HEN overlapped with the TNW at SSL and SLS (Figure 4; Table 2). Additionally, Z. asper tended to exhibit a larger population niche width (TNW) than C. gobio. Although TNW 95% CIs overlapped at all sites between Z. asper and C. gobio, overlap was marginal at HEN, with TNW = 28.8 and 20.6 for Z. asper and C. gobio, respectively.
Zingel asper and C. gobio differed significantly in terms of INW, wherein individual niche widths were generally larger in Z. asper compared to C. gobio. Welch’s t-tests confirmed that the differences were statistically significant for HEN (t33 = −2.95, p = 0.006), SSL (t43 = −2.19, p = 0.034) and SLS (t42 = −2.14, p = 0.039). For the between-individual component (BIC) of the trophic niche, the only significant difference between species was observed at SSL, wherein BIC was higher in C. gobio compared to Z. asper (t30 = 4.08, p < 0.001).

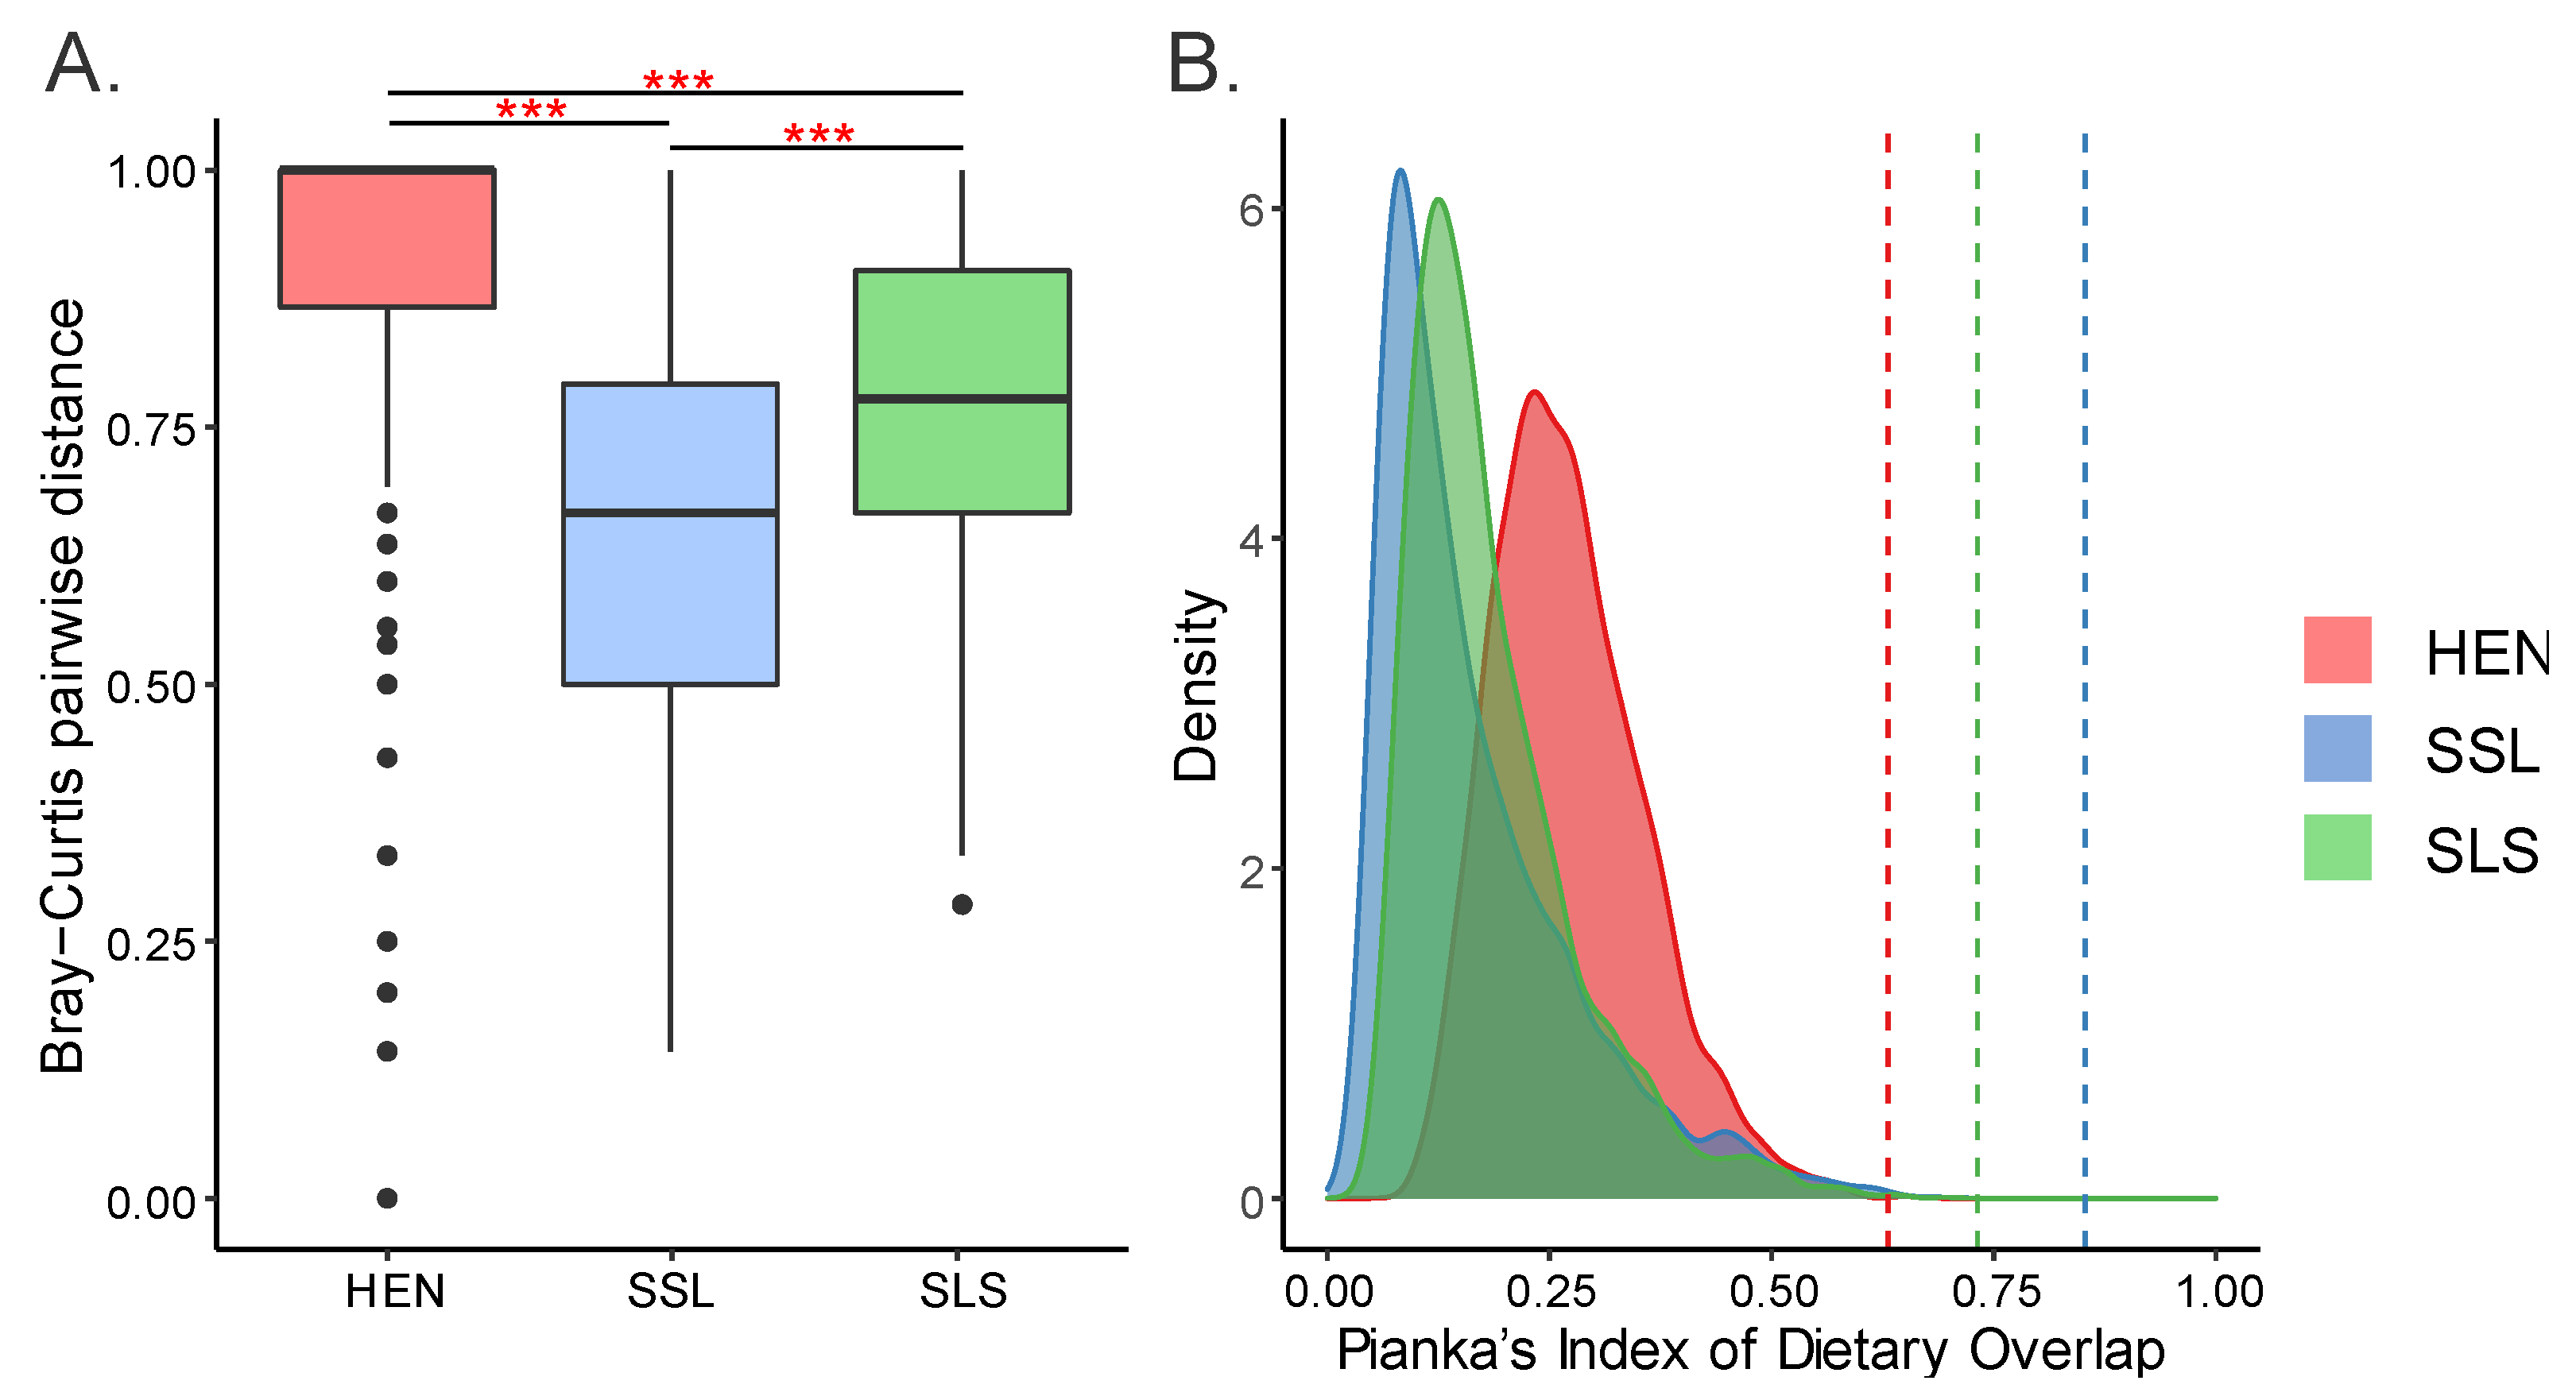
3.5. Trophic Niche Overlap

Mean pairwise Bray–Curtis distances between Z. asper and C. gobio diets were significantly different between sampling campaigns (Figure 5A; Kruskal–Wallis test; H2 = 630.76, p > 0.001). The highest mean pairwise distance between species was observed at HEN, followed by SLS and SSL (Dunn test; HEN–SSL z = 25.10, p < 0.001; HEN–SLS z = 13.73, p < 0.001). The same pattern of dietary overlap was found using Pianka’s overlap index: overlap was lowest at HEN (0.63) followed by SLS (0.73) and SSL (0.85; Figure 5B). Lower dietary overlap at HEN appeared to be associated with high chironomid and simuliid consumption by Z. asper, which are rarely consumed by C. gobio (Figure 6). Similarly, slightly lower overlap at SLS compared to SSL appeared to be associated with the difference in chironomid consumption and, to a lesser extent, Plecoptera consumption. Lastly, it should be noted that despite some differences in the degree of overlap between sites, the observed dietary overlap was significantly higher than the null model-predicted values in all cases (Figure 5B).

4. Discussion

4.1. Dietary Overlap and Coexistence

This study highlighted extensive dietary overlap between C. gobio and Z. asper. Dietary overlap was the most prevalent at SSL and SLS where both species disproportionately consumed the same mayfly taxa (Baetis, Heptageniidae), indicating shared prey preferences. Dietary overlap was weaker at HEN as Z. asper and C. gobio slightly diverged in their trophic niches. At HEN, C. gobio appeared to specialise on the caddisfly genus Hydropsyche (constituting almost half of its diet), whereas Z. asper diversified its diet by increasing its consumption of taxa that were otherwise avoided at SSL and SLS (e.g., Orthocladiinae and simuliids; Figure 6). This pattern of niche diversification has been observed in all major extant Z. asper populations in autumn [23] and is also associated with higher between-individual niche variation (BIC). Interestingly, the observed diet shift at HEN did not appear to be associated with variation in the taxonomic diversity or density of the macroinvertebrate community (Table 3). The most notable spatial difference in the prey community was in terms of the composition of preferred mayfly size-classes. Indeed, Angermeier [69] also related diet variation to a decline in large, high-value prey individuals in a temperate stream. Small Baetis individuals were abundant at HEN, but large individuals (i.e., >5 mm) were greatly reduced. If C. gobio and Z. asper select larger mayfly size-classes, this may explain their broader trophic niches at HEN. Dietary diversification is often associated with prey diversity and abundance as they relate to the foraging options available to predators [70,71]. Our results indicate that variation in preferred prey size-classes, rather than prey diversity or abundance, drives trophic niche variation in Z. asper and C. gobio.
Prey preferences are the product of predator and prey traits [8,72], and variation in prey preferences can provide useful information about predator behaviour [73,74]. Prey abundance is an important prey trait to consider as it is related to encounter rate. When the encounter rate is high, it may be energetically beneficial for predators to specialise on highly abundant prey [4]. However, neither Z. asper nor C. gobio appeared to adopt this frequency-dependent selection criterion. In fact, both species generally avoided highly abundant prey such as Caenis, Orthocladiinae and Simuliidae. Prey size is another important trait that can drive selection, affecting both the visual detectability and nutritional value of prey [75,76]. Zingel asper and C. gobio selected moderately sized prey such as Baetis, Heptageniidae and Hydropsyche but rarely consumed larger, less abundant Plecoptera prey (e.g., Dinocras, Perla) [49]. Our results, therefore, indicate that selection in C. gobio and Z. asper is driven by a trade-off in prey traits, notably in prey size and abundance. This would explain why C. gobio and Z. asper reduced their consumption of Baetis at HEN, where the large size-class of their preferred prey was less abundant. This is in line with previous studies that have demonstrated that C. gobio selects larger prey [28,77]. Furthermore, as we demonstrated that Z. asper and C. gobio mostly share the same prey preferences, they may also select prey based on similar criteria (here, size and abundance).
A consequence of shared prey preferences is that C. gobio and Z. asper may compete for preferred prey when resources are scarce [13,78]. Classic niche theory states that when resources are limited, two species cannot occupy the same ecological niche and, therefore, must avoid competition for resources via niche partitioning [1]. As C. gobio and Z. asper coexist across the range of Z. asper [15], it is likely that competition for shared, preferred prey is mediated by some degree of dietary partitioning. Indeed, dietary partitioning between these species was highest at HEN (63% overlap compared to 73–85%), where the larger size-class of preferred mayfly taxa was markedly less abundant (Figure 5, Table 3). Predators are expected to shift their prey preferences if the abundance of preferred prey drops below a threshold wherein it is no longer the energetically optimal prey choice [76]. Accordingly, both species reduced mayfly consumption at HEN and shifted their consumption to contrasting secondary prey, which also resulted in broader population niche widths (TNW) than was observed at SSL and SLS. Differential trophic responses to variation in prey availability are a common mechanism promoting the coexistence of ecologically similar species [13,79,80]. Our results suggest that contrasting secondary prey preferences may be a mechanism of coexistence for Z. asper and C. gobio, allowing for some degree of dietary partitioning when shared, high-value prey (e.g., >5 mm Baetis) are less abundant.
In addition to differing secondary prey preferences, HEN was characterised by very high between-individual niche variation (BIC) in both species (Figure 3). Niche diversification via BIC is a common response to intraspecific competition for resources [35,81,82], but it is limited by the constraining force of interspecific competition [36,83,84,85]. If C. gobio and Z. asper were indeed competing for resources, classic niche theory would predict the niche expansion of one species to constrain the niche width of the other. However, we found no evidence of one species affecting the other’s trophic traits. Instead, the expansion of their trophic niches when preferred prey were scarce was associated with contrasting secondary prey preferences (chironomids and simuliids for Z. asper, and Hydropsyche for C. gobio). Indeed, despite expanding their niches at HEN, dietary overlap was lower between Z. asper and C. gobio compared to the SSL and SLS sites (where preferred prey were abundant). Declining dietary overlap being associated with broader population niches has been previously reported [86]. This association can occur when the niche expansion is achieved by exploiting otherwise unused niche space [40]. Moreover, diet generalisation (rather than specialisation) in response to resource limitation has been shown to promote coexistence (see [86]) as predicted by the optimal foraging theory. Overall, our results indicate that C. gobio and Z. asper sustainably coexist by adopting broader population niches and greater between-individual variation when preferred prey are scarce.
Finally, the contrasting strategies observed at HEN may also indicate some degree of habitat partitioning between C. gobio and Z. asper. Caddisflies from the Hydropsyche genus are described as net-spinning filter-feeders that generally prefer high-velocity riffles over pools [87,88], whereas Orthocladiinae chironomids occupy a more diverse range of substrate types and water velocities [49]. The high consumption of Hydropsyche at HEN may indicate that C. gobio mostly forage in rheophilic habitats. In contrast, the diversified diet of Z. asper and its high consumption of ubiquitous chironomids could indicate that Z. asper forages in a wider range of microhabitats when preferred prey are scarce. Habitat partitioning has been shown to be an important mechanism of coexistence [77,89,90,91], and our results indicate that microhabitat partitioning may be an important mechanism for limiting competition and promoting coexistence between C. gobio and Z. asper.

4.2. Conservation Implications for the Critically Endangered Z. asper

In conservation management, the presence of potential competitors is generally considered to be unfavourable for the target species [92,93]. In this study, we highlighted the potential for competition between C. gobio and Z. asper if resources are limited. While the potential for competition should not be overlooked, notably because C. gobio can significantly deplete its resources [15,28], our results revealed some of the mechanisms that might offset competition and promote the coexistence of Z. asper and C. gobio (e.g., contrasting secondary prey preferences and trophic niche expansion). This increase in resource partitioning (observed at HEN) may prevent competitive exclusion when preferred prey are scarce.
In parallel, we demonstrated that C. gobio and Z. asper appear to share similar nutritive requirements. The presence of heterospecifics with similar dietary requirements has been used to provide an indirect indication of habitat suitability [94]. Certain birds and fish species use the presence of heterospecifics as an indirect cue of habitat quality when selecting novel habitats [95,96,97,98]. The presence of C. gobio may, therefore, indicate suitable trophic conditions for Z. asper. While such indirect cues do not necessarily provide definite indications of habitat quality [99,100,101], the presence of C. gobio could provide an immediate, approximate estimate of habitat suitability for Z. asper in the context of reintroduction projects.

5. Conclusions

Diet studies have proven to be critical for guiding the conservation and management of species and habitats [84,102]. In this perspective, metabarcoding is now recognized as highly valuable for dietary analysis and has proven to be effective to describe dietary overlap due to its potential for high taxonomic resolution [42,44]. Using a high-resolution metabarcoding dataset, we characterized the dietary overlap between Z. asper and C. gobio in the context of spatial variation in the taxonomic and size composition of the prey community. Our approach revealed that neither C. gobio nor Z. asper selected the most abundant taxa and suggested that both C. gobio and Z. asper selected mayfly when their large size-classes were abundant. When large mayfly abundance was low, C. gobio shifted to a caddisfly-dominated diet, while Z. asper exploited a more diverse range of prey (e.g., chironomids and simuliids). Variation in prey preferences may promote resource partitioning and thus coexistence between Z. asper and C. gobio when preferred resources are scarce. The coexistence of these native benthic predators, therefore, appears to be mediated by dietary changes that promote resource and habitat partitioning in the context of potential interspecific competition. This study also provides important insights into how predators can modulate individual and population-level dietary traits to adapt to variation in ecological opportunity and to ensure their coexistence. Our results present an important reference point for future studies investigating the trophic interaction between Z. asper and C. gobio.

Supplementary Materials

The following supporting information can be downloaded at: https://0-www-mdpi-com.brum.beds.ac.uk/article/10.3390/d14050412/s1, Figure S1: Macroinvertebrate sampling methodology; Table S1: Summary of macroinvertebrate sampling; Table S2: Complete list of validated ASVs/contigs; Table S3: Cross-reference guide for Final Taxonomic Assignment (FTA) obtained via metabarcoding and morphological assignment; Table S4: Summary of Z. asper and C. gobio diets

Author Contributions

Conceptualization, V.D. and R.C.; methodology, V.D., G.A.-S., E.C., E.M. and K.V.; software, E.M.; validation, V.D. and E.C.; formal analysis, K.V., E.M. and K.H.; investigation, E.C., V.D., G.A.-S. and R.C.; data curation, E.M., V.D., G.A.-S. and K.V.; writing—original draft preparation, K.V.; writing—review and editing, V.D., E.C. and G.A.-S.; visualization, K.V.; supervision, V.D. and A.V.E.; project administration, V.D. and G.A.-S.; funding acquisition, V.D. and G.A.-S. All authors have read and agreed to the published version of the manuscript.

Funding

This research was funded by the Syndicat Mixte d’Aménagement de la Vallée de la Durance (SMAVD), the Agence de l’Eau Rhône-Méditerranée-Corse (AERMC), and the Conseil Régional de Provence-Alpes-Côte-d’Azur. E.C. was supported by a post-doctoral grant from Electricité de France (EDF) and Office Français pour la Biodiversité (OFB), and K.V. was supported by a PhD grant from the Ecole Doctorale des Sciences de l’Environnement (ED251; Aix Marseille Université).

Institutional Review Board Statement

The animal study protocol was approved by the Comité Scientifique et Technique of the French Plan National d’Actions en faveur de l’apron 2012–2016 and by the Direction Départementale des Territoires (DDT) of the Alpes-de-Haute-Provence.

Informed Consent Statement

Not applicable.

Data Availability Statement

Supplementary data were deposited in Dryad (https://0-doi-org.brum.beds.ac.uk/10.506/dryad.eck7120 (accessed on 1 January 2022), including the unfiltered HTS data from MiSeq runs used in this paper.

Acknowledgments

We warmly thank the staff from the Office Français pour la Biodiversité, Aix Marseille Université, and INRAE Aix-en-Provence for their help with fieldwork. We are grateful to Jean-Pierre Balmain (INRAE) and Mathilde Bertrand for their help with the morphological identification of macroinvertebrates. This study was initiated during the French Plan National d’Actions en faveur de l’apron du Rhône 2012–2016, and is part of the French Plan National d’Actions en faveur de l’apron du Rhône 2020–2030, both coordinated by the Direction Régionale pour l’Environnement, l’Aménagement et le Logement d’Auvergne-Rhône-Alpes and managed by the Conservatoire d’Espaces Naturels Rhône-Alpes. Data used in this study were produced by the molecular facilities of LabEx CeMEB (platforms ‘ADN Dégradé’ and ‘GenSeq’, Montpellier), CIRAD (Montferrier-sur-Lez) and SCBM (IMBE, Marseille).

Conflicts of Interest

The authors declare no conflict of interest. The funders had no role in the design of the study; in the collection, analyses, or interpretation of data; in the writing of the manuscript, or in the decision to publish the results.

References

  1. Tilman, D. The Importance of the Mechanisms of Interspecific Competition. Am. Nat. 1987, 129, 769–774. [Google Scholar] [CrossRef]
  2. Bolnick, D.I.; Amarasekare, P.; Araújo, M.S.; Bürger, R.; Levine, J.M.; Novak, M.; Rudolf, V.H.W.; Schreiber, S.J.; Urban, M.C.; Vasseur, D.A. Why Intraspecific Trait Variation Matters in Community Ecology. Trends Ecol. Evol. 2011, 26, 183–192. [Google Scholar] [CrossRef] [PubMed] [Green Version]
  3. Thoday, J.M. Evolution of Niche Width. Am. Nat. 1974, 108, 142–143. [Google Scholar] [CrossRef]
  4. Schoener, T.W. Theory of Feeding Strategies. Annu. Rev. Ecol. Syst. 1971, 2, 369–404. [Google Scholar] [CrossRef] [Green Version]
  5. Chesson, P. Mechanisms of Maintenance of Species Diversity. Annu. Rev. Ecol. Syst. 2000, 31, 343–366. [Google Scholar] [CrossRef] [Green Version]
  6. Toft, C.A. Resource Partitioning in Amphibians and Reptiles. Copeia 1985, 1985, 1–21. [Google Scholar] [CrossRef]
  7. Ross, S.T. Resource Partitioning in Fish Assemblages: A Review of Field Studies. Copeia 1986, 1986, 352–388. [Google Scholar] [CrossRef]
  8. Worischka, S.; Schmidt, S.I.; Hellmann, C.; Winkelmann, C. Selective Predation by Benthivorous Fish on Stream Macroinvertebrates—The Role of Prey Traits and Prey Abundance. Limnologica 2015, 52, 41–50. [Google Scholar] [CrossRef]
  9. Sagar, P.M.; Glova, G.J. Food Partitioning by Small Fish in a Coastal New Zealand Stream. N. Z. J. Mar. Freshw. Res. 1994, 28, 429–436. [Google Scholar] [CrossRef]
  10. Piria, M.; Jakšić, G.; Jakovlić, I.; Treer, T. Dietary Habits of Invasive Ponto-Caspian Gobies in the Croatian Part of the Danube River Basin and Their Potential Impact on Benthic Fish Communities. Sci. Total Environ. 2016, 540, 386–395. [Google Scholar] [CrossRef]
  11. MacArthur, R.; Levins, R. The Limiting Similarity, Convergence, and Divergence of Coexisting Species. Am. Nat. 1967, 101, 377–385. [Google Scholar] [CrossRef]
  12. Schmitt, R.J.; Holbrook, S.J. Seasonally Fluctuating Resources and Temporal Variability of Interspecific Competition. Oecologia 1986, 69, 1–11. [Google Scholar] [CrossRef] [PubMed]
  13. Nakano, S.; Fausch, K.D.; Kitano, S. Flexible Niche Partitioning via a Foraging Mode Shift: A Proposed Mechanism for Coexistence in Stream-Dwelling Charts. J. Anim. Ecol. 1999, 68, 1079–1092. [Google Scholar] [CrossRef]
  14. Prejs, A.; Prejs, K. Feeding of Tropical Freshwater Fishes: Seasonality in Resource Availability and Resource Use. Oecologia 1987, 71, 397–404. [Google Scholar] [CrossRef]
  15. Keith, P.; Poulet, N.; Denys, G.; Changeux, T.; Feunteun, É.; Persat, H. Les Poissons D’eau Douce de France, 2nd ed.; Biotope éditions: Mèze, France, 2020. [Google Scholar]
  16. Georget, M. Retours Sur Deux Programmes Life et Un Plan National d’action En Faveur de l’apron Du Rhône. Sci. Eaux Territ. 2019, IV, 2–5. [Google Scholar] [CrossRef]
  17. Cavalli, L.; Pech, N.; Chappaz, R. Diet and Growth of the Endangered Zingel asper in the Durance River. J. Fish Biol. 2003, 63, 460–471. [Google Scholar] [CrossRef]
  18. Labonne, J.; Gaudin, P. Exploring Population Dynamics Patterns in a Rare Fish, Zingel asper, through Capture-Mark-Recapture Methods. Conserv. Biol. 2005, 19, 463–472. [Google Scholar] [CrossRef]
  19. Danancher, D.; Labonne, J.; Gaudin, P.; Joly, P. Scale Measurements as a Conservation Tool in Endangered Zingel asper (Linnaeus, 1758). Aquat. Conserv. Mar. Freshw. Ecosyst. 2007, 17, 712–723. [Google Scholar] [CrossRef]
  20. Monnet, G.; Corse, E.; Archambaud-Suard, G.; Grenier, R.; Chappaz, R.; Dubut, V. Growth Variation in the Endangered Fish Zingel asper: Contribution of Substrate Quality, Hydraulics, Prey Abundance and Water Temperature. Aquat. Conserv. Mar. Freshw. Ecosyst. 2022, in press. [CrossRef]
  21. Cavalli, L.; Knight, C.M.; Durbec, M.; Chappaz, R.; Gozlan, R.E. Twenty-Four Hours in the Life of Zingel asper. J. Fish Biol. 2009, 75, 723–727. [Google Scholar] [CrossRef]
  22. Labonne, J.; Allouche, S.; Gaudin, P. Use of a Generalised Linear Model to Test Habitat Preferences: The Example of Zingel asper, an Endemic Endangered Percid of the River Rhône. Freshw. Biol. 2003, 48, 687–697. [Google Scholar] [CrossRef]
  23. Villsen, K.; Corse, E.; Meglécz, E.; Archambaud-Suard, G.; Vignes, H.; Ereskovsky, A.V.; Chappaz, R.; Dubut, V. DNA Metabarcoding Reveals Adaptive Seasonal Variation of Individual Trophic Traits in a Critically Endangered Fish. bioRxiv 2021, 2021.01.25.428043. [Google Scholar] [CrossRef]
  24. Vandelannoote, A.; Yseboodt, R.; Bruylants, B.; Verheyen, R.; Coeck, J.; Belpaire, C.; Van Thuyne, G.; Denayer, B.; Beyens, J.; De Charleroy, D. Atlas van de Vlaamse Beek-En Riviervissen; Water-Energik-Vlario: Wijnegem, The Netherlands, 1998. [Google Scholar]
  25. Zaugg, B. Fauna Helvetica: Pisces Atlas, 2nd ed.; Centre Suisse de Cartographie de la Faune: Neuchâtel, Switzerland, 2018; ISBN 978-2-88414-020-1. [Google Scholar]
  26. Lusk, S.; Hanel, L.; Lusková, V. Red List of the Ichthyofauna of the Czech Republic: Development and Present Status. Folia Zool. 2004, 53, 215–226. [Google Scholar]
  27. Mills, C.A.; Mann, R.H.K. The Bullhead Cottus gobio, a Versatile and Successful Fish. Annnual Rep. Freshw. Biol. Assoc. 1983, 51, 76–88. [Google Scholar]
  28. Davey, A.J.H.; Turner, G.F.; Hawkins, S.J.; Doncaster, C.P. Mechanisms of Density Dependence in Stream Fish: Exploitation Competition for Food Reduces Growth of Adult European Bullheads (Cottus gobio). Can. J. Fish. Aquat. Sci. 2006, 63, 597–606. [Google Scholar] [CrossRef]
  29. Števove, B.; Babeľová, M.; Haruštiaková, D.; Kováč, V. When a River Is Affected by a Reservoir: Trophic Interactions and Flexibility in Feeding Strategies of Alpine Bullhead (Cottus poecilopus) and European Bullhead (Cottus gobio). Sci. Total Environ. 2019, 651, 1903–1912. [Google Scholar] [CrossRef] [PubMed]
  30. Englund, G.; Olsson, T.; Englund, G. Treatment Effects in a Stream Fish Enclosure Experiment: Influence of Predation Rate and Prey Movements. Oikos 1996, 77, 519. [Google Scholar] [CrossRef]
  31. Dahl, J. Effects of a Benthivorous and a Drift-Feeding Fish on a Benthic Stream Assemblage. Oecologia 1998, 116, 426–432. [Google Scholar] [CrossRef]
  32. Crivelli, A.J. Zingel asper. The IUCN Red List of Threatened Species 2006: E.T23207A9427850; International Union for Conservation of Nature and Natural Resources: Gland, Switzerland, 2006. [Google Scholar] [CrossRef]
  33. Okuyama, T. Individual Variation in Prey Choice in a Predator–Prey Community. Theor. Popul. Biol. 2011, 79, 64–69. [Google Scholar] [CrossRef]
  34. Greenberg, L.A.; Giller, P.S. Individual Variation in Habitat Use and Growth of Male and Female Brown Trout. Ecography. 2001, 24, 212–224. [Google Scholar] [CrossRef]
  35. Svanbäck, R.; Bolnick, D.I. Intraspecific Competition Drives Increased Resource Use Diversity within a Natural Population. Proc. R. Soc. B Biol. Sci. 2007, 274, 839–844. [Google Scholar] [CrossRef] [PubMed]
  36. Bolnick, D.I.; Ingram, T.; Stutz, W.E.; Snowberg, L.K.; Lau, O.L.; Pauli, J.S. Ecological Release from Interspecific Competition Leads to Decoupled Changes in Population and Individual Niche Width. Proc. R. Soc. B Biol. Sci. 2010, 277, 1789–1797. [Google Scholar] [CrossRef]
  37. Sjödin, H.; Ripa, J.; Lundberg, P. Principles of Niche Expansion. Proc. R. Soc. B Biol. Sci. 2018, 285, 20182603. [Google Scholar] [CrossRef] [PubMed] [Green Version]
  38. Bolnick, D.I.; Yang, L.H.; Fordyce, J.A.; Davis, J.M.; Svanbäck, R. Measuring Individual-Level Resource Specialization. Ecology 2002, 83, 2936–2941. [Google Scholar] [CrossRef]
  39. Barbini, S.A.; Lucifora, L.O.; Sabadin, D.E.; Figueroa, D.E. Ecological Specialization Is Associated with High Conservation Concern in Skates (Chondrichthyes, Rajiformes). Anim. Conserv. 2020, 23, 222–228. [Google Scholar] [CrossRef]
  40. Costa-Pereira, R.; Araújo, M.S.; Souza, F.L.; Ingram, T. Competition and Resource Breadth Shape Niche Variation and Overlap in Multiple Trophic Dimensions. Proc. R. Soc. B Biol. Sci. 2019, 286, 20190369. [Google Scholar] [CrossRef] [PubMed] [Green Version]
  41. Falke, L.P.; Henderson, J.S.; Novak, M.; Preston, D.L. Temporal Shifts in Intraspecific and Interspecific Diet Variation among 3 Stream Predators. Freshw. Sci. 2020, 39, 115–125. [Google Scholar] [CrossRef]
  42. Alberdi, A.; Aizpurua, O.; Bohmann, K.; Gopalakrishnan, S.; Lynggaard, C.; Nielsen, M.; Gilbert, M.T.P. Promises and Pitfalls of Using High-Throughput Sequencing for Diet Analysis. Mol. Ecol. Resour. 2019, 19, 327–348. [Google Scholar] [CrossRef]
  43. de Sousa, L.L.; Silva, S.M.; Xavier, R. DNA Metabarcoding in Diet Studies: Unveiling Ecological Aspects in Aquatic and Terrestrial Ecosystems. Environ. DNA 2019, 1, 199–214. [Google Scholar] [CrossRef] [Green Version]
  44. Hoenig, B.D.; Trevelline, B.K.; Nuttle, T.; Porter, B.A. Dietary DNA Metabarcoding Reveals Seasonal Trophic Changes among Three Syntopic Freshwater Trout Species. Freshw. Biol. 2021, 66, 509–523. [Google Scholar] [CrossRef]
  45. Corse, E.; Valladares, S.; Planas, M.; Chamorro, A.; Pintado, J. Analysis of the Diet of the Long-Snouted Seahorse Hippocampus guttulatus by 18SrDNA Amplification of Prey in Faeces. Aquac. Nutr. 2015, 21, 528–540. [Google Scholar] [CrossRef]
  46. MacColl, A.D.C. The Ecological Causes of Evolution. Trends Ecol. Evol. 2011, 26, 514–522. [Google Scholar] [CrossRef] [PubMed]
  47. Warner, R.F. Gross Channel Changes along the Durance River, Southern France, Over the Last 100 Years Using Cartographic Data. Regul. River 2000, 16, 141–157. [Google Scholar] [CrossRef]
  48. Clifford, H. Life Cycles of Mayflies (Ephemeroptera), with Special Reference to Voltinism. Quaest. Entomol. 1982, 18, 15–90. [Google Scholar]
  49. Tachet, H.; Richoux, P.; Bournaud, M.; Usseglio-Polatera, P. Invertébrés d’Eau Douce: Systématique, Biologie, Écologie; CNRS éditions: Paris, France, 2010; ISBN 978-2-271-06945-0. [Google Scholar]
  50. Corse, E.; Meglécz, E.; Archambaud, G.; Ardisson, M.; Martin, J.F.; Tougard, C.; Chappaz, R.; Dubut, V. A From-Benchtop-to-Desktop Workflow for Validating HTS Data and for Taxonomic Identification in Diet Metabarcoding Studies. Mol. Ecol. Resour. 2017, 17, e146–e159. [Google Scholar] [CrossRef]
  51. Corse, E.; Tougard, C.; Archambaud-Suard, G.; Agnèse, J.F.; Messu Mandeng, F.D.; Bilong Bilong, C.F.; Duneau, D.; Zinger, L.; Chappaz, R.; Xu, C.C.Y.; et al. One-Locus-Several-Primers: A Strategy to Improve the Taxonomic and Haplotypic Coverage in Diet Metabarcoding Studies. Ecol. Evol. 2019, 9, 4603–4620. [Google Scholar] [CrossRef]
  52. Meusnier, I.; Singer, G.A.C.; Landry, J.-F.; Hickey, D.A.; Hebert, P.D.N.; Hajibabaei, M. A Universal DNA Mini-Barcode for Biodiversity Analysis. BMC Genomics 2008, 9, 214. [Google Scholar] [CrossRef] [Green Version]
  53. Zeale, M.R.K.; Butlin, R.K.; Barker, G.L.A.; Lees, D.C.; Jones, G. Taxon-specific PCR for DNA Barcoding Arthropod Prey in Bat Faeces. Mol. Ecol. Resour. 2011, 11, 236–244. [Google Scholar] [CrossRef]
  54. González, A.; Dubut, V.; Corse, E.; Mekdad, R.; Dechatre, T.; Meglécz, E. VTAM: A Robust Pipeline for Validating Metabarcoding Data Using Internal Controls. bioRxiv 2020, 2020.11.06.371187. [Google Scholar] [CrossRef]
  55. Raveret-Wattel, C. Atlas de Poche des Poissons D’eau Douce de La France de La Suisse Romande et de La Belgique; Paul Klincksieck: Paris, France, 1900. [Google Scholar]
  56. White, T.E. A Method of Calculating the Dietary Percentage of Various Food Animals Utilized by Aboriginal Peoples. Am. Antiq. 1953, 18, 396–398. [Google Scholar] [CrossRef]
  57. R Core Development Team. R: A Language and Environment for Statistical Computing; R Foundation for Statistical Computing: Vienna, Austria, 2013; Available online: https://www.R-project.org/ (accessed on 15 October 2021).
  58. Hsieh, T.C.; Ma, K.H.; Chao, A. INEXT: An R Package for Rarefaction and Extrapolation of Species Diversity (Hill Numbers). Methods Ecol. Evol. 2016, 7, 1451–1456. [Google Scholar] [CrossRef]
  59. Chao, A.; Chiu, C.H.; Jost, L. Unifying Species Diversity, Phylogenetic Diversity, Functional Diversity, and Related Similarity and Differentiation Measures through Hill Numbers. Annu. Rev. Ecol. Evol. Syst. 2014, 45, 297–324. [Google Scholar] [CrossRef] [Green Version]
  60. Lê, S.; Josse, J.; Husson, F. FactoMineR: An R Package for Multivariate Analysis. J. Stat. Softw. 2008, 25, 1–18. [Google Scholar] [CrossRef] [Green Version]
  61. Vaughan, I.P.; Gotelli, N.J.; Memmott, J.; Pearson, C.E.; Woodward, G.; Symondson, W.O.C. Econullnetr: An R Package Using Null Models to Analyse the Structure of Ecological Networks and Identify Resource Selection. Methods Ecol. Evol. 2018, 9, 728–733. [Google Scholar] [CrossRef] [Green Version]
  62. Hill, M.O. Diversity and Evenness: A Unifying Notation and Its Consequences. Ecology 1973, 54, 427–432. [Google Scholar] [CrossRef] [Green Version]
  63. Ohlmann, M.; Miele, V.; Dray, S.; Chalmandrier, L.; O’Connor, L.; Thuiller, W. Diversity Indices for Ecological Networks: A Unifying Framework Using Hill Numbers. Ecol. Lett. 2019, 22, 737–747. [Google Scholar] [CrossRef]
  64. Alberdi, A.; Gilbert, M.T.P. A Guide to the Application of Hill Numbers to DNA-Based Diversity Analyses. Mol. Ecol. Resour. 2019, 19, 804–817. [Google Scholar] [CrossRef]
  65. Alberdi, A.; Gilbert, M.T.P. Hilldiv: An R Package for the Integral Analysis of Diversity Based on Hill Numbers. bioRxiv 2019, 545665. [Google Scholar] [CrossRef] [Green Version]
  66. Chao, A.; Jost, L. Coverage-Based Rarefaction and Extrapolation: Standardizing Samples by Completeness Rather than Size. Ecology 2012, 93, 2533–2547. [Google Scholar] [CrossRef]
  67. Pianka, E.R. Niche Overlap and Diffuse Competition. Proc. Natl. Acad. Sci. USA 1974, 71, 2141–2145. [Google Scholar] [CrossRef] [Green Version]
  68. Gotelli, N.J.; Ellison, A.M. EcoSimR 1.00. Available online: http://www.uvm.edu/~ngotelli/EcoSim/EcoSim.html (accessed on 15 October 2021).
  69. Angermeier, P.L. Resource Seasonality and Fish Diets in an Illinois Stream. Environ. Biol. Fishes 1982, 7, 251–264. [Google Scholar] [CrossRef]
  70. Sánchez-Hernández, J.; Finstad, A.G.; Arnekleiv, J.V.; Kjærstad, G.; Amundsen, P.A. Beyond Ecological Opportunity: Prey Diversity Rather than Abundance Shapes Predator Niche Variation. Freshw. Biol. 2021, 66, 44–61. [Google Scholar] [CrossRef]
  71. Costa-Pereira, R.; Tavares, L.E.R.; de Camargo, P.B.; Araújo, M.S. Seasonal Population and Individual Niche Dynamics in a Tetra Fish in the Pantanal Wetlands. Biotropica 2017, 49, 531–538. [Google Scholar] [CrossRef]
  72. Murdoch, W.W. Switching in General Predators: Experiments on Predator Specificity and Stability of Prey Populations. Ecol. Monogr. 1969, 39, 335–354. [Google Scholar] [CrossRef]
  73. Ivlev, V.S. Experimental Ecology of the Feeding of Fishes; Yale University Press: New Haven, CT, USA, 1961. [Google Scholar]
  74. Manly, B.F.J.; Miller, P.; Cook, L.M. Analysis of a Selective Predation Experiment. Am. Nat. 1972, 106, 719–736. [Google Scholar] [CrossRef]
  75. Werner, E.E.; Hall, D.J. Optimal Foraging and the Size Selection of Prey by the Bluegill Sunfish (Lepomis macrochirus). Ecology 1974, 55, 1042–1052. [Google Scholar] [CrossRef]
  76. Perry, G.; Pianka, E.R. Animal Foraging: Past, Present and Future. Trends Ecol. Evol. 1997, 12, 360–364. [Google Scholar] [CrossRef]
  77. Welton, J.S.; Mill, C.A.; Pygott, J.R. The Effect of Interaction between the Stone Loach Noemacheilus barbatulus (L.) and the Bullhead Cottus gobio (L.) on Prey and Habitat Selection. Hydrobiologia 1991, 220, 1–7. [Google Scholar] [CrossRef]
  78. Pulliam, H.R. Niche Expansion and Contraction in a Variable Environment. Integr. Comp. Biol. 1986, 26, 71–79. [Google Scholar] [CrossRef]
  79. Neves, M.P.; Costa-Pereira, R.; Delariva, R.L.; Fialho, C.B. Seasonality and Interspecific Competition Shape Individual Niche Variation in Co-occurring Tetra Fish in Neotropical Streams. Biotropica 2021, 53, 329–338. [Google Scholar] [CrossRef]
  80. Liu, F.; Wang, J.; Liu, H. Seasonal Variations in Food Resource Partitioning among Four Sympatric Gudgeon Species in the Upper Yangtze River. Ecol. Evol. 2019, 9, 7227–7236. [Google Scholar] [CrossRef] [PubMed] [Green Version]
  81. Svanbäck, R.; Bolnick, D.I. Intraspecific Competition Affects the Strength of Individual Specialization: An Optimal Diet Theory Method. Evol. Ecol. Res. 2005, 7, 993–1012. [Google Scholar]
  82. Araújo, M.S.; Bolnick, D.I.; Layman, C.A. The Ecological Causes of Individual Specialisation. Ecol. Lett. 2011, 14, 948–958. [Google Scholar] [CrossRef] [PubMed]
  83. Van Valen, L. Morphological Variation and Width of Ecological Niche. Am. Nat. 1965, 99, 377–390. [Google Scholar] [CrossRef]
  84. Nunn, A.D.; Tewson, L.H.; Cowx, I.G. The Foraging Ecology of Larval and Juvenile Fishes. Rev. Fish Biol. Fish. 2012, 22, 377–408. [Google Scholar] [CrossRef]
  85. Svanbäck, R.; Eklöv, P.; Fransson, R.; Holmgren, K. Intraspecific Competition Drives Multiple Species Resource Polymorphism in Fish Communities. Oikos 2008, 117, 114–124. [Google Scholar] [CrossRef]
  86. Gabler, H.-M.; Amundsen, P.-A. Feeding Strategies, Resource Utilisation and Potential Mechanisms for Competitive Coexistence of Atlantic Salmon and Alpine Bullhead in a Sub-Arctic River. Aquat. Ecol. 2010, 44, 325–336. [Google Scholar] [CrossRef]
  87. Osborne, L.L.; Herricks, E.E. Microhabitat Characteristics of Hydropsyche (Trichoptera: Hydropsychidae) and the Importance of Body Size. J. N. Am. Benthol. Soc. 1987, 6, 115–124. [Google Scholar] [CrossRef]
  88. Pirvu, M.; Zaharia, C.; Satmari, A.; Parvulescu, L. Spatial Ecology of Hydropsyche incognita (Trichoptera: Hydropsychidae) in the Carpathians. EJE 2015, 112, 106–113. [Google Scholar] [CrossRef] [Green Version]
  89. Sánchez-Hernández, J.; Vieira-Lanero, R.; Servia, M.J.; Cobo, F. Feeding Habits of Four Sympatric Fish Species in the Iberian Peninsula: Keys to Understanding Coexistence Using Prey Traits. Hydrobiologia 2011, 667, 119–132. [Google Scholar] [CrossRef]
  90. Schoener, T.W. Resource Partitioning in Ecological Communities. Science 1974, 185, 27–39. [Google Scholar] [CrossRef] [PubMed]
  91. Gjelland, K.Ø.; Bøhn, T.; Amundsen, P. Is Coexistence Mediated by Microhabitat Segregation? An In-depth Exploration of a Fish Invasion. J. Fish Biol. 2007, 71, 196–209. [Google Scholar] [CrossRef] [Green Version]
  92. Ewen, J.G.; Armstrong, D.P. Strategic Monitoring of Reintroductions in Ecological Restoration Programmes. Ecoscience 2007, 14, 401–409. [Google Scholar] [CrossRef]
  93. Jachowski, D.; Millspaugh, J.J.; Angermeier, P.L.; Slotow, R.H. Reintroduction of Fish and Wildlife Populations; University of California Press: Oakland, CA, USA, 2016; ISBN 0520960386. [Google Scholar]
  94. Stamps, J.A.; Swaisgood, R.R. Someplace like Home: Experience, Habitat Selection and Conservation Biology. Appl. Anim. Behav. Sci. 2007, 102, 392–409. [Google Scholar] [CrossRef]
  95. Mönkkönen, M.; Härdling, R.; Forsman, J.T.; Tuomi, J. Evolution of Heterospecific Attraction: Using Other Species as Cues in Habitat Selection. Evol. Ecol. 1999, 13, 91–104. [Google Scholar] [CrossRef]
  96. Parejo, D.; Danchin, E.; Avilés, J.M. The Heterospecific Habitat Copying Hypothesis: Can Competitors Indicate Habitat Quality? Behav. Ecol. 2005, 16, 96–105. [Google Scholar] [CrossRef]
  97. Thomson, R.L.; Forsman, J.T.; Mönkkönen, M. Positive Interactions between Migrant and Resident Birds: Testing the Heterospecific Attraction Hypothesis. Oecologia 2003, 134, 431–438. [Google Scholar] [CrossRef]
  98. Hattori, A. Small and Large Anemonefishes Can Coexist Using the Same Patchy Resources on a Coral Reef, before Habitat Destruction. J. Anim. Ecol. 2002, 71, 824–831. [Google Scholar] [CrossRef] [Green Version]
  99. Kokko, H.; Sutherland, W.J. Ecological Traps in Changing Environments: Ecological and Evolutionary Consequences of a Behaviourally Mediated Allee Effect. Evol. Ecol. Res. 2001, 3, 537–551. [Google Scholar]
  100. Kristan, W.B. The Role of Habitat Selection Behavior in Population Dynamics: Source-Sink Systems and Ecological Traps. Oikos 2003, 103, 457–468. [Google Scholar] [CrossRef] [Green Version]
  101. Battin, J. When Good Animals Love Bad Habitats: Ecological Traps and the Conservation of Animal Populations. Conserv. Biol. 2004, 18, 1482–1491. [Google Scholar] [CrossRef]
  102. Zarzoso-Lacoste, D.; Bonnaud, E.; Corse, E.; Dubut, V.; Lorvelec, O.; De Meringo, H.; Santelli, C.; Meunier, J.Y.; Ghestemme, T.; Gouni, A.; et al. Stuck amongst introduced species: Trophic ecology reveals complex relationships between the critically endangered Niau kingfisher and introduced predators, competitors and prey. NeoBiota 2019, 53, 61–82. [Google Scholar] [CrossRef] [Green Version]
Figure 1. Relative prey consumption by Zingel asper and Cottus gobio and relative macroinvertebrate abundance in the environment. Red points indicate sampling sites, double black lines indicate dams, the single black line indicates a weir, and the arrow indicates the direction of river flow.
Diversity 14 00412 g001
Figure 2. The macroinvertebrate community. (A) Principal component analysis (PCA) biplot performed on macroinvertebrate abundances (log10 (x + 1) transformed). (B) Taxonomic diversity (1D) and 95% CIs (shaded area) of the macroinvertebrate community. Dots indicate the estimate of taxonomic diversity standardised at 95% sample coverage.
Diversity 14 00412 g002
Figure 3. Zingel asper and Cottus gobio prey electivity. Dots represent the observed mean consumption, and bars indicate 95% CIs based on the null model. Red: significant positive electivity; Blue: significant negative electivity; White: not significant. N.B.: In order to avoid false positives, only abundant prey species were considered for electivity tests: i.e., >5% relative abundance in the diet and/or in the prey community.
Diversity 14 00412 g003
Figure 4. Trophic traits for Zingel asper and Cottus gobio. (A) Rarefaction curves of taxonomic diversity i.e., total niche widths (TNW), solid points; 85% sample coverage, solid lines; interpolated values, dashed lines; extrapolated values, shaded area; 95% confidence intervals. (B) Individual niche width (INW). (C) Between-individual component of the trophic niche (BIC). All trophic traits were calculated using Hill numbers (1D).
Diversity 14 00412 g004
Figure 5. Diet overlap between Zingel asper and Cottus gobio. (A) Bray–Curtis pairwise distances between Z. asper and C. gobio diets by sampling campaign (non-parametric Dunn tests: *** = p < 0.001). (B) Pianka’s index of dietary overlap of Zingel asper and Cottus gobio diets. Density plot indicates null model-simulated Pianka values, dashed lines indicate observed Pianka values.
Diversity 14 00412 g005
Figure 6. Bipartite plots illustrating dietary overlap between C. gobio and Z. asper at HEN, SSL and SLS.
Diversity 14 00412 g006
Table 1. Details of faeces and macroinvertebrate sampling.
SiteCoordinatesDate of Faeces SamplingNo. Faeces Z. asperNo. Faeces C. gobioDate of Surber SamplingNo. Surber Samples
HENN 44° 18′ 46″
E 5° 55′ 29″
5 November 2015 29276 November 201590
SSLN 44° 14′ 50″
E 5° 55′ 17″
22 September 2015 442121 September 201560
SLSN 44° 9′ 32″
E 5° 57′ 15″
28 August 2015 431627 August 201560
Table 2. Details of primer sets used in this study.
Primer SetPrimer NameForward (F)/
Reverse (R)
Sequence (5’-3’) Reference
MFZRUni-Minibar-F1FTCCACTAATCACAARGATATTGGTAC[52]
ZBJ-ArtR2cRWACTAATCAATTWCCAAATCCTCC[53]
ZFZRZBJ-ArtF1cFAGATATTGGAACWTTATATTTTATTTTTGG[53]
ZBJ-ArtR2cRWACTAATCAATTWCCAAATCCTCC[53]
LFCRLepLCOFRKTCAACMAATCATAAAGATATTGG[51]
McoiR2RCCBCCRATTAWAATKGGTATHAC[51]
Table 3. Summary of trophic niche traits for Z. asper and C. gobio and of the diversity (1D) and density (inv.m−2) of the macroinvertebrate community.
Z. asperC. gobioMacroinvertebrate Community
Site Estimate[95% CI] or ±SEEstimate[95% CI] or ±SE Estimate[95% CI] or ±SE
HENTNW28.82[25.44–32.21]20.63 *[13.62–27.64]1D10.79[10.63–10.95]
INW4.42±0.772.03±0.26Density (inv.m−2)3659±490
BIC0.88±0.010.88±0.02
SSLTNW11.44[9.66–23.05]17.33 *[11.61–23.05]1D10.11[9.89–10.32]
INW4.40±0.283.39±0.37Density (inv.m−2)3004±397
BIC0.54±0.010.67±0.03
SLSTNW20.99[18.60–23.38]15.27[12.57–17.98]1D7.49[7.37–7.62]
INW6.06±0.454.66±0.48Density (inv.m−2)5194±774
BIC0.69±0.020.68±0.02
* extrapolated value based on rarefaction.
Table 4. Summary of the density of large and small Baetis and Heptageniidae size-classes.
SiteTaxaSize-ClassDensity inv.m−2 (±SE)
HENBaetissmall (<5 mm)545 (±121)
large (>5 mm)5 (±1)
Heptageniidaesmall (<5 mm)124 (±21)
large (>5 mm)9 (±3)
SSLBaetissmall (<5 mm)390 (±66)
large (>5 mm)30 (±9)
Heptageniidaesmall (<5 mm)159 (±26)
large (>5 mm)10 (±2)
SLSBaetissmall (<5 mm)577 (±129)
large (>5 mm)121 (±34)
Heptageniidaesmall (<5 mm)67 (±22)
large (>5 mm)21 (±4)
Publisher’s Note: MDPI stays neutral with regard to jurisdictional claims in published maps and institutional affiliations.

