
Age and Growth of An Outbreaking Acanthaster cf. solaris Population within the Great Barrier Reef

 ,
,
Abstract
:1. Introduction
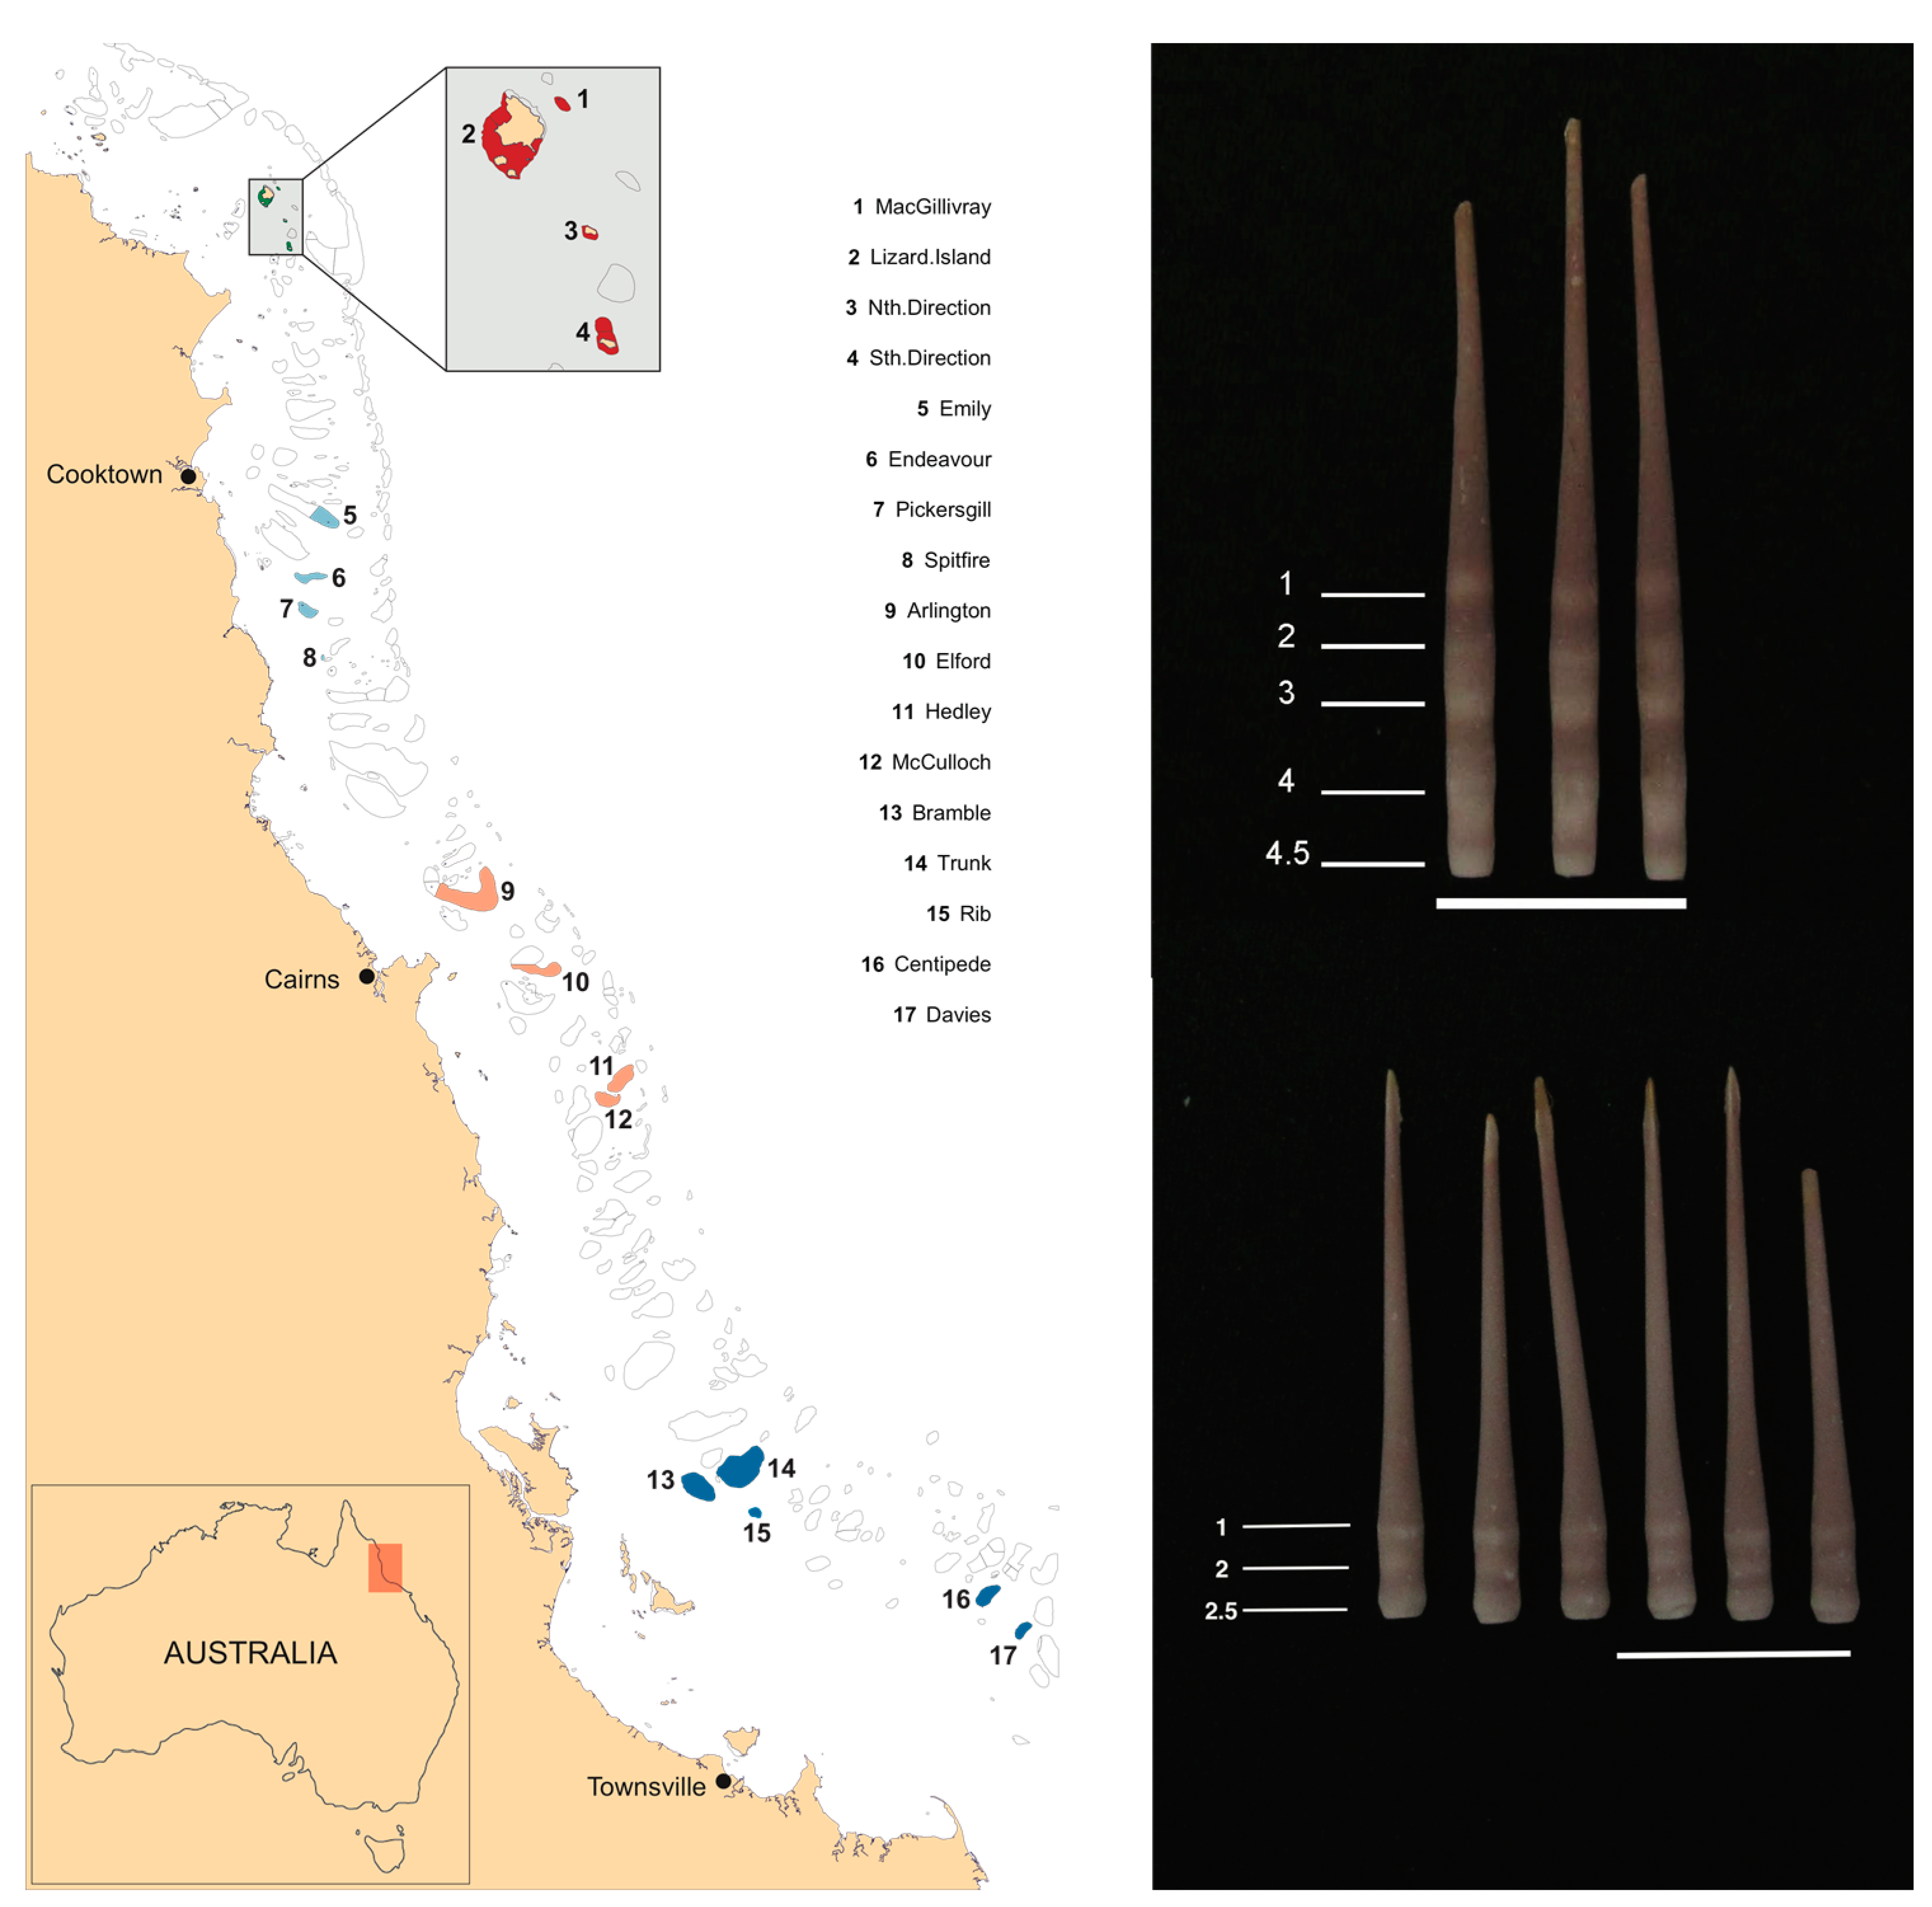
2. Materials and Methods
Statistical Methods
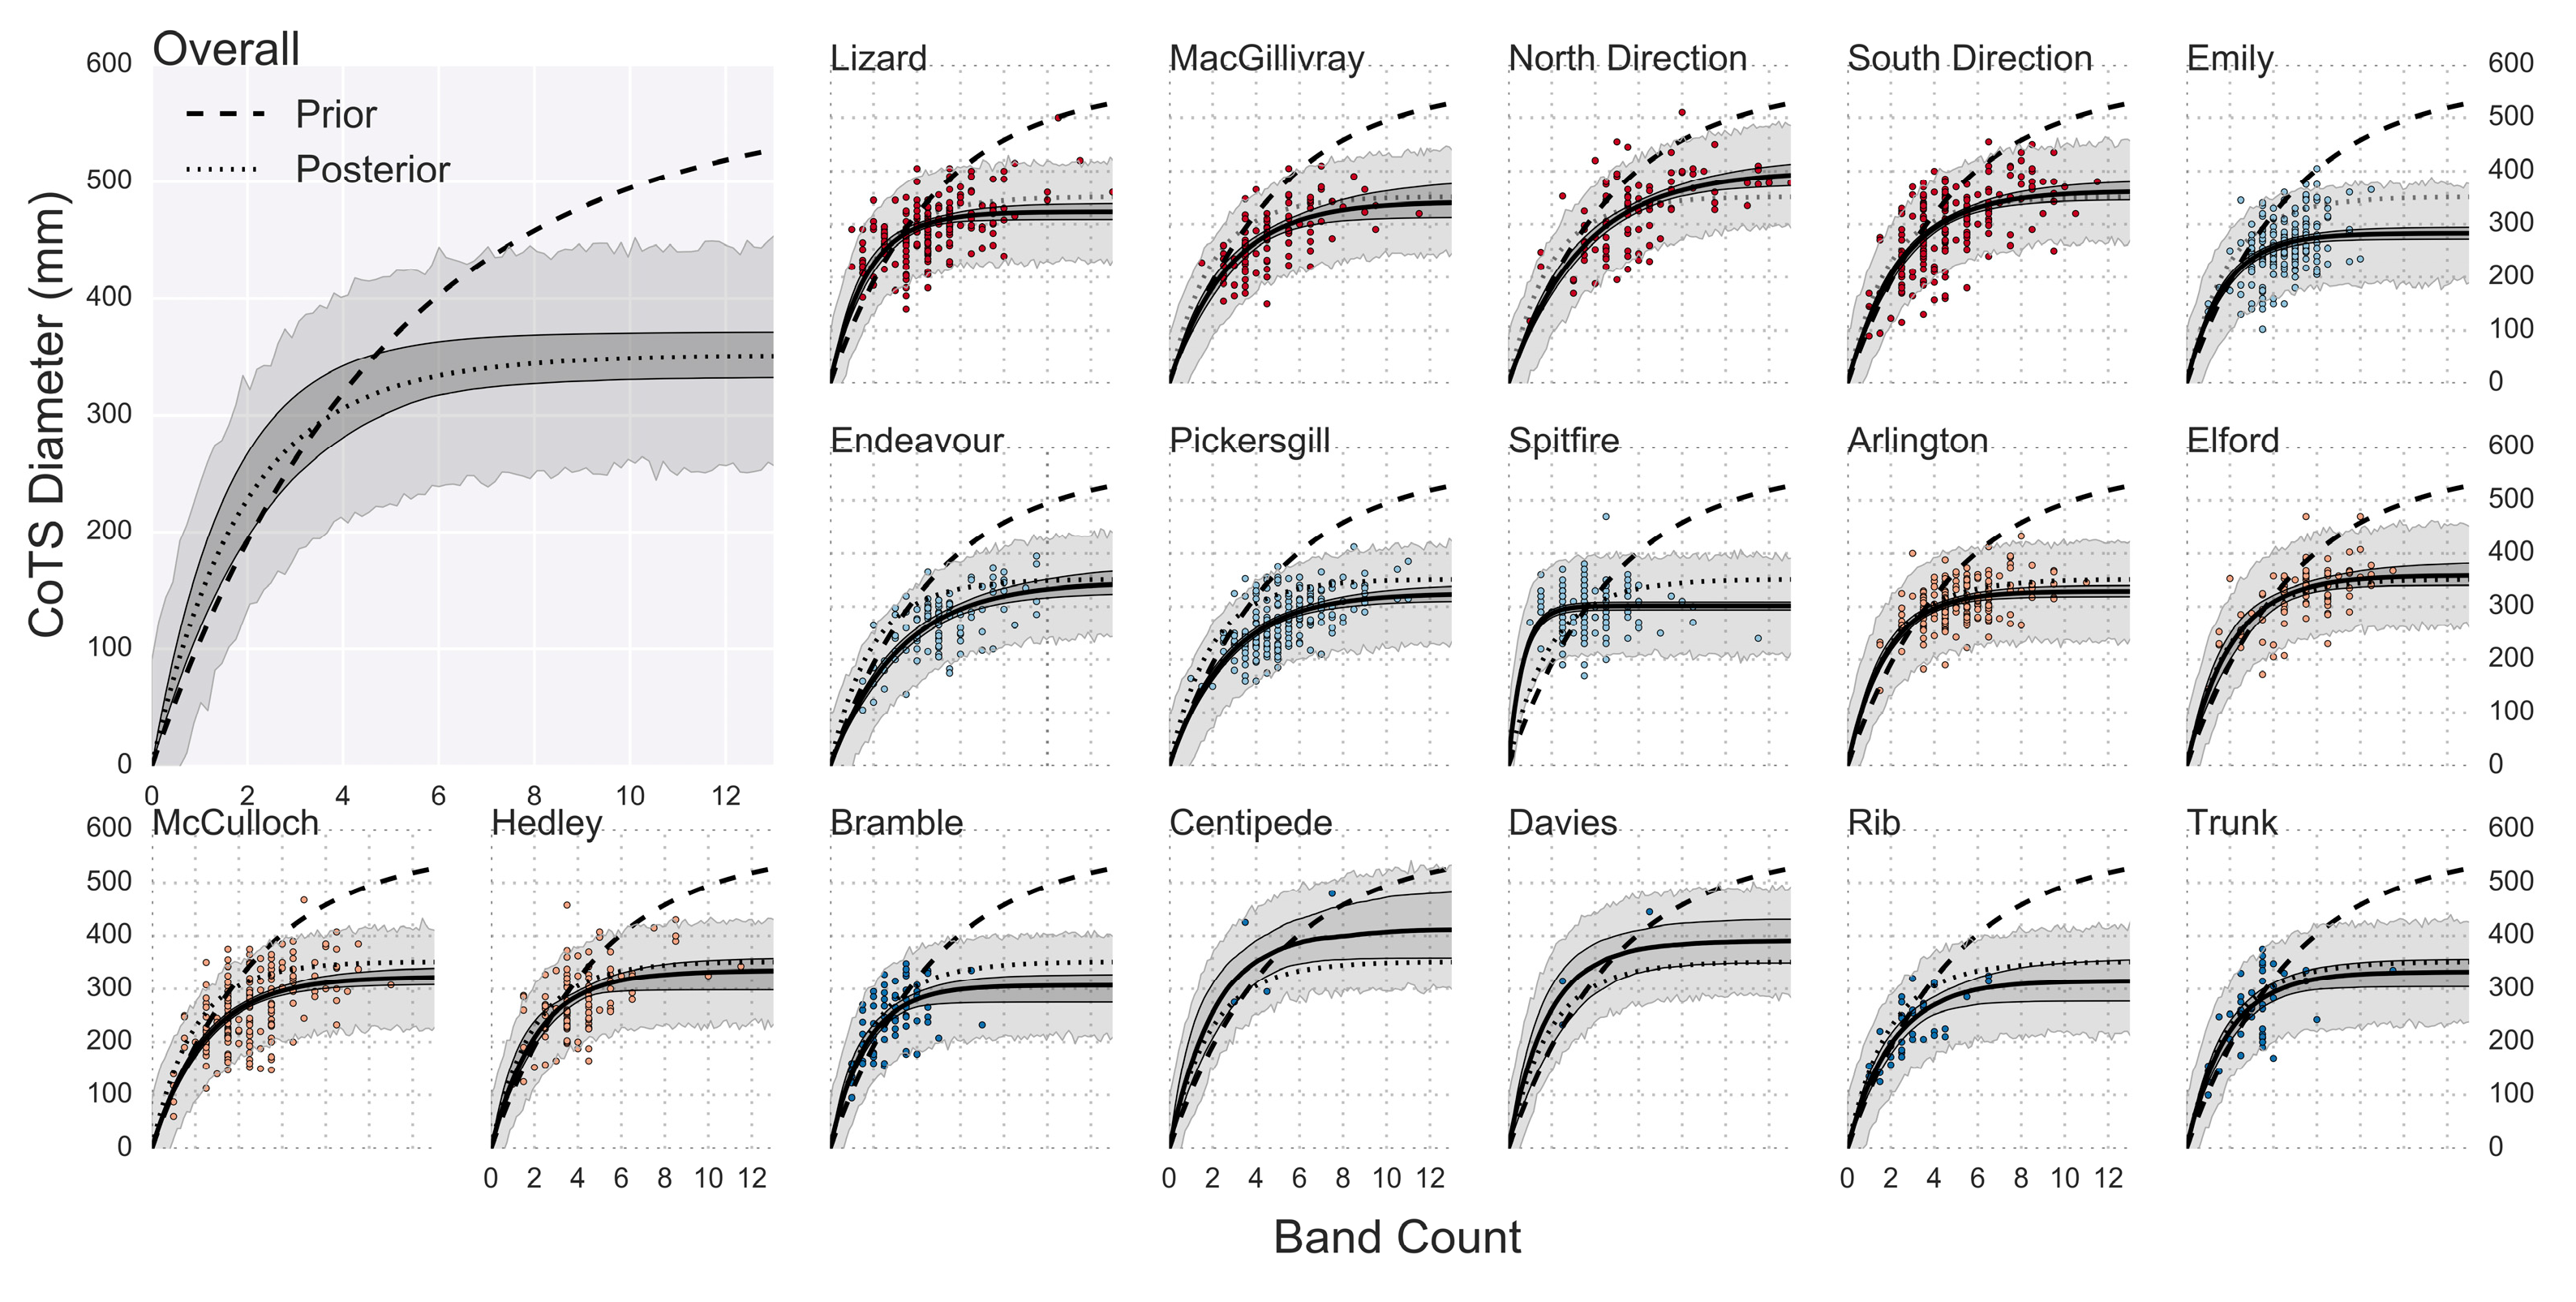
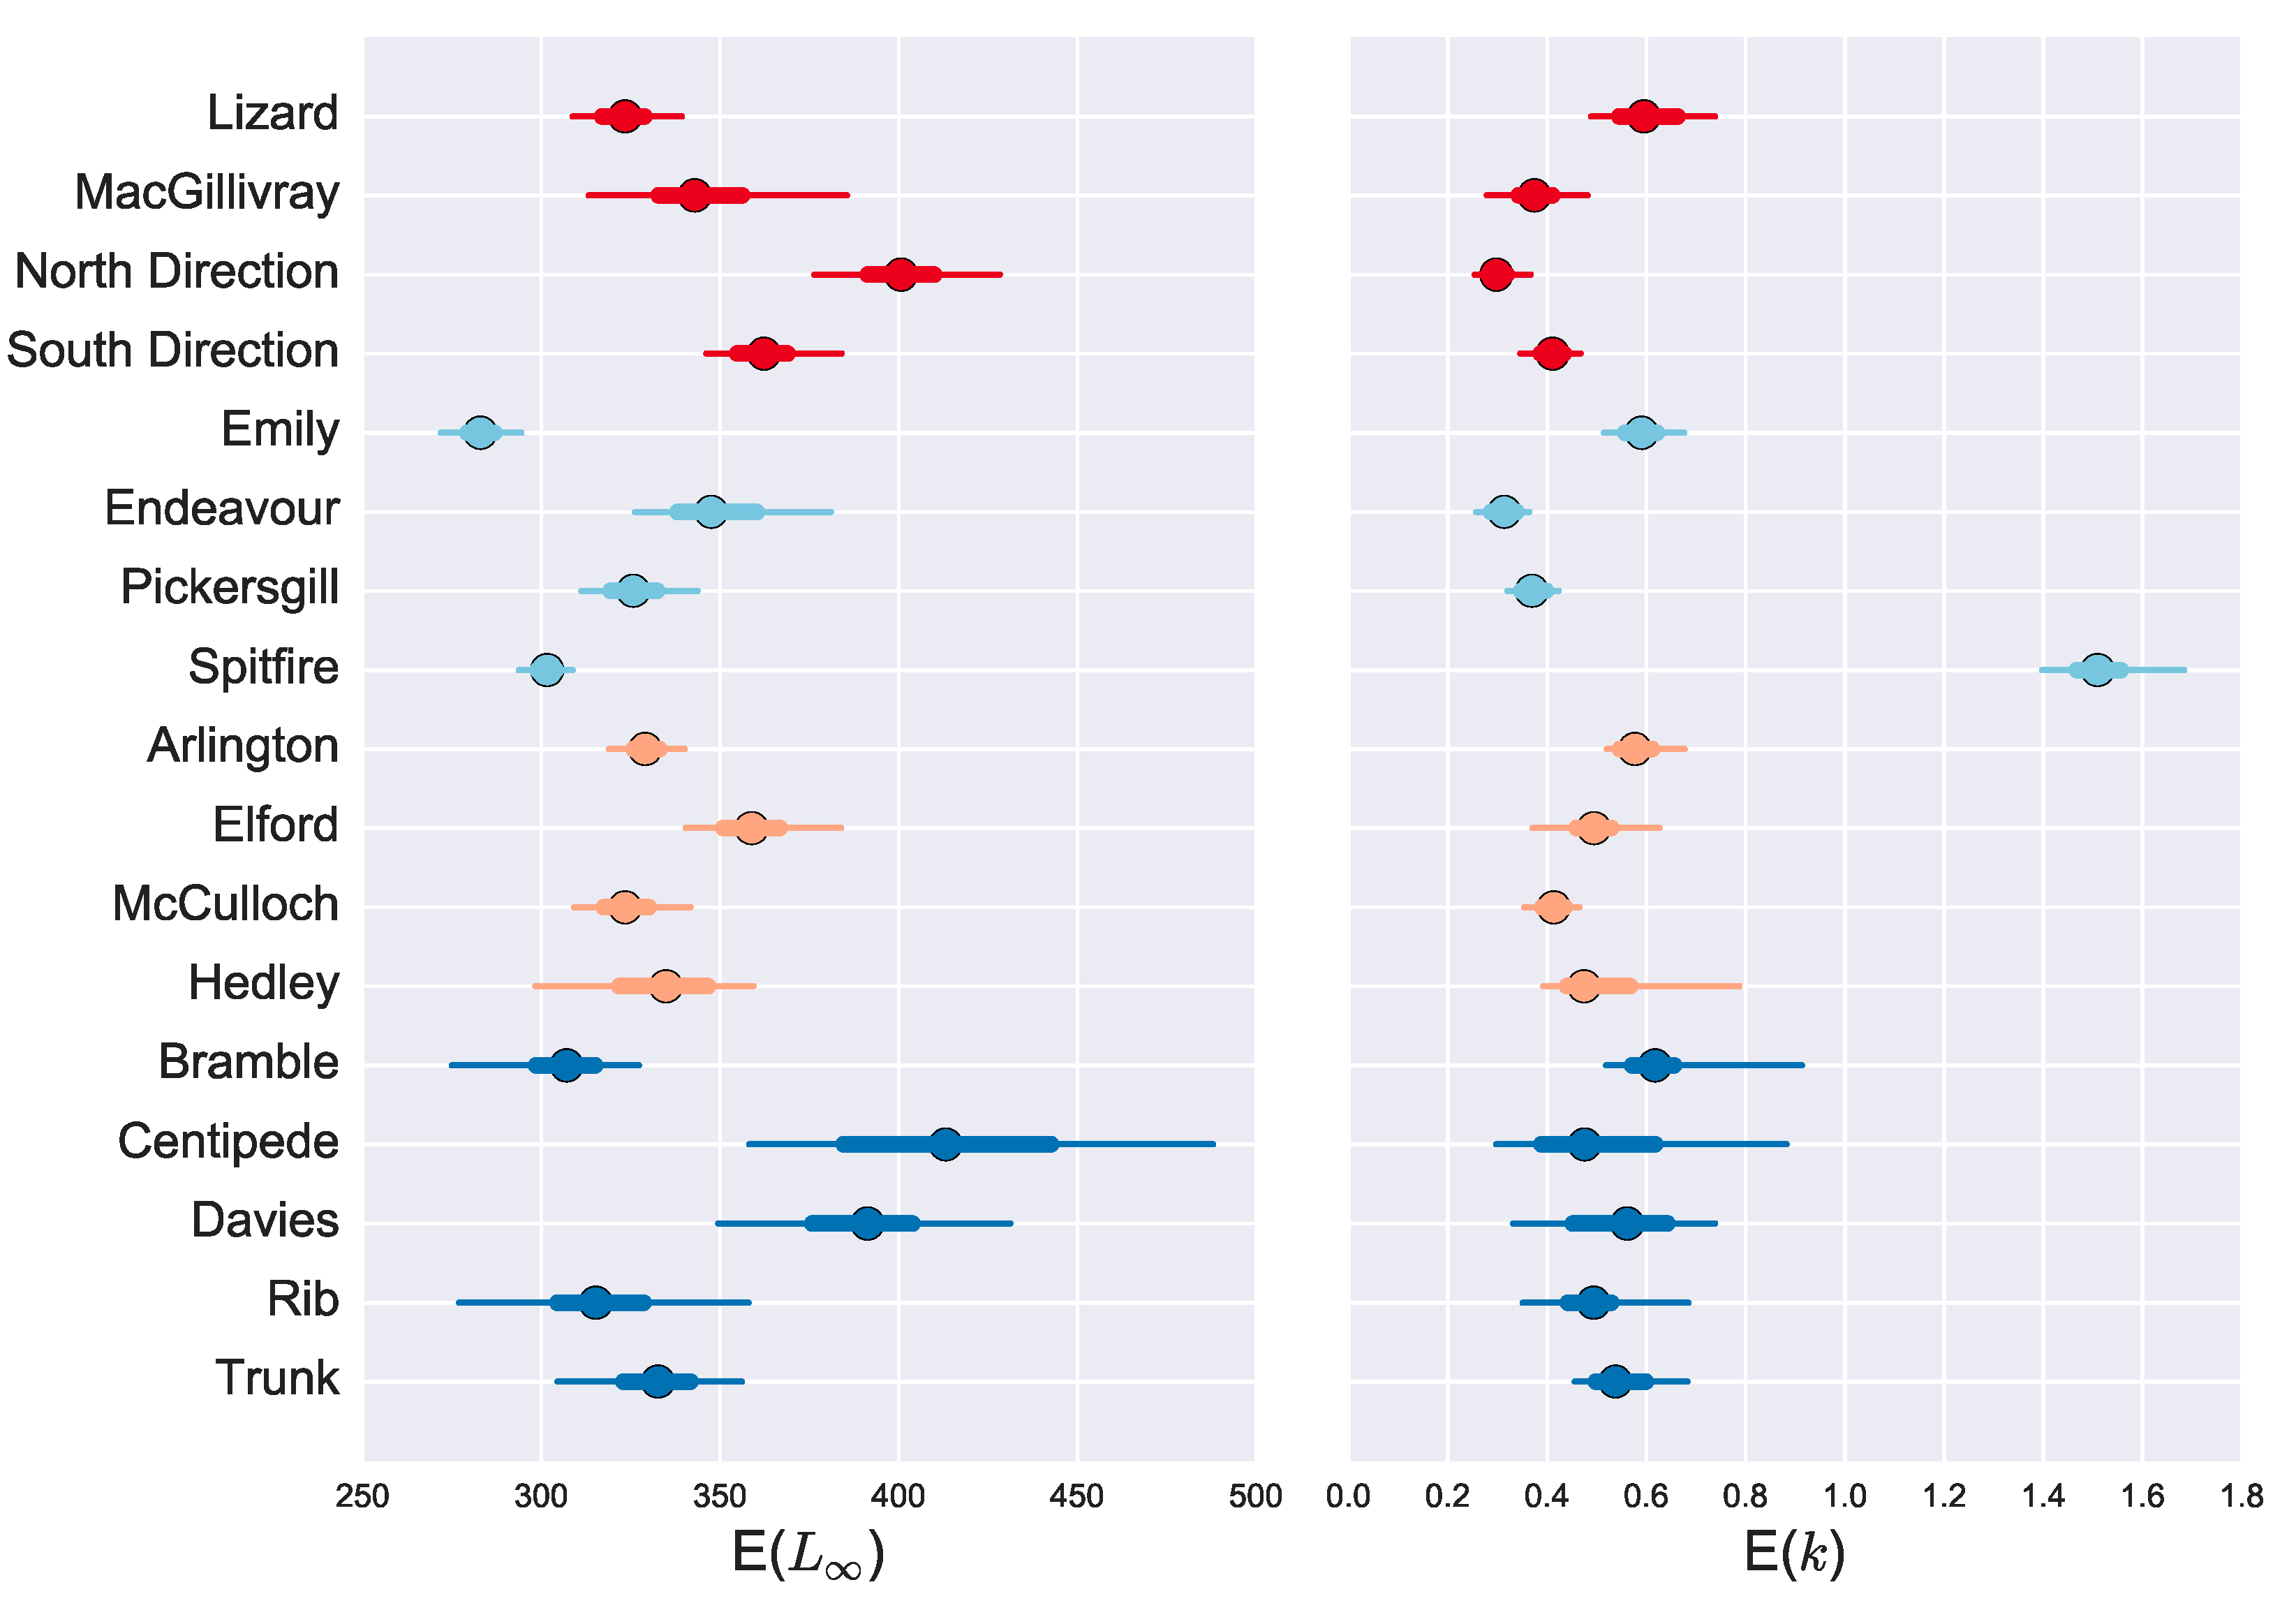
3. Results
3.1. Age and Growth Estimates
3.2. Age Reliability
4. Discussion
5. Conclusions
Supplementary Materials
Acknowledgments
Author Contributions
Conflicts of Interest
References
- Bruno, J.F.; Selig, E.R. Regional decline of coral cover in the Indo-Pacific: Timing, extent, and subregional comparisons. PLoS ONE 2007, 2, e711. [Google Scholar] [CrossRef] [PubMed]
- Trapon, M.; Pratchett, M.S.; Penin, L. Change in coral cover and composition following 30 years of disturbances at Moorea, French Polynesia. J. Mar. Biol. 2011, 2011, 807625. [Google Scholar]
- De’ath, G.; Fabricius, K.E.; Sweatman, H.; Puotinen, M. The 27-year decline of coral cover on the Great Barrier Reef and its causes. Proc. Nat. Acad. Sci. USA 2012, 109, 17995–17999. [Google Scholar] [CrossRef] [PubMed]
- Pisapia, C.; Burn, D.; Yoosuf, R.; Najeeb, A.; Anderson, K.D.; Pratchett, M.S. Coral recovery in the central Maldives archipelago since the last major mass-bleaching, in 1998. Sci. Rep. 2016, 6, 34720. [Google Scholar] [CrossRef] [PubMed]
- Pratchett, M.S.; Caballes, C.F.; Rivera-Posada, J.A.; Sweatman, H.P.A. Limits to understanding and managing outbreaks of crown-of-thorns starfish (Acanthaster spp.). Oceanogr. Mar. Biol. Annu. Rev. 2014, 52, 133–200. [Google Scholar]
- Hoey, J.; Campbell, M.L.; Hewitt, C.L.; Gould, B.; Bird, R. Acanthaster planci invasions: Applying biosecurity practices to manage a native boom and bust coral pest in Australia. Manag. Biol. Invasion 2016, 7, 213–220. [Google Scholar] [CrossRef]
- Moran, P.J.; Reichelt, R.E.; Bradbury, R.H. An assessment of the geological evidence for previous Acanthaster outbreaks. Coral Reefs 1986, 4, 235–238. [Google Scholar] [CrossRef]
- Moore, R.J. Persistent and transient populations of the crown-of-thorns starfish, Acanthaster planci. Lect. Notes Biomath. 1990, 88, 236–277. [Google Scholar]
- Vine, P.J. Crown of Thorns (Acanthaster planci) Plagues: The Natural Causes Theory; Smithsonian Institution: Washington, DC, USA, 1973. [Google Scholar]
- Babcock, R.C.; Milton, D.A.; Pratchett, M.S. Relationships between size and reproductive output in the crown-of-thorns starfish. Mar. Biol. 2016, 163, 234. [Google Scholar] [CrossRef]
- Endean, R. Report on Investigations Made into Aspects of the Current Acanthaster planci (Crown-of-Thorns) Infestations of Certain Reefs of the Great Barrier Reef; Fisheries Branch: Brisbane, Australia, 1969. [Google Scholar]
- Birkeland, C. Terrestrial runoff as a cause of outbreaks of Acanthaster planci (Echinodermata: Asteroidea). Mar. Biol. 1982, 69, 175–185. [Google Scholar] [CrossRef]
- Fabricius, K.E.; Okaji, K.; De’ath, G. Three lines of evidence to link outbreaks of the crown-of-thorns seastar Acanthaster planci to the release of larval food limitation. Coral Reefs 2010, 29, 593–605. [Google Scholar] [CrossRef]
- Chesher, R.H. Destruction of Pacific corals by the sea star Acanthaster planci. Science 1969, 165, 280–283. [Google Scholar] [CrossRef] [PubMed]
- Pearson, R.G.; Endean, R. A preliminary study of the coral predator Acanthaster plani (L.) (Asteroidea) on the Great Barrier Reef. Fisheries Notes 1969, 3, 27. [Google Scholar]
- Baird, A.H.; Pratchett, M.S.; Hoey, A.S.; Herdiana, Y.; Campbell, S.J. Acanthaster planci is a major cause of coral mortality in Indonesia. Coral Reefs 2013, 32, 803–812. [Google Scholar] [CrossRef]
- Pratchett, M.S. Dynamics of an outbreak population of Acanthaster planci at Lizard Island, northern Great Barrier Reef (1995–1999). Coral Reefs 2005, 24, 453–462. [Google Scholar] [CrossRef]
- Pan, M.; Hilomen, V.; Palomares, M.L. Size Structure of Acanthaster planci populations in Tubbataha Reefs Natural Parks, Sulu Sea, Philippeans. Fish. Centre Res. Rep. 2010, 18, 70–77. [Google Scholar]
- Kenchington, R.A. The crown-of-thorns crisis in Australia: A retrospective analysis. Environ. Conserv. 1978, 5, 11–20. [Google Scholar] [CrossRef]
- Lucas, J.S. Growth, maturation and effects of diet in Acanthaster planci (L.) (Asteroidea) and hybrids reared in the laboratory. J. Exp. Mar. Biol. Ecol. 1984, 79, 129–147. [Google Scholar] [CrossRef]
- Birkeland, C.; Lucas, J. Acanthaster Planci: Major Management Problem of Coral Reefs; CRC Press: Florida, FL, USA, 1990. [Google Scholar]
- Stump, R.J.; Lucas, J.S. Linear growth in spines from Acanthaster planci (L.) involving growth lines and periodic pigment bands. Coral Reefs 1990, 9, 149–154. [Google Scholar] [CrossRef]
- Stump, R.J. Age Determination and Life-History Characteristics of Acanthaster planci (L.) (Echinodermata: Asteroidea). Ph.D. Thesis, James Cook University, Townsville, QLD, Australia, 1994. [Google Scholar]
- Stump, R.J. An Investigation to Describe Populations Dynamics of Acanthaster planci (L.) around Lizard Island, Cairns Section, Great Barrier Reef Marine Park; Technical Report No. 10; CRC Reef Research Centre: Townsville, QLD, Australia, 1996. [Google Scholar]
- Lucas, J.S. Reproductive and larval biology of Acanthaster planci in Great Barrier Reef waters. Micronesica 1973, 9, 197–207. [Google Scholar]
- Doherty, P.P.; Coleman, G.G.; Logan, M.M.; MacNeil, M.A. Estimates of the Abundance of the Spawning Stock of Crown-of-Thorns Starfish on the Northern Great Barrier Reef in 2013–2014 and Reflections on the Effectiveness of Starfish Control; Report for the Department of the Environment, Australian Government; Australian Institute of Marine Science: Townsville, QLD, Australia, 2015.
- Wooldridge, S.A.; Brodie, J.E. Environmental triggers for primary outbreaks of crown-of-thorns starfish on the Great Barrier Reef, Australia. Mar. Poll. Bull. 2015, 101, 805–815. [Google Scholar] [CrossRef] [PubMed]
- Vanhatalo, J.; Hosack, G.R.; Sweatman, H. Spatio-temporal modelling of crown-of-thorns starfish outbreaks on the Great Barrier Reef to inform control strategies. J. Appl. Ecol. 2016. [Google Scholar] [CrossRef]
- Salvatier, J.; Wiecki, T.V.; Fonnesbeck, C. Probabilistic programming in Python using PyMC3. PeerJ Comp. Sci. 2016, 2, e55. [Google Scholar] [CrossRef]
- Ormond, R.T.; Campbell, A.C. Observations on Acanthaster planci and other coral reef echinoderms in the Sudanese Red Sea. Symp. Zool. Soc. Lond. 1971, 28, 3–4. [Google Scholar]
- Harrison, H.B.; Pratchett, M.S.; Messmer, V.; Saenz-Agudelo, P.; Berumen, M.L. Microsatellites reveal genetic homogeneity among outbreak populations of crown-of-thorns starfish (Acanthaster cf. solaris) on Australia’s Great Barrier Reef. Diversity 2017, 9, 16. [Google Scholar] [CrossRef]
- Kettle, B.T. Variations in Biometric and Physiological Parameters of Acanthaster planci (L.) (Echinodermata; Asteroidea) during the Course of a High Density Outbreak. Ph.D. Thesis, James Cook University, Townsville, QLD, Australia, 1990. [Google Scholar]
- Engelhardt, U.; Miller, I.; Lassig, B.; Sweatman, H.; Bass, D. Crown-of-thorns starfish (Acanthaster planci) populations in the Great Barrier Reef World Heritage Area: Status report 1995–1996. In Proceedings of the State of the Great Barrier Reef World Heritage Area Technical Workshop, Townsville, Australia, 27–29 November 1995; pp. 158–184.
- Scheibling, R.E.; Lawrence, J.M. Differences in reproductive strategies of morphs of the genus Echinaster (Echinodermata: Asteroidea) from the eastern Gulf of Mexico. Mar. Biol. 1982, 70, 51–62. [Google Scholar] [CrossRef]
- Campana, S.E. Accuracy, precision and quality control in age determination, including a review of the use and abuse of age validation methods. J. Fish. Biol. 2001, 59, 197–242. [Google Scholar] [CrossRef]
- Holling, C.S. Some characteristics of simple types of predation and parasitism. Can. Entomol. 1959, 91, 385–398. [Google Scholar] [CrossRef]


| Region | Reef | Reef Size (km2) | n (Abundance) | n (Demographics) |
|---|---|---|---|---|
| Northern sector of the initiation box (around Lizard Island) | Lizard Island | 13.62 | 333 | 202 |
| MacGillivray Reef | 0.92 | 333 | 200 | |
| North Direction | 0.69 | 305 | 198 | |
| South Direction | 3.32 | 259 | 200 | |
| Total | 1230 | |||
| Central sector of the initiation box (off Cooktown) | Emily Reef | 35.31 | 348 | 200 |
| Endeavour Reef | 20.40 | 340 | 200 | |
| Pickersgill Reef | 18.82 | 322 | 200 | |
| Spitfire Reef | 3.12 | 300 | 200 | |
| Total | 1310 | |||
| Southern sector of the initiation box (off Cairns) | Arlington Reef | 127.75 | 334 | 200 |
| Elford Reef | 39.68 | 89 | 89 | |
| McCulloch Reef | 26.31 | 308 | 200 | |
| Hedley Reef | 39.84 | 328 | 200 | |
| Total | 1059 | |||
| Southern edge of the outbreak (off Townsville) | Bramble Reef | 62.99 | 75 | 75 |
| Centipede Reef | 30.01 | 4 | 4 | |
| Davies Reef | 16.62 | 3 | 3 | |
| Rib Reef | 10.45 | 36 | 36 | |
| Trunk Reef | 121.60 | 42 | 42 | |
| Total | 160 | |||
| Grand Total | 3759 |
© 2017 by the authors. Licensee MDPI, Basel, Switzerland. This article is an open access article distributed under the terms and conditions of the Creative Commons Attribution (CC BY) license ( http://creativecommons.org/licenses/by/4.0/).
Share and Cite
MacNeil, M.A.; Chong-Seng, K.M.; Pratchett, D.J.; Thompson, C.A.; Messmer, V.; Pratchett, M.S. Age and Growth of An Outbreaking Acanthaster cf. solaris Population within the Great Barrier Reef. Diversity 2017, 9, 18. https://0-doi-org.brum.beds.ac.uk/10.3390/d9010018
MacNeil MA, Chong-Seng KM, Pratchett DJ, Thompson CA, Messmer V, Pratchett MS. Age and Growth of An Outbreaking Acanthaster cf. solaris Population within the Great Barrier Reef. Diversity. 2017; 9(1):18. https://0-doi-org.brum.beds.ac.uk/10.3390/d9010018
Chicago/Turabian StyleMacNeil, M. Aaron, Karen M. Chong-Seng, Deborah J. Pratchett, Casssandra A. Thompson, Vanessa Messmer, and Morgan S. Pratchett. 2017. "Age and Growth of An Outbreaking Acanthaster cf. solaris Population within the Great Barrier Reef" Diversity 9, no. 1: 18. https://0-doi-org.brum.beds.ac.uk/10.3390/d9010018