1. Introduction
Human breath contains many main gases such as N
2, CO
2, O
2 and minor gases such as inflammable gases (CO, CH
4, and H
2), and volatile organic compounds (VOCs) [
1,
2,
3,
4,
5]. Some gases in the human breath are considered as biomarkers for diseases. For example, the breath of lung cancer patients includes aldehydes such as nonanal [
3], and nitric oxide (NO) in human breath increases in airway inflammatory disorders such as asthma in adults and children [
4,
5]. Some biomarker gases in human breath are present at very low concentrations in the range from several parts per billion (ppb) to parts per million (ppm). Thus, monitoring human breath is one of the best non-invasive screening tests for early diagnosis, but this process requires analysis equipment with sufficient accuracy at the ppb level.
NO in human breath has been measured according to the American Thoracic Society recommendations [
6] using a chemiluminescence analyzer (model 280i NO analyzer; Sievers, Boulder, CO, USA) and is expressed in ppb. Because the analyzer is bulky and needs an ozone supply, effective, inexpensive, and miniaturized systems for the detection and quantification of NO are required [
7]. Gas sensors have been considered promising candidates for NO measurement in human breath owing to their low cost, compact size, and direct electronic interface [
8,
9]. Many types of NO gas sensors consisting of semiconductors have been investigated [
8,
9,
10,
11,
12,
13,
14,
15]. Among the metal–oxide–semiconductors, the n-type semiconductors, specifically those based on highly sensitive WO
3, are promising candidates that can be used to detect NO gas. We have reported the NO and NO
2 sensing (0.5–5 ppm in air) properties of a p-type Co
3O
4 gas sensor [
13]. The Co
3O
4 gas sensor showed low sensor resistance of below 1 kΩ and the NO sensor responses were higher than the NO
2 sensor responses. This result suggested that the peripheral circuit used to measure the sensor resistance and the device cost can be reduced. Although the sensor responses of a Co
3O
4-based gas sensor at 0.5–5 ppm NO have been investigated, the sensor responses to several hundred ppb NO have not been studied. Moreover, the Co
3O
4-based gas sensor showed a low sensor response, even at 0.5 ppm NO and could not accurately detect NO concentrations in several hundred ppb. The addition of metal or metal–oxides in the metal–oxide–semiconductors is critical in improving the sensor response and response time of metal–oxide–semiconductor-based gas sensors [
12,
14]. Penza
et al. reported that the Pd-doped WO
3-based sensor showed higher sensor response to 440 ppm NO gas than the undoped, Pt-doped, and Au-doped WO
3-based sensors [
12]. In addition, the NO gas sensor must show high NO selectivity against other gases such as H
2, CO, and CH
4 in human breath. The H
2 concentration in human breath has been measured at several tens of ppm level and is higher than that of other gases such as inflammable gases and VOCs [
16].
In the present study, Pd-loaded Co
3O
4 was prepared by a colloidal mixing method [
17] to improve the gas-sensing properties, and the sensor response, response time, recovery time, and signal-to-noise (
S/N) ratio toward low NO concentration were investigated. To study the possibility of breath analysis using a 10 wt% Pd-loaded Co
3O
4 sensor, the sensor responses to 25 and 100 ppm H
2 in air were investigated as an initial evaluation.
2. Experimental
Co
3O
4 powder with an average particle size of 20–30 nm was used as a NO gas-sensing material. The Co
3O
4 powder was mixed and stirred in ethanol solution. Then, Pd colloid suspension (particle size: 4 nm) was added to the Co
3O
4-mixed ethanol solution, and the mixed solution was stirred and dried at 50 °C. The Pd contents were 0 wt%, 0.1 wt%, 1 wt%, 5 wt%, 10 wt%, and 30 wt% relative to the Co
3O
4 content. The resulting powders were denoted as Co
3O
4, 0.1%Pd/Co
3O
4, 1%Pd/Co
3O
4, 5%Pd/Co
3O
4, 10%Pd/Co
3O
4, and 30%Pd/Co
3O
4, respectively. The powders were mixed with an organic dispersant, which consisted of a mixture of 10 wt% ethyl cellulose and 90 wt% terpineol, to obtain a paste suitable for air dispensing. The weight ratio of the powder to the organic dispersant was 1:16. The paste was dispensed on a surface-oxidized Si substrate, which consisted of 2.5 × 4 mm
2 platinum interdigital electrodes with line and space definitions of 15 μm each, using an air-dispenser (FAD320s, Musashi Engineering, Tokyo, Japan) [
13,
17]. The substrate was baked at 400 °C for 2 h under air to obtain the sensor elements. The Co
3O
4 film thickness could be controlled to 2–4 μm by air-dispenser.
The obtained sample powders were characterized by X-ray diffraction (XRD) analysis and transmission electron microscopy (TEM). The XRD analysis was carried out using a RINT 2100V/PC instrument (Rigaku Corporation, Tokyo, Japan) equipped with a copper source (CuKα). TEM was performed using a JEM-2010 instrument (JEOL Ltd., Tokyo, Japan) equipped with an energy dispersive X-ray spectroscope (EDX).
To investigate the NO gas-sensing properties, the sensor element was placed in a test chamber heated to 100–300 °C in an electrical tube furnace. Air was introduced into the chamber for 15 min, and a gas mixture of NO in air was then injected for 15 min. Subsequently, the gas mixture flow was halted and replaced by air injected at a flow rate of 200 mL/min. The NO concentration was controlled to the values of 50, 100, 150, and 200 ppb in air. The resistance among the electrodes of the element in various gaseous atmospheres was measured by two-probe method at 10-s intervals using a K2700 digital multimeter (Keithley). We defined the sensor response value (S) using the following equation: S = Rg/Ra, where Rg denotes the resistance after the NO gas exposure for 15 min and Ra denotes the average resistance (μ) in air for 3 min before the NO gas exposure. The coefficient of variation (CV) of Ra was defined as CV(%) = μ/σ × 100, where σ denotes the Ra standard deviation in air for 3 min. The S/N ratio was defined as S/N = (Rg − μ)/σ. The H2 gas-sensing properties were investigated using the same NO gas-sensing measurement apparatus. The H2 gas concentration was controlled to 0, 25, and 100 ppm in air.
3. Results and Discussion
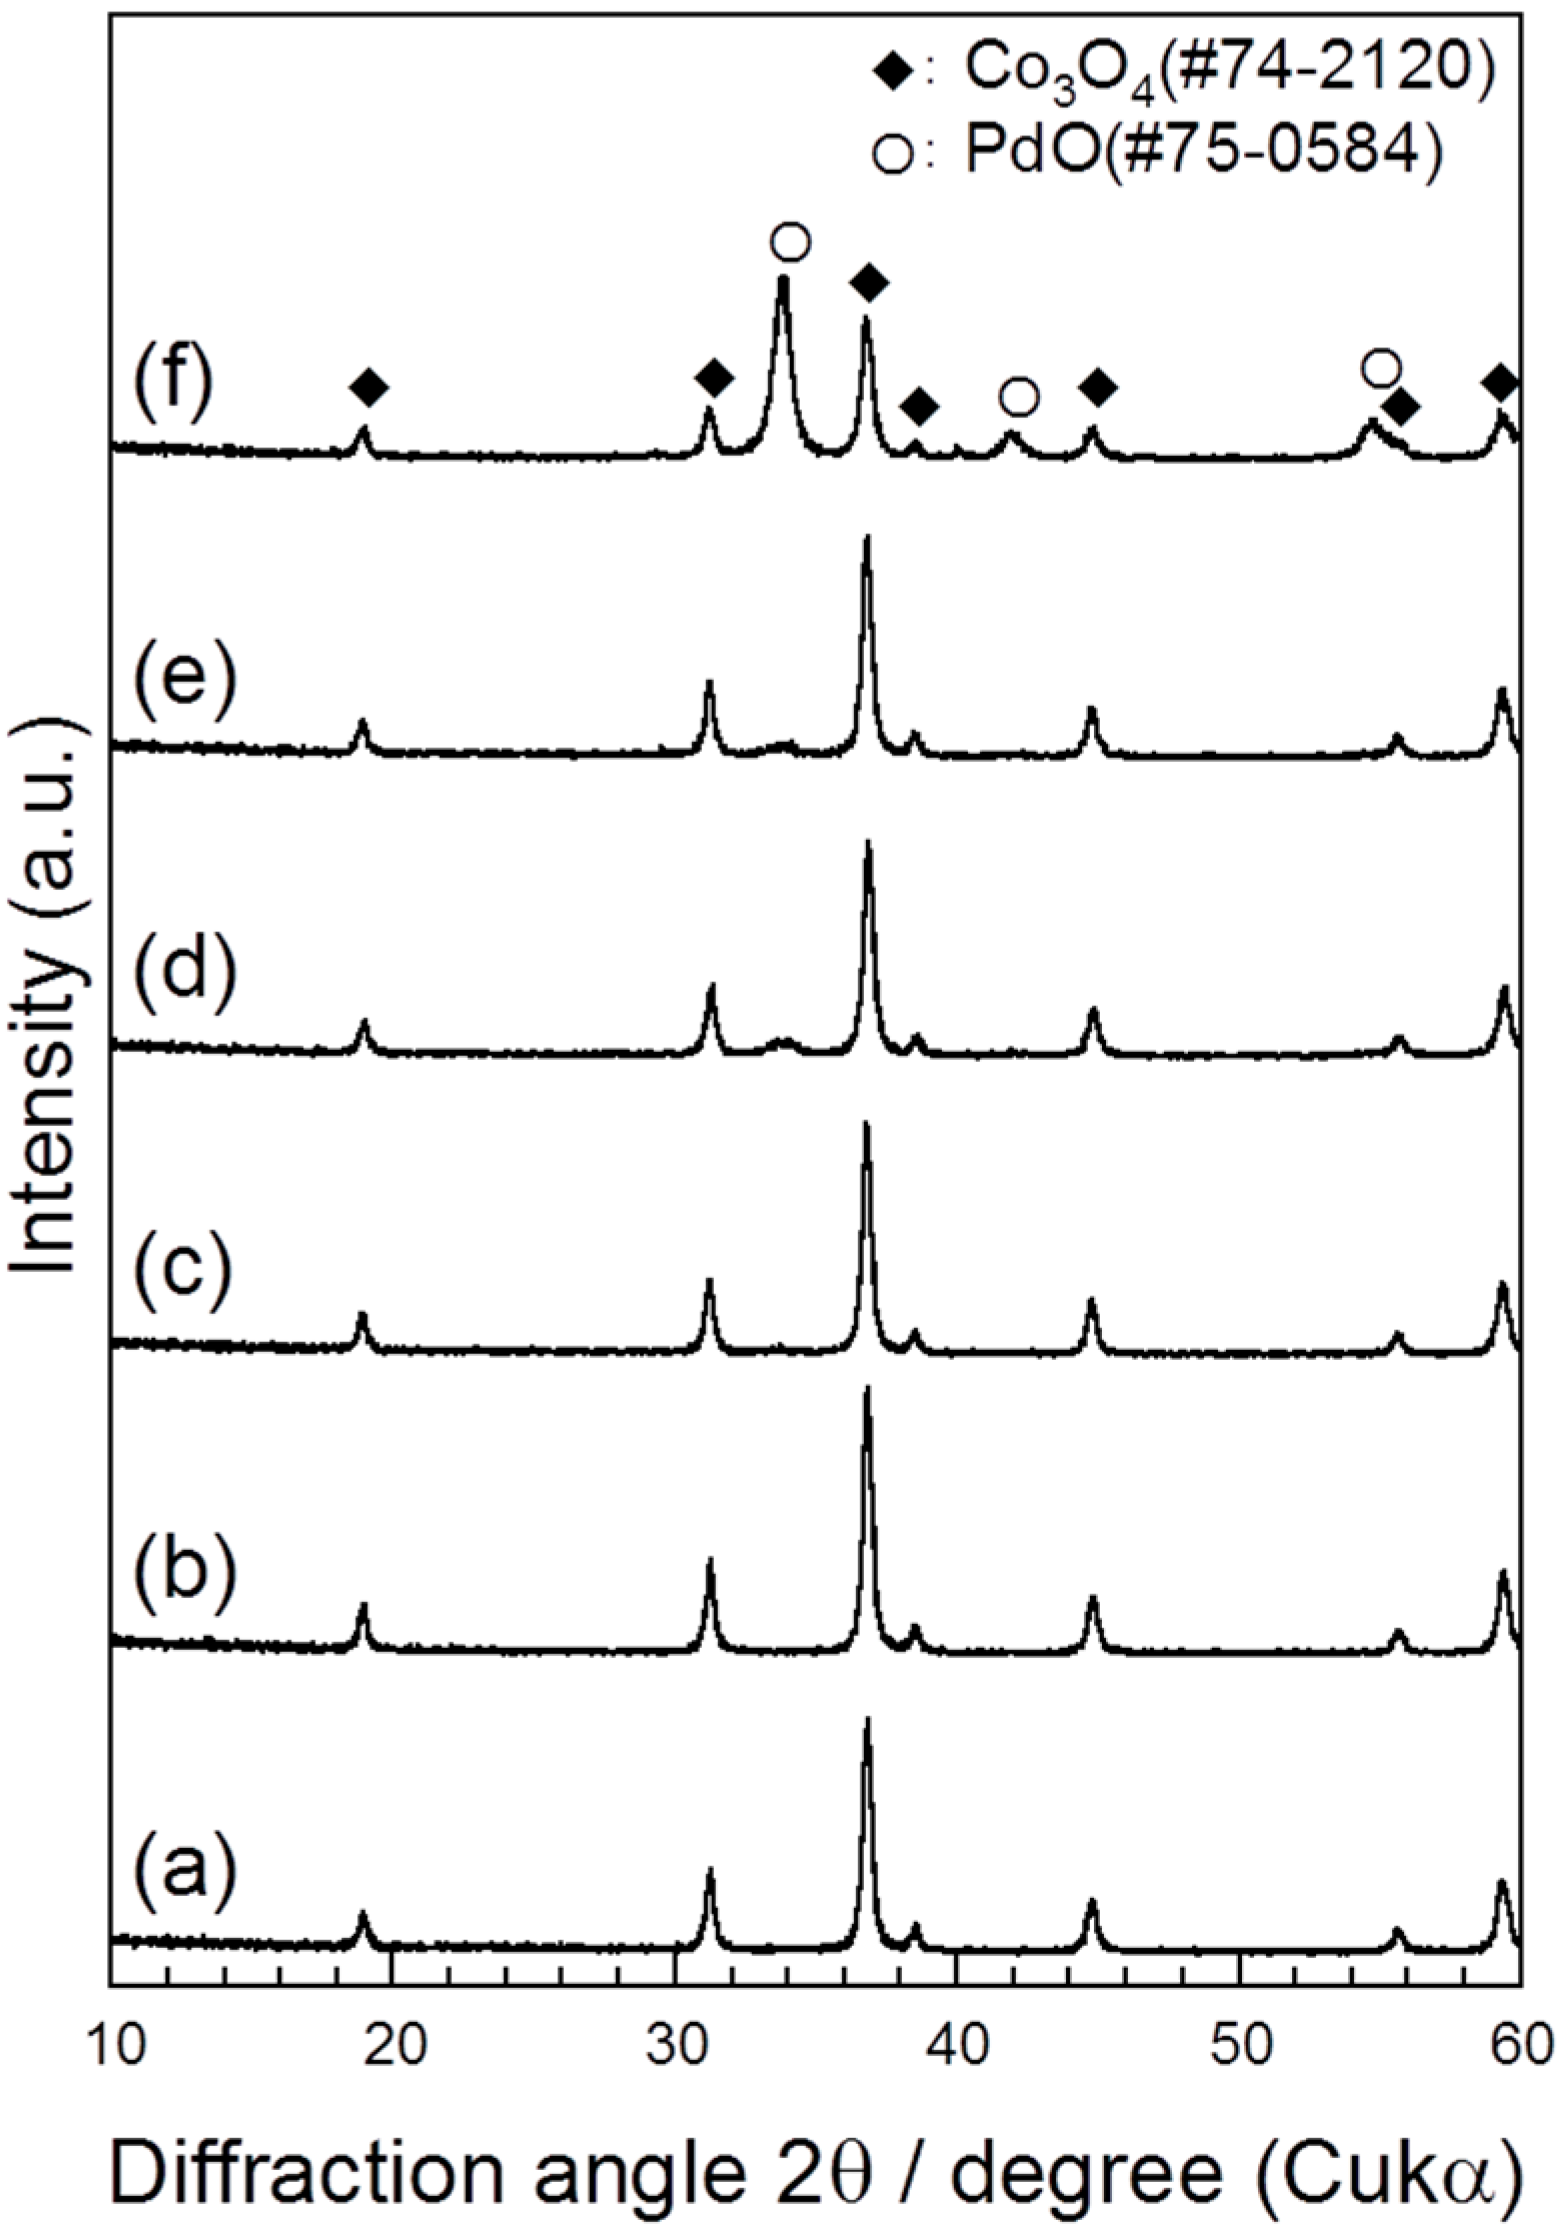
Figure 1 shows the XRD patterns of the Co
3O
4, 0.1%Pd/Co
3O
4, 1%Pd/Co
3O
4, 5%Pd/Co
3O
4, 10%Pd/Co
3O
4, and 30%Pd/Co
3O
4 powder after baking at 400 °C for 2 h. Because the peaks of Co
3O
4 (JCPDS card No. 74-2120) were observed in all patterns, no structural changes due to the oxidation or decomposition of Co
3O
4 were observed after baking at 400 °C for 2 h. The peaks at 34°, 42°, and 55° were assigned to PdO (JCPDS card No. 75-0584). The palladium, which was loaded by a colloidal mixing method process, was oxidized to PdO. A small hill at 34° was observed in the pattern of 1%Pd/Co
3O
4, and this became a peak in the patterns of 5%Pd/Co
3O
4, 10%Pd/Co
3O
4, and 30%Pd/Co
3O
4. The PdO peaks at 42° and 55° were observed in the pattern of 30%Pd/Co
3O
4. No PdO peaks were observed in the pattern of 0.1%Pd/Co
3O
4 owing to its lower Pd amount. The crystallite sizes (
D) were calculated using the Scherrer equation:
D =
kλ/βcosθ, where
k (= 0.9) is the shape factor,
λ is the X-ray wavelength, β is the full width at half maximum of the diffraction peak, and θ is the Bragg diffraction angle. The
D values of the Co
3O
4 peaks at 37° and PdO peak at 34° in 30%Pd/Co
3O
4 were estimated to be 19.0 and 11.7 nm, respectively.
Figure 1.
XRD patterns of (a) Co3O4; (b) 0.1%Pd/Co3O4; (c) 1%Pd/Co3O4; (d) 5%Pd/Co3O4; (e) 10%Pd/Co3O4; and (f) 30%Pd/Co3O4 powder after baking at 400 °C for 2 h.
Figure 1.
XRD patterns of (a) Co3O4; (b) 0.1%Pd/Co3O4; (c) 1%Pd/Co3O4; (d) 5%Pd/Co3O4; (e) 10%Pd/Co3O4; and (f) 30%Pd/Co3O4 powder after baking at 400 °C for 2 h.
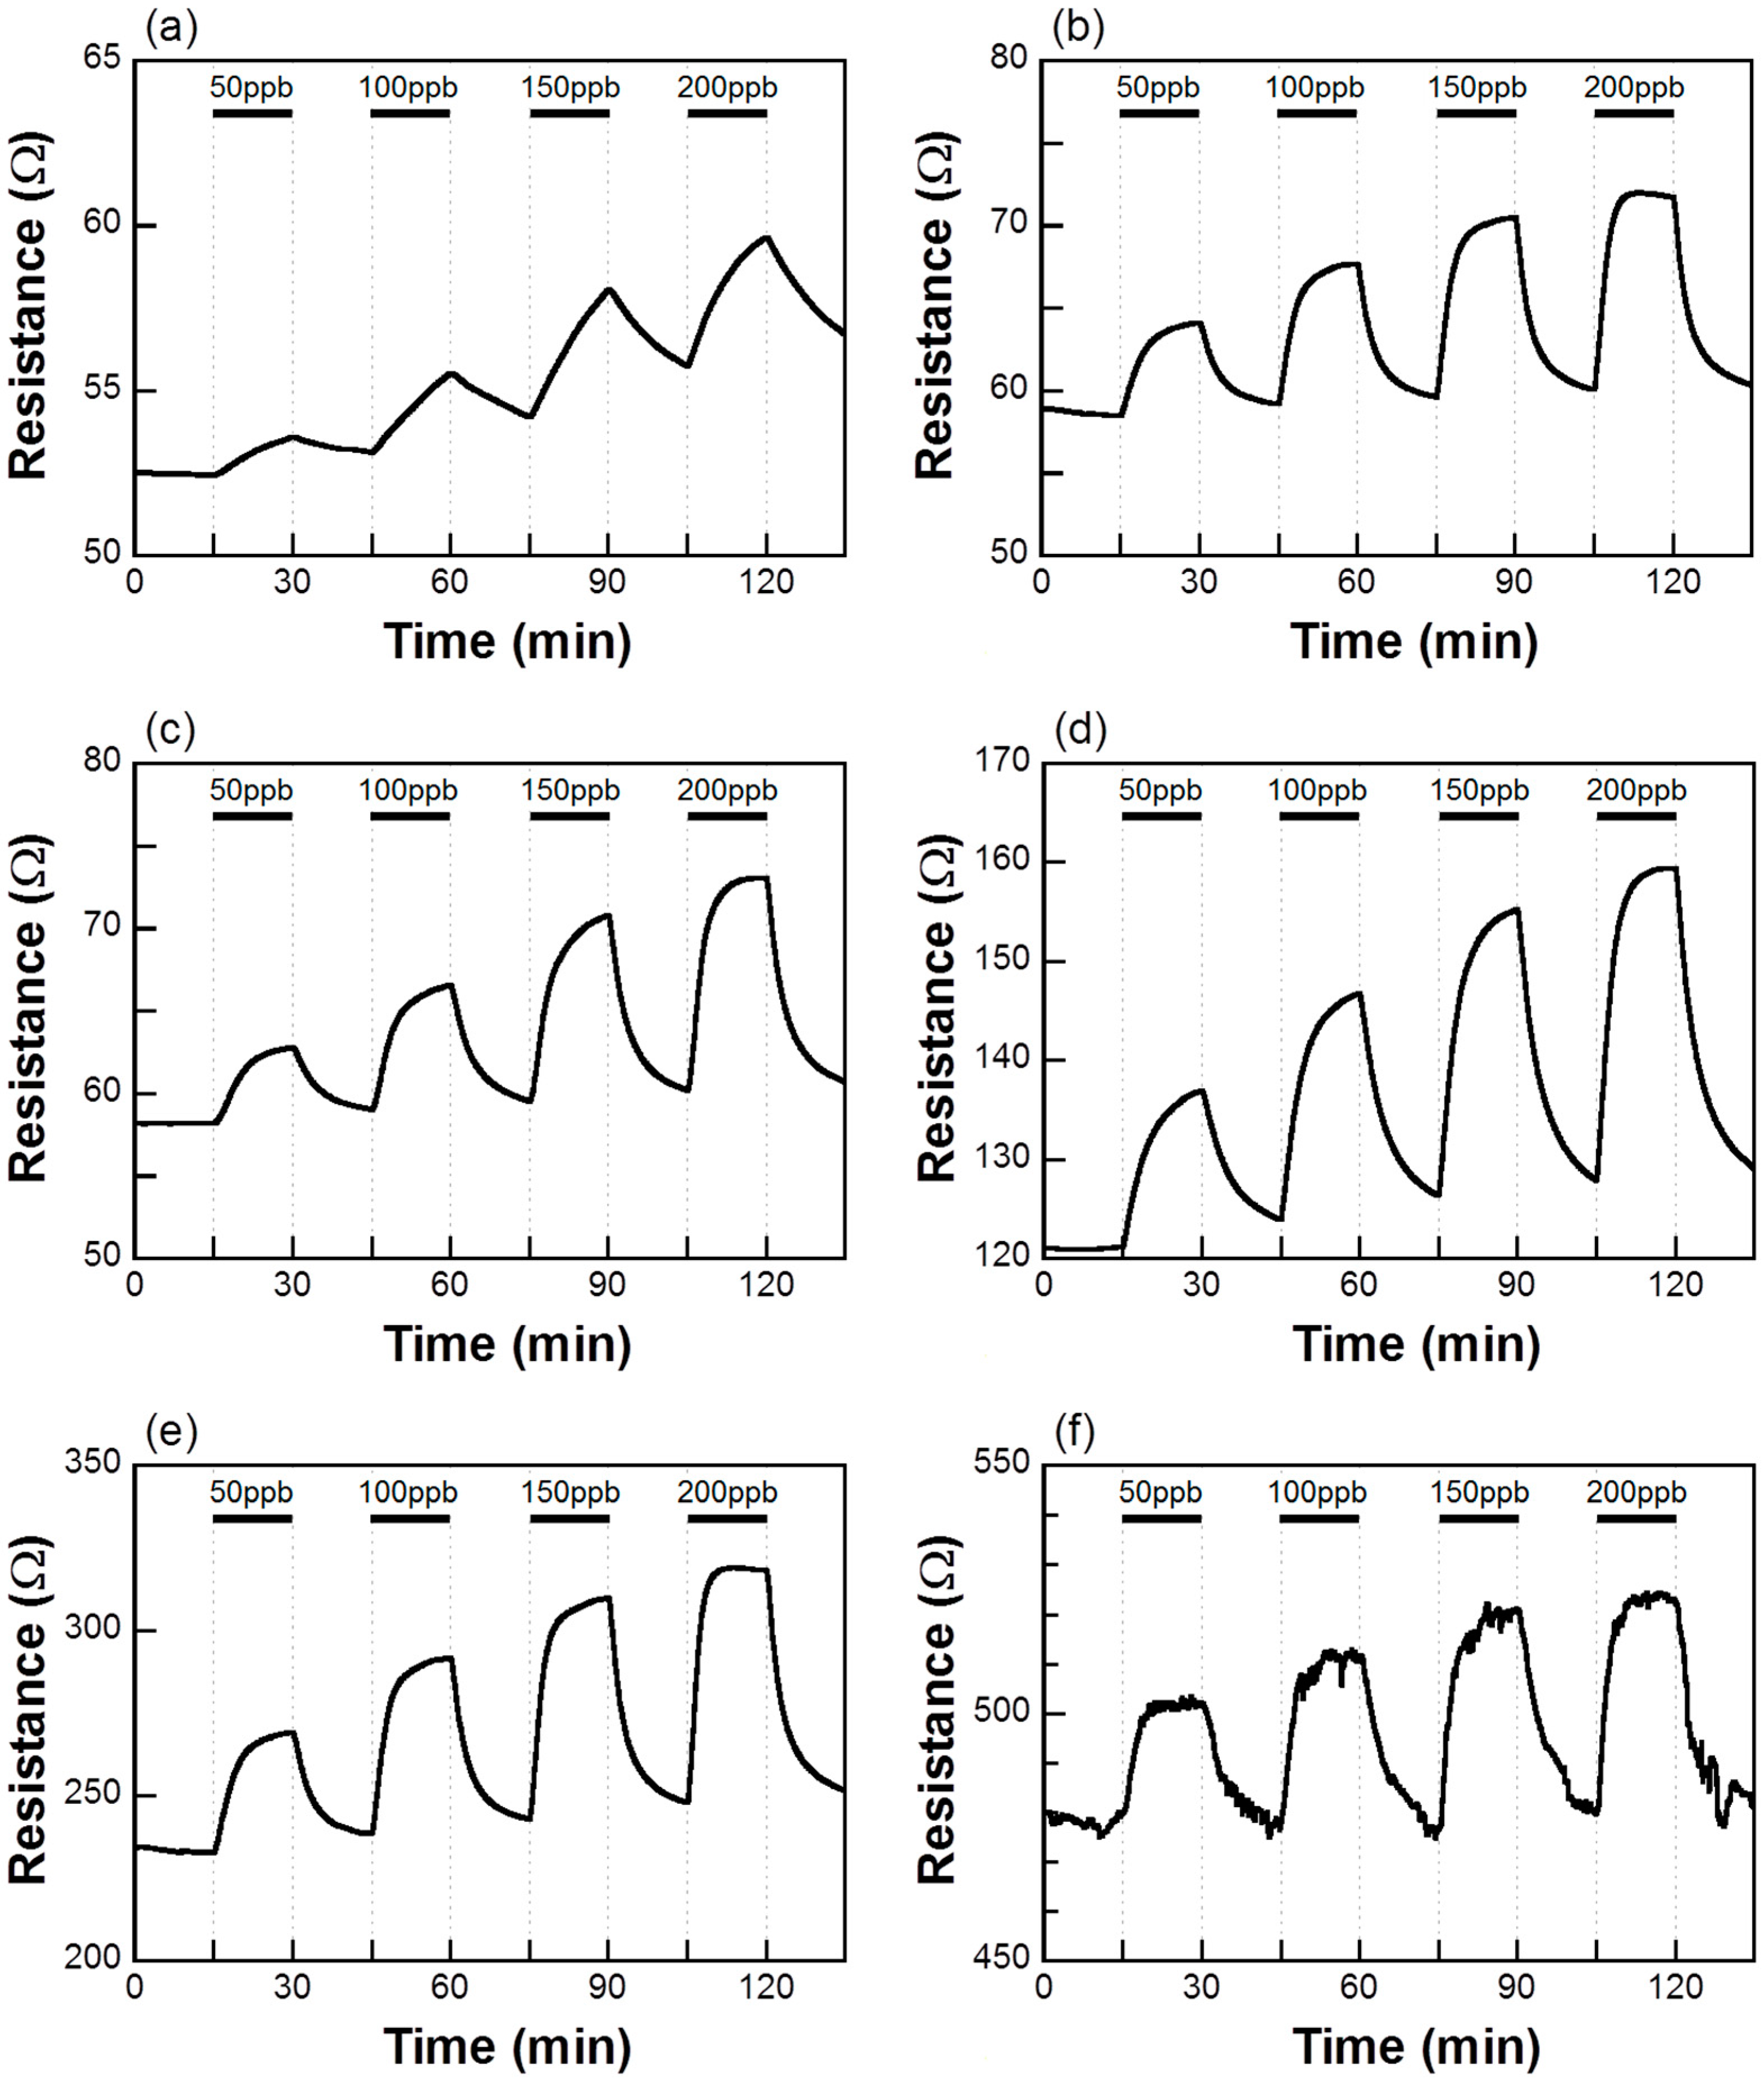
Figure 2 shows the response of the sensor element using the Co
3O
4, 0.1%Pd/Co
3O
4, 1%Pd/Co
3O
4, 5%Pd/Co
3O
4, 10%Pd/Co
3O
4, and 30%Pd/Co
3O
4 powder during exposure to NO (50, 100, 150, and 200 ppb) in air at 200 °C. The resistance of all sensor elements began to increase when they were exposed to NO gas. In the case of a p-type semiconductor such as Co
3O
4 and NiO whose majority carrier is a hole, when the concentration of electrons on the semiconductor surface increases, the resistance of the semiconductor increases because the generated electrons recombine with the holes [
18]. When a reductive NO gas is streamed on a p-type semiconductor, the NO gas reacts with the adsorbed oxygen ions on the semiconductor surface, releasing electrons back to the conduction band. Therefore, the resistance of the sensor elements increases toward the NO gas exposure. All sensor elements exhibited a distinct response to NO gas even at 50 ppb. The resistance of all sensor elements increased with the NO gas concentration. The resistance of the NO-exposed Co
3O
4 film did not reach
Ra even after 15 min of air exposure (see
Figure 2a). This result is considered to imply that the adsorbed NO on Co
3O
4 film surface did not desorb from the surface during air exposure for 15 min. On the other hand, the resistances of the NO-exposed Pd-loaded Co
3O
4 films reached
Ra even after 15 min of air exposure (see
Figure 2b to
Figure 2f). The background resistance signal in
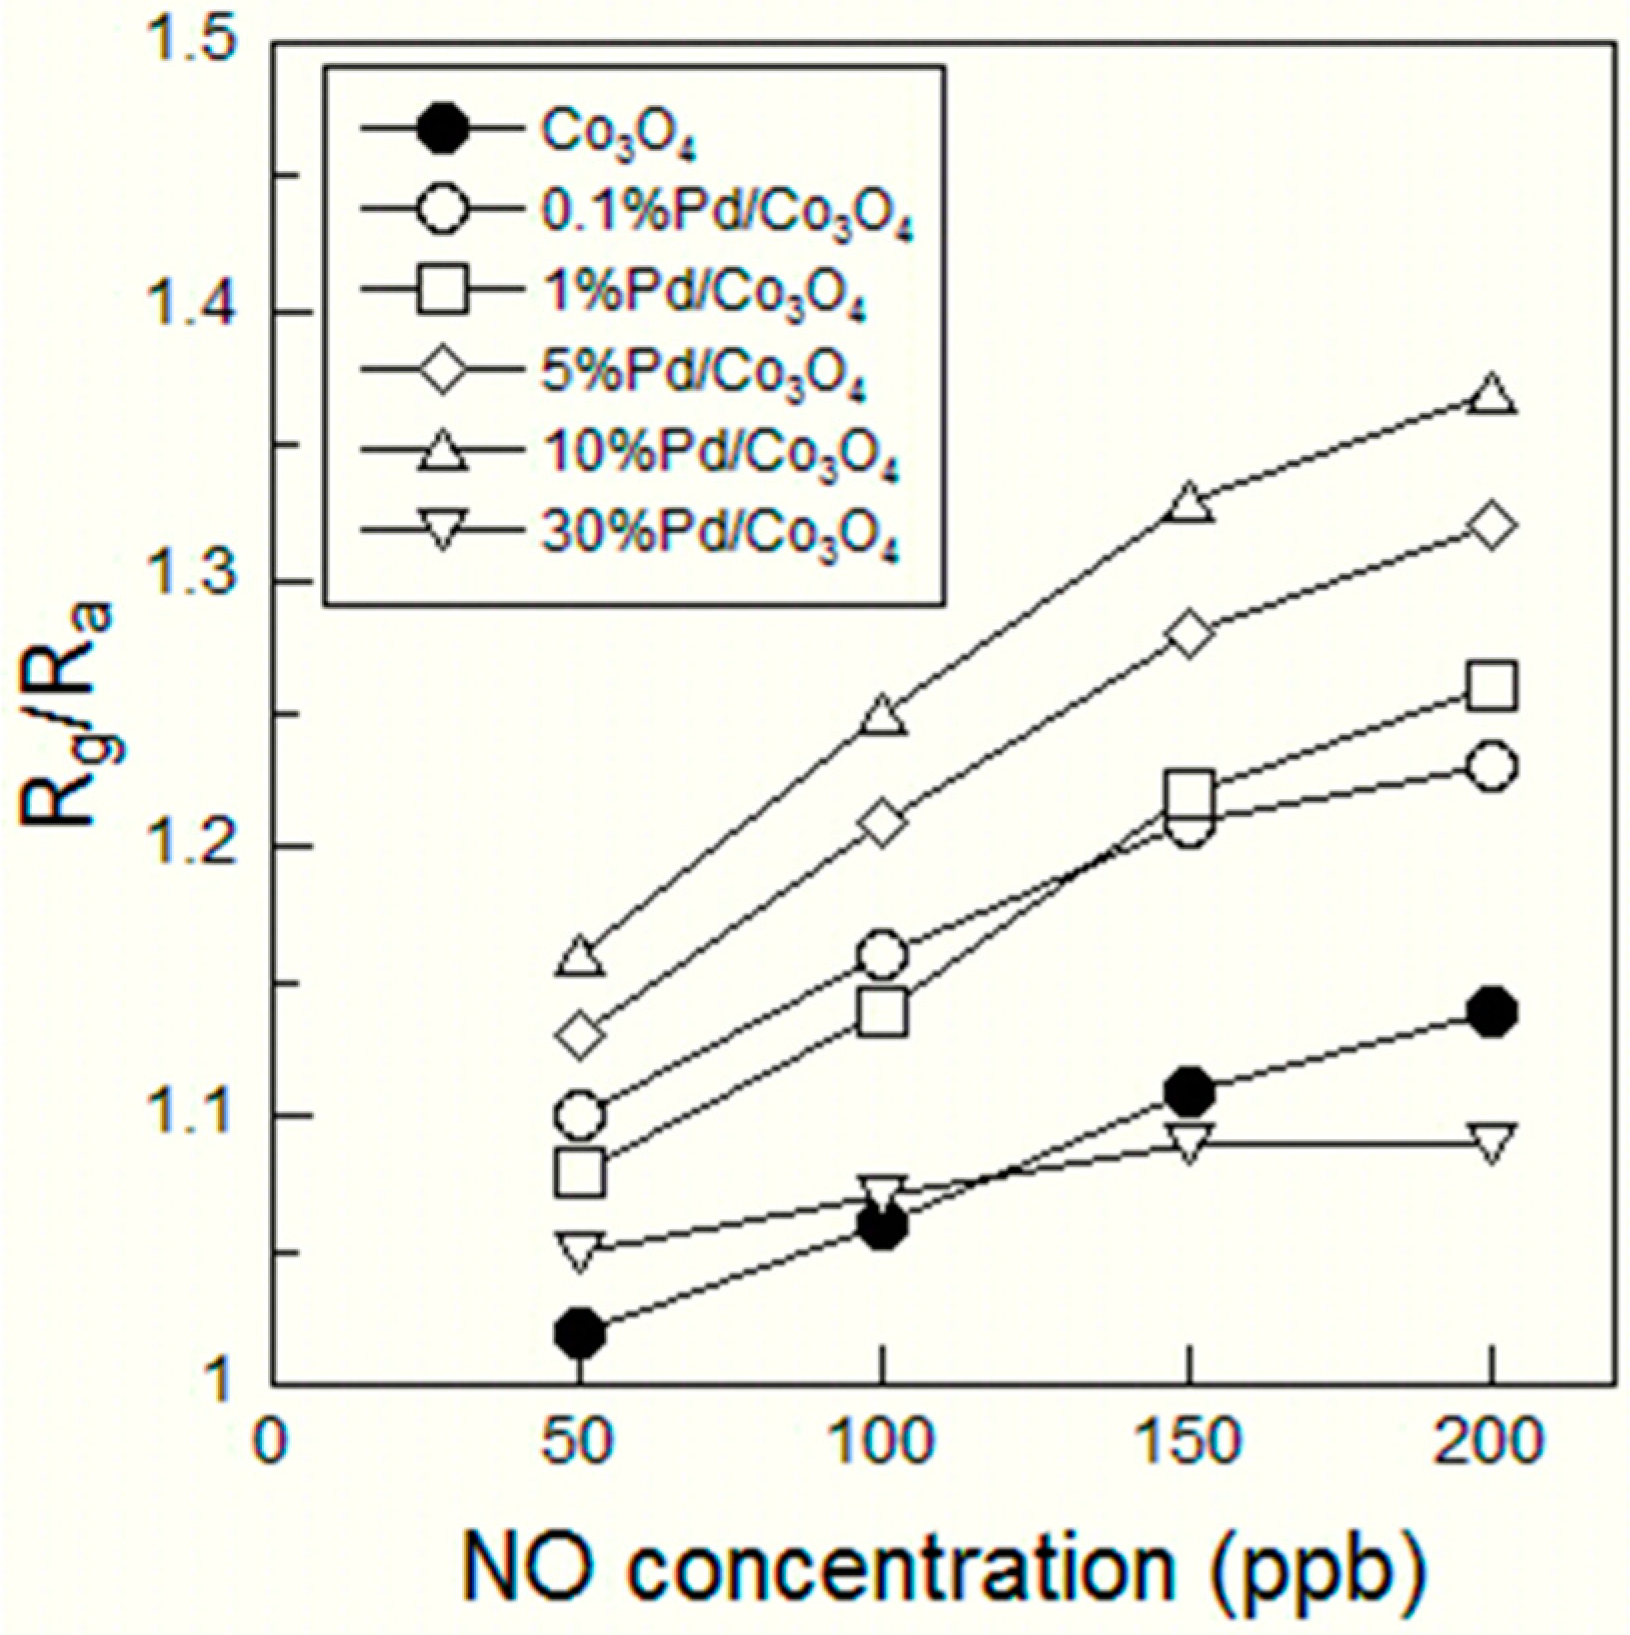
Figure 2f was slightly noisy, which might be due to the 30 wt% Pd content. The sensor responses
S(=
Rg/
Ra) were plotted with respect to the NO concentration of 50–200 ppb (see
Figure 3). All sensor responses linearly increased with the NO gas concentration. The sensor responses increased with the Pd content up to 10 wt% but became low in the 30 wt% Pd content. Since the XRD pattern of the 30%Pd/Co
3O
4 showed large PdO crystallite size, the large PdO interfered with the adsorption of the NO onto the Co
3O
4, resulting in the decrease of the sensor response. The high sensor responses
S = 1.16 at 50 ppb NO was obtained for the optimum composition 10%Pd/Co
3O
4.
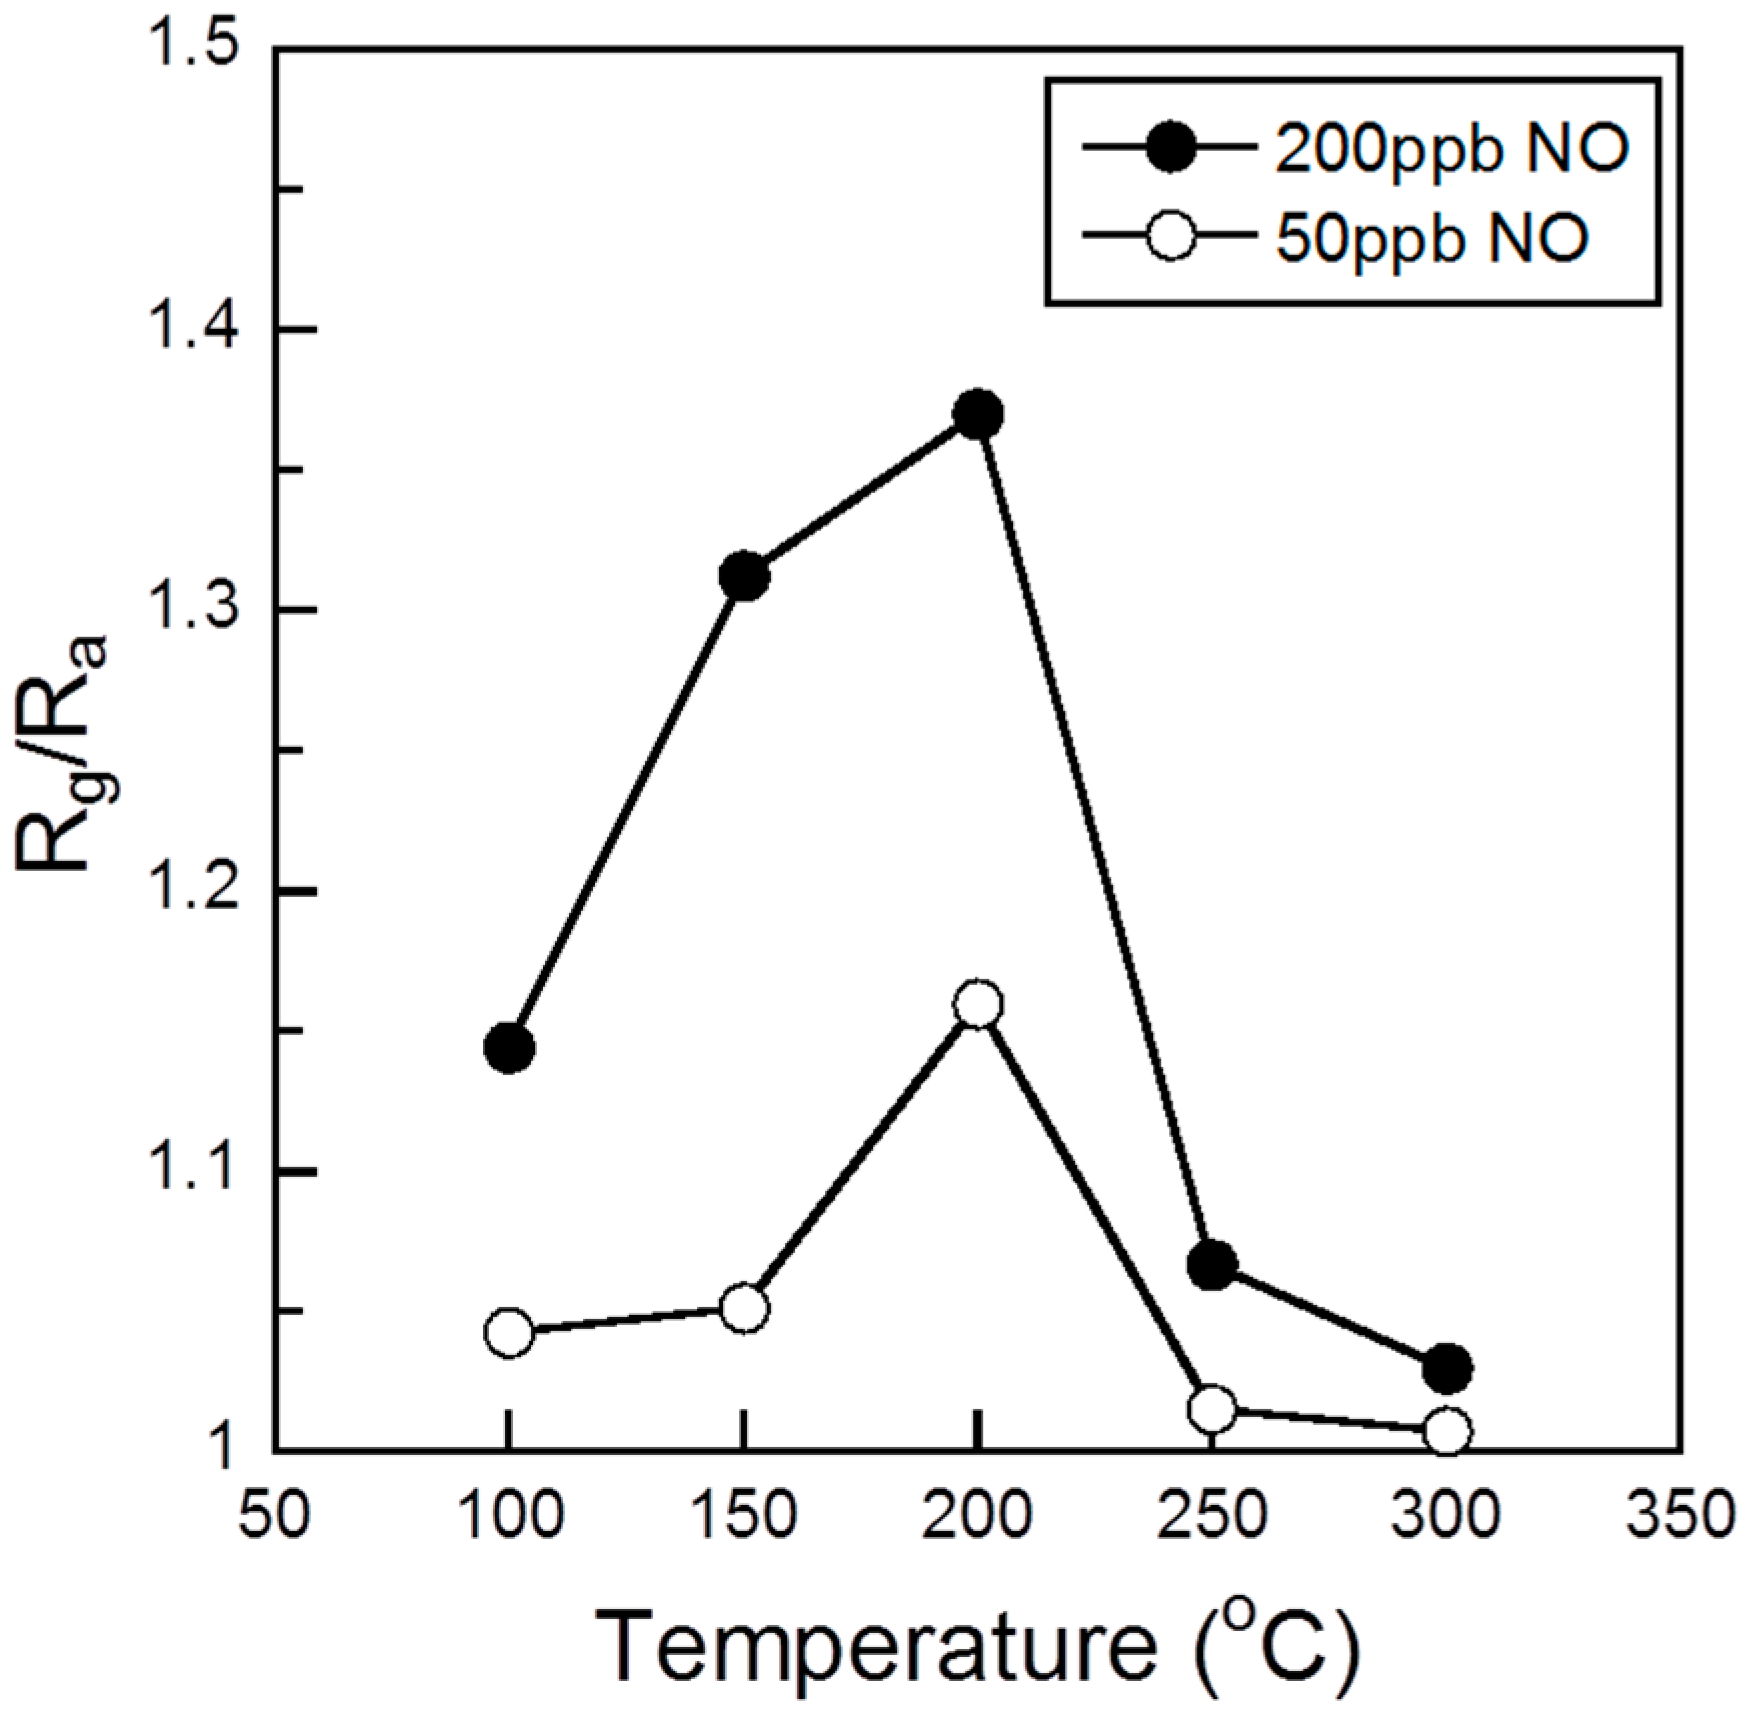
Figure 4 shows the sensor responses to 50 and 200 ppb NO of the sensor element using the 10%Pd/Co
3O
4 powder as a function of the operating temperature in the range from 100 to 300 °C. The NO sensor response of the 10%Pd/Co
3O
4 sensor was the highest at 200 °C.
Figure 2.
Responses of the sensor element using (a) Co3O4; (b) 0.1%Pd/Co3O4; (c) 1%Pd/Co3O4; (d) 5%Pd/Co3O4; (e) 10%Pd/Co3O4; and (f) 30%Pd/Co3O4 powder during exposure to NO (50, 100, 150, and 200 ppb) in air at 200 °C.
Figure 2.
Responses of the sensor element using (a) Co3O4; (b) 0.1%Pd/Co3O4; (c) 1%Pd/Co3O4; (d) 5%Pd/Co3O4; (e) 10%Pd/Co3O4; and (f) 30%Pd/Co3O4 powder during exposure to NO (50, 100, 150, and 200 ppb) in air at 200 °C.
Figure 3.
Sensor responses of the sensor element using Co3O4, 0.1%Pd/Co3O4, 1%Pd/Co3O4, 5%Pd/Co3O4, 10%Pd/Co3O4, and 30%Pd/Co3O4 powders as a function of the NO gas concentration.
Figure 3.
Sensor responses of the sensor element using Co3O4, 0.1%Pd/Co3O4, 1%Pd/Co3O4, 5%Pd/Co3O4, 10%Pd/Co3O4, and 30%Pd/Co3O4 powders as a function of the NO gas concentration.
Figure 4.
Sensor responses of the sensor element using a 10%Pd/Co3O4 powder to 50 and 200 ppb NO as a function of the operating temperature.
Figure 4.
Sensor responses of the sensor element using a 10%Pd/Co3O4 powder to 50 and 200 ppb NO as a function of the operating temperature.
Table 1 shows the sensing properties of the Co
3O
4 and Pd/Co
3O
4 sensor elements upon exposure to 50 ppb NO in air at 200 °C. The 90% response time, defined as the time needed to reach 90% of the final steady value of
Rg toward 50 ppb NO exposure, and the 90% recovery time, defined as the time needed to reach 90% of
Ra, for the Co
3O
4 sensor element, were 12.7 and 13.5 min, respectively. On the other hand, the 90% response time and 90% recovery time for the Pd/Co
3O
4 sensor elements were approximately 5 min shorter than those for the Co
3O
4 sensor element. This result suggests that the loaded PdO provided some kinds of surface modification effects with Co
3O
4. Thus, the average resistance μ increased with the Pd content in the films due to this modification effects. Although μ increased due to the Pd loading, all sensor resistances, which were less than 600 Ω, were lower than the resistances of the sensor using WO
3 and SnO
2 in our earlier works [
13,
17].
Table 1.
Sensing properties of the Co3O4 and Pd/Co3O4 sensor elements upon exposure to 50 ppb NO in air. The operating temperature was 200 °C, and the gas flow rate was 200 mL/min.
Table 1.
Sensing properties of the Co3O4 and Pd/Co3O4 sensor elements upon exposure to 50 ppb NO in air. The operating temperature was 200 °C, and the gas flow rate was 200 mL/min.
| Sample | 90% Response Time (min) | 90% Recovery Time (min) | Ra | Rg (Ω) | S (Rg/Ra) | S/N Ratio |
|---|
| μ (Ω) | σ (Ω) | CV (%) |
|---|
| Co3O4 | 12.7 | 13.5 | 52.4 | 0.005 | 0.010 | 53.6 | 1.02 | 224 |
| 0.1%Pd/Co3O4 | 8.5 | 8.6 | 58.5 | 0.018 | 0.031 | 64.1 | 1.10 | 307 |
| 1%Pd/Co3O4 | 9.3 | 9.8 | 58.2 | 0.007 | 0.011 | 62.8 | 1.08 | 695 |
| 5%Pd/Co3O4 | 9.8 | 10.3 | 121.1 | 0.057 | 0.047 | 137.0 | 1.13 | 278 |
| 10%Pd/Co3O4 | 7.6 | 8.0 | 233.0 | 0.041 | 0.017 | 269.3 | 1.16 | 891 |
| 30%Pd/Co3O4 | 4.7 | 7.7 | 478.5 | 1.147 | 0.240 | 502.2 | 1.05 | 21 |
The
Ra standard deviation σ and the
CV value increased with the Pd content. The
S/N ratio of the Co
3O
4 toward 50 ppb NO exposure was 64 and was lower than that of the Pd/Co
3O
4 with 0.1 wt%–10 wt% Pd content. The
S/N ratio of the 30%Pd/Co
3O
4 was lower than that of the Co
3O
4 because of the noisy background resistance signal. The
S/N ratio of the 5%Pd/Co
3O
4 was lower than that of the 1%Pd/Co
3O
4 or 10%Pd/Co
3O
4 owing to large
CV value. The origin of the discontinuity of the
S/N ratio is unclear at this stage. Further work is necessary to clarify the origin. Following the conventional definition in Kaiser’s work [
19], the limit of detection value was defined as the NO concentration at which a sensor response corresponds to
S/N = 3. Thus, the sensor element with a large
S/N ratio can detect a low concentration of NO with high reliability. The limit of detection value (
S/
N = 3) of the 10%Pd/Co
3O
4 sensor was estimated to be 0.66 ppb considering
S/
N = 227 at 50 ppm NO, which was lower than that of the 12 ppb value reported in the literature [
14]. The suitable Pd content of the sensing material Pd/Co
3O
4 was considered to be 10 wt% from the sensor response and
S/N ratio.
To examine the reason why the sensor using the 10%Pd/Co
3O
4 powder had good sensor properties, TEM observations of the Co
3O
4, 10%Pd/Co
3O
4, and 30%Pd/Co
3O
4 powders were carried out.
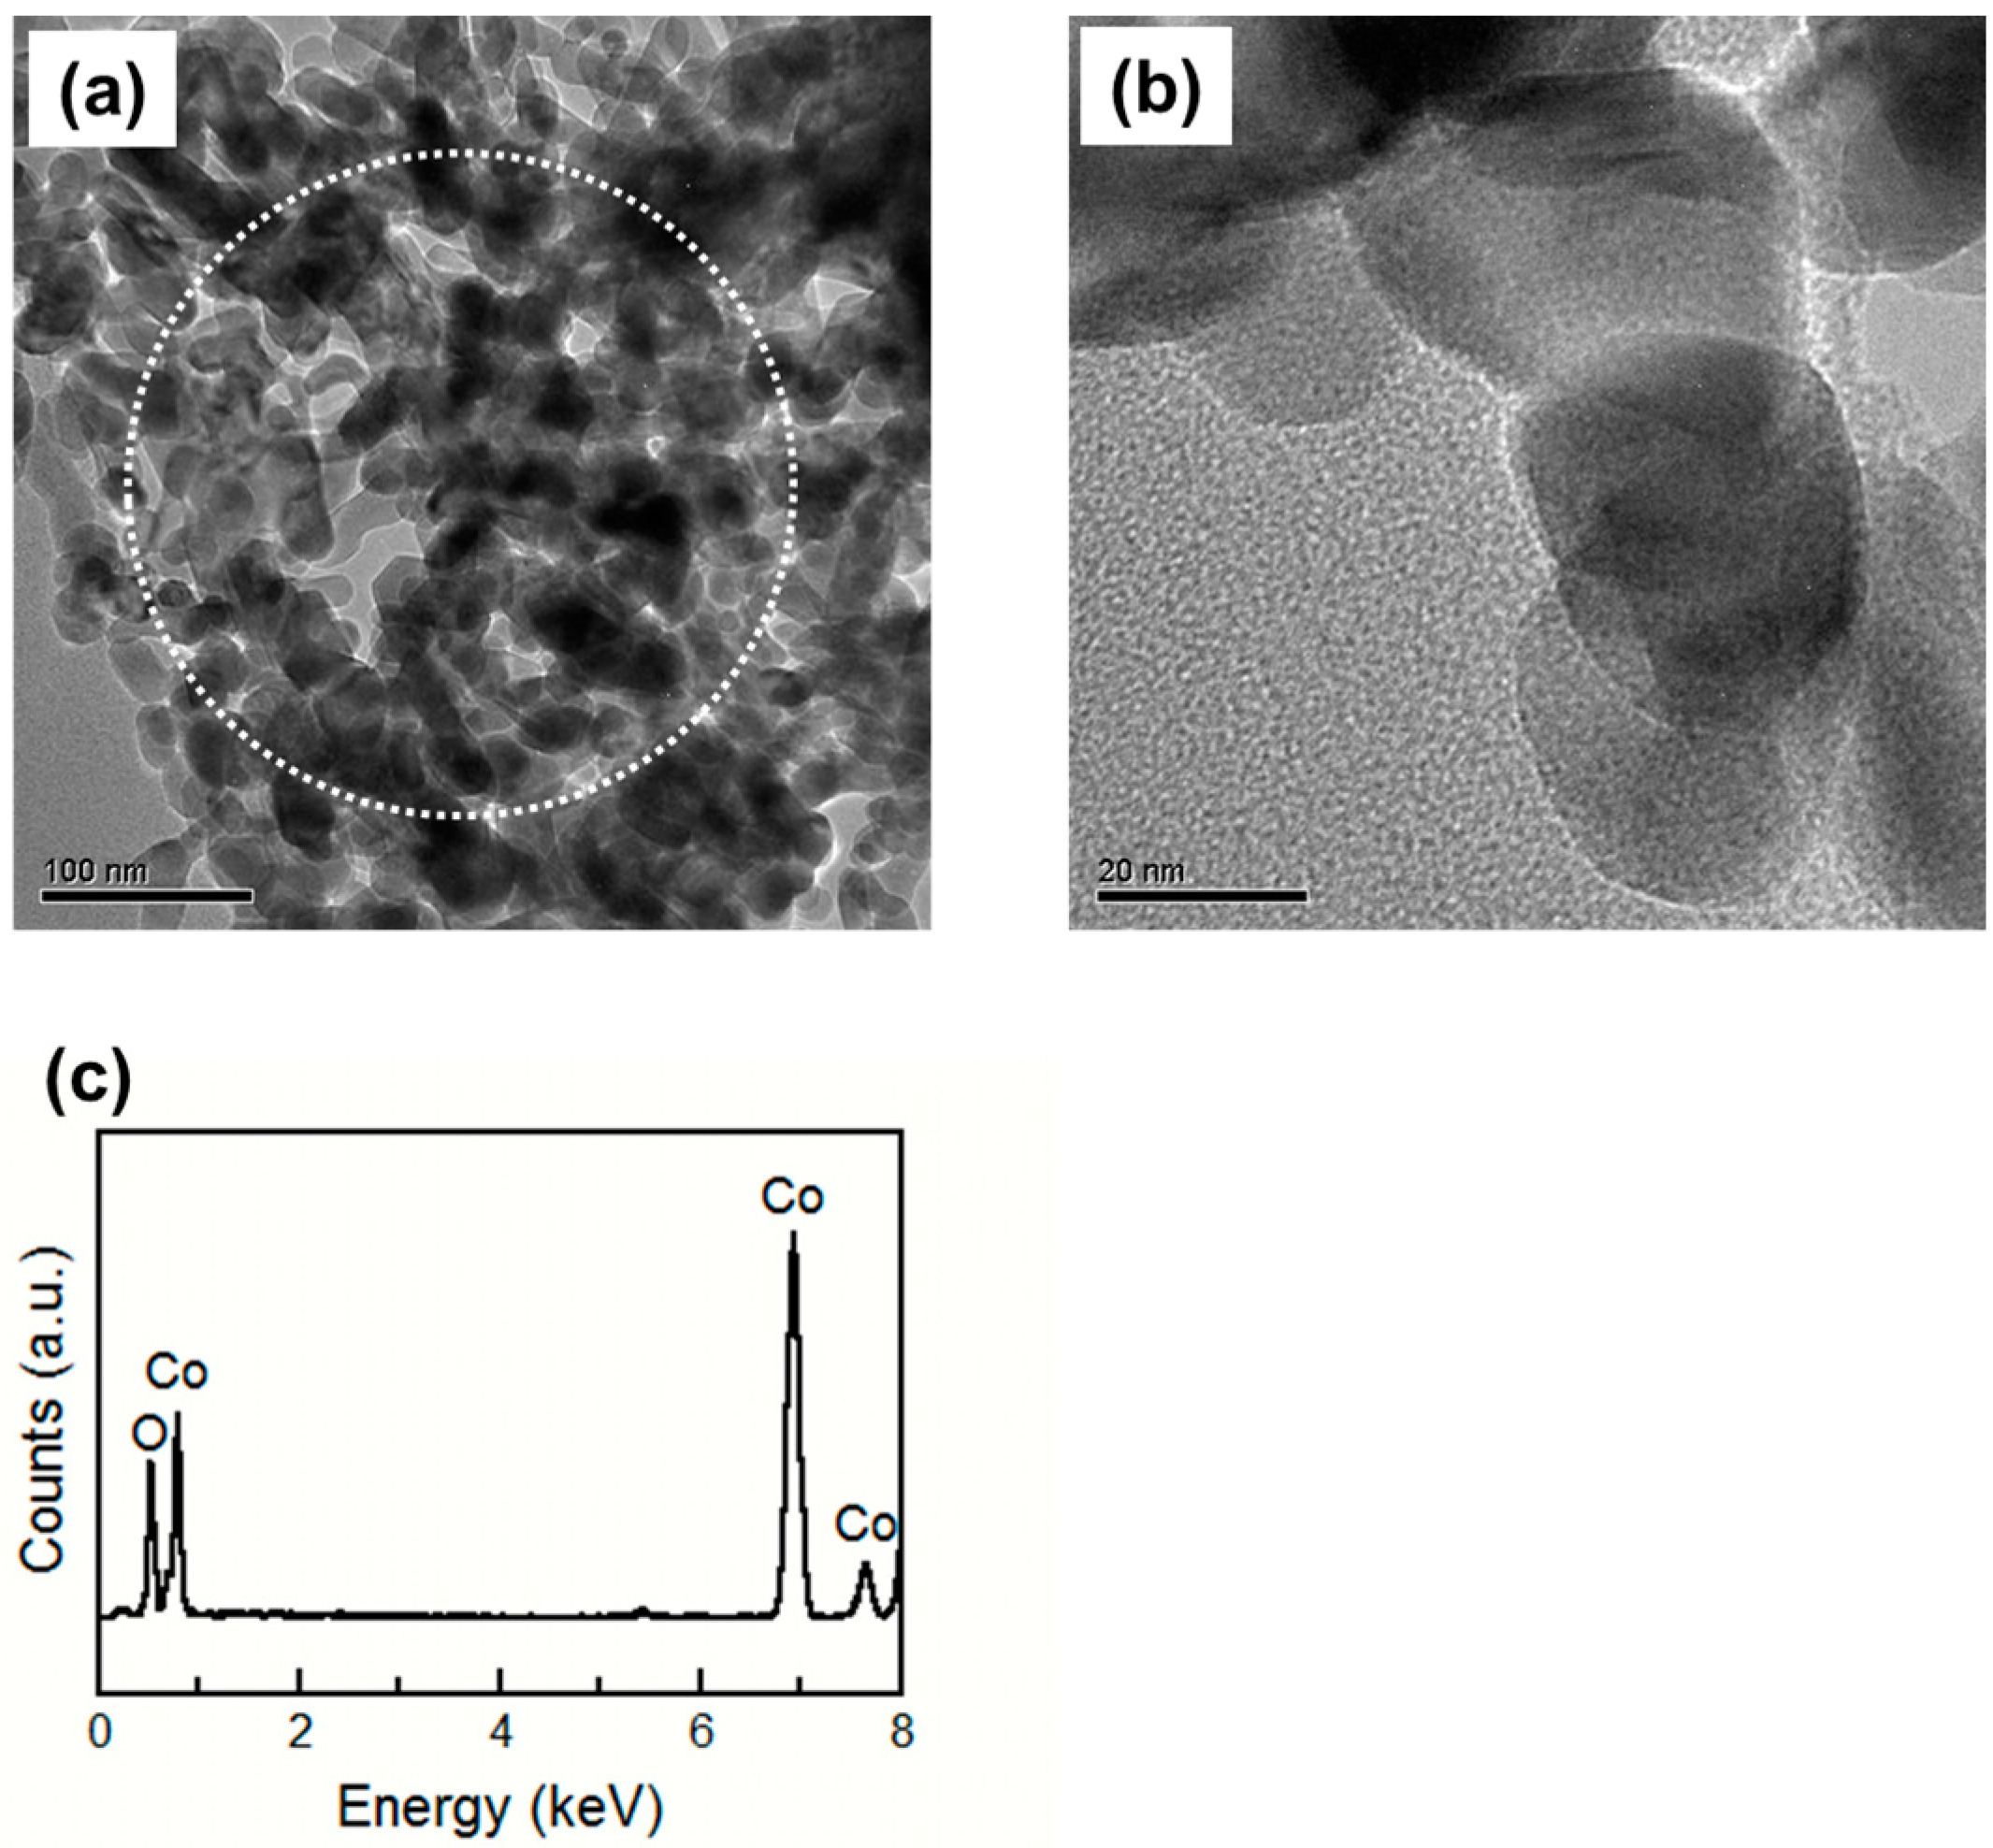
Figure 5 shows the TEM images and EDX spectrum of the Co
3O
4 powder after baking at 400 °C for 2 h. Pale phases were observed, and the grain size of the Co
3O
4 powder was approximately 20 nm. EDX spot analysis was carried out at the area inside the circle in
Figure 5a. The EDX spectrum showed that the Co
3O
4 powder has no impurities such as noble metals.
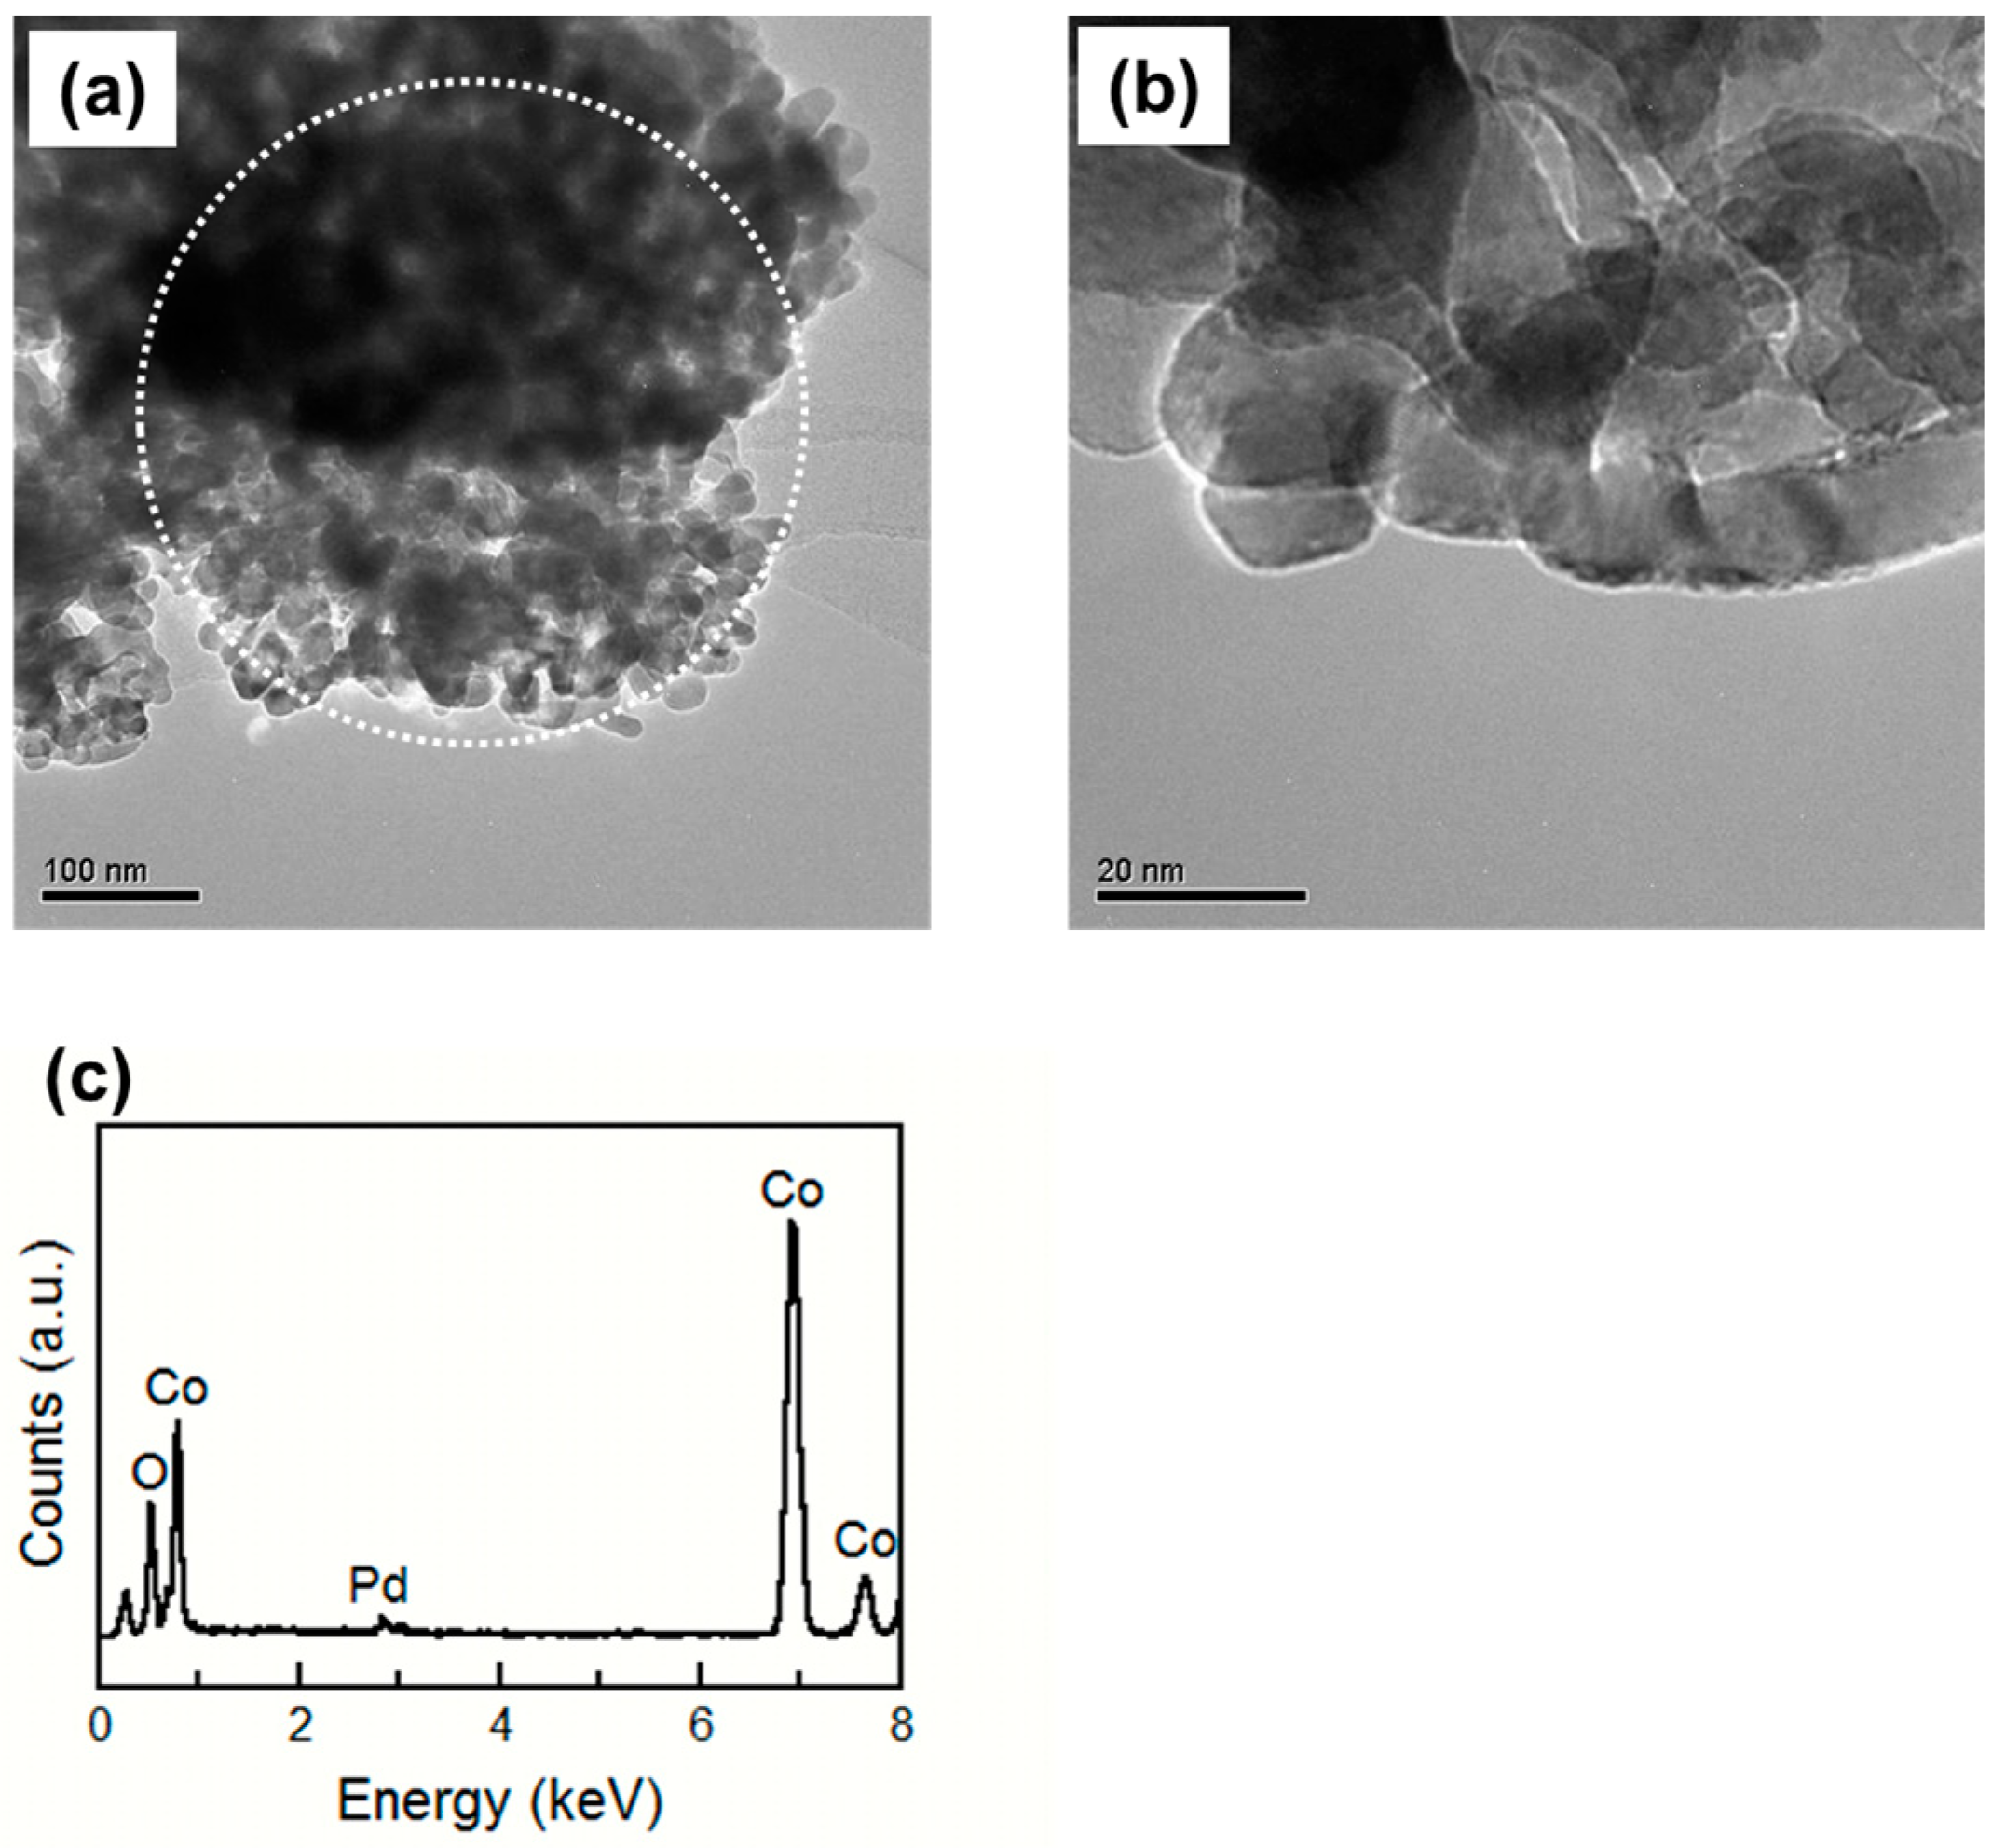
Figure 6 shows the TEM images and EDX spectrum of the 10%Pd/Co
3O
4 powder after baking at 400 °C for 2 h. Although no difference was observed in the TEM images between the Co
3O
4 and 10%Pd/Co
3O
4 powder, Pd peak was confirmed in the EDX spectrum of the 10%Pd/Co
3O
4 powder. Matsushima
et al. reported 0.3–5 wt% Pd-loaded SnO
2 powder baked at 300 °C in air, and the Pd particles on the SnO
2 surface became less visible in the TEM image [
20], which was considered to be due to the existence of Pd on the SnO
2 surface as PdO with a lower contrast to SnO
2. Pd in the 10%Pd/Co
3O
4 powder existed as PdO and was not distinguishable from the TEM image.
Figure 5.
(a,b) TEM images of the Co3O4 powder; (c) EDX analysis result of the area inside the circle in the (a) image. The powder is baked at 400 °C for 2 h.
Figure 5.
(a,b) TEM images of the Co3O4 powder; (c) EDX analysis result of the area inside the circle in the (a) image. The powder is baked at 400 °C for 2 h.
Figure 6.
(a,b) TEM images of the 10%Pd/Co3O4 powder; (c) EDX analysis result of the area inside the circle in the (a) image. The powder is baked at 400 °C for 2 h.
Figure 6.
(a,b) TEM images of the 10%Pd/Co3O4 powder; (c) EDX analysis result of the area inside the circle in the (a) image. The powder is baked at 400 °C for 2 h.
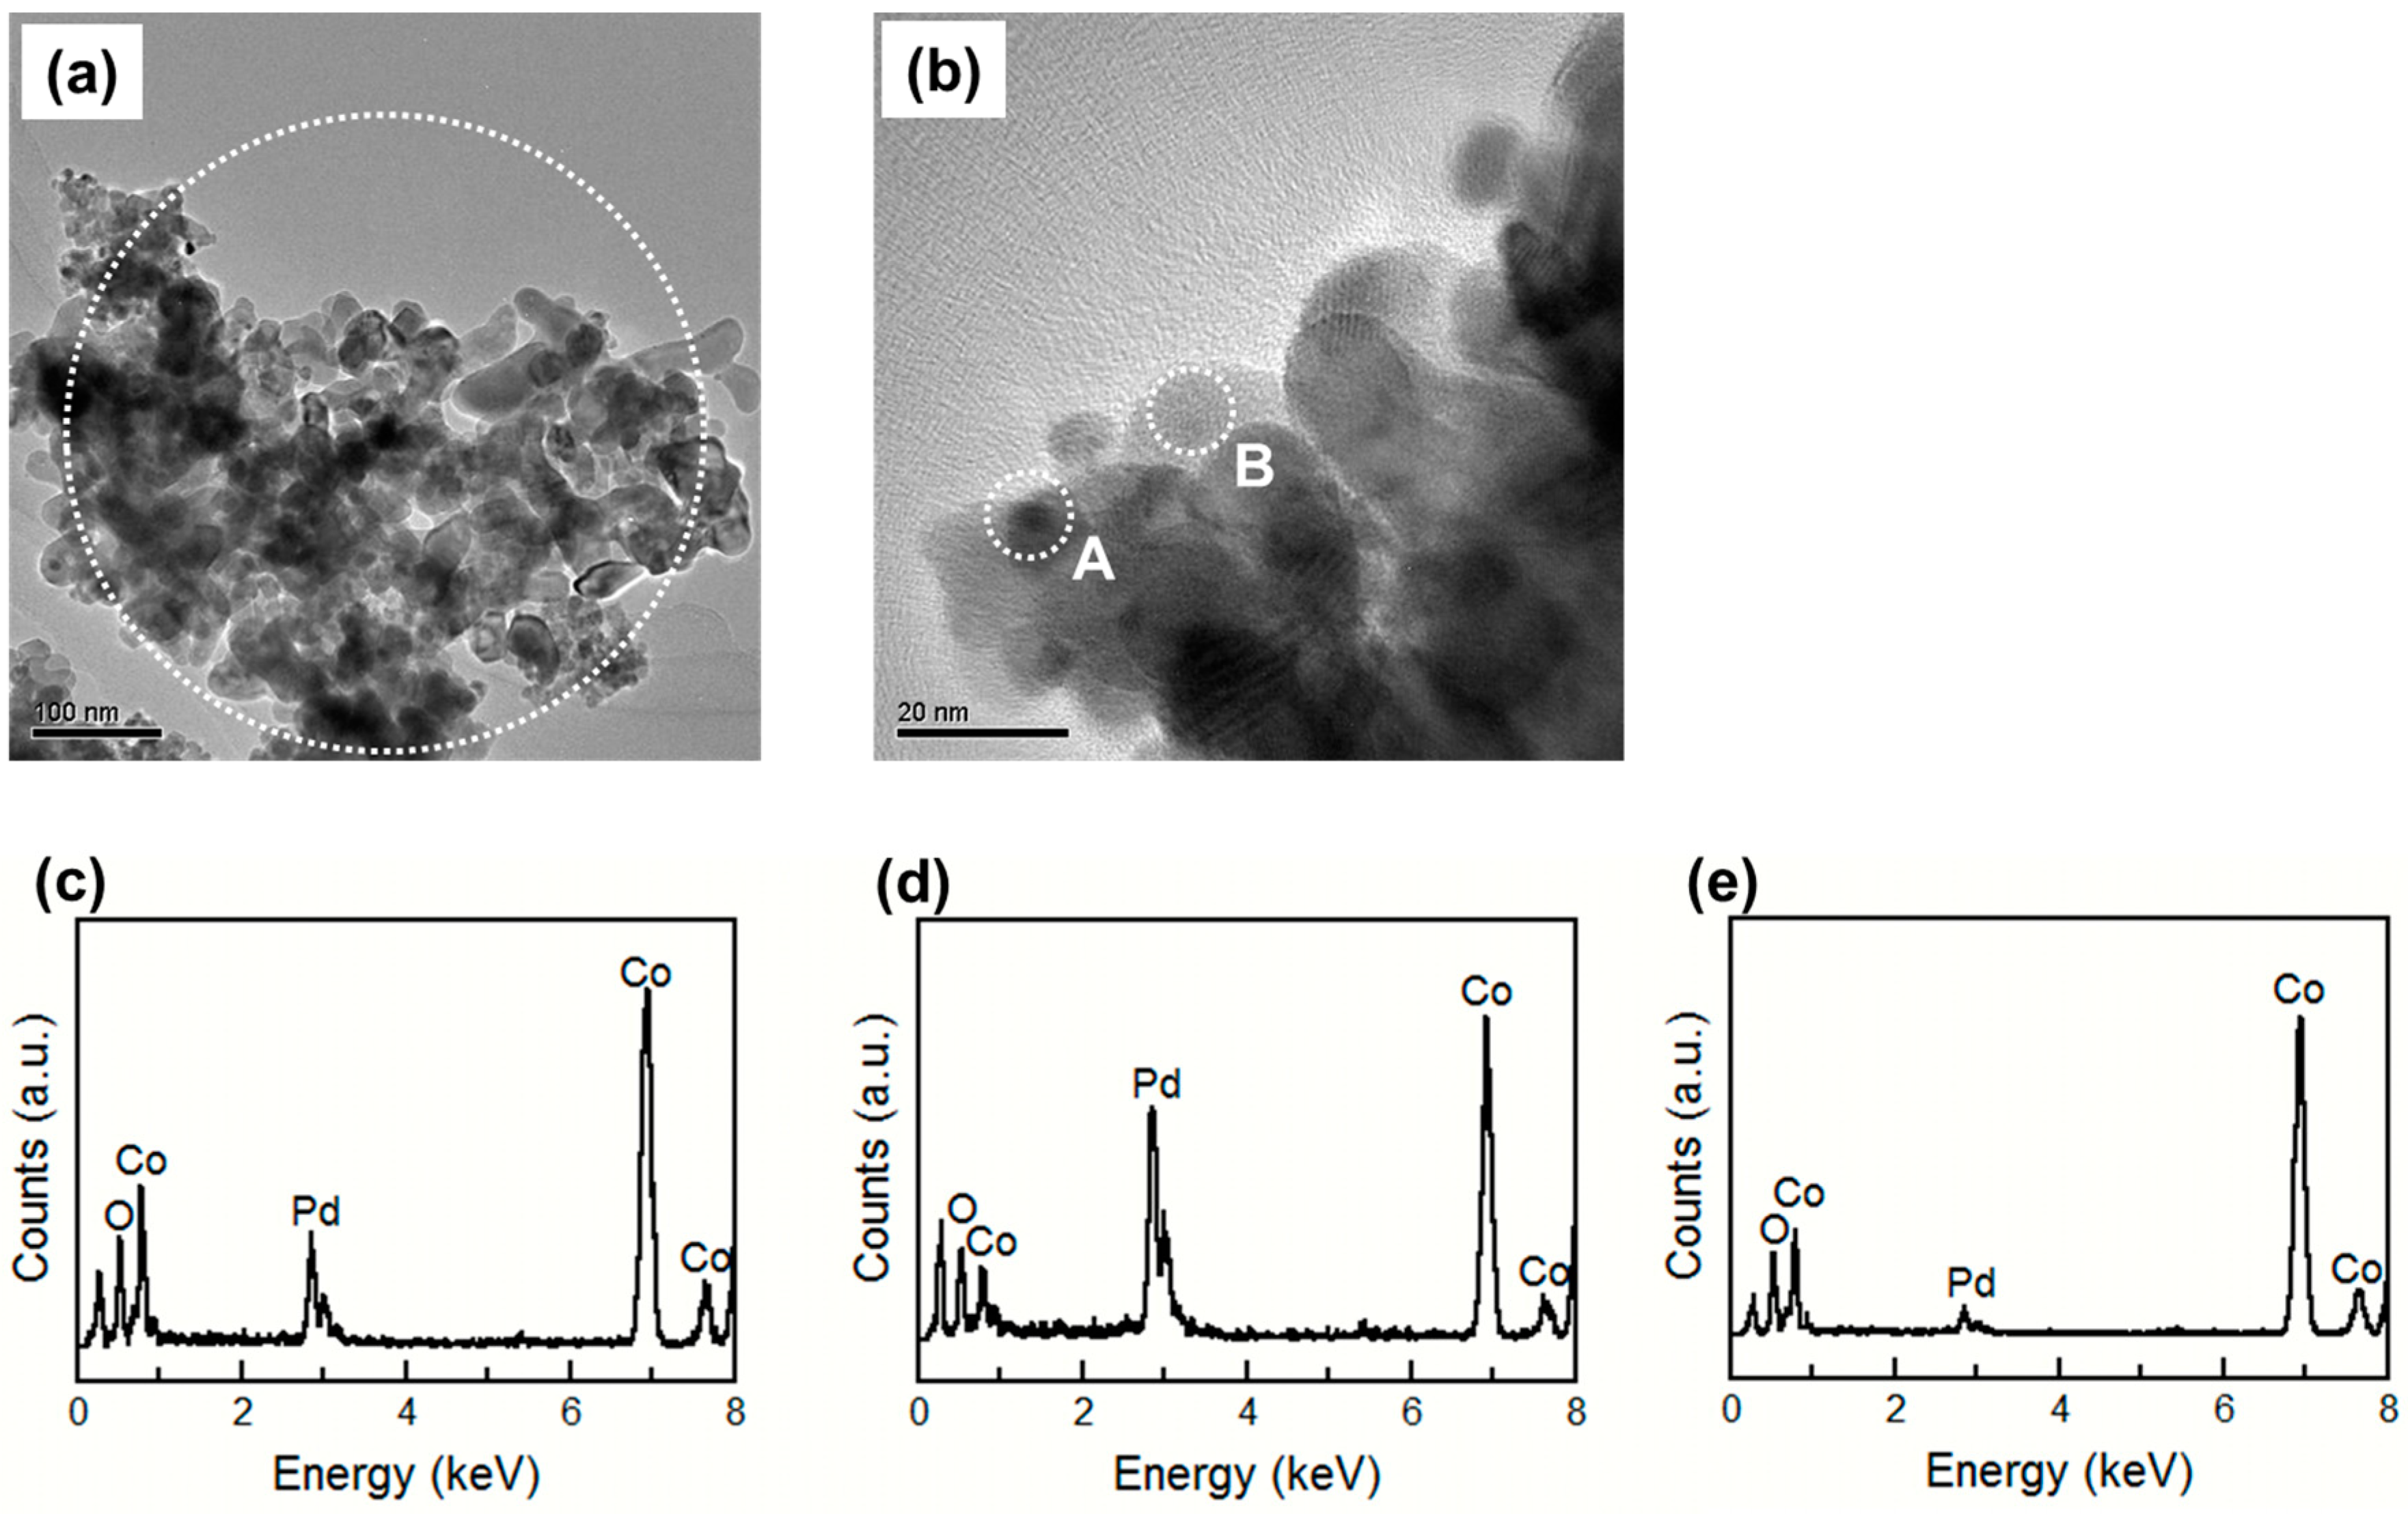
Figure 7 shows the TEM images and EDX spectra of the 30%Pd/Co
3O
4 powder after baking at 400 °C for 2 h.
Figure 7a shows that although no difference was observed among the TEM images with low magnification of the Co
3O
4, 10%Pd/Co
3O
4, and 30%Pd/Co
3O
4 powder, the intensity of the Pd peak in the EDX spectrum increased with the Pd content.
Figure 7b shows small dark phases with 5-nm diameter, such as the area inside circle A, and pale phases, such as the area inside circle B.
Figure 7d,e shows the EDX spectra of the area inside circles A and B in
Figure 7b, respectively. The intensity of the Pd peak in
Figure 7c was much lower than that in
Figure 7d and higher than that in
Figure 7e. This result showed that the aggregation of the PdO particles was formed at the area inside circle A, and the 30%Pd/Co
3O
4 powder had poor dispersibility of the PdO particles. Because of the aggregation and poor dispersibility of the PdO particles, the sensor element using 30%Pd/Co
3O
4 was considered to show a lower sensor response and
S/N ratio than the others. No difference was shown between the Co
3O
4 crystallite size determined from the Scherrer equation and Co
3O
4 particle size obtained by TEM image. However, the size of the PdO aggregation in
Figure 7b was smaller than the PdO crystallite size determined from XRD. Because the PdO in the 30%Pd/Co
3O
4 powder had a lower contrast to Co
3O
4, the PdO aggregation size obtained from the TEM image was smaller than that determined by XRD.
Figure 7.
(a,b) TEM images of the 30%Pd/Co3O4 powder; (c) EDX analysis result of the area inside the circle in the (a) image; (d) EDX analysis result of the area inside circle A; (e) EDX analysis result of the area inside circle B. The powder is baked at 400 °C for 2 h.
Figure 7.
(a,b) TEM images of the 30%Pd/Co3O4 powder; (c) EDX analysis result of the area inside the circle in the (a) image; (d) EDX analysis result of the area inside circle A; (e) EDX analysis result of the area inside circle B. The powder is baked at 400 °C for 2 h.
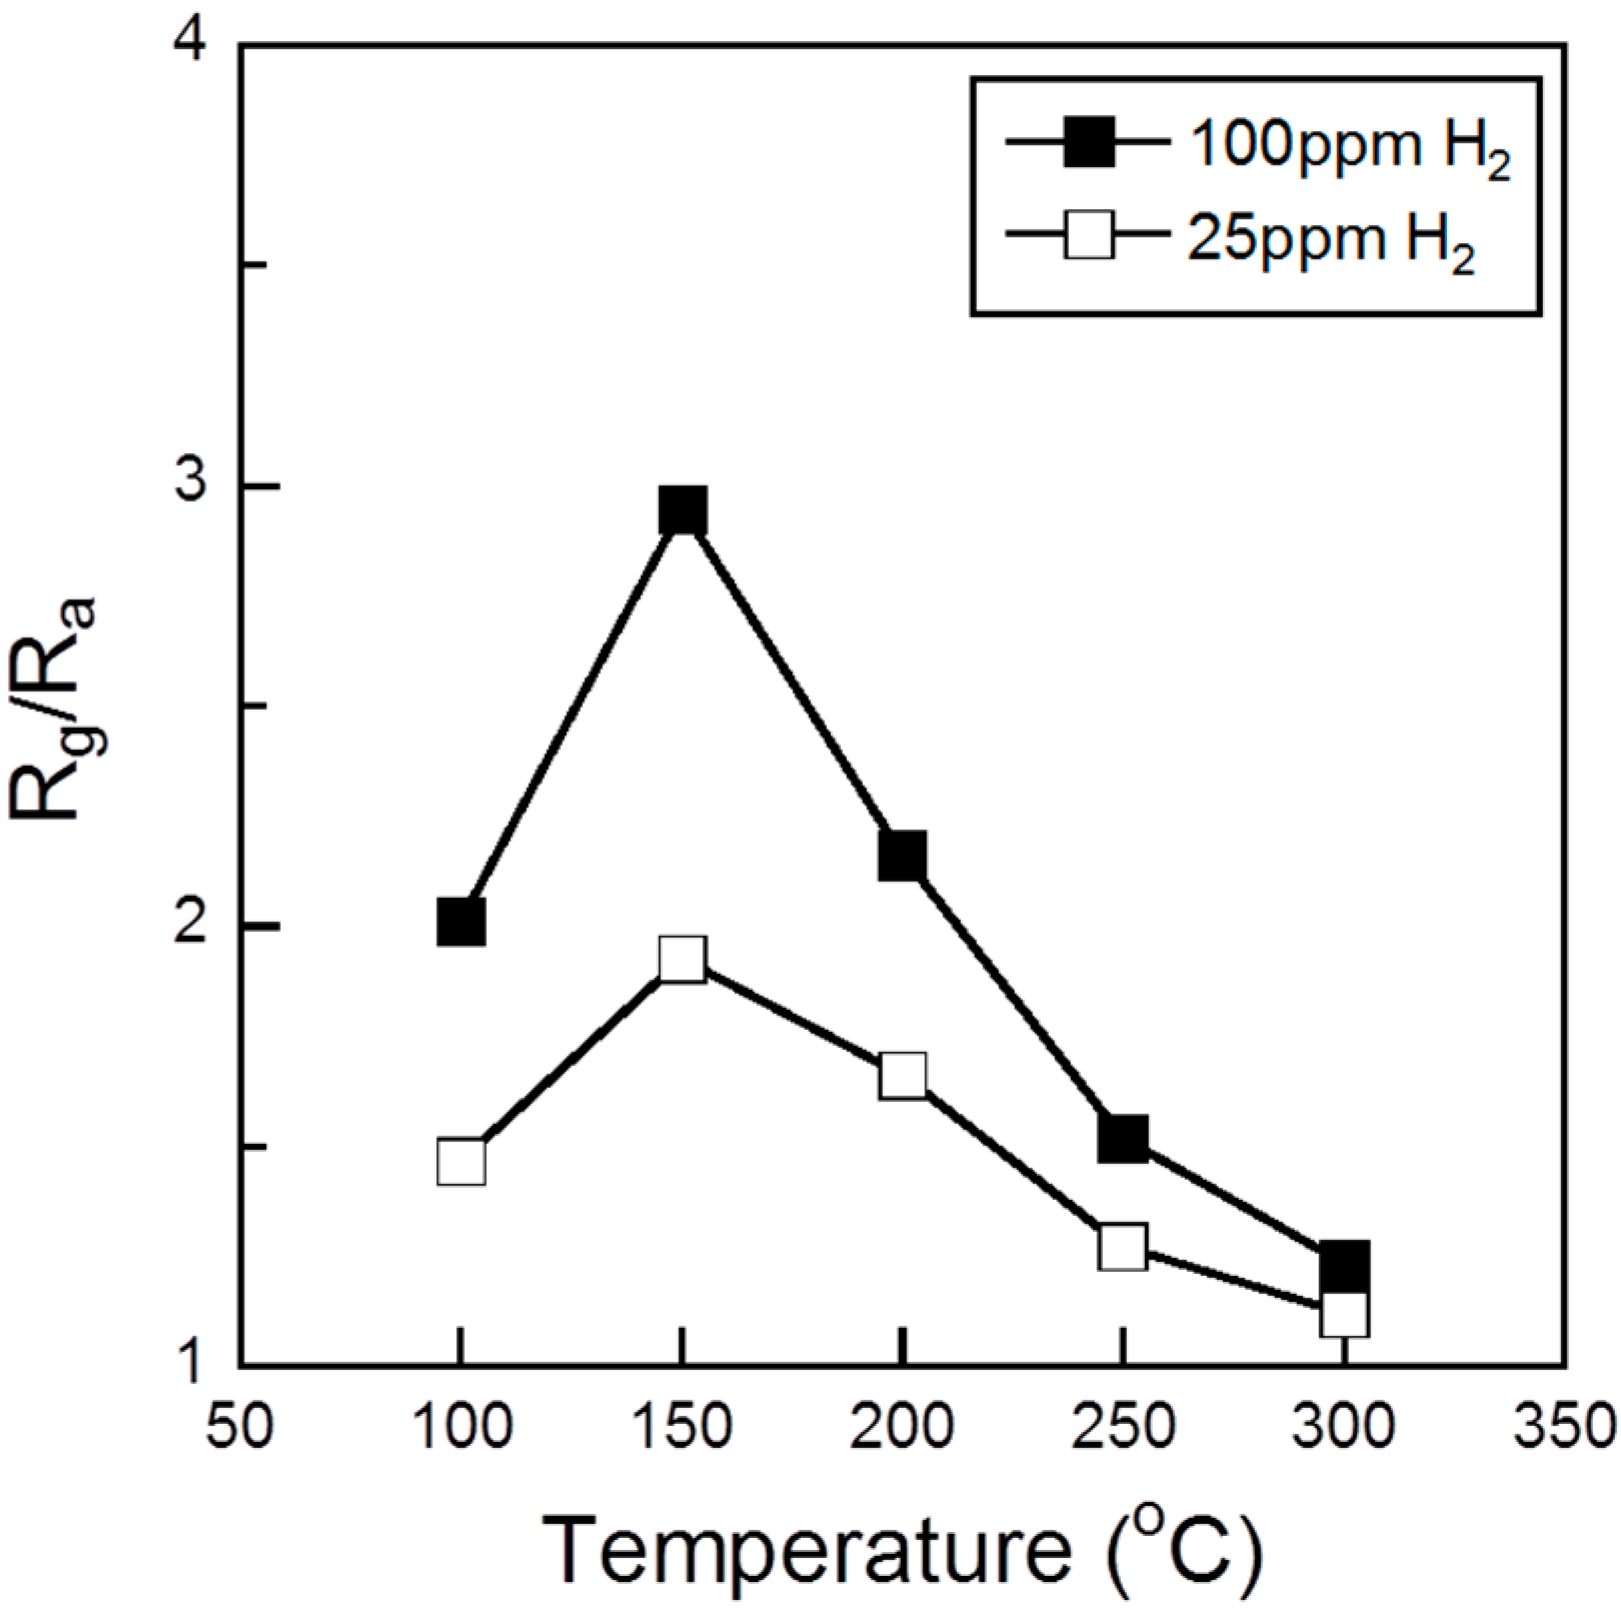
Figure 8 shows the sensing responses of the sensor element using 10%Pd/Co
3O
4 powder toward 25 and 100 ppm H
2 as a function of the operating temperature. When the 10%Pd/Co
3O
4 sensor was exposed to H
2 gas, which is a typical reducing gas, the resistance of the sensor increased. The high sensor responses (
S = 1.9 at 25 ppm H
2 and
S = 3.0 at 100 ppm H
2) were obtained at 150 °C. This result showed that the 10%Pd/Co
3O
4 sensor is not immune to the interference of human breath level H
2 gas. In addition, the sensor can possibly respond to other inflammable gases and VOCs because semiconductor sensors are sensitive. Therefore, the Pd-loaded Co
3O
4 sensor needs to have a gas separation membrane and a filter to remove interference such as H
2, CH
4, CO, and H
2O.
Figure 8.
Sensing responses of the sensor element using 10%Pd/Co3O4 powder to 25 and 100 ppm H2 as a function of the operating temperature.
Figure 8.
Sensing responses of the sensor element using 10%Pd/Co3O4 powder to 25 and 100 ppm H2 as a function of the operating temperature.
The Pd/Co3O4 sensor elements showed a good response to 50 ppb of NO in air. Further investigation for improvement of the sensor response is required to detect the sub-ppb levels of NO with sufficient accuracy. To enhance the sensor response, sensor properties using Co3O4 powder with noble metals such as Pt, Au, and Ag, will be investigated in the future.


