Closed-Form Algorithm for 3-D Near-Field OFDM Signal Localization under Uniform Circular Array


College of Electronic Science, National University of Defense Technology, Changsha 410073, China
*
Author to whom correspondence should be addressed.
Sensors 2018, 18(1), 226; https://0-doi-org.brum.beds.ac.uk/10.3390/s18010226
Submission received: 5 December 2017
/
Revised: 4 January 2018
/
Accepted: 12 January 2018
/
Published: 14 January 2018
(This article belongs to the Special Issue Sensors and Sensing in Indoor Localization, Tracking, Navigation and Activity Monitoring)
Abstract
:Due to its widespread application in communications, radar, etc., the orthogonal frequency division multiplexing (OFDM) signal has become increasingly urgent in the field of localization. Under uniform circular array (UCA) and near-field conditions, this paper presents a closed-form algorithm based on phase difference for estimating the three-dimensional (3-D) location (azimuth angle, elevation angle, and range) of the OFDM signal. In the algorithm, considering that it is difficult to distinguish the frequency of the OFDM signal’s subcarriers and the phase-based method is always affected by errors of the frequency estimation, this paper employs sparse representation (SR) to obtain the super-resolution frequencies and the corresponding phases of subcarriers. Further, as the phase differences of the adjacent sensors including azimuth angle, elevation angle and range parameters can be expressed as indefinite equations, the near-field OFDM signal’s 3-D location is obtained by employing the least square method, where the phase differences are based on the average of the estimated subcarriers. Finally, the performance of the proposed algorithm is demonstrated by several simulations.
1. Introduction
The orthogonal frequency division multiplexing (OFDM) signal has superior performance due to the practical applications in wireless local area networks (WLAN), 4G mobile communications, digital audio broadcasting (DAB) systems, radar, etc., which have received considerable attention in the field of source localization [1,2,3]. Uniform circular array (UCA) is an attractive geometry and is preferable over uniform linear array (ULA) because of its 360° azimuth coverage, additional elevation angle information and almost identical beamwidth in the context of three-dimensional (3-D) parameter estimation [4,5,6,7,8,9,10].
For the problem of near-field source localization, an improved 3-D Multiple Single Classification (MUSIC) method [7] was proposed to estimate the 3-D location. While the 3-D MUSIC method for a joint estimation of the azimuth, elevation angle, and range can cope with multiple sources, it requires an expensive 3-D search procedure. Based on the phase of the adjacent sensors’ correlation function, Jung et al. [8] presented a closed-form estimator for the 2-D direction of arrivals (DOAs) and range of a single narrowband source, which is more computationally efficient. In [9], by using a fixed rotary UCA with a center sensor, Chen et al. considered the condition of multiple mono-frequency sources and the ambiguity in the phase-based algorithm, the phase difference before and after rotation is utilized to obtain the 3-D localization and resolve ambiguity. However, it is limited by the specific condition that the frequency spacing should be more than 8 times frequency resolution, which cannot be extended to the localization for the wideband signal.
The aforementioned method has not been focused on the wideband source such as the OFDM signal localization in the near-field condition. Due to the fact that the OFDM signal has several subcarriers and the frequency of the adjacent subcarriers is closed to each other, it is difficult to distinguish the subcarriers in the frequency domain. Notwithstanding, padding zeroes at the tail of the discrete measurements is equal to interpolating in the frequency domain when the Fast Fourier Transformation (FFT) algorithm is performed, which can improve frequency resolution and avoid the phenomenon of spectrum leakage. Yet, it will lead to the deviation of frequency estimation and the inaccuracy of the corresponding phase difference [11]. By turning to the sparse representation (SR) framework, we are able to achieve super-resolution without a large number of time samples, and with lower sensitivity to signal-to-noise ratio (SNR) [12,13,14]. Therefore, the goal of this paper is to explore how to utilize the sparse representation methodology for the subcarriers’ frequency estimation.
Accordingly, under a fixed UCA, this paper presents a closed-form algorithm that extends the scheme in [8] to estimate the 3-D position of the OFDM signal. Herein, considering that the phase-based algorithm seriously suffers from the errors of the frequency and the corresponding phase estimation, we first employ sparse representation (SR) to decouple the subcarriers in the frequency domain and obtain the corresponding super-resolution phases. Moreover, we calculate the phase difference of the adjacent sensors for each subcarrier. Furthermore, as the phase differences including azimuth angle, elevation angle and range parameters can be expressed as indefinite equations, we make full use of subcarriers’ phase differences and employ the normalized phase differences of the subcarriers. Meanwhile, the least square method is utilized to obtain the near-field OFDM signal’s 3-D location. Simulation results are performed to illustrate the effectiveness of the proposed algorithm, which can estimate the super-resolution frequencies of the OFDM signal’s subcarriers and obtain the 3-D location of a near-field OFDM signal accurately.
2. Signal Model
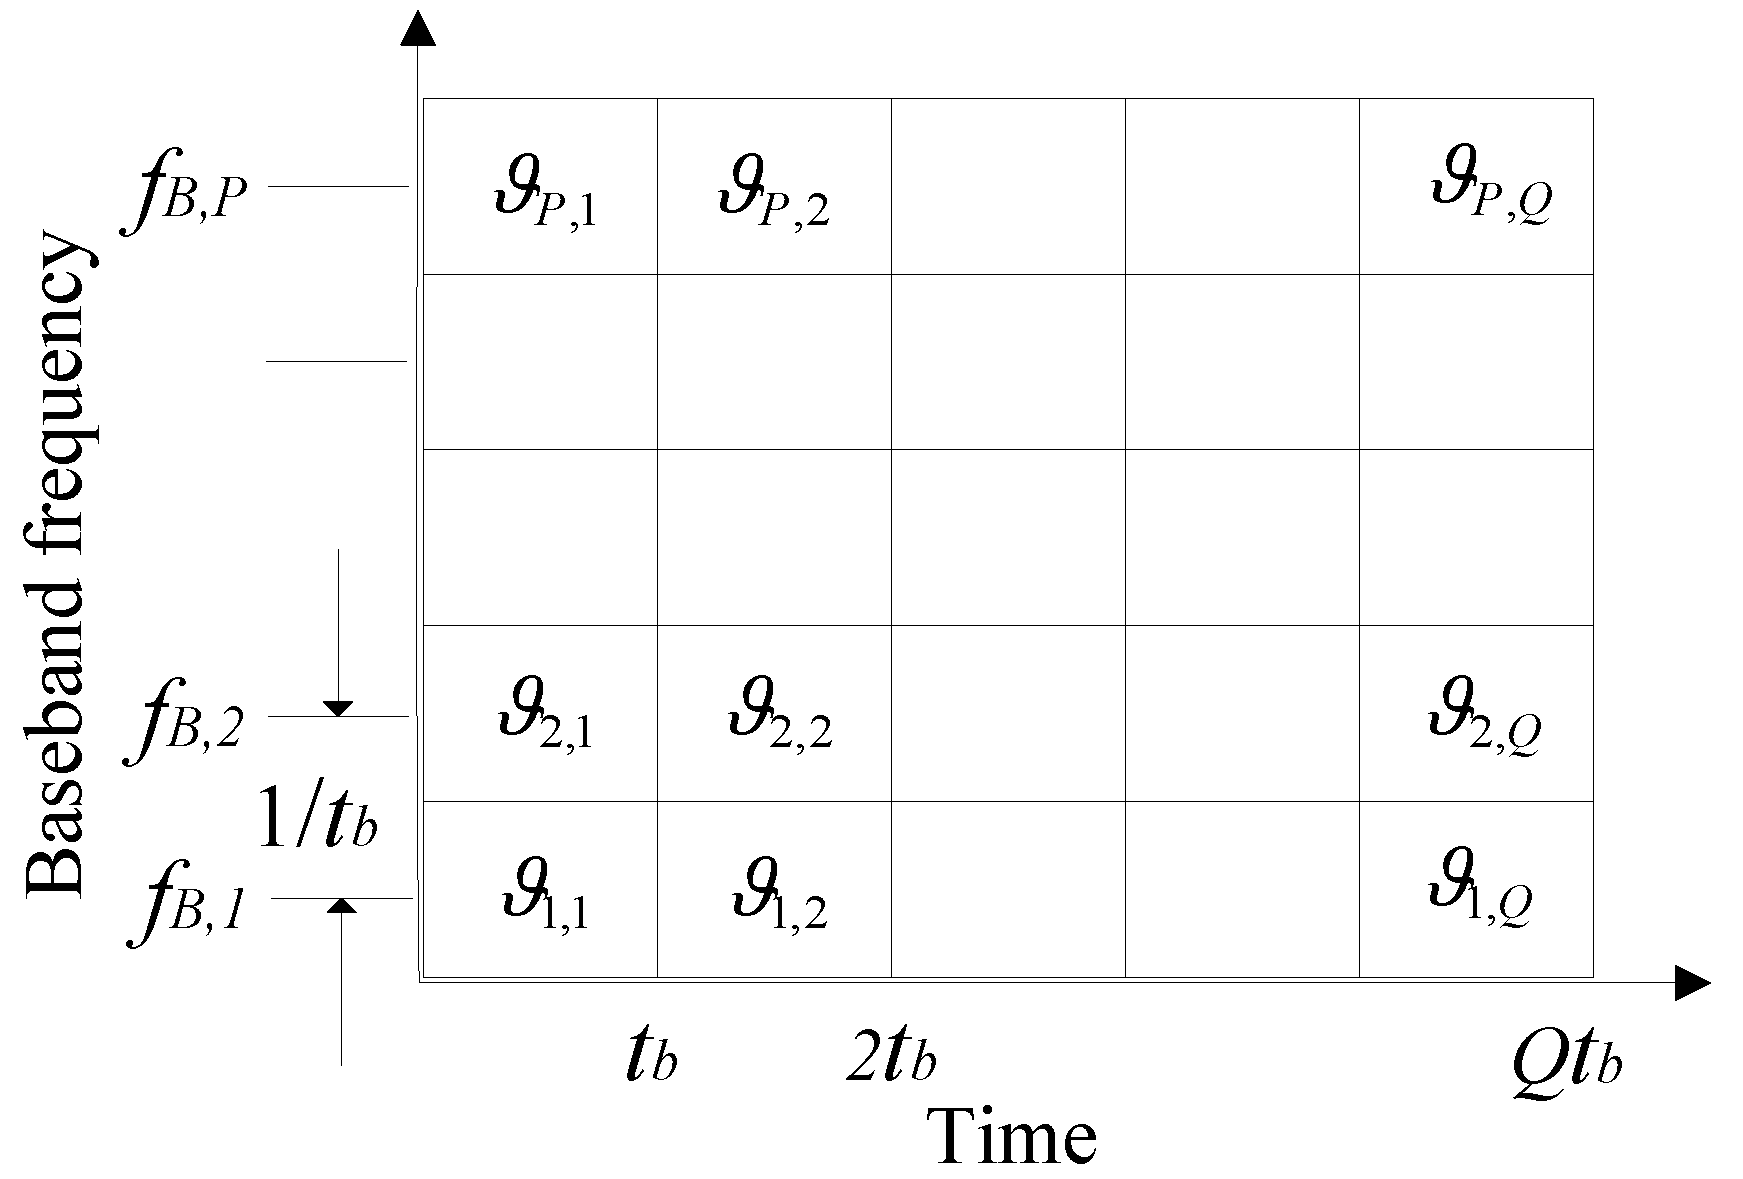
After serial in parallel out (SIPO), the sequences become parallel streams, which are simultaneously modulated by different subcarriers with the same frequency interval. In order to guarantee that the subcarriers of the OFDM signal are orthogonal to each other, the frequency spacing of the adjacent subcarriers is set to the reciprocal of a code time width. The structure of the OFDM signal in time domain is shown in Figure 1.
For , , where is the subcarrier’s phase within the duration of the elementary symbol, is the duration of the completed OFDM elementary symbol, is the baseband frequency of the subcarrier, and is the frequency spacing of the adjacent subcarriers which is equal to the reciprocal of .
Focusing on the frequency and phase, as the baseband frequency is processed by the up converter with the carrier frequency , the OFDM signal within the duration of elementary symbol can be simplified as
where , represents the frequency of the subcarrier, and is the subcarrier’s phase.
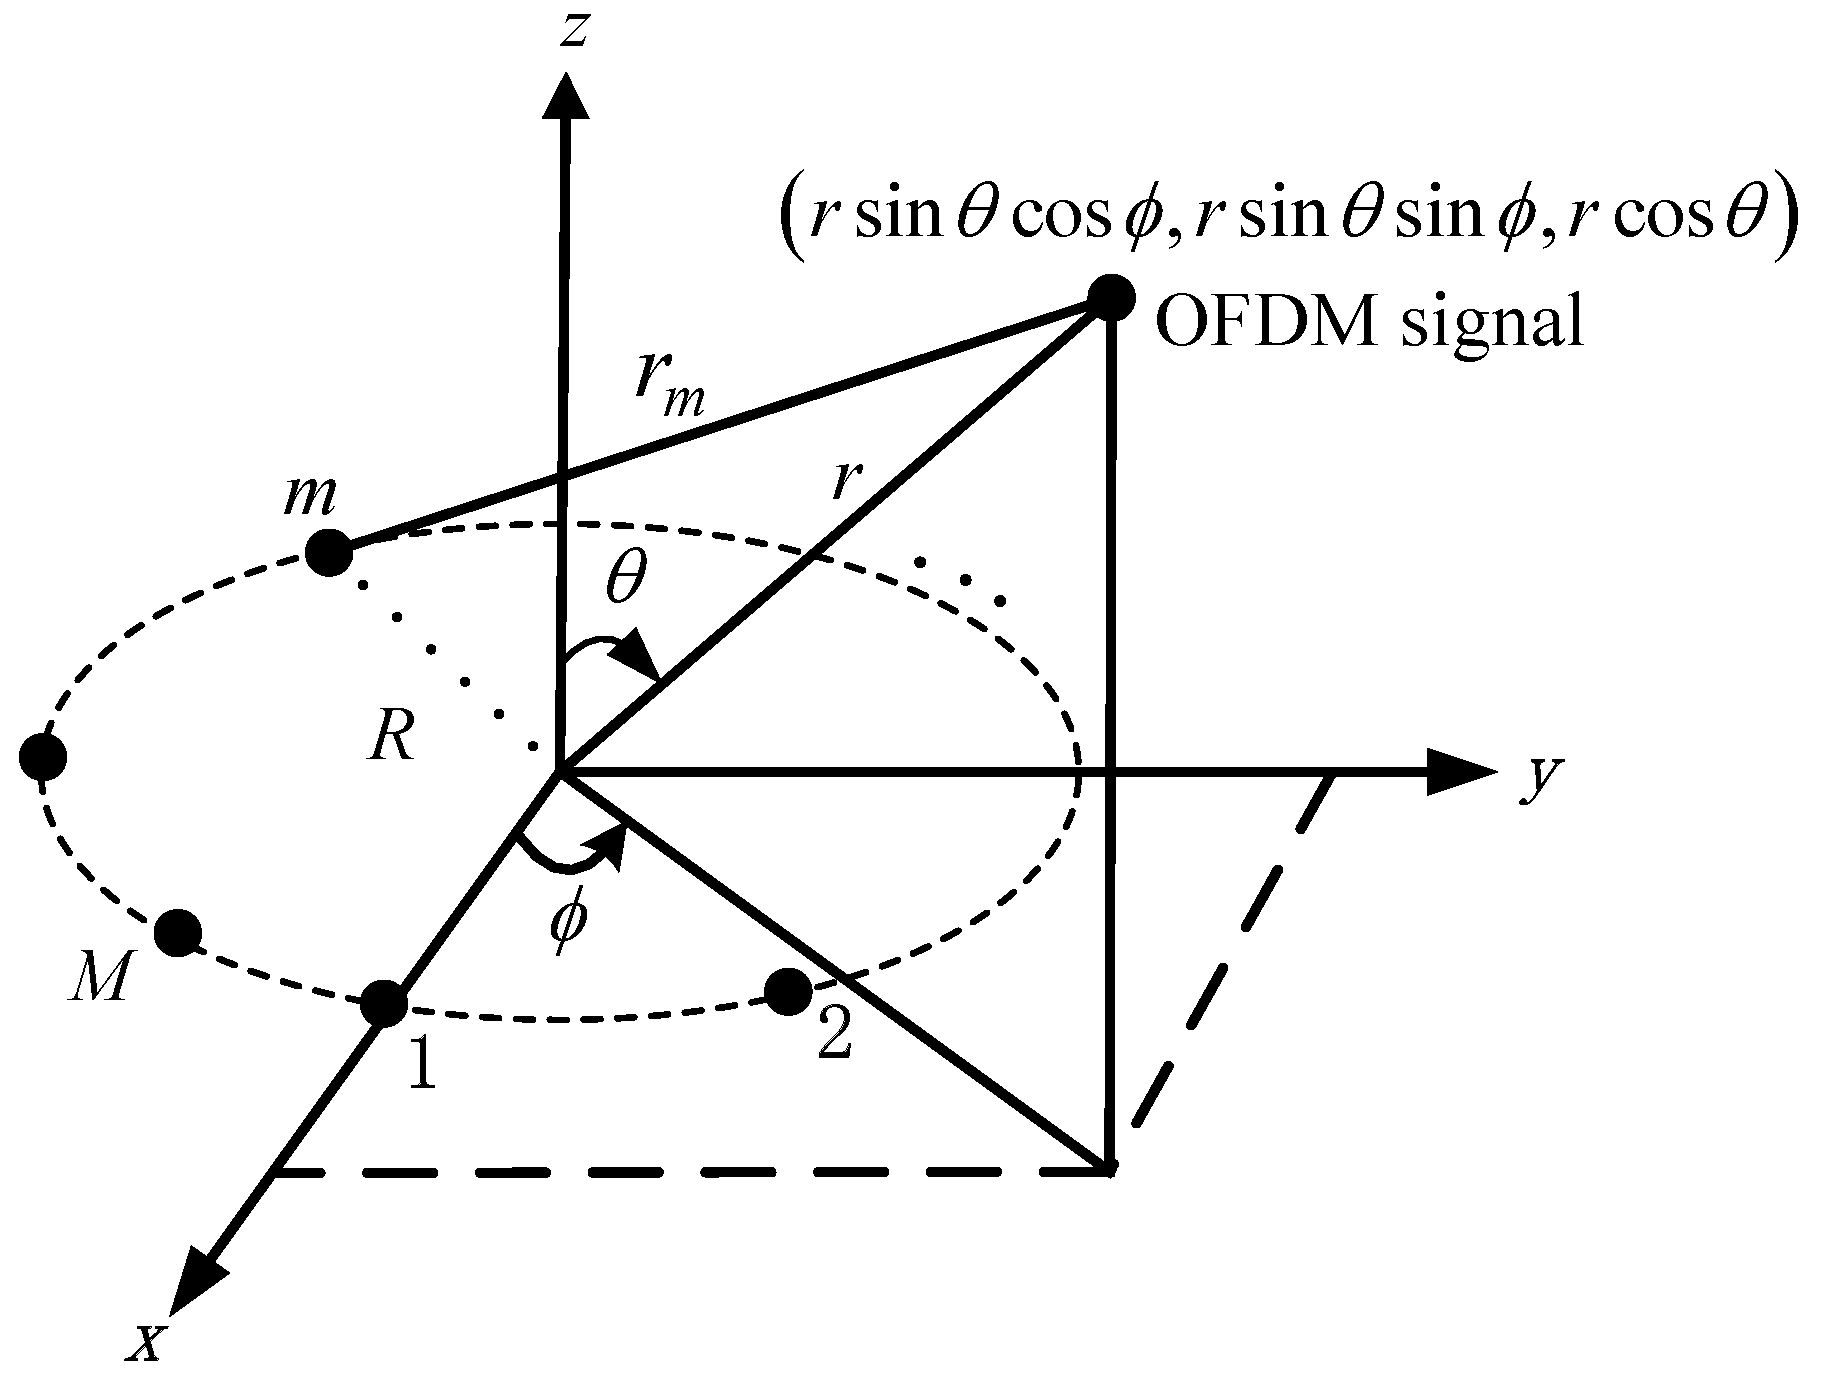
Consider a UCA in the -plane with radius and identical omnidirectional sensors impinged by an OFDM signal. The sensors are uniformly and counterclockwise spaced on the circumference where the first sensor is located at the x-axis, its geometry is shown in Figure 2. The near-field OFDM signal is located at , where the azimuth angle is measured counterclockwise from the x-axis, the elevation angle is measured downward from the z-axis, and the range is measured from the center of the UCA. The output of the sensor of the UCA at the sample is given by
for and , where represents the OFDM signal sampling with power , and is assumed to be a zero-mean white complex Gaussian noise with power , which is independent of . is the wavelength. is the range between the sensor and the near-field OFDM signal, which has the form of
where with . According to a second-order Taylor series expansion around the point where the value of is approximated to zero, for can be well simplified as
Substituting (3) and (4) into (2) yields the approximated signal model
3. Frequency Estimation of the OFDM Signal’s Subcarriers
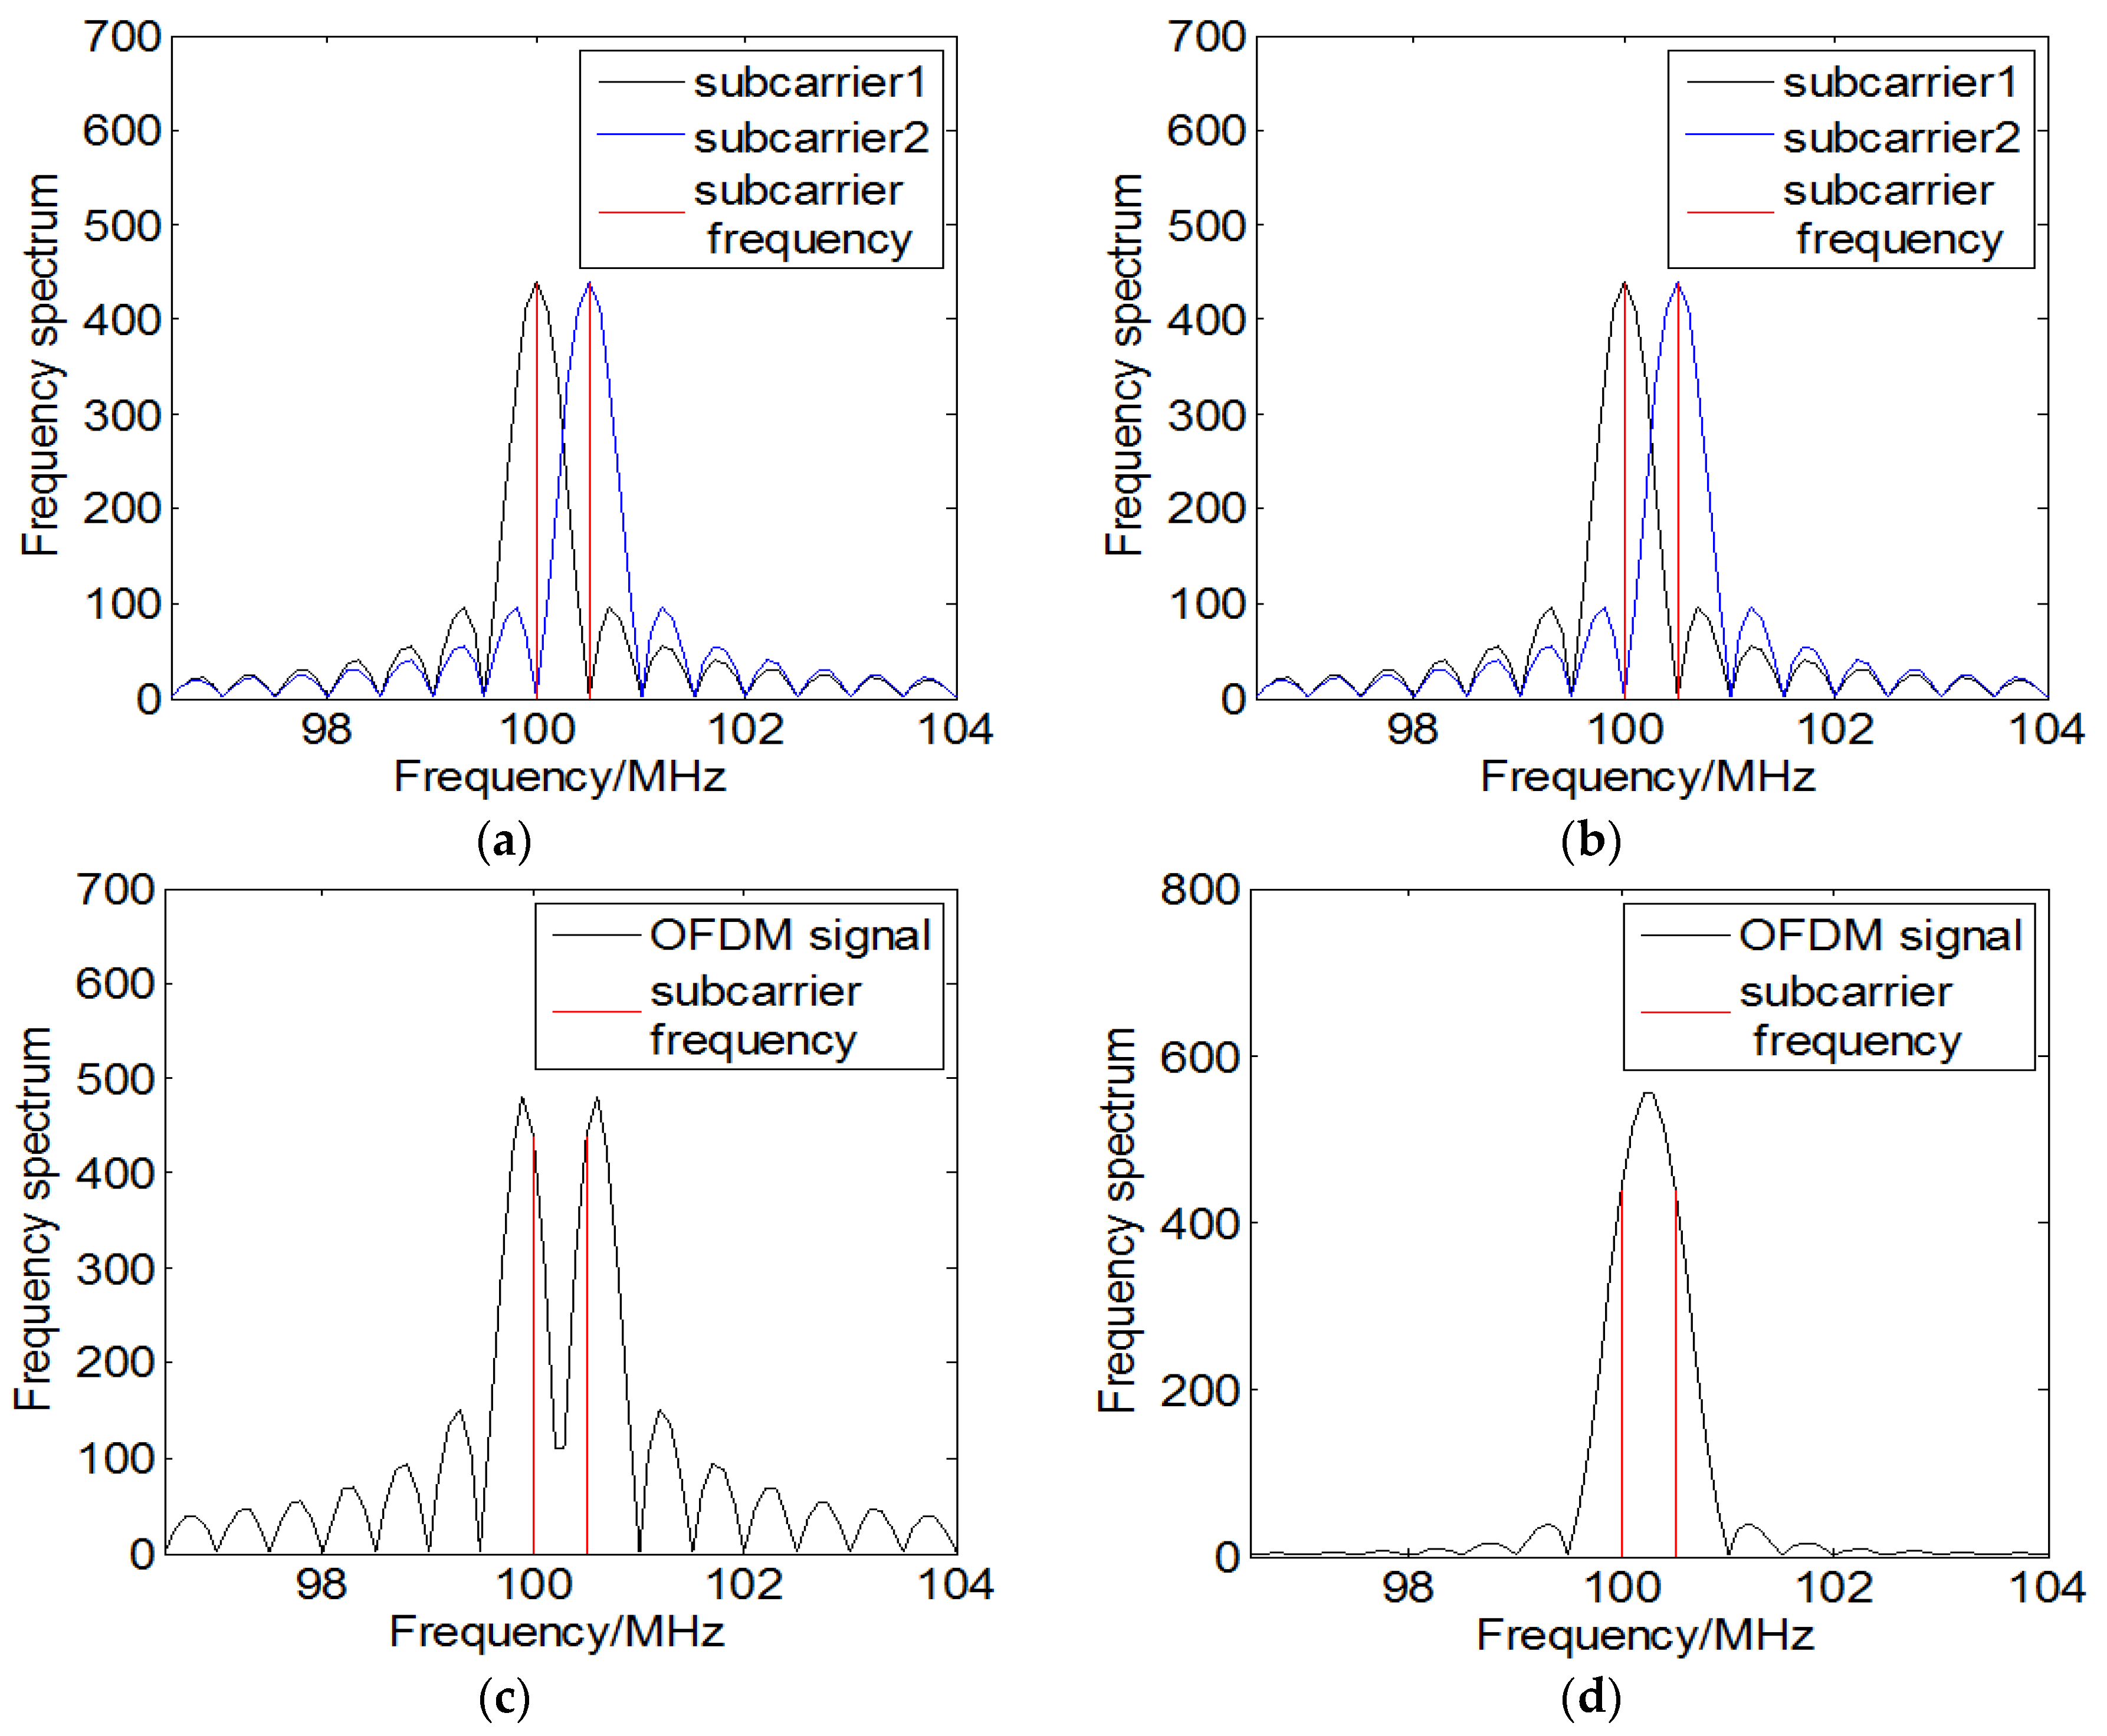
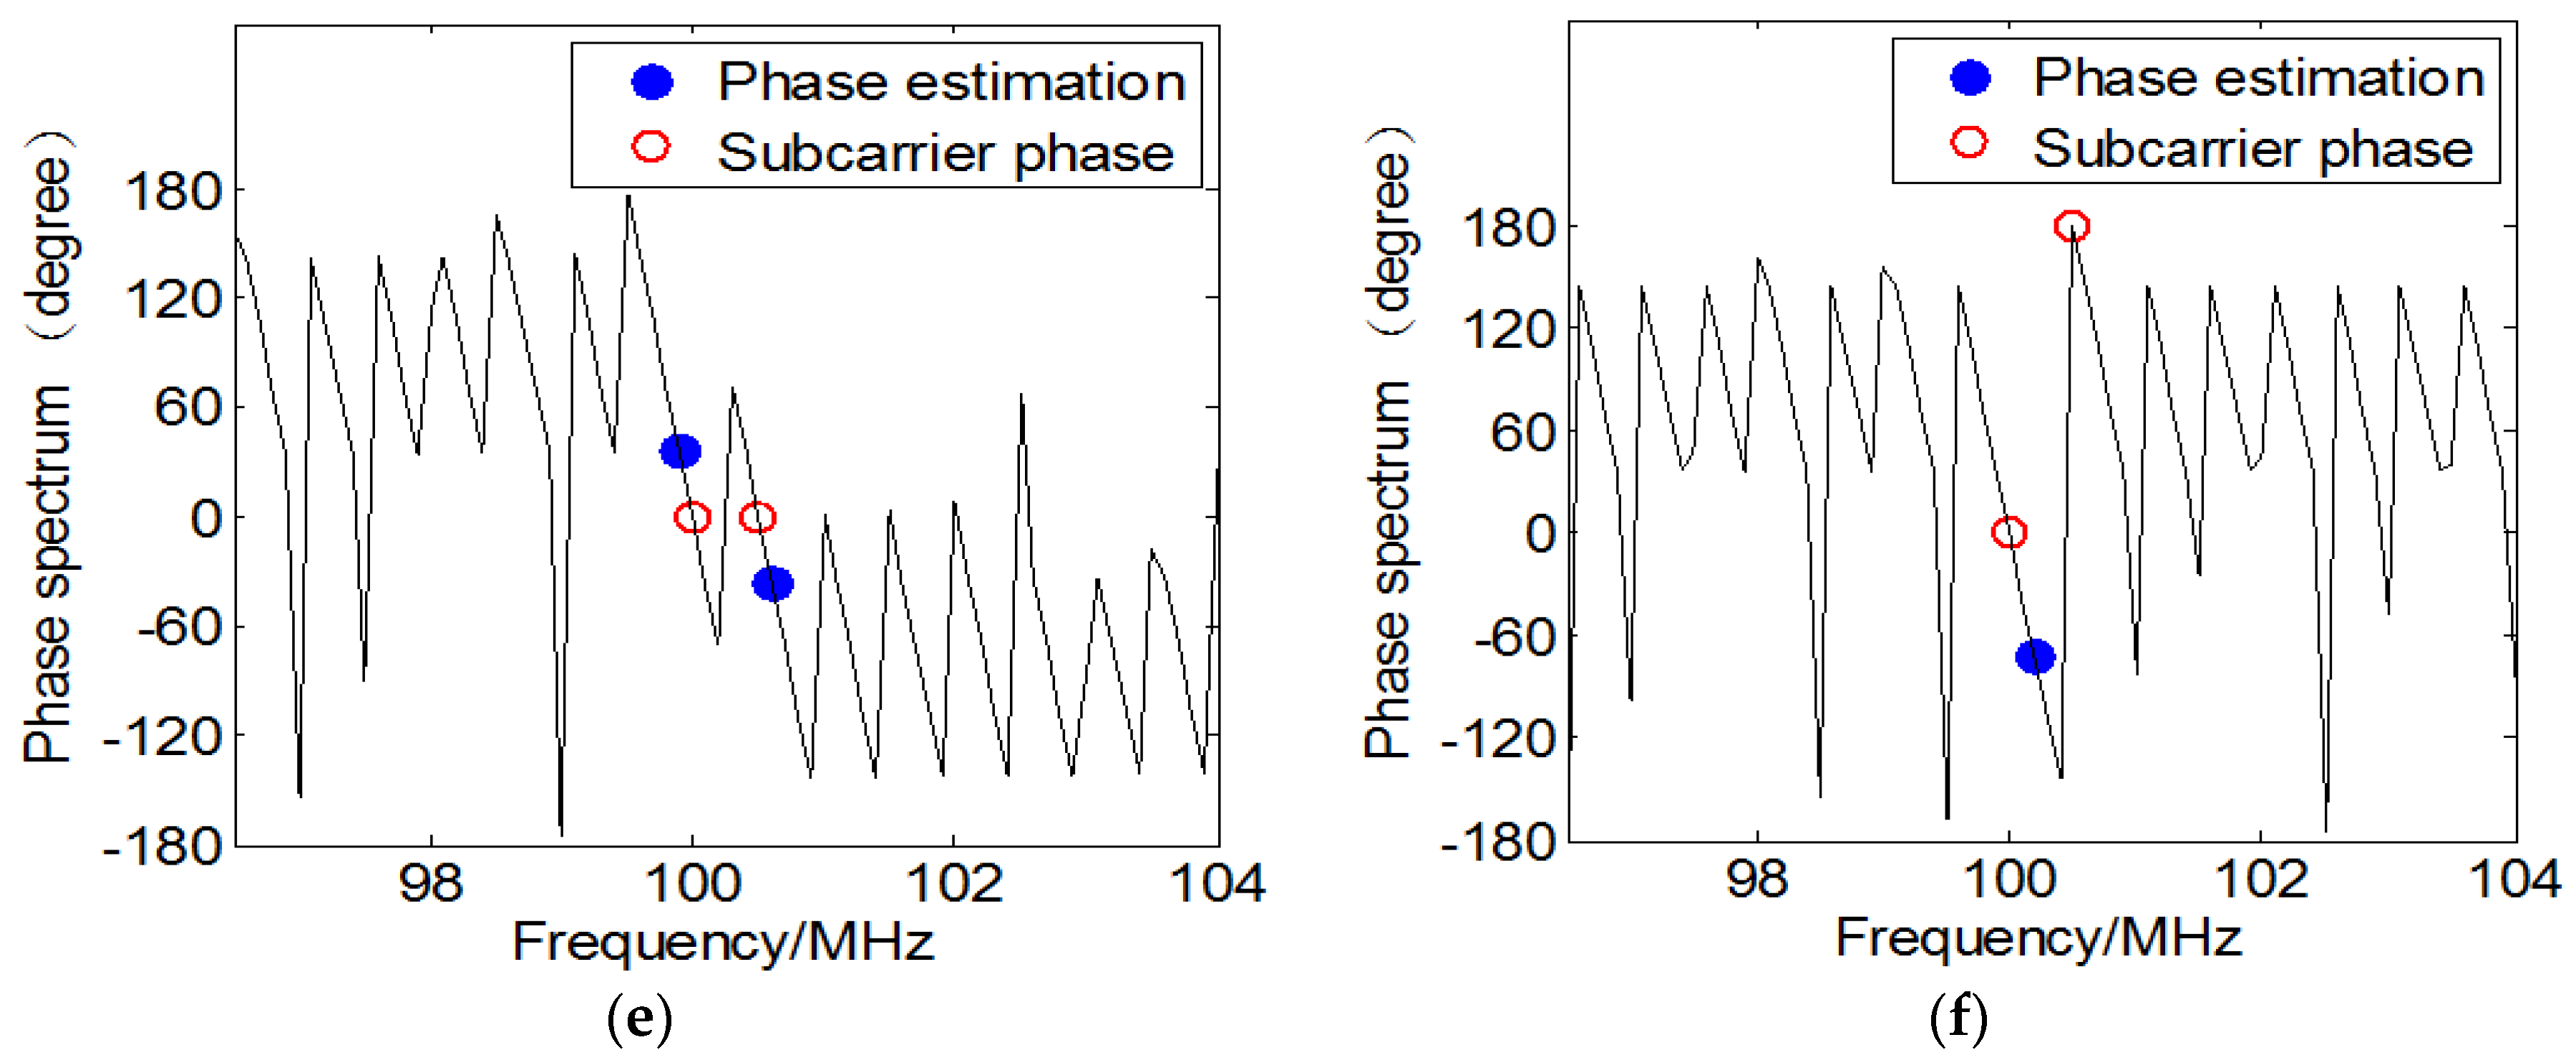
For the received data of the sensors under UCA, considering that the OFDM source is a form of mono-frequency source that needs to consider the impact of frequency, the conventional method employs the FFT algorithm to obtain the frequency spectrum and estimate the frequencies of subcarriers. Although padding zeroes at the tail of the discrete measurements is equal to interpolating in the frequency domain, which can improve frequency resolution and avoid the phenomenon of spectrum leakage, it will lead to the inaccuracy estimation of frequency as well as the corresponding phase. Take the first sensor’s received data for example, considering that an OFDM signal contains two subcarriers whose phase-code is same and frequency interval is 0.5 MHz, the subcarriers’ frequency spectrum by performing the FFT algorithm under noiseless condition is shown in Figure 3a, where the black curve and the blue curve represent the frequency spectrum of the two subcarriers respectively. It can be noticed that the subcarrier’s spectrum has half overlap with each other, which reflects the orthogonality of the OFDM signal’s subcarriers. The frequency spectrum of the OFDM signal is shown in Figure 3c, where the red lines represent the real frequencies of subcarriers. Because of the disturbance of the main and side lobes to the other subcarrier’s spectrum, the peaks of the frequency spectrum is deviated from the actual values. The phase spectrum is shown in Figure 3e, where the red hollow dots represent the real phases of subcarriers and the blue solid dots represent the corresponding phases of the frequency spectrums’ peaks. It can be seen that the phase-code of the subcarriers is equal but the estimated phases is deviated from the true values. Besides, when the difference of phase-code is and the frequency interval is 0.5 MHz, the frequency spectrum and phase spectrum are shown in Figure 3b,d,f. It can be noticed from Figure 3d that the subcarriers cannot be resolved from the peak in the frequency spectrum.
In order to overcome the drawbacks of the frequency spectrum by employing the FFT algorithm and obtain the super-resolution frequencies of the OFDM signal’s subcarriers for the phase-based algorithm, this paper utilizes the sparse representation to decouple subcarriers in the frequency domain. The goal of the paper is to explore how to employ the sparse representation methodology to obtain the super-resolution frequency spectrum of the OFDM signal. Considering that the received data of each sensor under UCA contains the same components of frequency, we employ the first sensor’s received data to obtain the super-resolution frequencies of the OFDM signal’s subcarriers, which can be expressed as
where
denotes the transpose operator, is a known matrix which is referred to as a dictionary with , is the dimension of vector , refer to a representation of the received data with respect to the dictionary, which is sparse if there are few non-zeroes among the possible entries. Generically, this formulation is referred to as sparse approximation. The assumption of sparsity of is significant when we try to obtain the unique solution because the problem in (6) is ill-posed. Only when y is sparse enough can we achieve the precise estimation of the frequencies and phases of the OFDM signal.
In order to obtain sparse representation in (6), considering the problem in (6) is ill-posed and has many solutions, we attempt to solve an optimization problem of the following form
where denotes the Euclidean norm for vectors, represents -norm, represents -norm, which forces the residual to be smaller than a threshold . Therefore, refer to the super-resolution frequency spectrum, and the frequency estimation of the subcarrier can be obtained as
where is the sampling frequency, is the position of the peak in . By turning to sparse representation framework, we are able to achieve super-resolution in the frequency domain. Further, the estimated frequencies can be utilized to calculate the corresponding phases of the received data.
4. 3-D Parameter Estimation of the OFDM Signal
In order to obtain 3-D position of the OFDM signal, this paper utilizes the phase difference of the adjacent sensors in a matrix form to estimate the 3-D parameters.
The phase of the subcarrier at the sensor can be estimated as
for , where represents the value of the peak in frequency spectrum by performing sparse representation at the sensor, is speed of light, is a definite integer. The phase difference of the adjacent sensors for the subcarrier can be written as
for , where with , is a definite integer. The phase ambiguity problem has already been well addressed in [9]. To guarantee no phase ambiguity in , the condition is assumed to ensure . By observing (13), when , there is no phase ambiguity about the adjacent sensors’ phase difference. When , according to the method in [9], we can employ virtual short baseline formed by the same sensor before and after rotation instead of that of the adjacent sensors. Due to the fact that the short-based-line is less than the maximal rotation angle, which can avoid phase ambiguity in the phase-based method.
It can be noticed that can be decomposed by employing angle transformation formula of trigonometric function, and by employing the double angle formula of trigonometric function. Therefore, by extending the scheme in [8] to decouple the phase difference , we reformulate (14) as the form of matrix
where
for , where represents the average of all subcarriers’ phase differences at the sensor. The method in [8] for the single-frequency source can be promoted and employed to estimate the individual subcarrier’s 3-D localization, which approximately represents the 3-D localization of the OFDM signal. However, the method in [8] does not make full use of subcarriers’ frequencies and phase differences. It can be noticed that the improved algorithm utilizes the normalized phase differences of the OFDM signal’s subcarriers, which can obtain precise localization of the near-field OFDM source.
Note that only the matrix includes the parameters of azimuth angle, elevation angle and range. By using the least square method, the optimal solution of can be estimated as
As a result, the estimation of the OFDM signal’s azimuth angle, elevation angle and range are respectively obtained from (16)
The flow chart of the proposed closed-form algorithm based on phase difference for a near-field OFDM signal’s 3-D localization is shown in Figure 4.
5. Simulation Results
In this section, simulations are performed to demonstrate the effectiveness of our proposed algorithm. The results show that the proposed algorithm can accurately estimate the frequencies and the corresponding phases of the OFDM signal’s subcarriers as well as the 3-D position of the near-field OFDM signal.
5.1. Performance of Sparse Representation
In order to verify that sparse representation can decouple the subcarriers of the OFDM signal in the frequency domain and obtain the corresponding phases, we consider a simulation that the OFDM signal has 8 subcarriers and the carrier frequency . After the processing of the up converters, the minimal frequency of subcarrier is 100 MHz and the frequency spacing is 0.5 MHz, which belongs to the wideband source. Besides, the subcarrier’s phase in the duration of the OFDM elementary symbol is modulated by employing 8 Phase Shift Keying (8PSK), which is shown in Table 1. For all examples, we set an eight-sensor symmetric UCA with radius . Due to the fact that the maximum frequency of the subcarrier is 103.5 MHz and the corresponding minimum wavelength is 2.90 m, it is can be noticed that the radius is less than the a quarter of the minimum wavelength, which can guarantee that there is no ambiguity for the phase-based algorithm. The sampling frequency and snapshot number are set at 2 GHz and 4000, respectively. At the same time, the FFT algorithm is executed to perform the comparison of the frequency estimation.
When the signal-to-noise ratio (SNR) is set at 0 dB and 20 dB, the frequency spectrum of the first sensor’s received data are respectively shown in Figure 5a,c, where the red lines represent the real frequency of subcarriers, the black curve represents the frequency spectrum by employing the FFT algorithm through padding zeros at the tail of the discrete received data, and the blue curve represents the frequency spectrum by performing sparse representation. It is noteworthy that the peaks by employing the FFT algorithm do not correspond to the actual values but the peaks of the sparse representation can estimate the subcarriers’ frequencies accurately. The phase spectrum are shown in Figure 5b,d, where the red hollow dots represent the real phases of subcarriers, the blue solid dots represent the corresponding phases of the peaks in the frequency spectrum by employing the FFT algorithm and the × shape dots represent the corresponding phases of the peaks by employing sparse representation. It is can be seen that the FFT algorithm loses efficacy for the frequency and the corresponding phase estimation but the results of the proposed sparse representation is corresponding to the actual values. The conclusion could be reached that the proposed method of sparse representation is superior in the performance for estimating the frequencies and the corresponding phases for the OFDM signal.
5.2. Performance of Location
In this section, in order to demonstrate the superior 3-D parameter estimation performance of the proposed algorithm, due to the fact that the method in [8] for the single-frequency source can be promoted and employed to estimate the individual subcarrier’s 3-D localization, which approximately represents the 3-D localization of the OFDM signal, the first and the fourth subcarriers’ localization results by employing the method in [8] are executed to perform the comparison. The results are evaluated by employing the estimated root mean square errors (RMSEs) from the average results of 500 independent Monte Carlo simulations for the mentioned OFDM signal located at .
When the SNR is set as 20 dB, the pth subcarrier’s wavelength in [8] can be calculated by , where is speed of light and is the pth subcarrier’s frequency. The 3-D position simulation results are shown in Table 2 and Figure 6. Due to the fact that the method in [8] only considers the single-frequency source which can be referred to as the narrow-band, but the OFDM source is a form of mono-frequency source, which needs to consider the impact of frequency, it can be seen from Table 2 that the result of the proposed method employed the normalized subcarriers’ phase differences is closer to the actual location, and the performance of the proposed method is superior to the method in [8].
As shown in Figure 6, the + shape represents the OFDM signal real location, the red dot represents the location of the proposed method and the blue dots represent the locations of the individual subcarriers’ locations by employing the method in [8]. Due to the fact that the method in [8] is only suitable for the single-frequency source, it is can be noticed that the positioning results of the individual subcarriers are distributed around the OFDM signal’s real location, and the proposed algorithm with comprehensive utilization of the subcarriers’ phase differences and frequencies can achieve a more precise location.
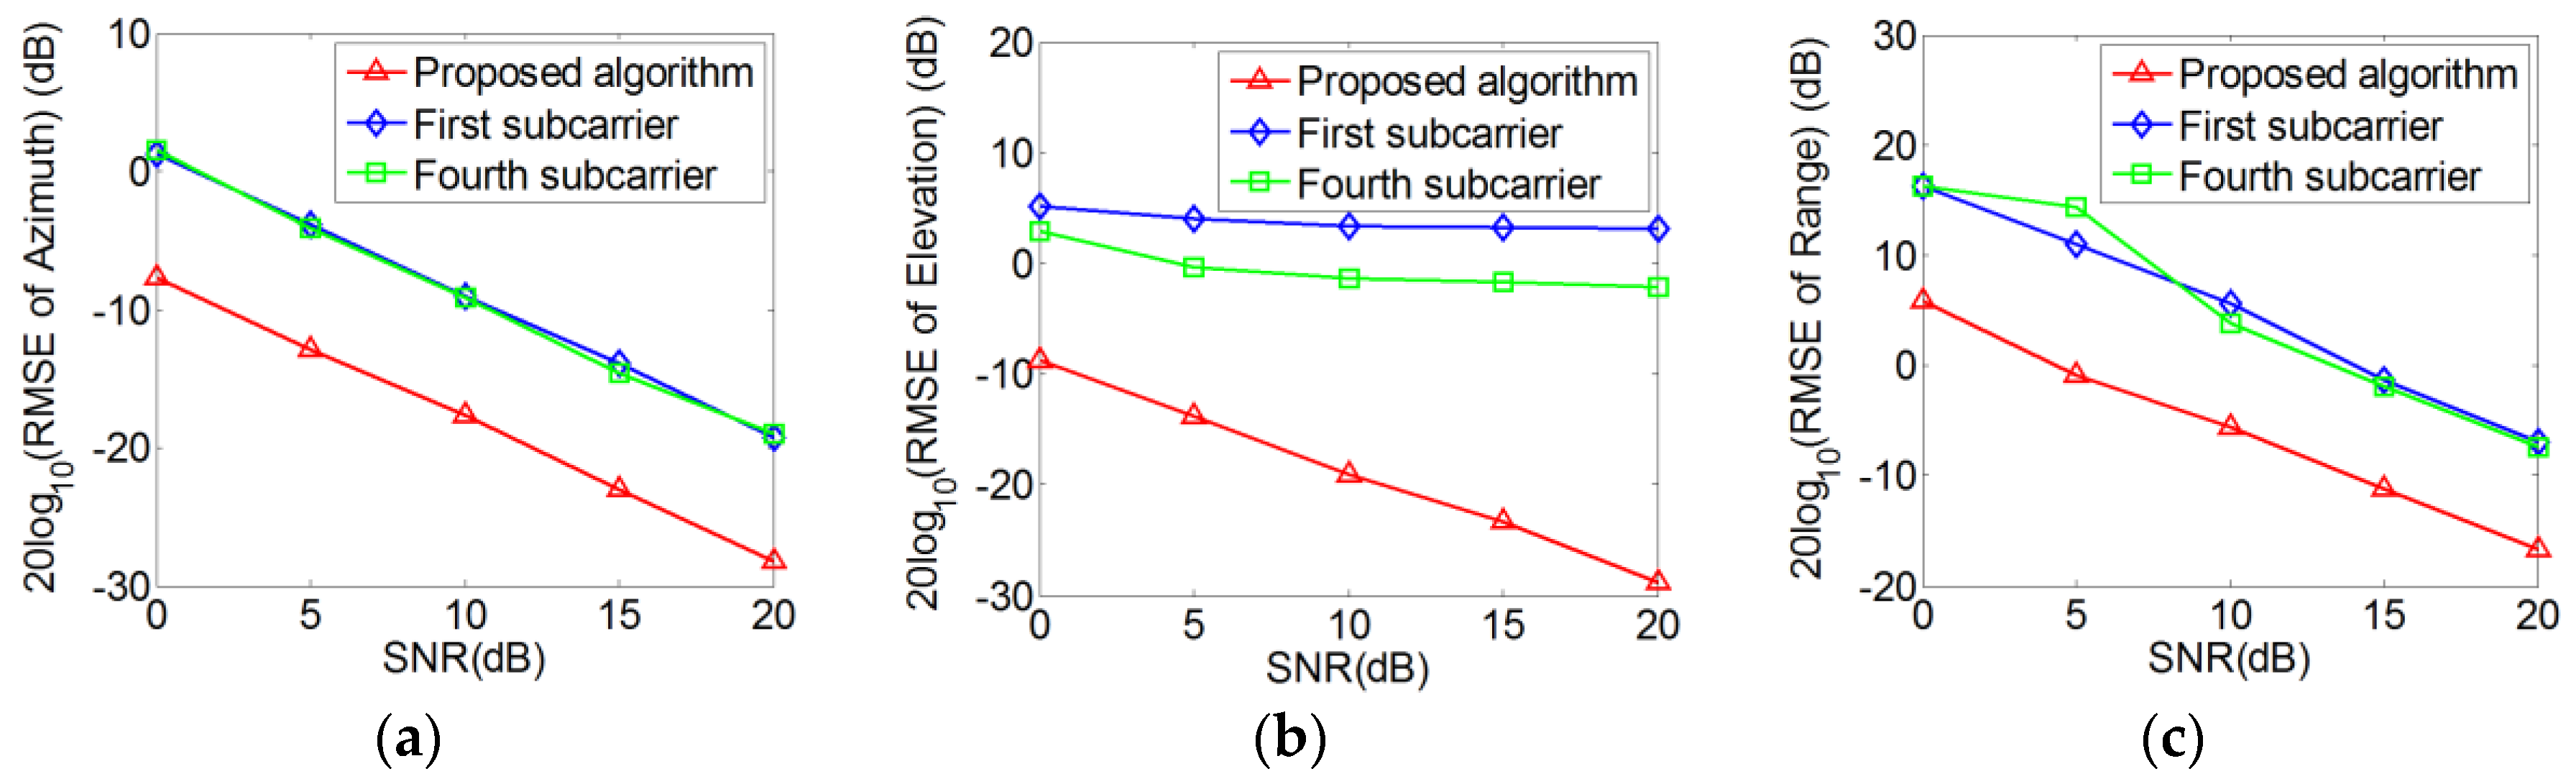
In order to further demonstrate the superiority of the proposed method for the near-field OFDM signal localization, we compare the RMSEs of the proposed algorithm to that of the method by directly employing the individual subcarrier alone and the method in [8]. The logarithm of the RMSEs are shown in Figure 7, where the red lines represent the parameter estimation of the proposed method, the blue lines represent the fourth subcarrier’s parameter estimation by employing the method in [8] and the green lines represent the first subcarrier’s parameter estimation by employing the method in [8]. As the proposed algorithm makes full use of subcarriers’ phase differences, it can be noticed that the proposed algorithm can obtain the near-field OFDM signal’s location effectively with increased SNR. Moreover, although there are errors in the frequency estimation by employing sparse representation under low SNR, it can be seen that the improved method for the localization of the OFDM signal can reduce errors and the performance is superior to method in [8] especially for elevation angle.
6. Conclusions
A closed-form algorithm based on phase difference is proposed for the 3-D location (azimuth angle, elevation angle and range) of the near-field OFDM signal under UCA. The proposed algorithm synthetically utilizes the estimated subcarriers’ phase differences of the adjacent sensors and employs the least square method to acquire precise 3-D parameters of the OFDM signal’s location, which promotes the phase-based method in [8] for a single-frequency source to the specific practical application of the OFDM source. Moreover, as the mono-frequency estimation is significant to the phase-based method and the existing method cannot resolve the frequencies of the OFDM signal’s subcarriers in the frequency domain, the advantage of the proposed algorithm is that it employs sparse representation to obtain the super-resolution frequencies and the corresponding phases of the OFDM signal’s subcarriers in the case of unknown signal’s parameters. Compared to the individual subcarriers’ localization results by directly employing the method in [8], the proposed algorithm makes full use of subcarriers’ phase differences and has superior performance for the 3-D parameter estimation especially for elevation angle.
Due to the fact that the subcarriers of the OFDM source can be referred to as the single-frequency sources and the far-field source can be referred to as the condition that the near-field source’s range is infinite, the proposed algorithm can be also applicable to the localization of parameter estimation in the case of the multiple near-field mono-frequency sources or a far-field OFDM signal.
Acknowledgments
This work is supported in part by the National Natural Science Foundation of China under Grant 61401481, in part by the Natural Science Foundation of Hunan Province, China under Grant 2017JJ3368.
Author Contributions
The main idea was proposed by Xiaolong Su and Zhen Liu; Xizhang Wei and Xin Chen conceived and designed the experiments; Xiaolong Su wrote the paper.
Conflicts of Interest
The authors declare no conflict of interest.
References
- Leonard, J.; Cimini, L. Analysis and simulation of a digital mobile channel using orthogonal frequency division multiplexin. IEEE Trans. Commun. 1985, 33, 665–675. [Google Scholar]
- Liu, Y.J.; Liao, G.S.; Xu, J.W.; Yang, Z.W. Adaptive OFDM integrated radar and communications waveform design based on information theory. IEEE Commun. Lett. 2017, 21, 2174–2177. [Google Scholar] [CrossRef]
- Nikos, P. Undersampling in orthogonal frequency division multiplexing telecommunication system. Sens. Appl. Sci. 2014, 4, 79–98. [Google Scholar]
- Bae, E.H.; Lee, K.K. Closed-form 3-D localization for single source in uniform circular array with a center sensor. IEICE Trans. Commun. 2009, E-92B, 1053–1056. [Google Scholar] [CrossRef]
- Wu, N.; Qu, Z.; Si, W.; Jiao, S. DOA and polarization estimation using an electromagnetic vector sensor uniform circular array based on the ESPRIT algorithm. Sensors 2016, 16, 2109. [Google Scholar] [CrossRef] [PubMed]
- Li, S.; Xie, D. Compressed symmetric nested arrays and their application for direction-of-arrival estimation of near-field sources. Sensors 2016, 16, 1939. [Google Scholar] [CrossRef] [PubMed]
- Lee, J.H.; Park, D.H.; Park, G.T.; Lee, K.K. Algebraic path-following algorithm for localising 3-D near-field sources in uniform circular array. Electron. Lett. 2003, 37, 1283–1285. [Google Scholar] [CrossRef]
- Jung, T.J.; Lee, K.K. Closed-form algorithm for 3-D single-source localization with uniform circular array. IEEE Antennas Wirel. Propag. Lett. 2014, 13, 1096–1099. [Google Scholar] [CrossRef]
- Chen, X.; Liu, Z.; Wei, X.Z. Unambiguous parameter estimation of multiple near-field sources via rotating uniform circular array. IEEE Antennas Wirel. Propag. Lett. 2017, 16, 872–875. [Google Scholar] [CrossRef]
- Chen, X.; Liu, Z.; Wei, X.Z. Ambiguity resolution for phase-based 3-D source localization under fixed uniform circular array. Sensors 2017, 17, 1086. [Google Scholar] [CrossRef] [PubMed]
- Fertner, A. Computationally efficient methods for analysis and synthesis of real signals using FFT and IFFT. IEEE Trans. Signal Process. 1999, 47, 1061–1064. [Google Scholar] [CrossRef]
- Tropp, J.A.; Wright, S.J. Computational methods for sparse solution of linear inverse problems. Proc. IEEE. 2010, 98, 948–958. [Google Scholar] [CrossRef]
- Malioutov, D.; Çetin, M.; Willsky, A.S. A sparse signal reconstruction perspective for source localization with sensor arrays. IEEE Trans. Signal Process. 2015, 53, 3010–3022. [Google Scholar] [CrossRef]
- Kim, J.M.; Lee, O.K.; Ye, J.C. Compressive MUSIC: Revisiting the link between compressive sensing and array signal processing. IEEE Trans. Inf. Theory 2012, 58, 278–301. [Google Scholar] [CrossRef]
Figure 1.
The structure of an OFDM signal in time domain.

Figure 2.
Geometry of a UCA with a near-field OFDM signal.

Figure 3.
The effect of the subcarriers’ frequencies and phases on spectrum by performing FFT algorithm: (a) Subcarrier frequency spectrum ; (b) Subcarrier frequency spectrum ; (c) Received data frequency spectrum ; (d) Received data frequency spectrum ; (e) Received data phase spectrum ; (f) Received data phase spectrum .


Figure 4.
Flow chart of the proposed phase-based algorithm.

Figure 5.
OFDM signal spectrum: (a) Frequency spectrum (SNR = 0 dB); (b) Phase spectrum (SNR = 0 dB); (c) Frequency spectrum (SNR = 20 dB); (d) Phase spectrum (SNR = 20 dB).
Figure 5.
OFDM signal spectrum: (a) Frequency spectrum (SNR = 0 dB); (b) Phase spectrum (SNR = 0 dB); (c) Frequency spectrum (SNR = 20 dB); (d) Phase spectrum (SNR = 20 dB).


Figure 6.
Positioning result (SNR = 20 dB).

Figure 7.
RMSEs versus SNR: (a) Azimuth angle; (b) Elevation angle; (c) Range.


Table 1.
The frequencies and phases of the OFDM signal’s subcarriers.
| Subcarrier | 1 | 2 | 3 | 4 | 5 | 6 | 7 | 8 |
|---|---|---|---|---|---|---|---|---|
| Frequency (MHz) | 100 | 100.5 | 101 | 101.5 | 102 | 102.5 | 103 | 103.5 |
| Phase (rad) | 0 |
Table 2.
3-D parameter estimation comparison.
| Parameter Estimation | Actual Parameter | Proposed Method | Subcarrier 1 1 | Subcarrier 1 4 |
|---|---|---|---|---|
| Azimuth angle (degree) | 20 | 20.01 | 20.17 | 20.05 |
| Elevation angle (degree) | 50 | 49.98 | 50.78 | 51.51 |
| Range (m) | 6 | 6.01 | 5.57 | 6.80 |
1 represents the individual subcarrier’s localization by directly employing the method in [8].
© 2018 by the authors. Licensee MDPI, Basel, Switzerland. This article is an open access article distributed under the terms and conditions of the Creative Commons Attribution (CC BY) license (http://creativecommons.org/licenses/by/4.0/).
Share and Cite
MDPI and ACS Style
Su, X.; Liu, Z.; Chen, X.; Wei, X. Closed-Form Algorithm for 3-D Near-Field OFDM Signal Localization under Uniform Circular Array. Sensors 2018, 18, 226. https://0-doi-org.brum.beds.ac.uk/10.3390/s18010226
AMA Style
Su X, Liu Z, Chen X, Wei X. Closed-Form Algorithm for 3-D Near-Field OFDM Signal Localization under Uniform Circular Array. Sensors. 2018; 18(1):226. https://0-doi-org.brum.beds.ac.uk/10.3390/s18010226
Chicago/Turabian StyleSu, Xiaolong, Zhen Liu, Xin Chen, and Xizhang Wei. 2018. "Closed-Form Algorithm for 3-D Near-Field OFDM Signal Localization under Uniform Circular Array" Sensors 18, no. 1: 226. https://0-doi-org.brum.beds.ac.uk/10.3390/s18010226
Note that from the first issue of 2016, this journal uses article numbers instead of page numbers. See further details here.