SAR and Optical Data Comparison for Detecting Co-Seismic Slip and Induced Phenomena during the 2018 Mw 7.5 Sulawesi Earthquake


Abstract
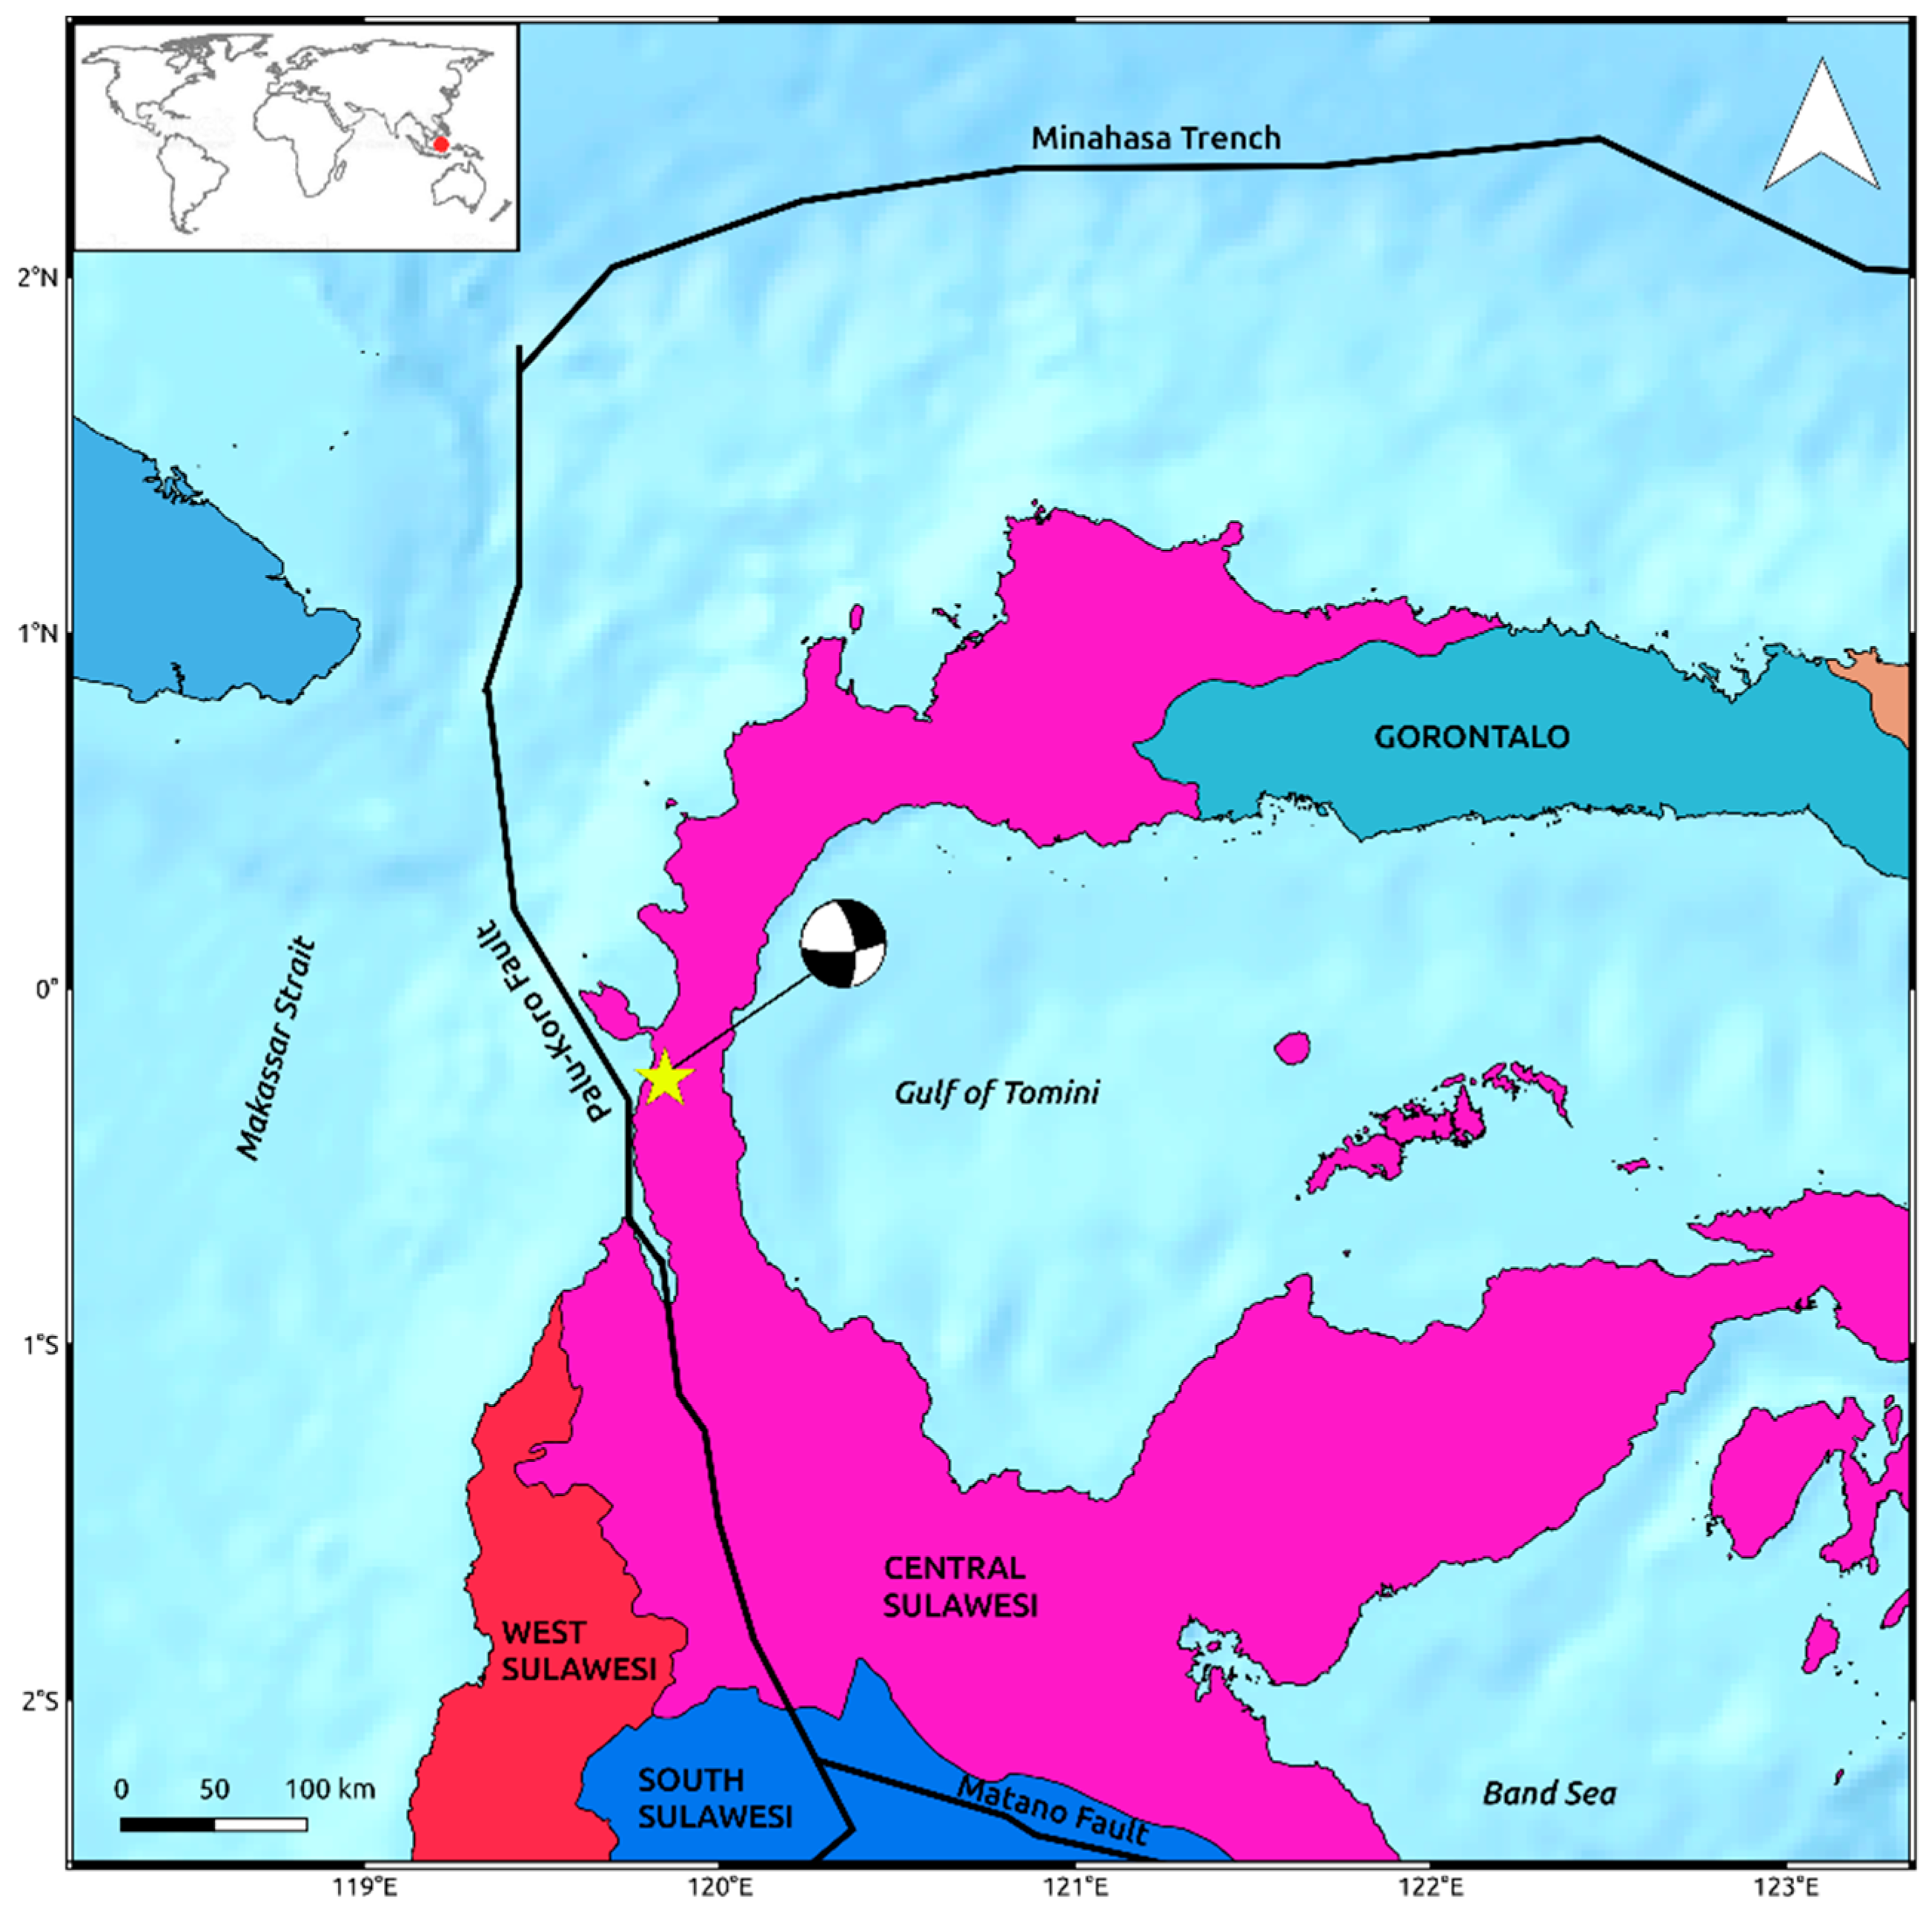
:1. Introduction
2. SAR Data
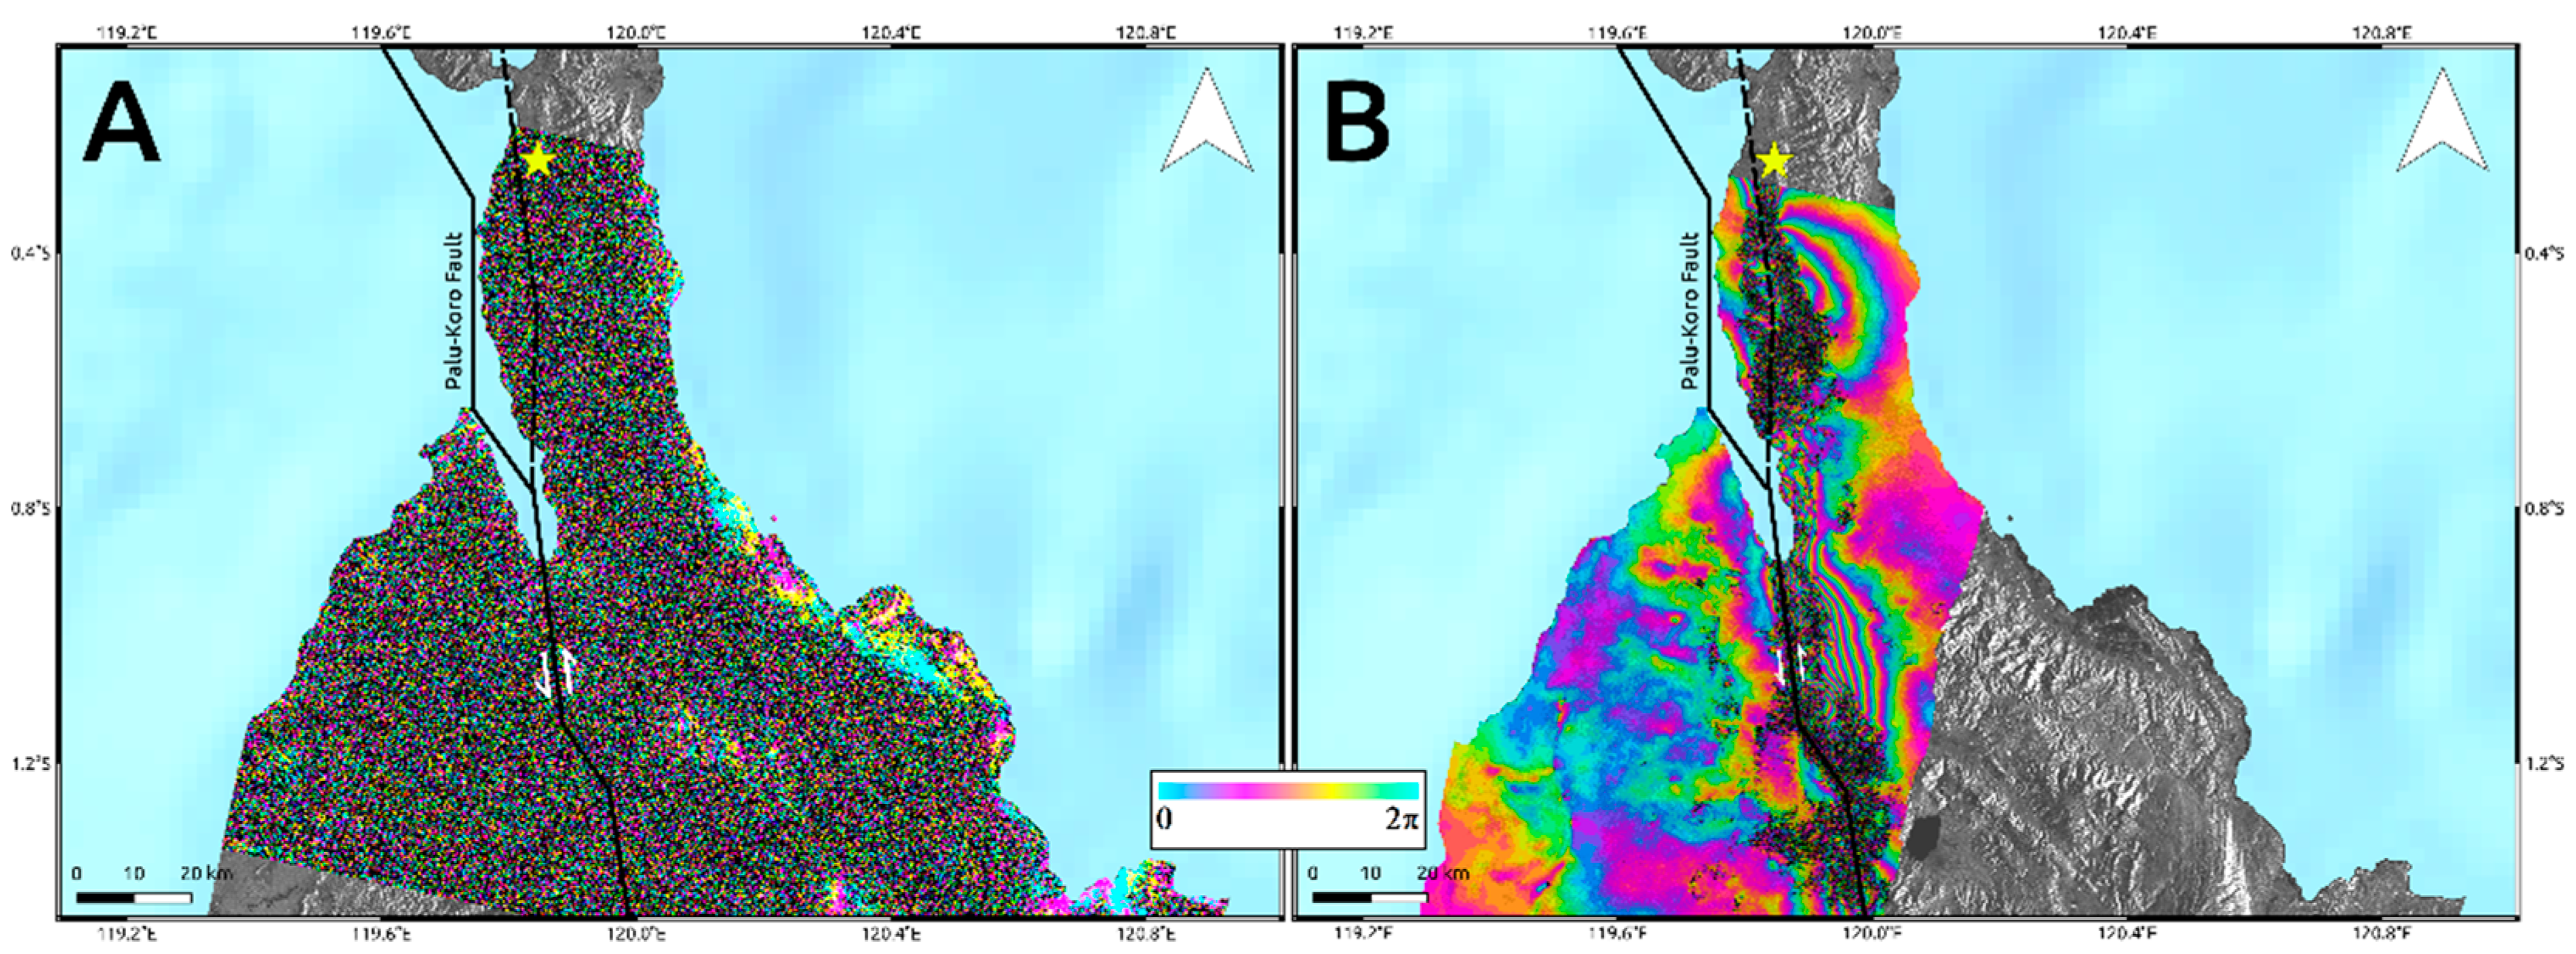
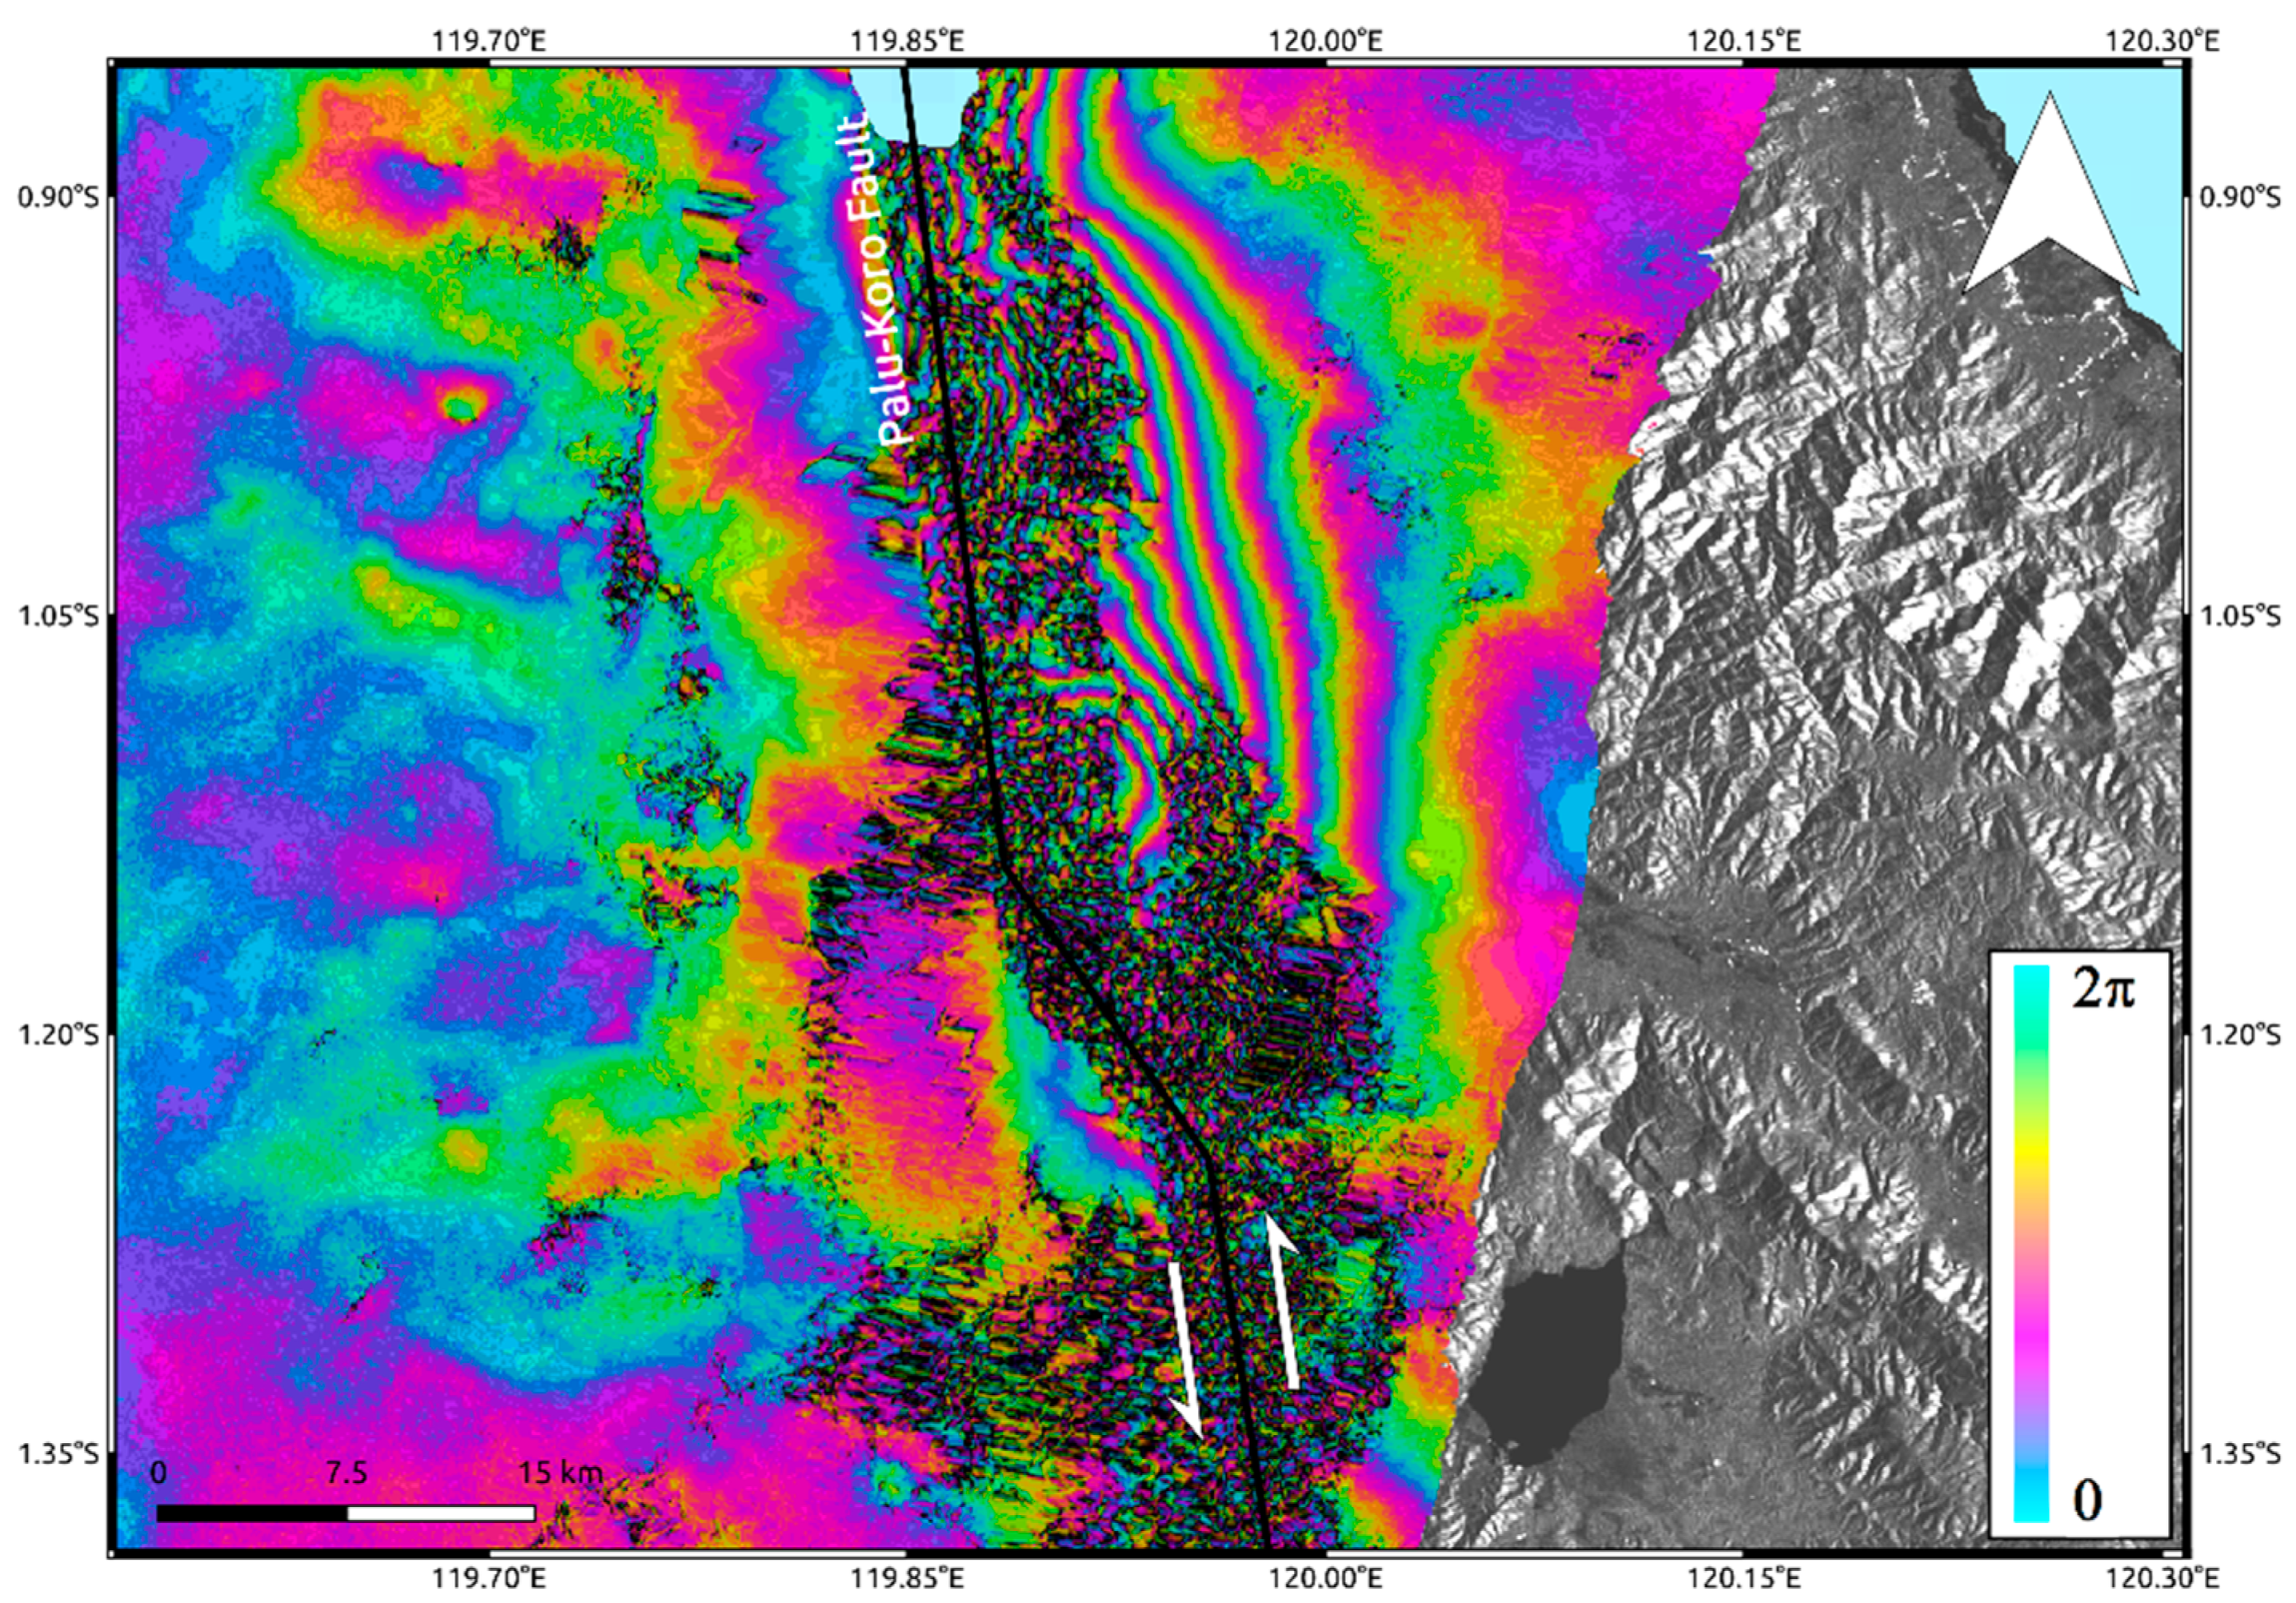
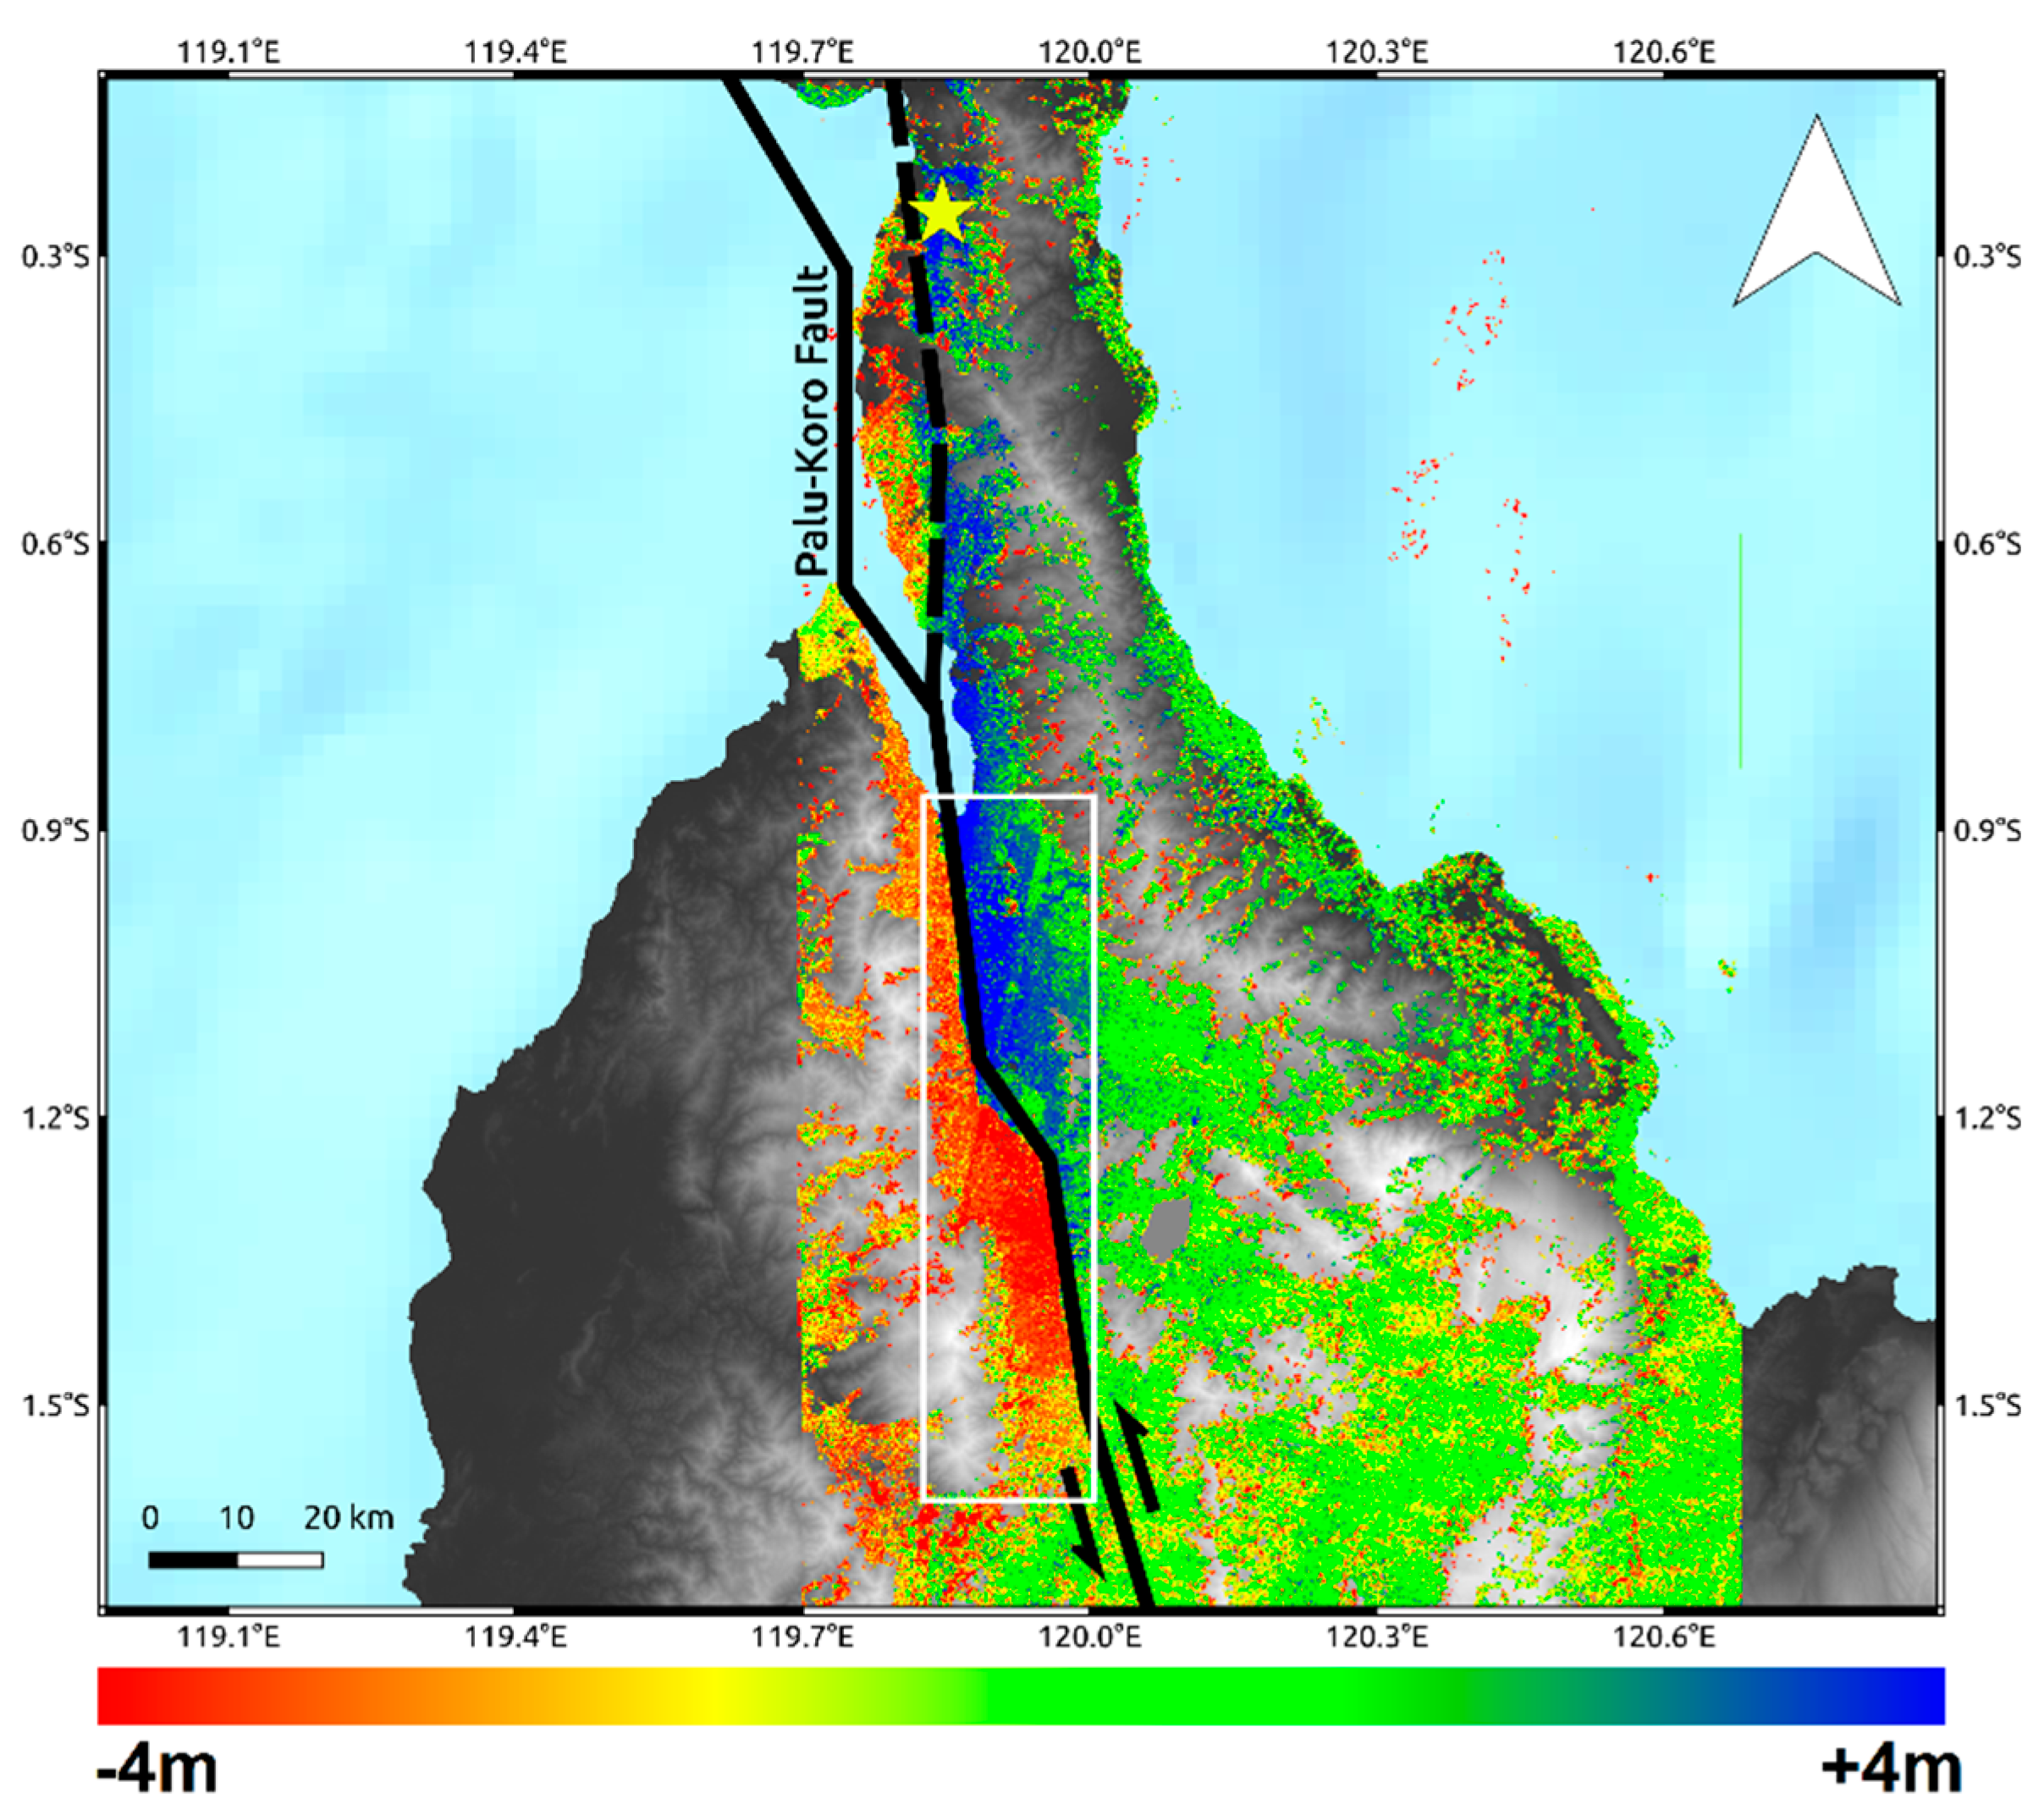
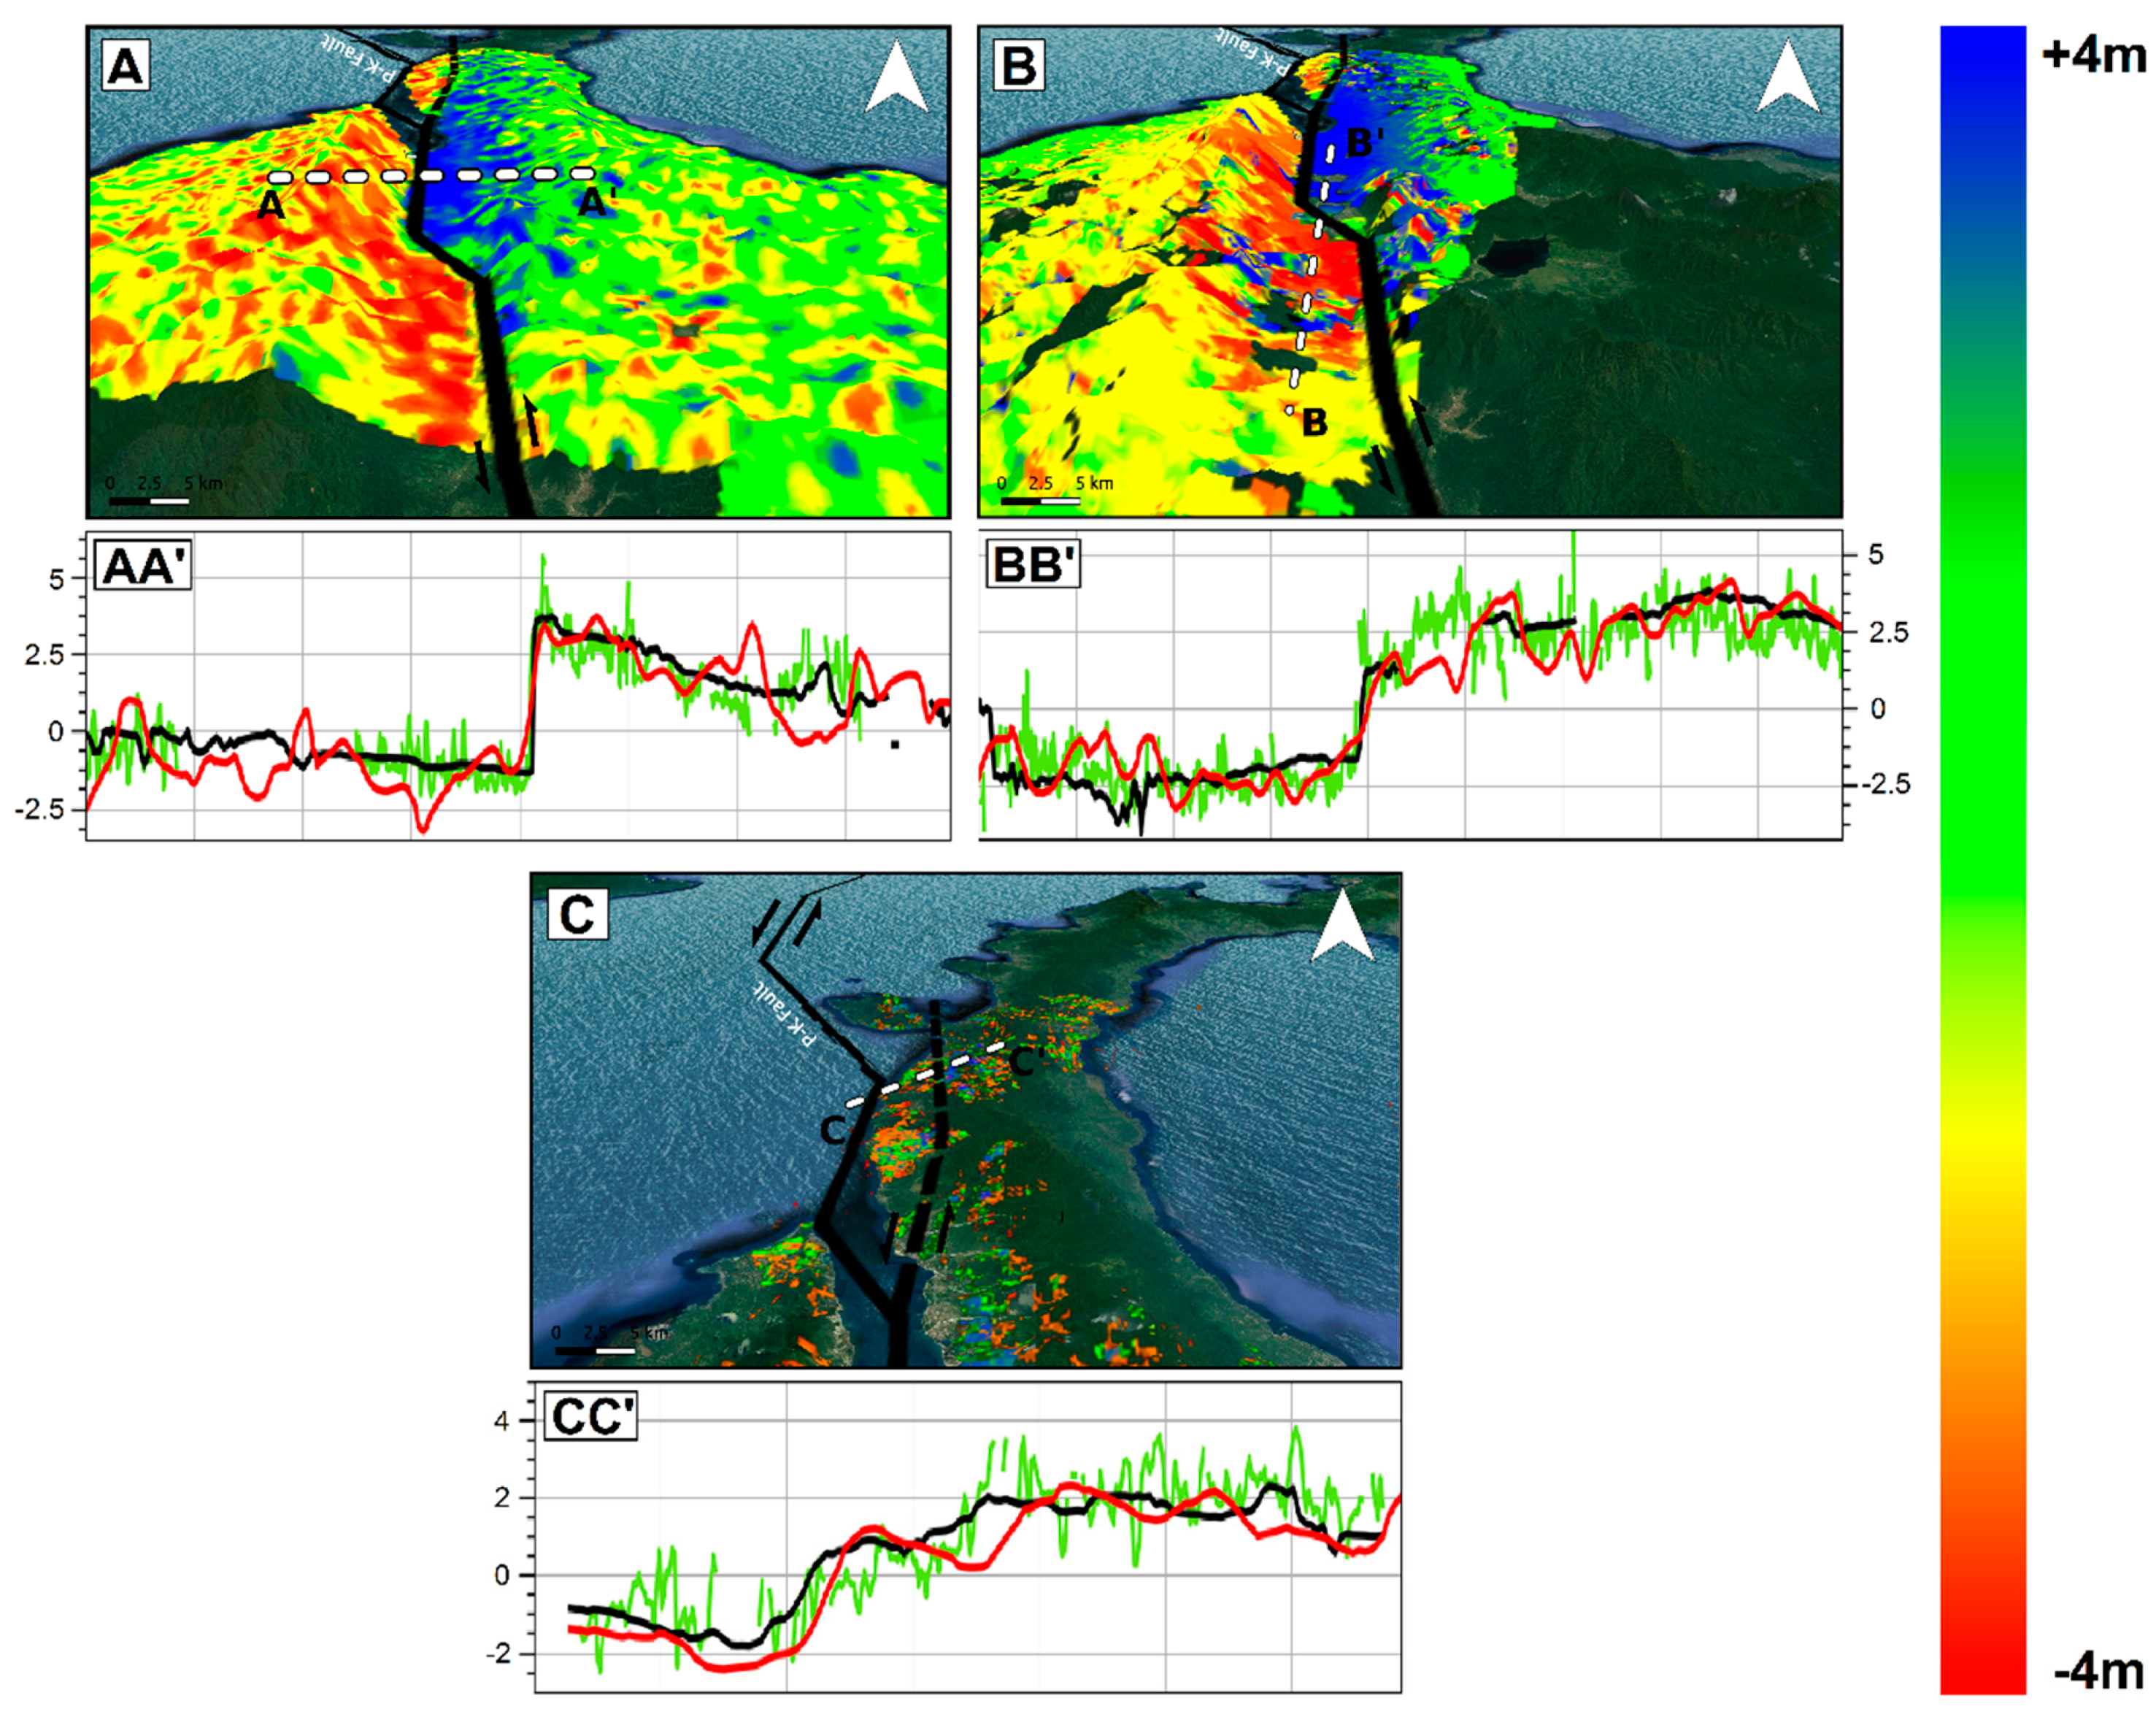
2.1. InSAR Outcomes
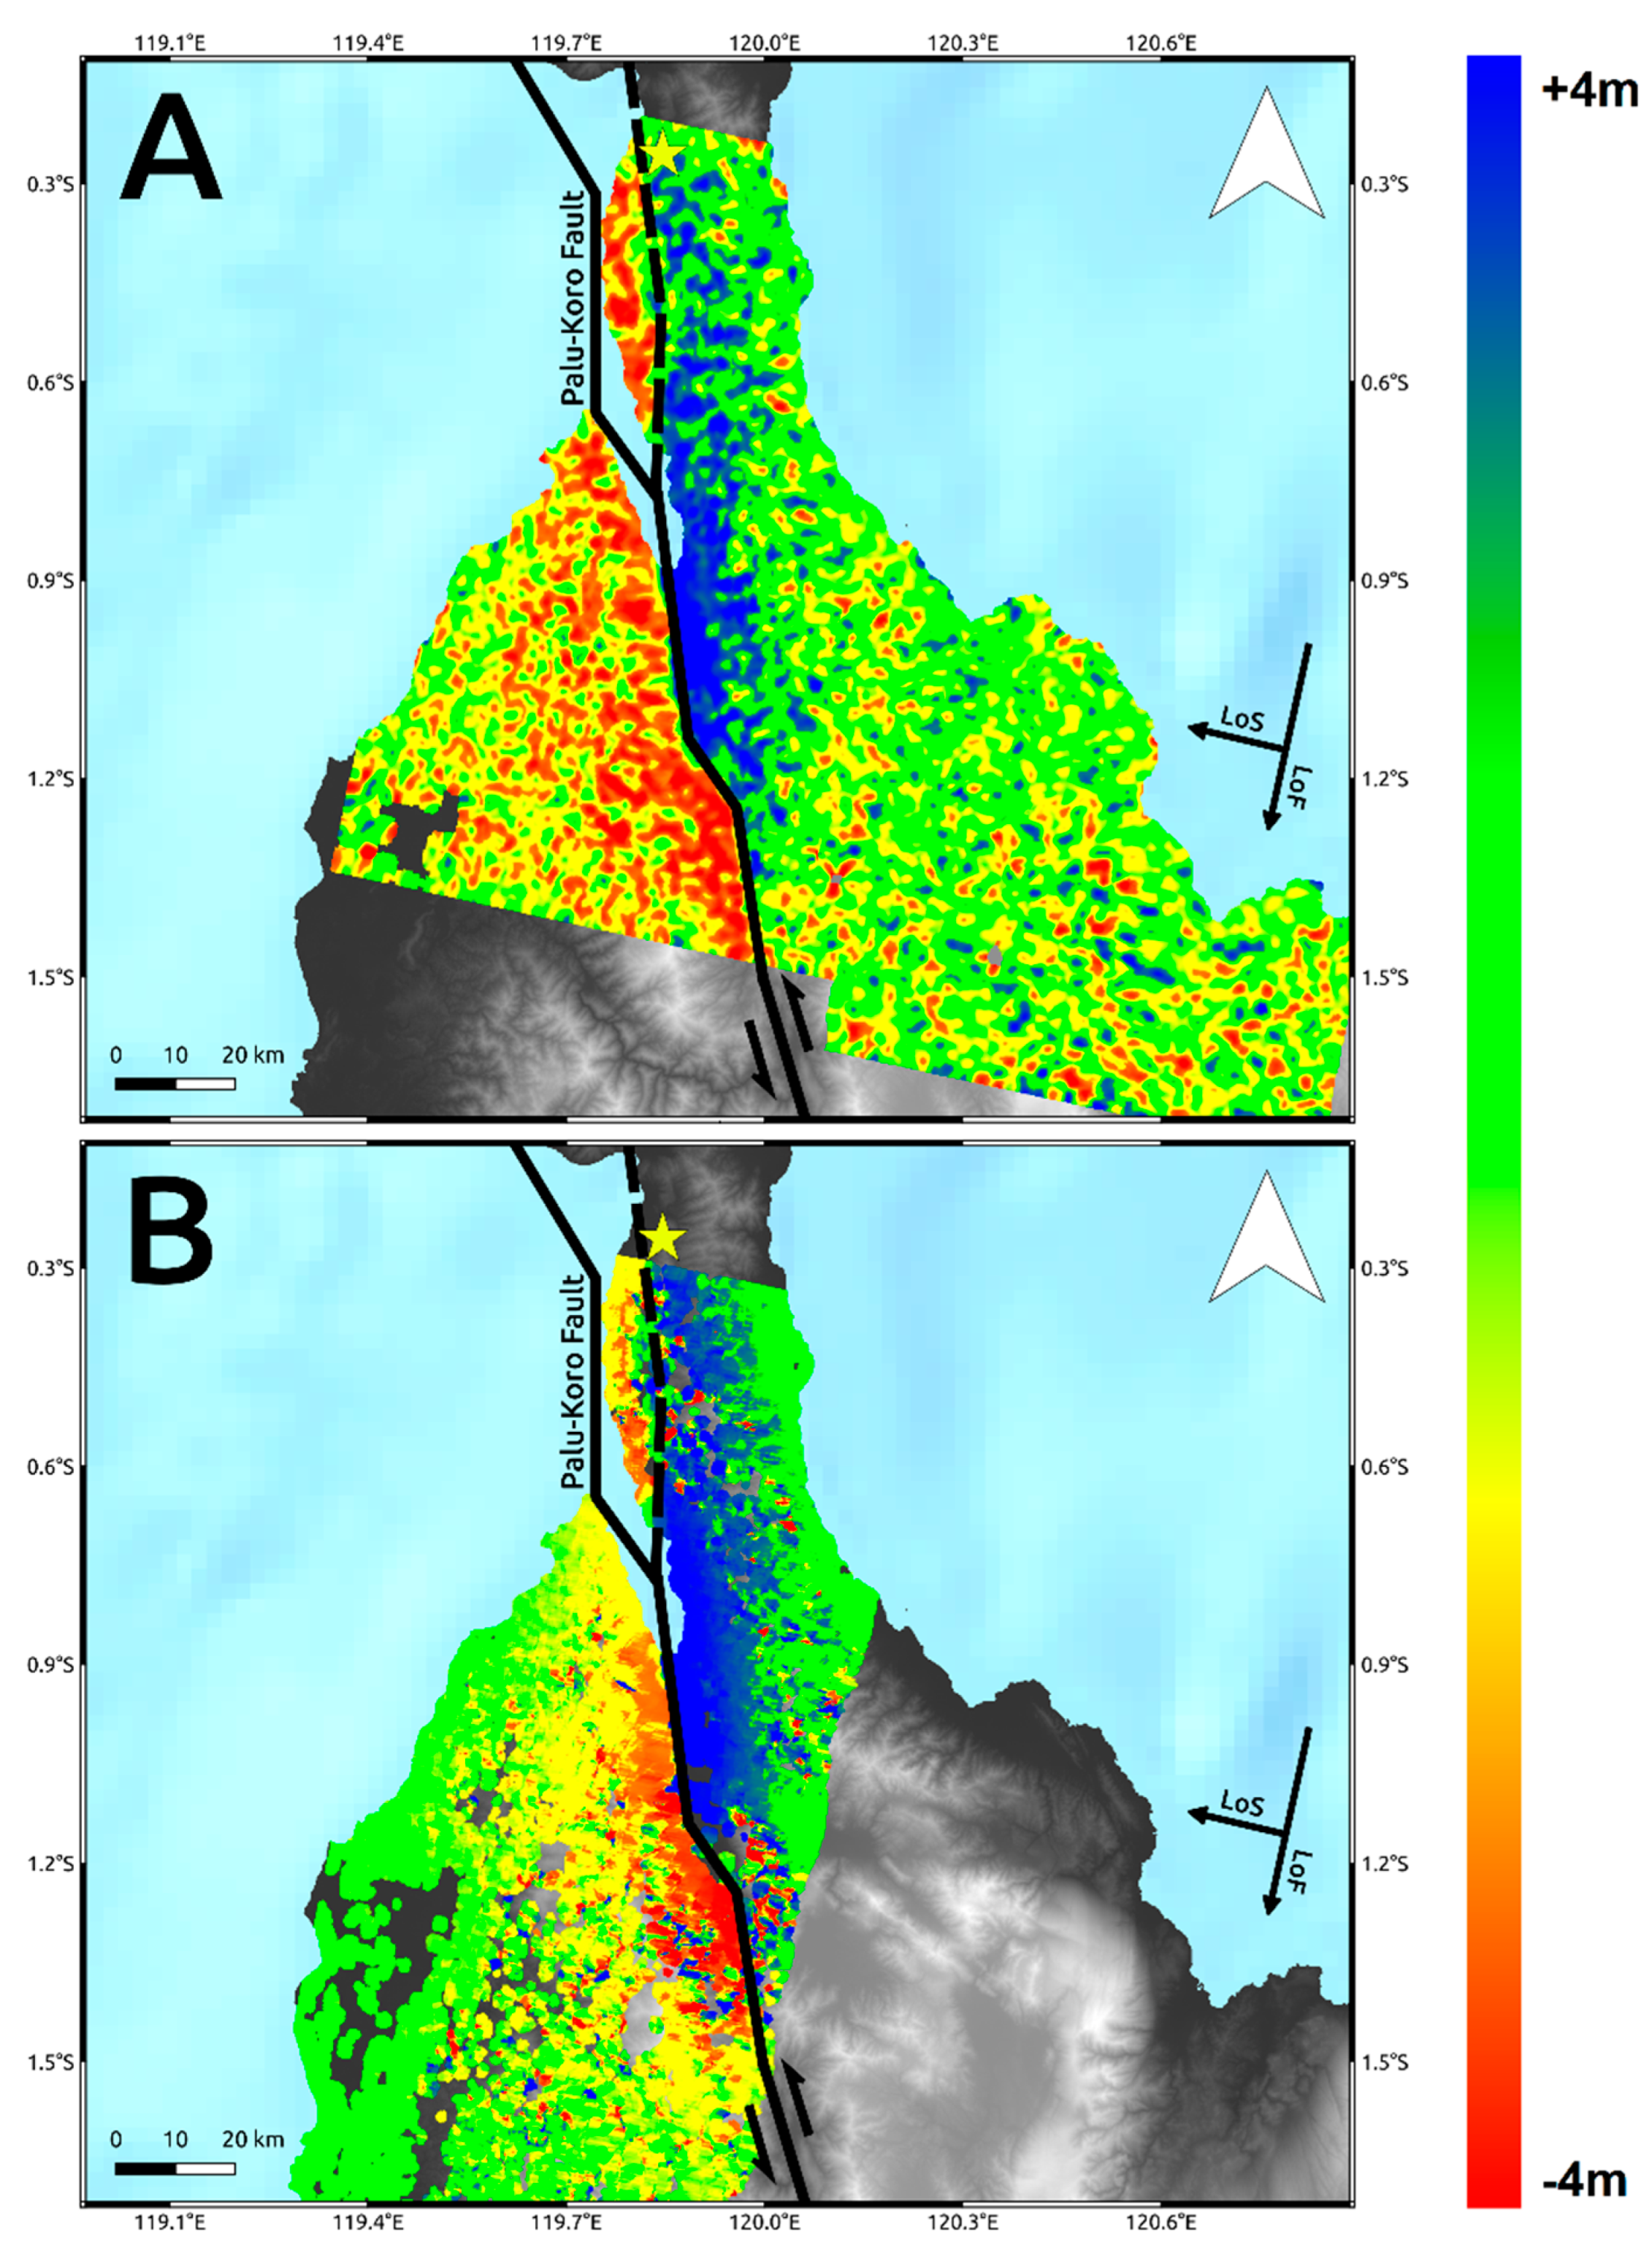
2.2. POT Outcomes
3. Optical Data
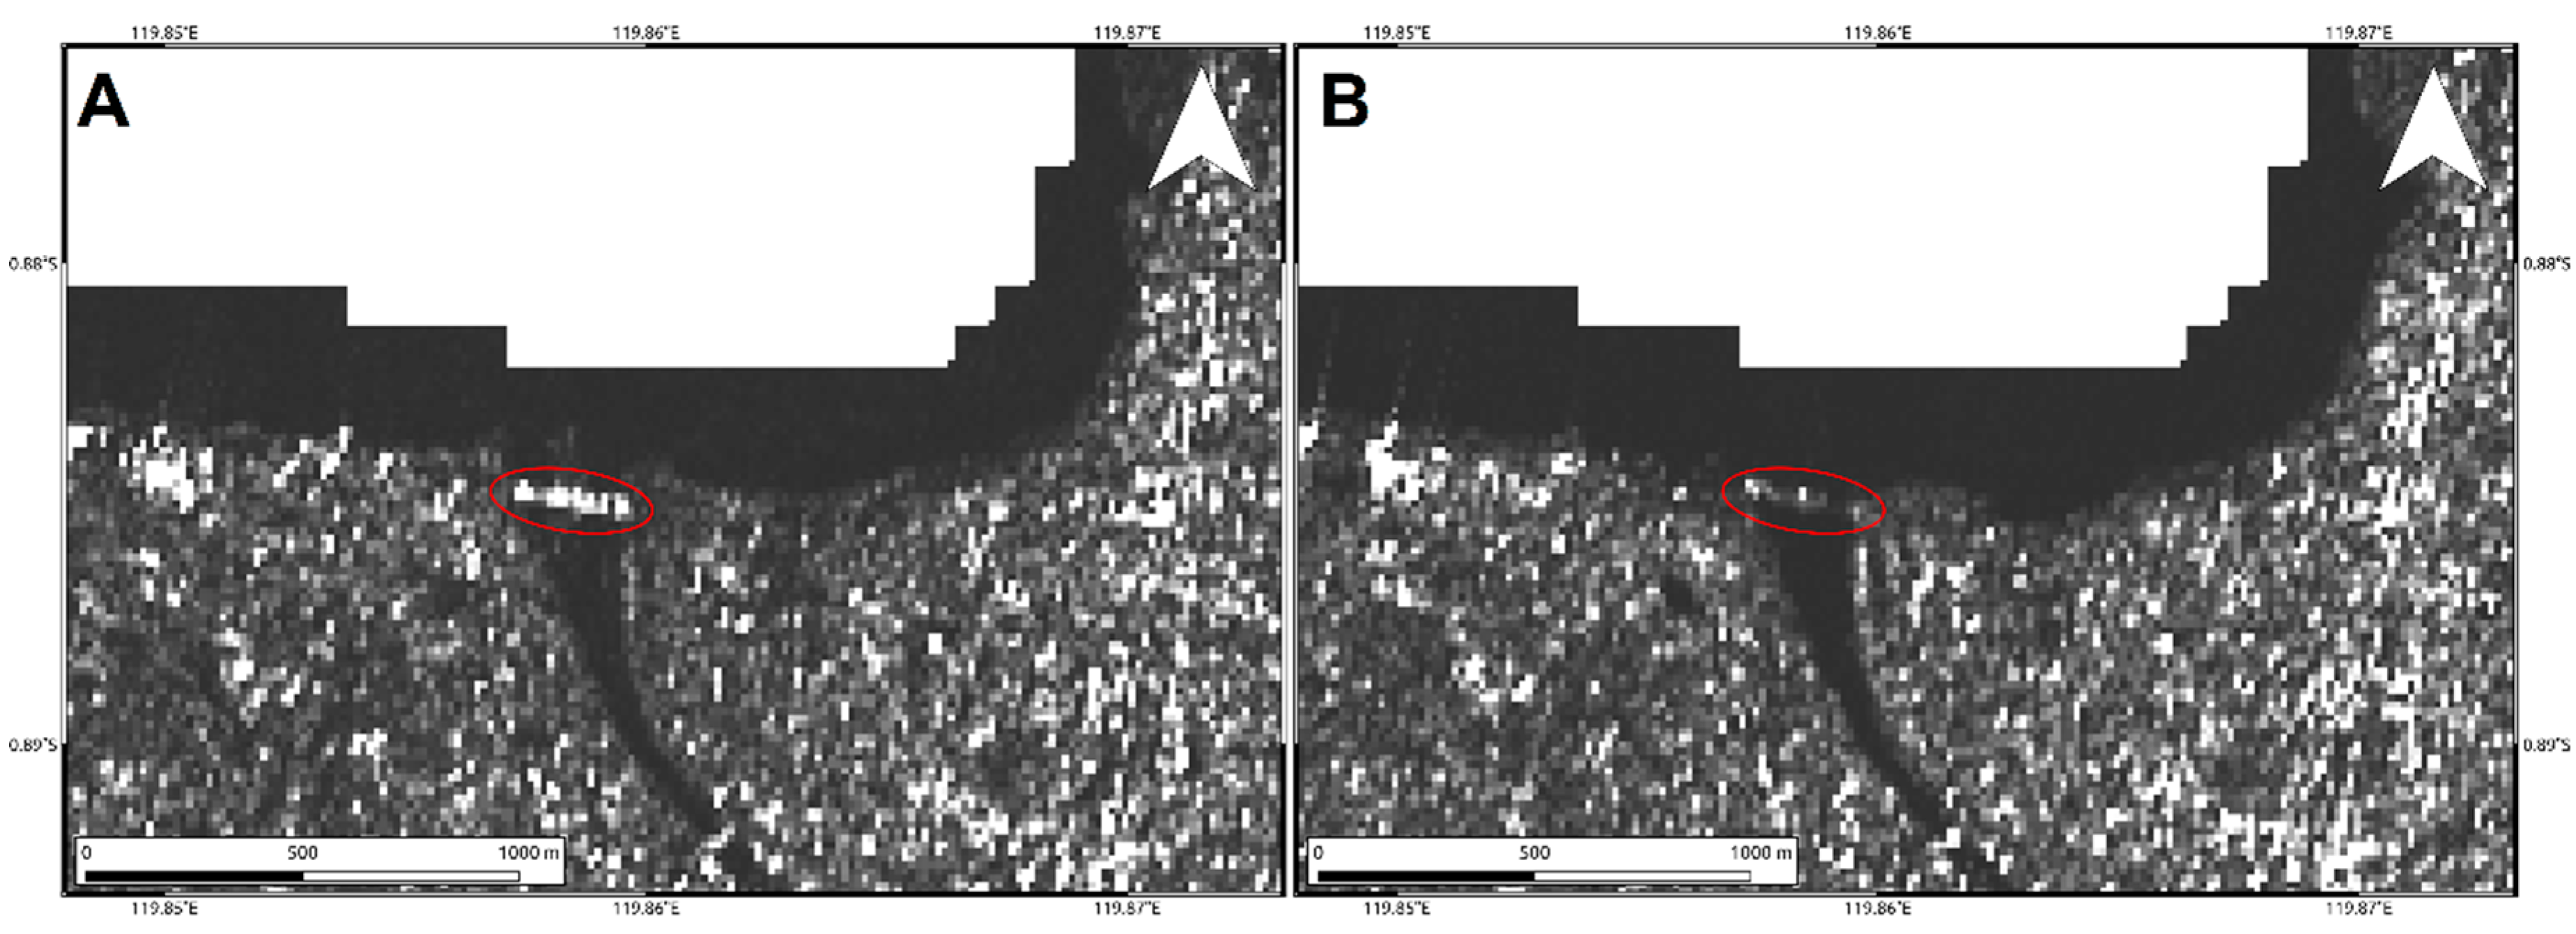
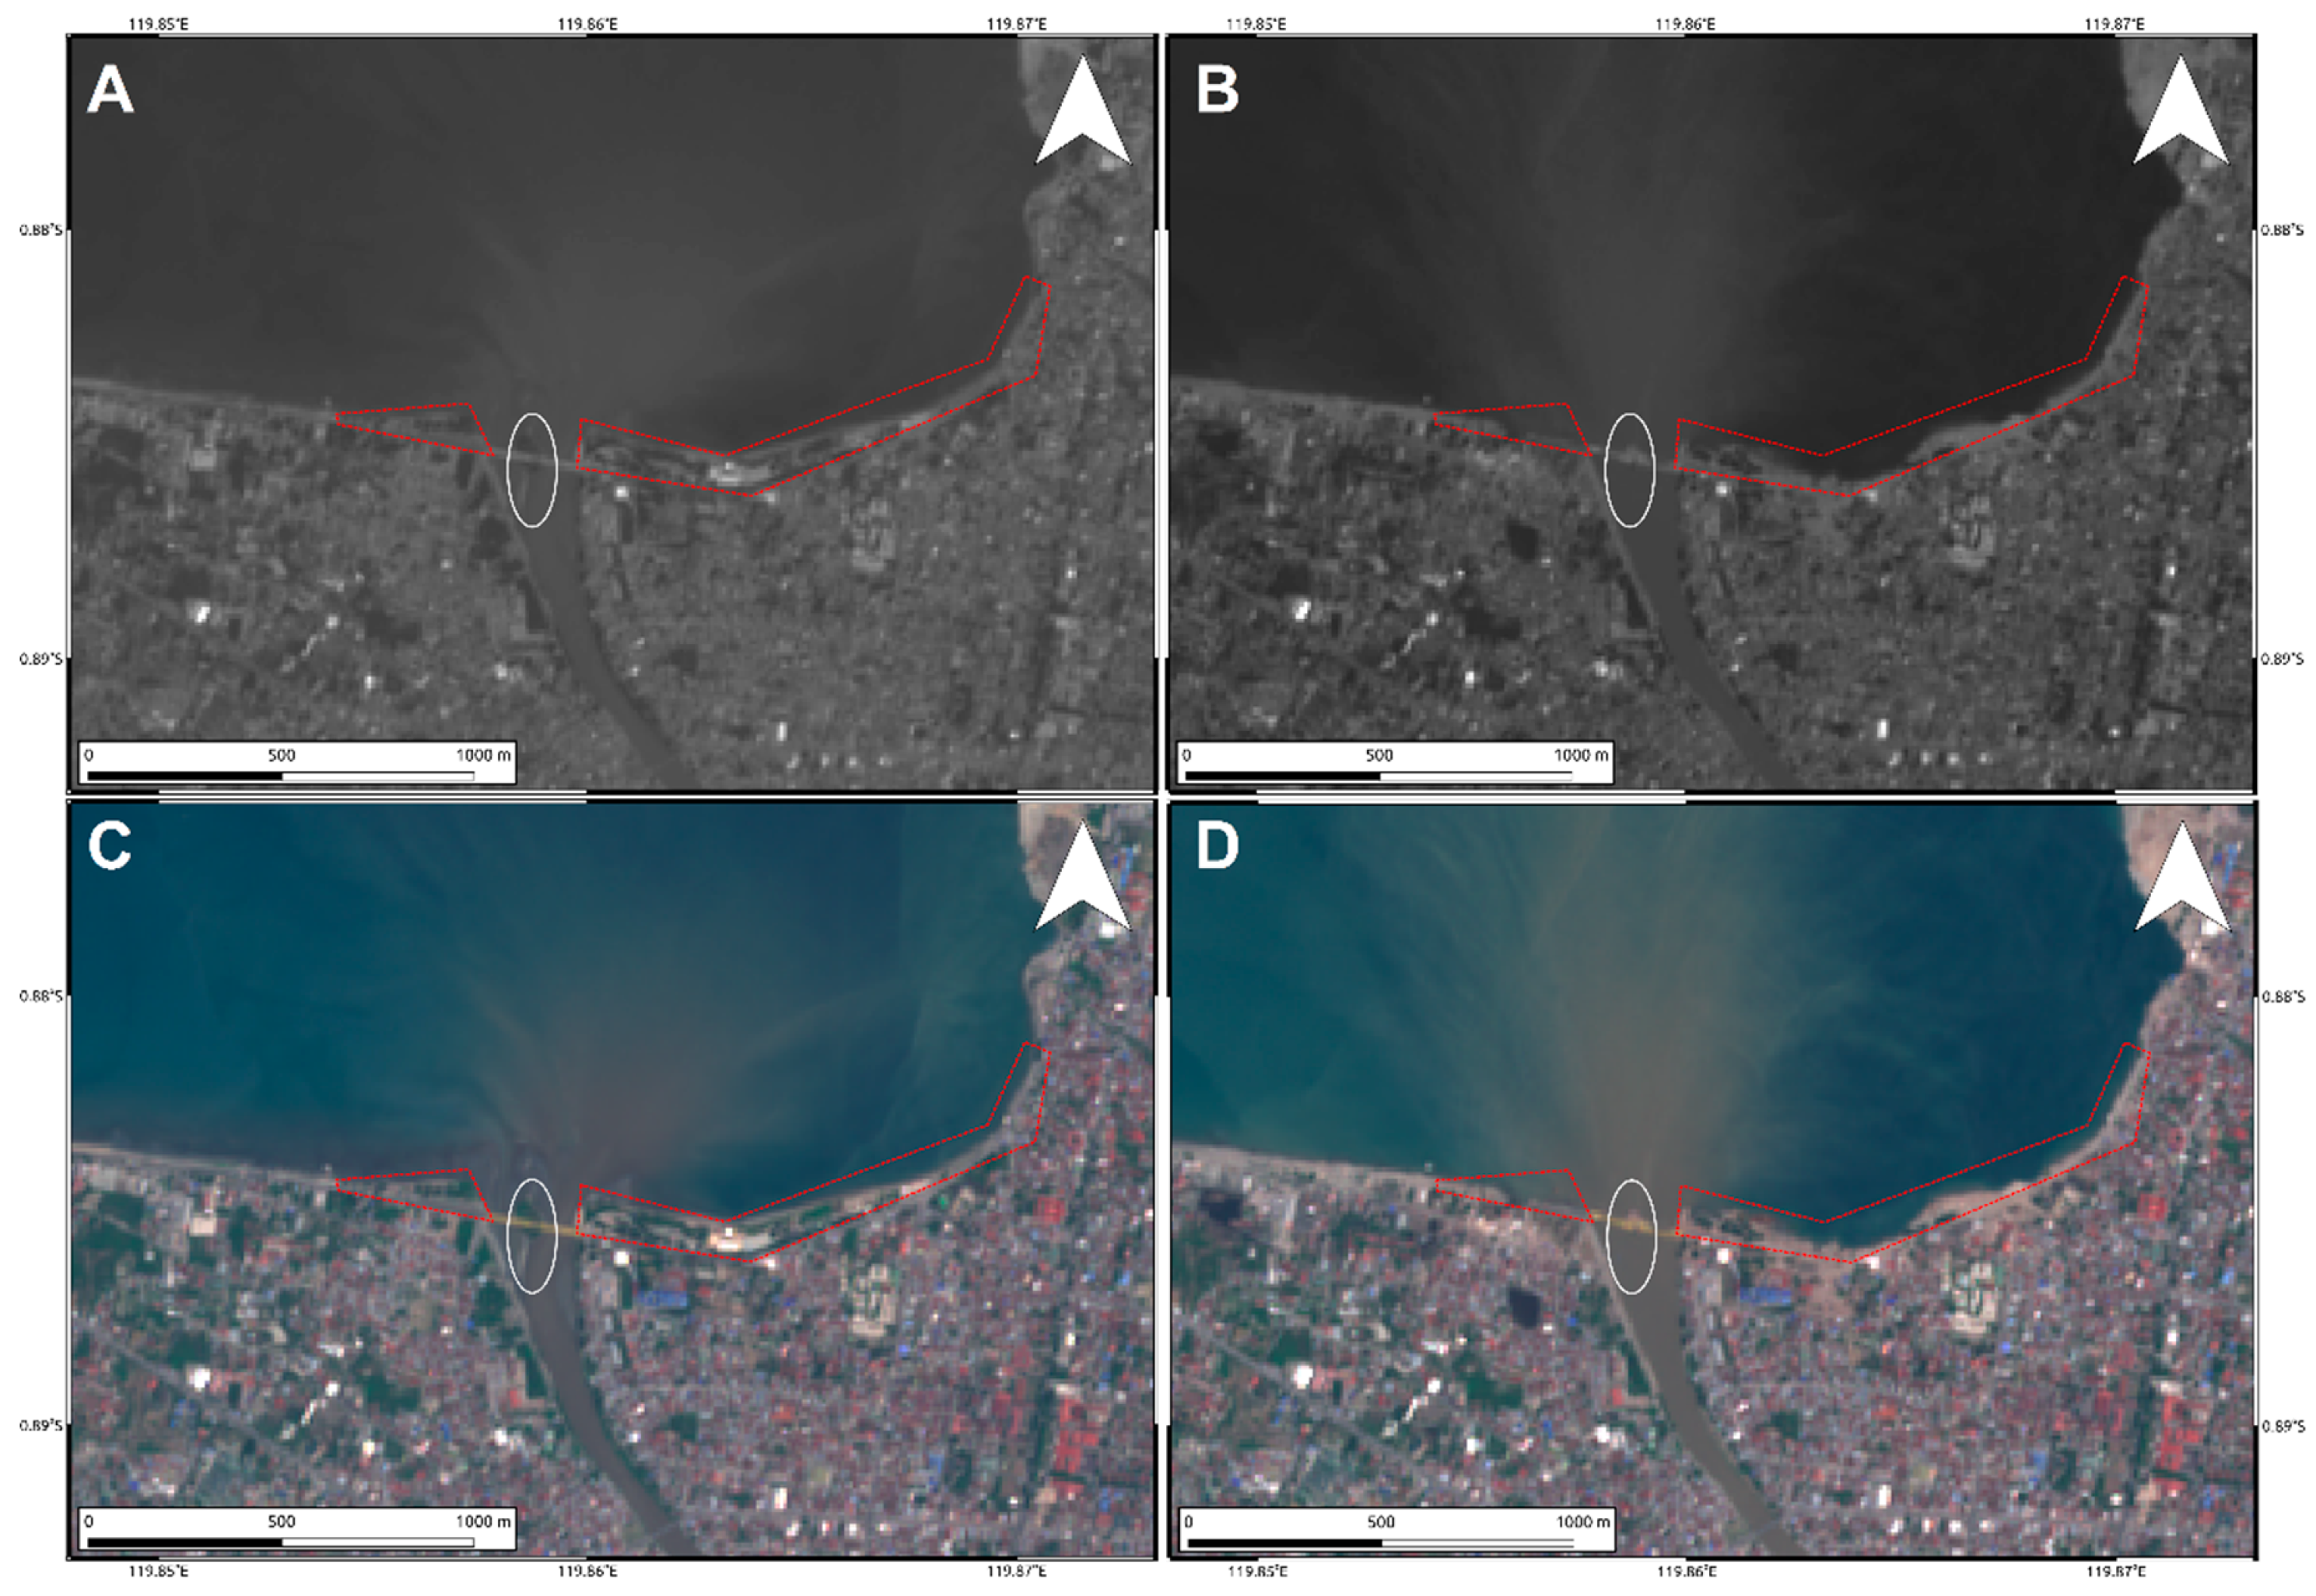
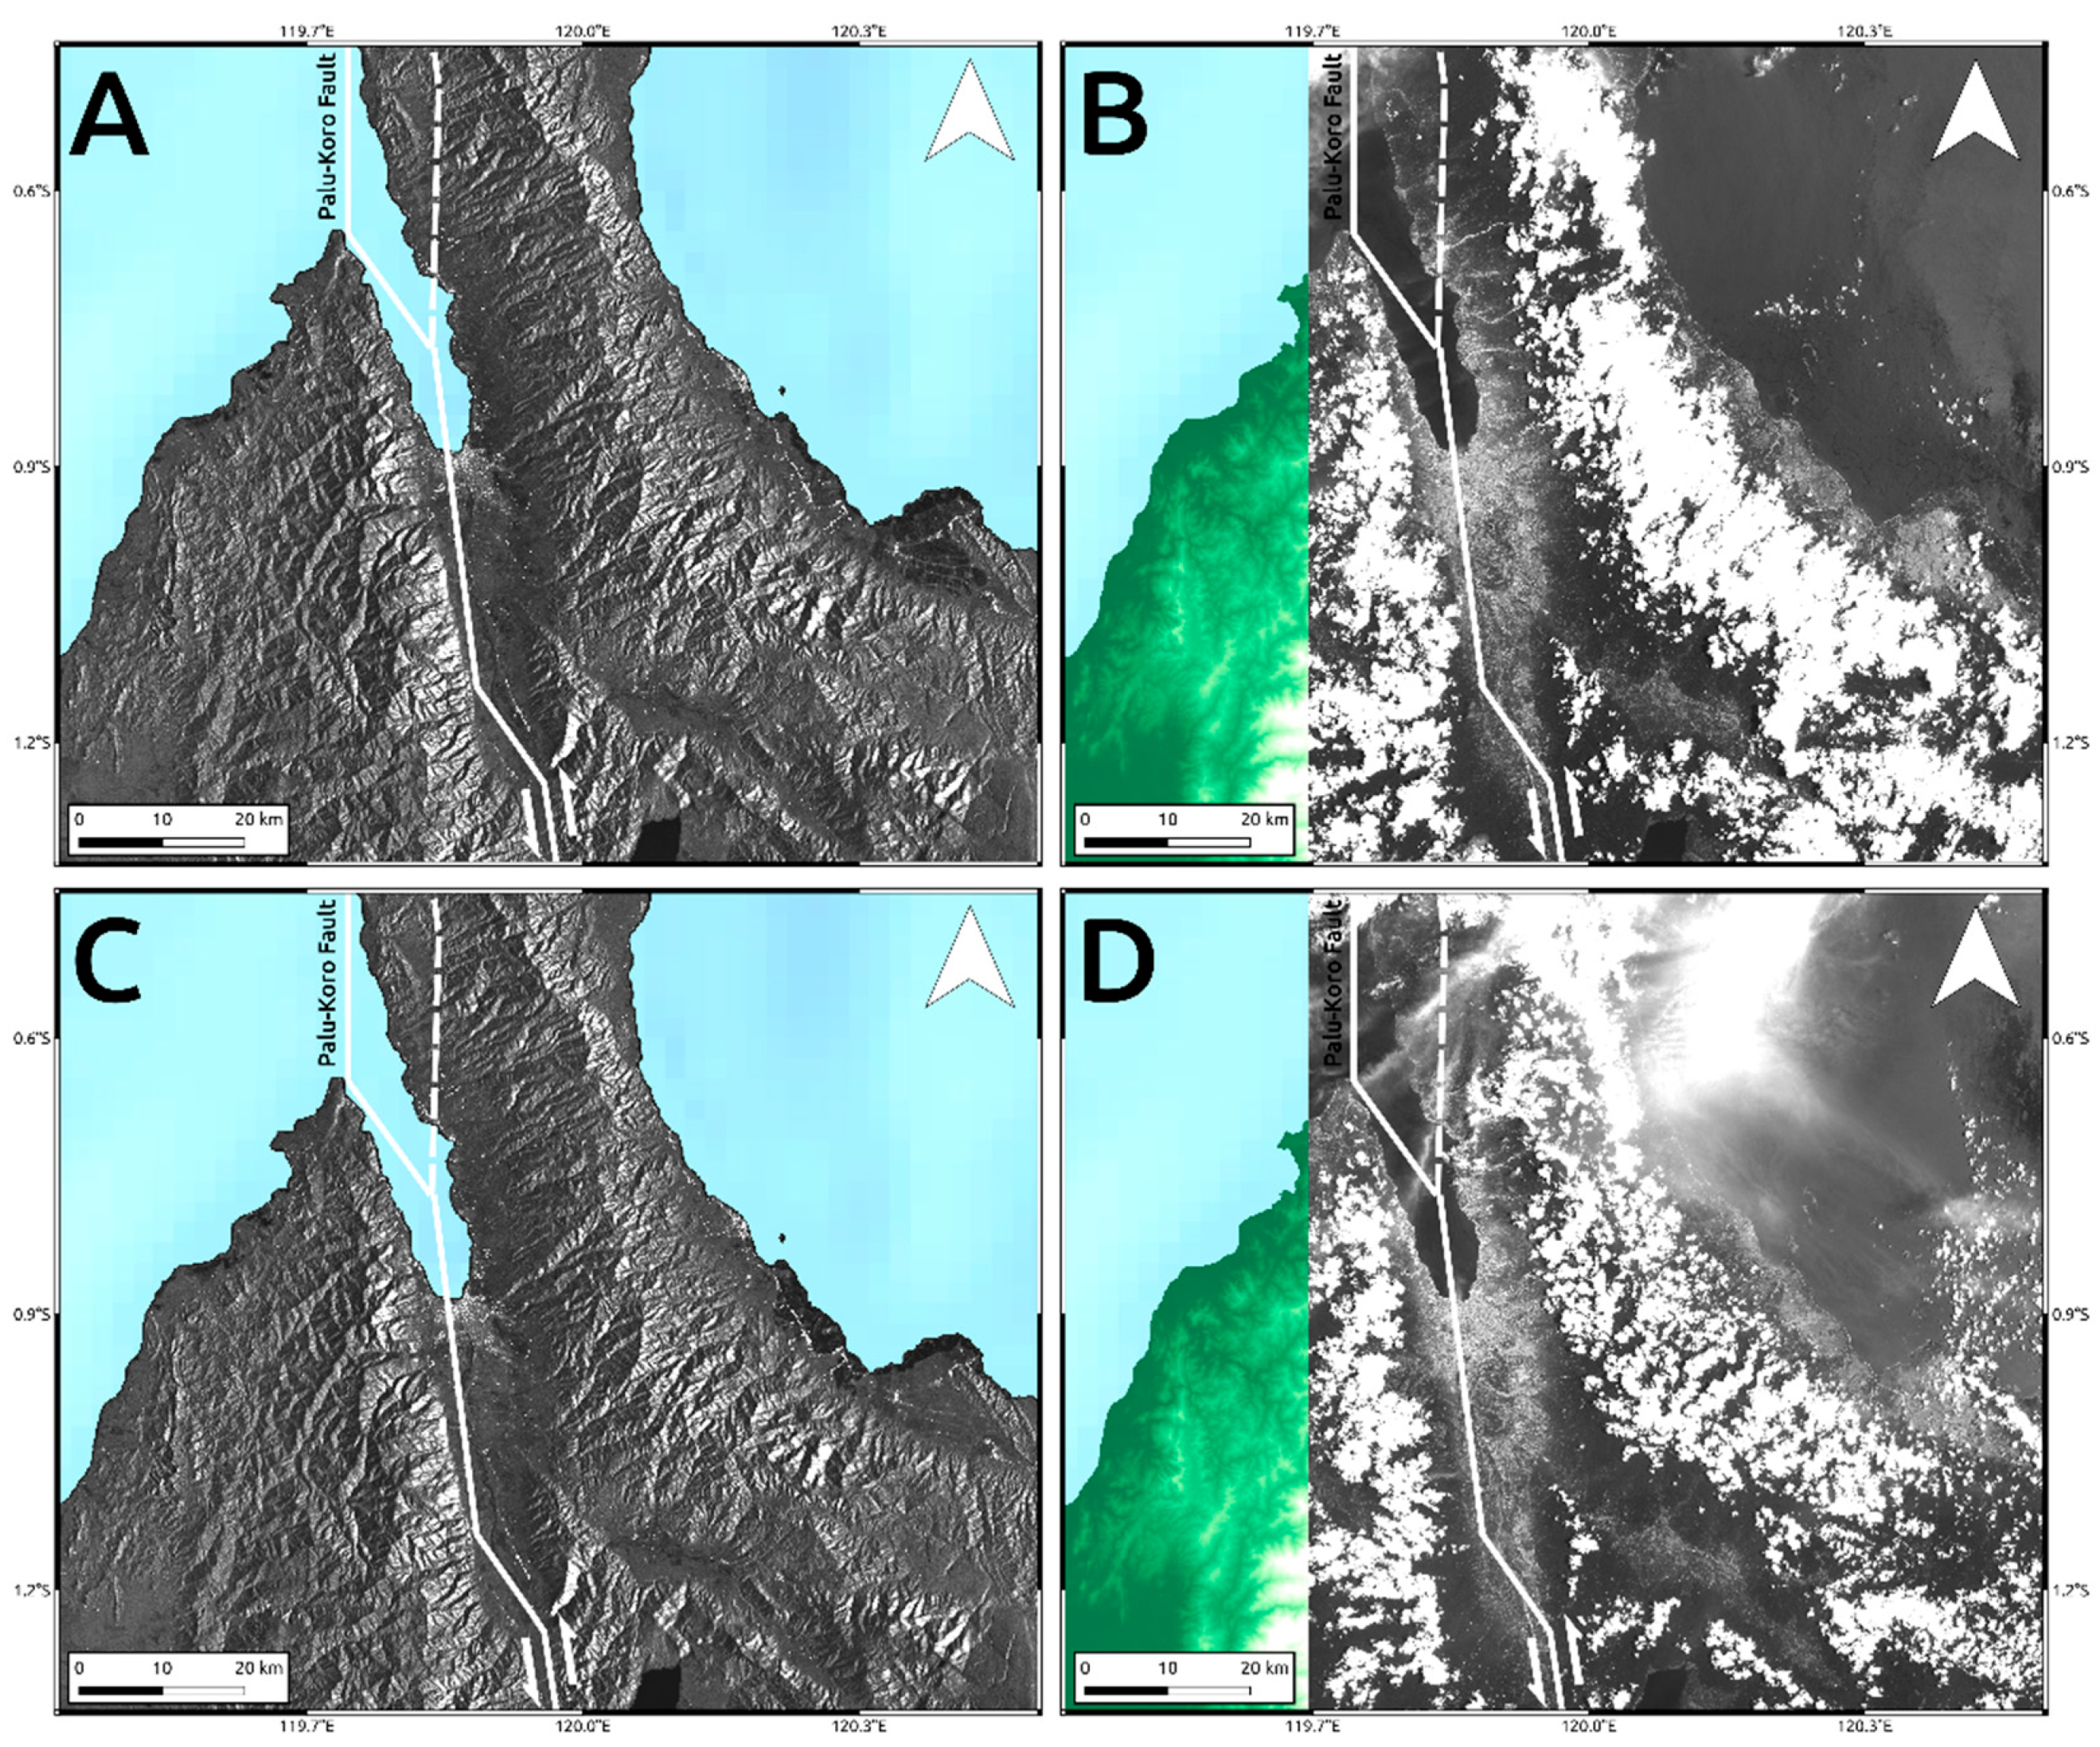
4. Results
5. Discussion
6. Conclusions
Author Contributions
Funding
Acknowledgments
Conflicts of Interest
References
- Sassa, S.; Takagawa, T. Liquefied gravity flow-induced tsunami: First evidence and comparison from the 2018 Indonesia Sulawesi earthquake and tsunami disasters. Landslides 2019, 16, 195–200. [Google Scholar] [CrossRef]
- Heidarzadeh, M.; Muhari, A.; Wijanarto, A.B. Insights on the Source of the 28 September 2018 Sulawesi Tsunami, Indonesia Based on Spectral Analyses and Numerical Simulations. Pure Appl. Geophys. 2019, 176, 25–43. [Google Scholar] [CrossRef]
- Omira, R.; Dogan, G.G.; Hidayat, R.; Husrin, S.; Prasetya, G.; Annunziato, A.; Proietti, C.; Probst, P.; Paparo, M.A.; Wronna, M.; et al. The September 28th, 2018, Tsunami In Palu-Sulawesi, Indonesia: A Post-Event Field Survey. Pure Appl. Geophys. 2019, 176, 1379–1395. [Google Scholar] [CrossRef]
- Carvajal, M.; Araya-Cornejo, C.; Sepulveda, I.; Melnick, D.; Haase, J.S. Nearly instantaneous tsunamis following the Mw 7.5 2018 Palu earthquake. Geophys. Res. Lett. 2019, 46, 5117–5126. [Google Scholar] [CrossRef]
- United States Geological Survey (USGS). Available online: https://earthquake.usgs.gov/ (accessed on 18 December 2018).
- Wallace, L.M.; Stevens, C.; Silver, E.; McCaffrey, R.; Loratung, W.; Hasiata, S.; Stanaway, R.; Curley, R.; Rosa, R.; Taugaloidi, J. GPS and seismological constraints on active tectonics and arc-continent collision in Papua New Guinea: Implications for mechanics of microplate rotations in a plate boundary zone. J. Geophys. Res.: Sol. Ea. 2004, 109, B5. [Google Scholar] [CrossRef]
- Soquet, A.; Simons, W.; Vigny, C.; McCaffrey, R.; Subarya, C.; Sarsito, D.; Ambrosius, B.; Spakman, W. Microblock rotations and fault coupling in SE Asia triple junction (Sulawesi, Indonesia) from GPS and earthquake slip vector data. J. Geophys. Res. Sol. Ea. 2006, 111, B8. [Google Scholar] [CrossRef]
- Walpersdorf, A.; Vigny, C. Monitoring of the Palu-Koro Fault (Sulawesi) by GPS. Geophys. Res. Lett. 1998, 25, 2313–2316. [Google Scholar] [CrossRef] [Green Version]
- Bellier, O.; Sebrier, M.; Beaudouin, T.; Villeneuve, M.; Braucher, R.; Bourles, D.; Siame, L.; Putranto, E.; Pratomo, I. High slip rate for a low seismicity along the Palu-Koro active fault in central Sulawesi (Indonesia). Terra Nova 2001, 13, 463–470. [Google Scholar] [CrossRef]
- Watkinson, I.M.; Hall, R. Fault systems of the eastern Indonesian triple junction: Evaluation of Quaternary activity and implications for seismic hazards. Geol. Soc. SP. 2017, 441, 71–120. [Google Scholar] [CrossRef]
- Bao, H.; Ampuero, J.P.; Meng, L.; Fielding, E.J.; Liang, C.; Milliner, C.W.D.; Feng, T.; Huang, H. Early and persistent supershear rupture of the 2018 magnitude 7.5 Palu earthquake. Nat. Geosci. 2019, 200, 200–205. [Google Scholar] [CrossRef]
- Socquet, A.; Hollingsworth, J.; Pathier, E.; Bouchon, M. Evidence of supershear during the 2018 magnitude 7.5 Palu earthquake from space geodesy. Nat. Geosci. 2019, 12, 192–199. [Google Scholar] [CrossRef]
- Massonnet, D.; Rossi, M.; Carmona, C.; Adragna, F.; Peltzer, G.; Feigl, K.; Rabaute, T. The displacement field of the Landers earthquake mapped by radar interferometry. Nature 1993, 364, 138–142. [Google Scholar] [CrossRef]
- Gray, A.; Mattar, K.E.; Vachon, P.W. InSAR results from the RADARSAT Antarctic mapping mission data: Estimation of glacier motion using a simple registration procedure. In Proceedings of the Geoscience and Remote Sensing (IGARSS), IEEE International Symposium, Seattle, WA, USA, 6–10 July 1998. [Google Scholar]
- Leprince, S.; Barbot, S.; Ayoub, F.; Avouac, J.P. Automatic and precise orthorectification, coregistration, and subpixel correlation of satellite images, application to ground deformation measurements. IEEE Trans. Geosci. Remote Sens. 2007, 45, 1529–1558. [Google Scholar] [CrossRef]
- GEM Global Active Faults. Available online: https://blogs.openquake.org/hazard/ (accessed on 13 March 2019).
- Shuttle Radar Topography Mission (SRTM). Available online: https://www2.jpl.nasa.gov/srtm/ (accessed on 11 January 2019).
- Wegmuller, U.; Werner, C. Gamma SAR processor and interferometry software. In Proceedings of the ERS Symposium on Space at the Service of Our Environment, Florence, Italy, 14–21 March 1997; ESA Publications Division: Florence, Italy, 1997; pp. 1687–1692. [Google Scholar]
- Goldstein, R.; Werner, C. Radar interferogram filtering for geophysical applications. Geophys. Res. Lett. 1998, 25, 4035–4038. [Google Scholar] [CrossRef] [Green Version]
- Song, X.; Zhang, Y.; Shan, X.; Liu, Y.; Gong, W.; Qu, C. Geodetic observations of the 2018 Mw 7.5 Sulawesi earthquake and its implications for the kinematics of the Palu fault. Geophys. Res. Lett. 2019, 46, 4212–4220. [Google Scholar] [CrossRef]
- Fang, J.; Xu, C.; Wen, Y.; Wang, S.; Xu, G.; Zhao, Y.; Yi, L. The 2018 Mw 7.5 Palu Earthquake: A Supershear Rupture Event Constrained by InSAR and Broadband Regional Seismograms. Remote Sens. 2019, 11, 1330. [Google Scholar] [CrossRef]
- Merryman Boncori, J.P.M. Measuring coseismic deformation with spaceborn synthetic aperture radar: A review. Front. Earth Sci. 2019, 7, 1–21. [Google Scholar] [CrossRef]
- Pritchard, H.; Murray, T.; Luckman, A.; Strozzi, T.; Barr, S. Glacier surge dynamics of Sortebræ, east Greenland, from synthetic aperture radar feature tracking. J. Geophys. Res. 2005, 110, F3. [Google Scholar] [CrossRef]
- Geohazards Exploitation Platform (GEP). Available online: https://geohazards-tep.eu/ (accessed on 5 January 2019).
- Stumpf, A.; Malet, J.P.; Delacourt, C. Correlation of satellite image time-series for the detection and monitoring of slow-moving landslides. Remote Sens. Environ. 2017, 189, 40–55. [Google Scholar] [CrossRef]
- Twitter. Available online: https://twitter.com/vulkanologi_mbg/status/1050396131216175105 (accessed on 11 October 2018).
- AGU Blogs. Available online: https://blogs.agu.org/landslideblog/2018/10/02/ (accessed on 17 February 2019).
- NASA Earth Observatory. Available online: https://earthobservatory.nasa.gov/images/92836/ (accessed on 25 February 2019).
- Paulik, R.; Gusman, A.; Williams, J.H.; Pratama, G.M.; Lin, S.-L.; Prawirabhakti, A.; Sulendra, K.; Zachari, M.Y.; Fortuna, Z.E.D.; Layuk, N.B.P.; et al. Tsunami Hazard and Built Environment Damage Observations from Palu City after the September 28 2018 Sulawesi Earthquake and Tsunami. Pure Appl. Geophys. 2019, 1–17. [Google Scholar] [CrossRef]
- Widiyanto, W.; Santoso, P.B.; Hsiao, S.-C.; Imananta, R.T. Post-event Field Survey of 28 September 2018 Sulawesi Earthquake and Tsunami. Nat. Hazards Earth Syst. Sci. 2019, 1, 1–23. [Google Scholar] [CrossRef]
- The Guardian. Available online: https://www.theguardian.com/world/ng-interactive/2018/oct/01/indonesia-sulawesi-palu-earthquake-tsunami-map-visual (accessed on 13 March 2019).
- EMSC. Available online: https://www.emsc-csem.org/Files/news/Earthquakes_reports/Palu_earthquake_EMSC_report_19-10-2018.pdf (accessed on 20 December 2018).
- Rupnik, E.; Daakir, M.; Pierrot-Deseilligny, M. MicMac—A free, open-source solution for photogrammetry. Open Geosp. Data, Soft. Stand. 2017, 2. [Google Scholar] [CrossRef]
- Ayoub, F.; Leprince, L.; Avouac, J.-P. User’s Guide to COSI-CORR: Co-registration of Optically Sensed Images and Correlation (California Institute of Technology, 2015). Available online: http://www.tectonics.caltech.edu/slip_history/spot_coseis/pdf_files/CosiCorr-Guide2017.pdf (accessed on 15 January 2019).
- Debella-Gilo, M.; Kääb, A. Sub-pixel precision image matching for measuring surface displacements on mass movements using normalized cross-correlation. Remote Sens. Environ. 2011, 115, 130–142. [Google Scholar] [CrossRef] [Green Version]
- Copernicus-Europe’s Eyes on Earth. Available online: https://www.copernicus.eu/en (accessed on 4 April 2019).


| Satellite | Mean [m] | Min [m] | Max [m] | σ [m] |
|---|---|---|---|---|
| ALOS-2 | 0.40 | −4.73 | 5.88 | 1.62 |
| Sentinel-1 | 0.43 | −4.15 | 4.70 | 1.90 |
| Sentinel-2 | 0.31 | −4.8 | 6.5 | 1.49 |
© 2019 by the authors. Licensee MDPI, Basel, Switzerland. This article is an open access article distributed under the terms and conditions of the Creative Commons Attribution (CC BY) license (http://creativecommons.org/licenses/by/4.0/).
Share and Cite
Polcari, M.; Tolomei, C.; Bignami, C.; Stramondo, S. SAR and Optical Data Comparison for Detecting Co-Seismic Slip and Induced Phenomena during the 2018 Mw 7.5 Sulawesi Earthquake. Sensors 2019, 19, 3976. https://0-doi-org.brum.beds.ac.uk/10.3390/s19183976
Polcari M, Tolomei C, Bignami C, Stramondo S. SAR and Optical Data Comparison for Detecting Co-Seismic Slip and Induced Phenomena during the 2018 Mw 7.5 Sulawesi Earthquake. Sensors. 2019; 19(18):3976. https://0-doi-org.brum.beds.ac.uk/10.3390/s19183976
Chicago/Turabian StylePolcari, Marco, Cristiano Tolomei, Christian Bignami, and Salvatore Stramondo. 2019. "SAR and Optical Data Comparison for Detecting Co-Seismic Slip and Induced Phenomena during the 2018 Mw 7.5 Sulawesi Earthquake" Sensors 19, no. 18: 3976. https://0-doi-org.brum.beds.ac.uk/10.3390/s19183976