A High-Sensitivity Methane Sensor with Localized Surface Plasmon Resonance Behavior in an Improved Hexagonal Gold Nanoring Array


Abstract
:1. Introduction
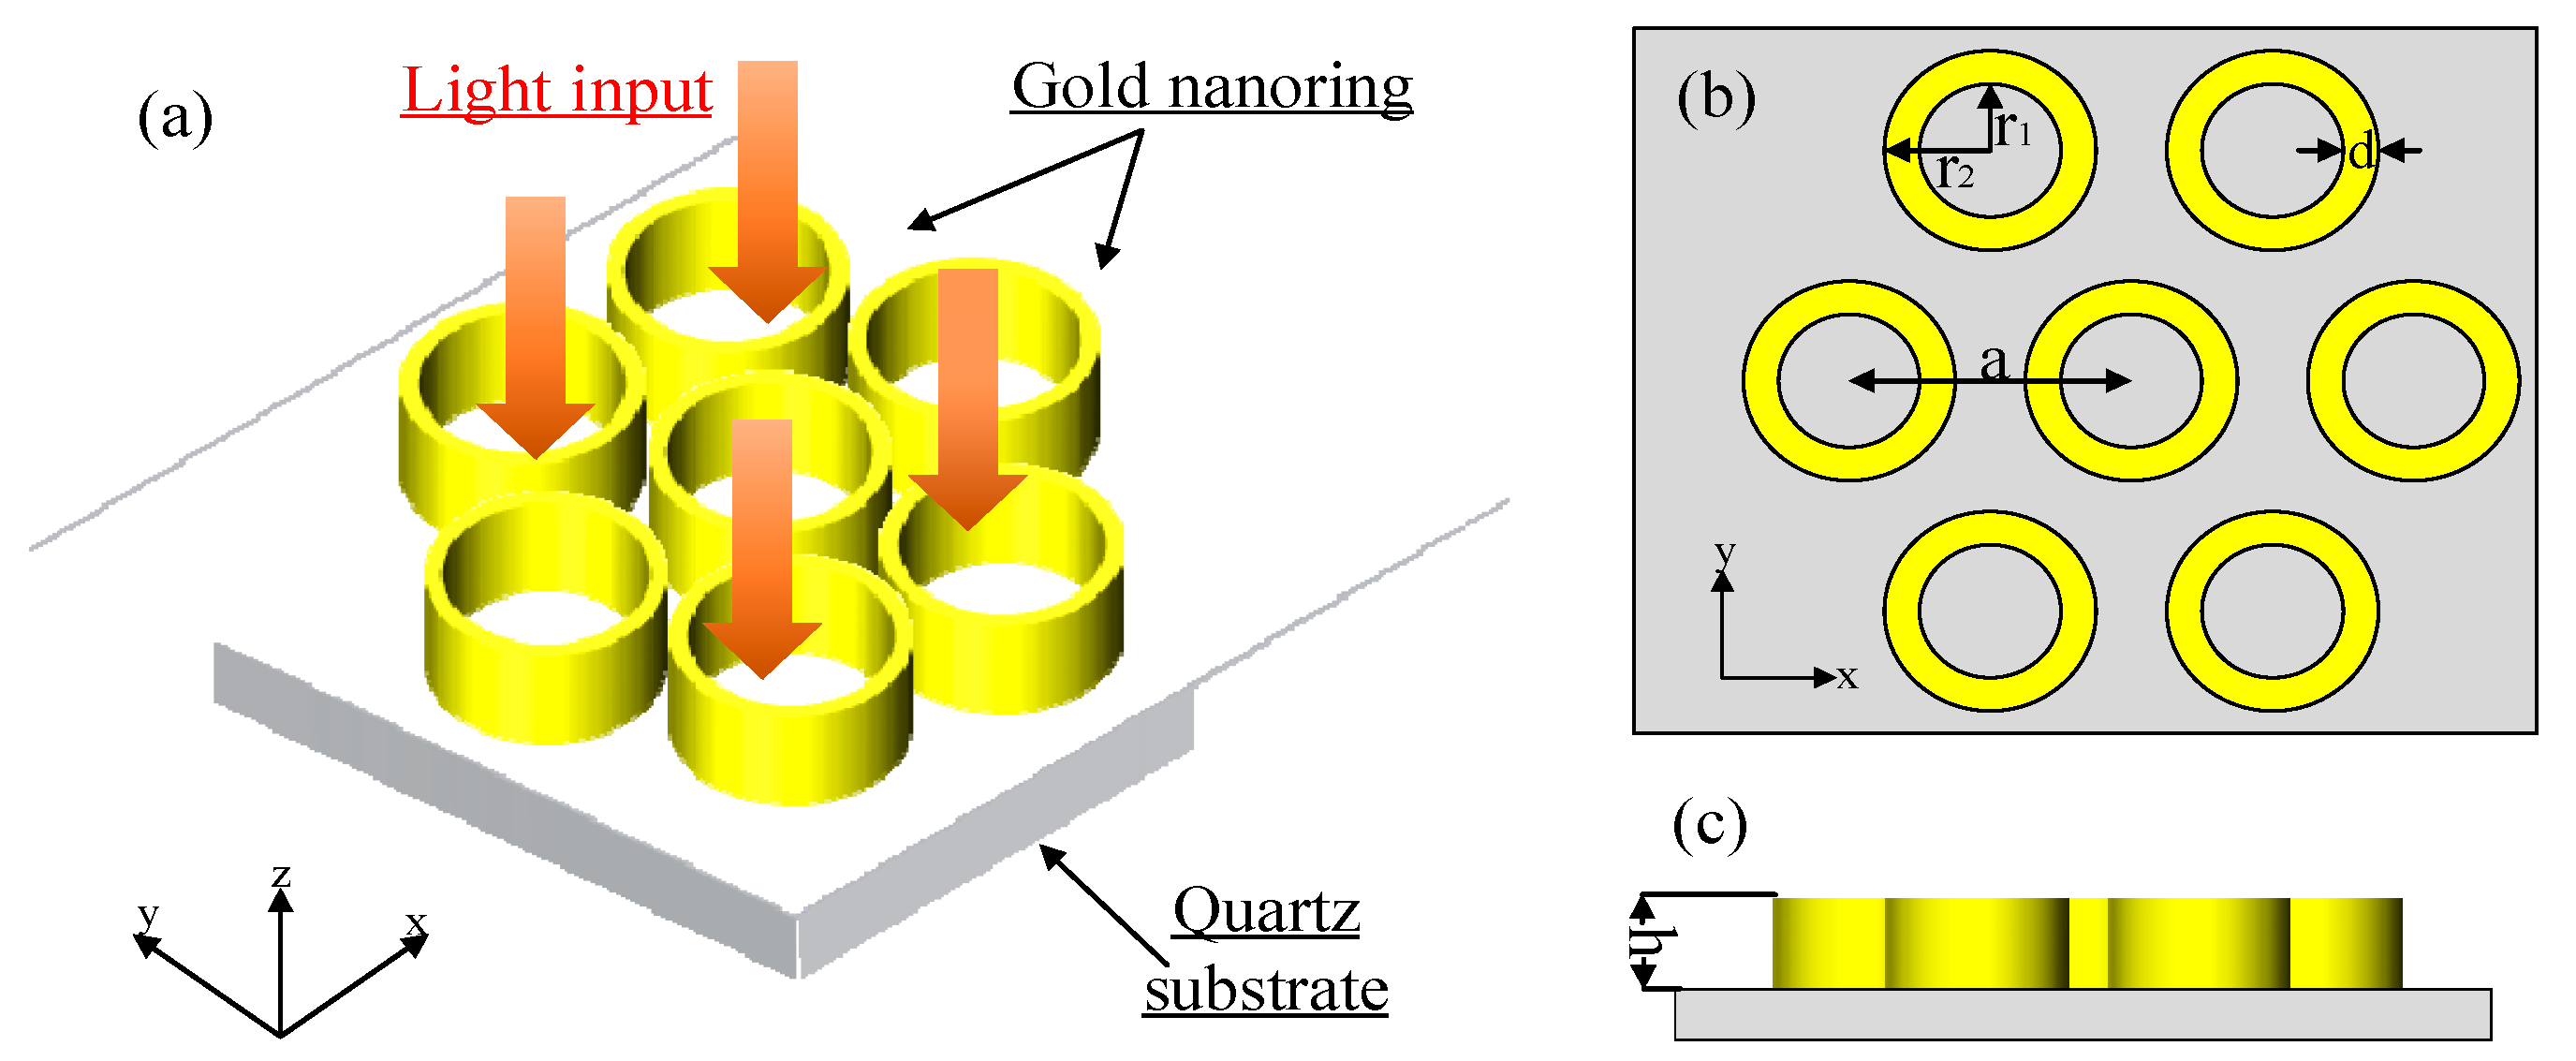
2. Sensing Principles and Model Optimization
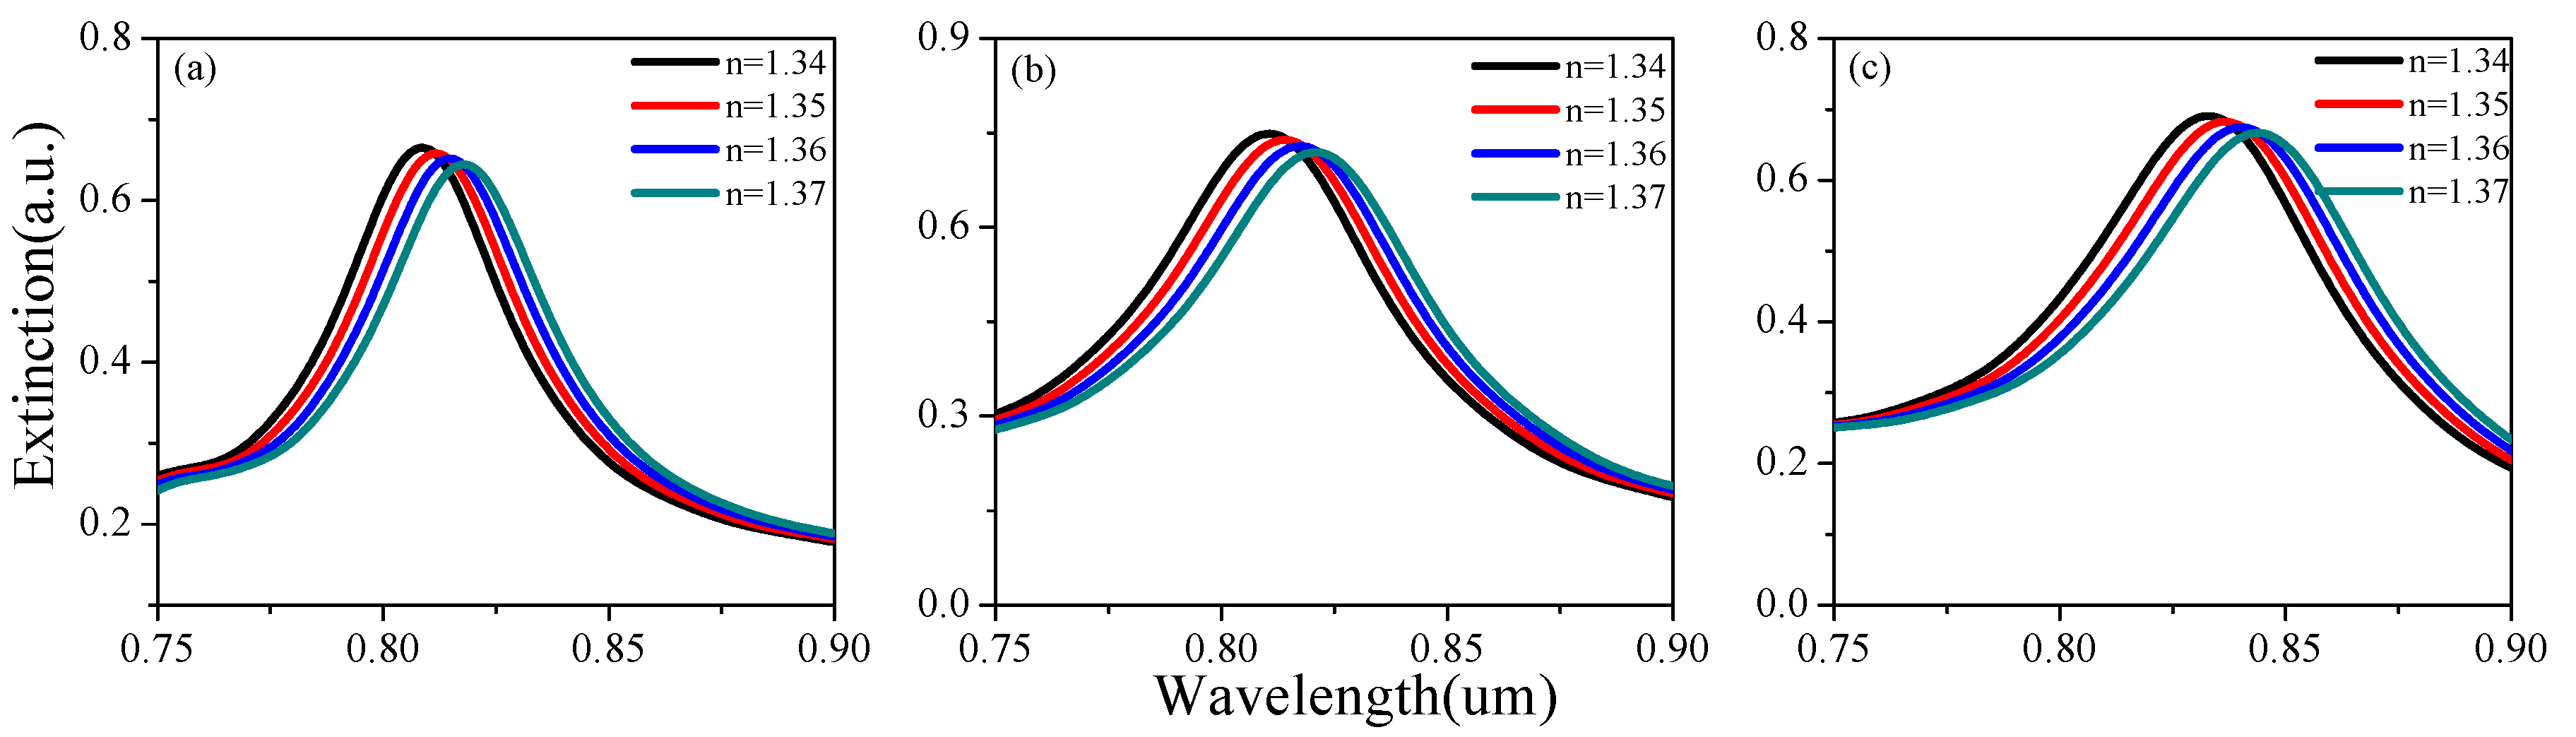
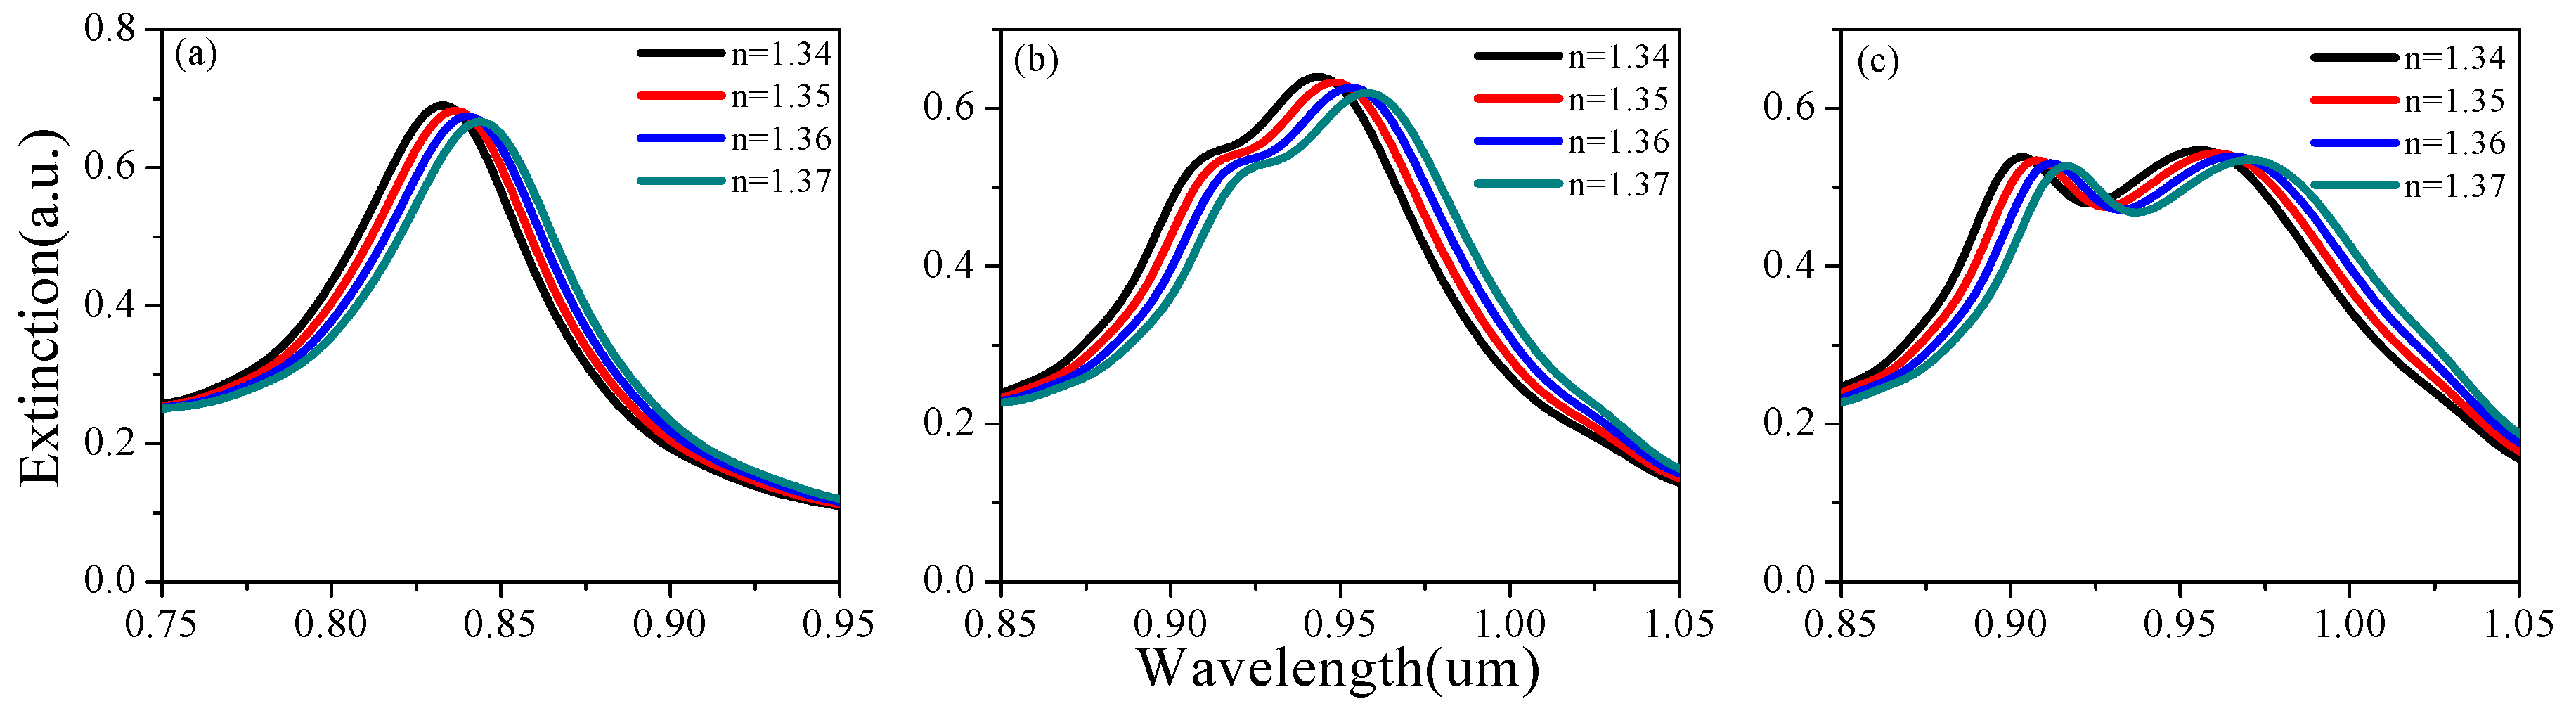
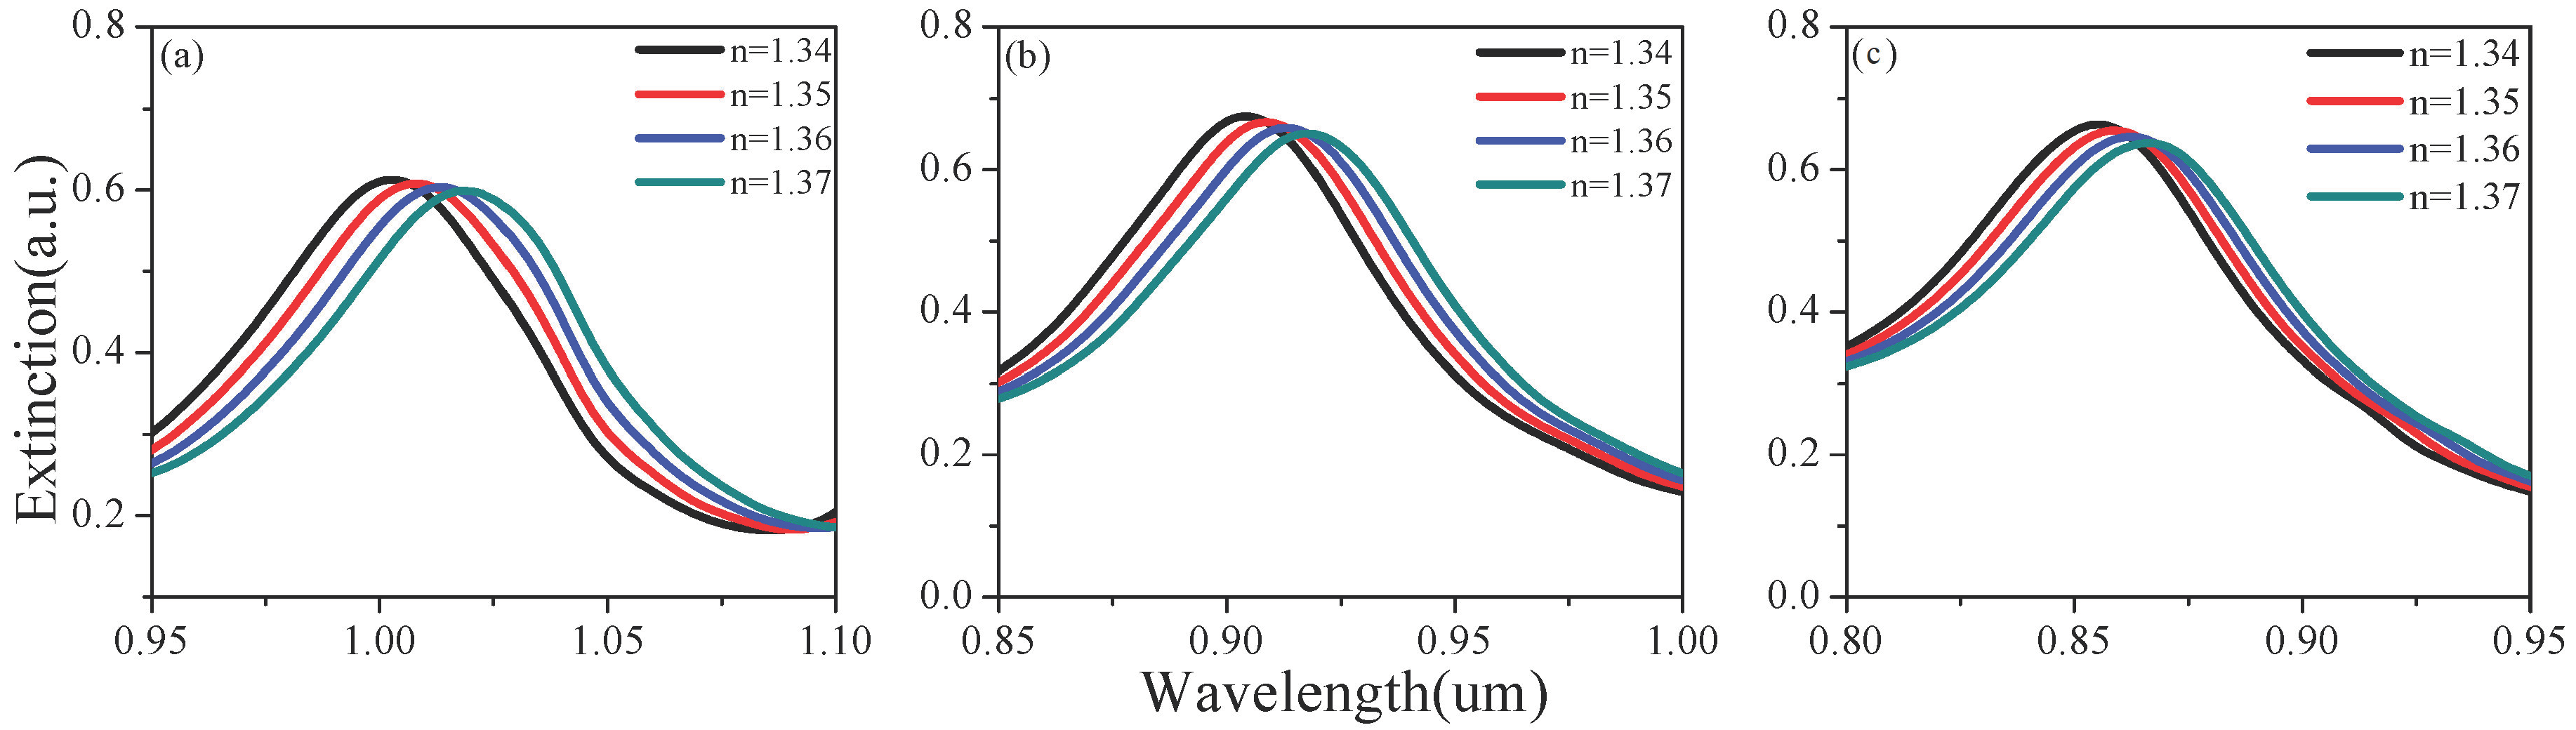
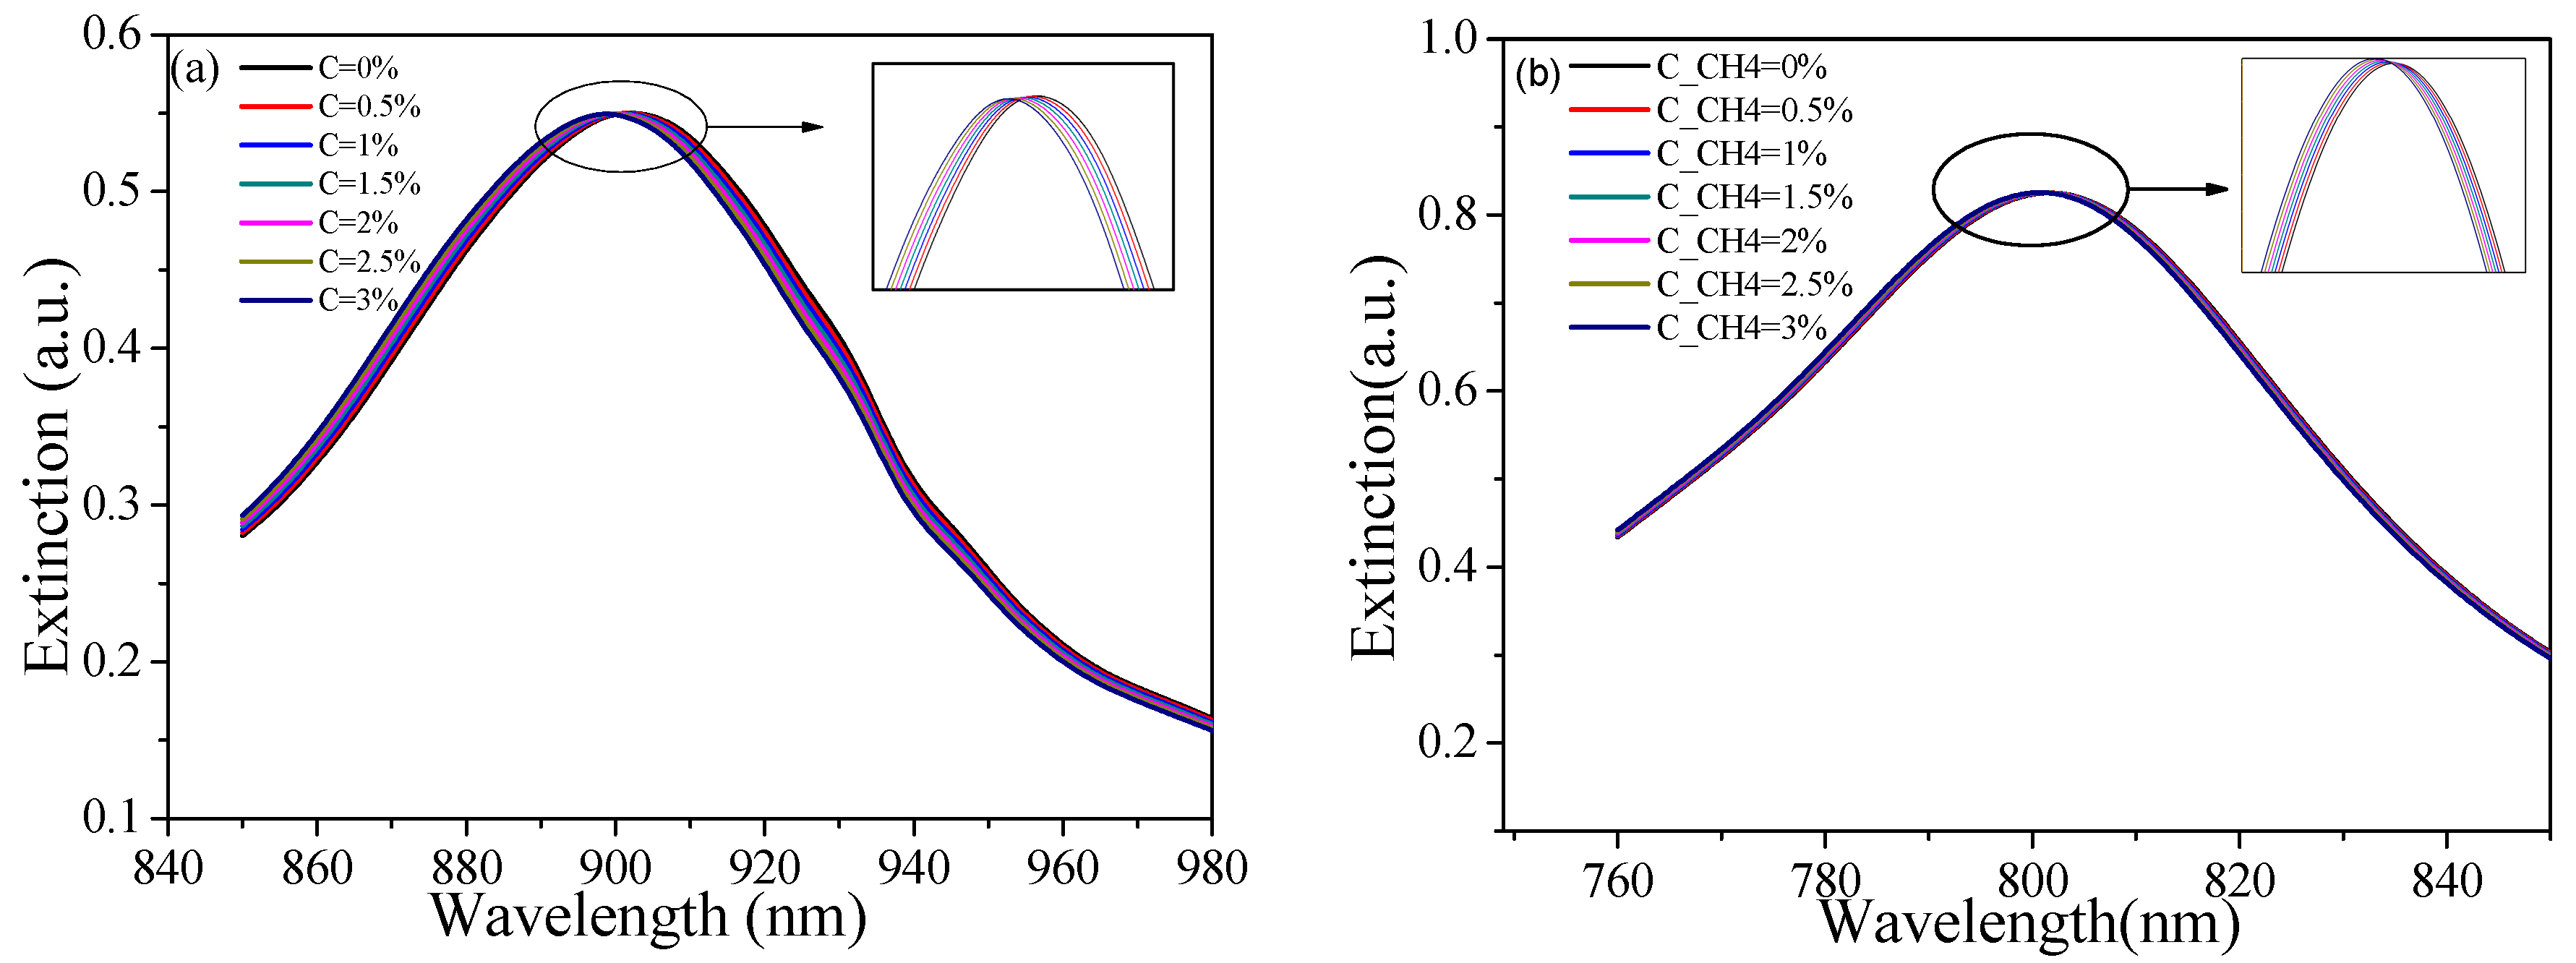
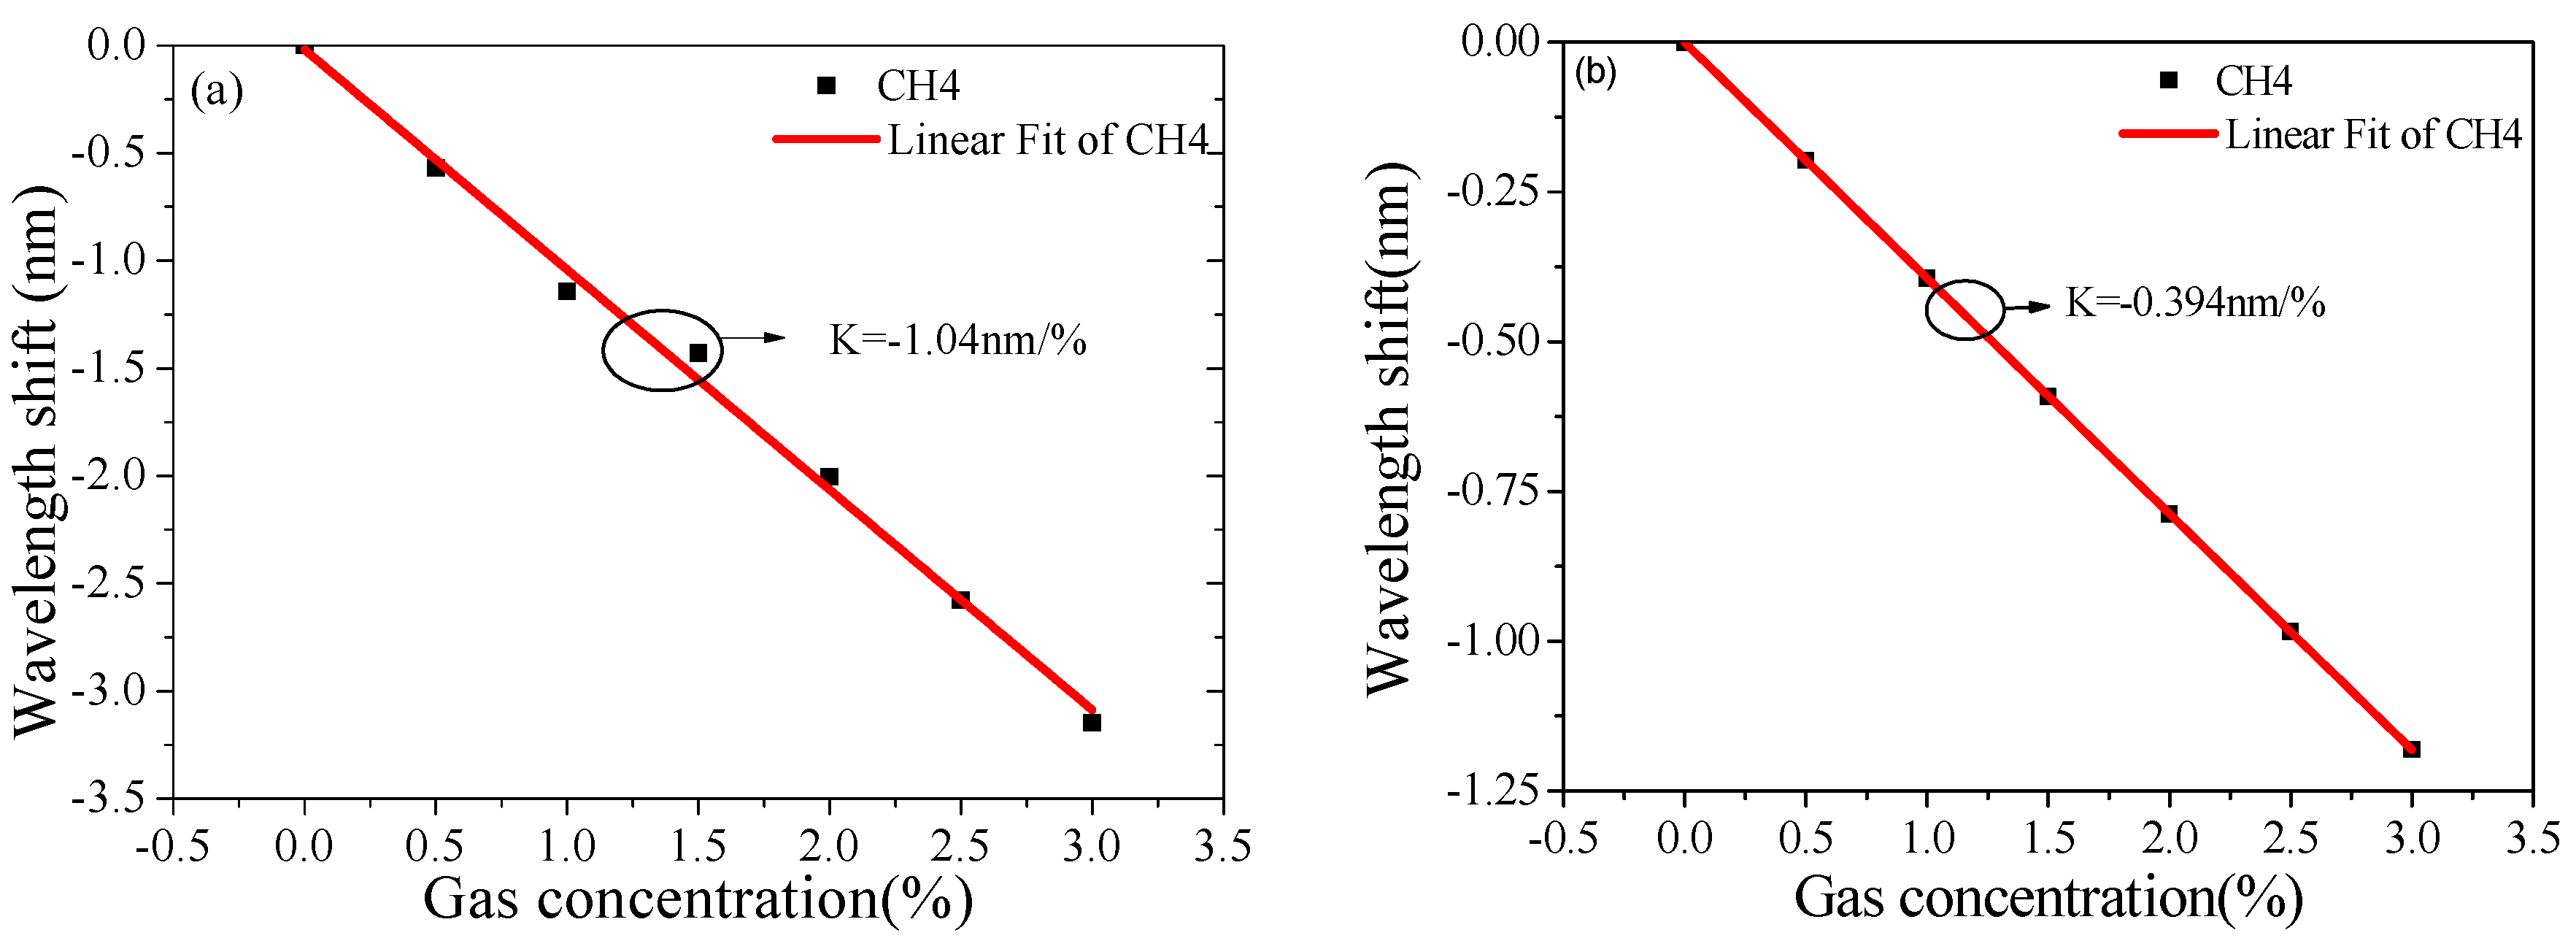
3. Results and Discussion
4. Conclusions
Author Contributions
Funding
Conflicts of Interest
References
- Liu, C.; Wang, F. A highly temperature-sensitive photonic crystal fiber based on surface plasmon resonance. Opt. Commun. 2016, 359, 378–382. [Google Scholar] [CrossRef]
- Seifouri, M.; Rouini, M.A.; Olyaee, S. Design of a surface plasmon resonance biosensor based on photonic crystal fiber with elliptical holes. Opt. Rev. 2018, 25, 555–562. [Google Scholar] [CrossRef]
- Liu, C.; Yang, L. Numerical analysis of a photonic crystal fiber based on a surface plasmon resonance sensor with an annular analyte channel. Opt. Commun. 2017, 382, 162–166. [Google Scholar] [CrossRef]
- An, G.; Li, S.; Qin, W.; Zhang, W.; Fan, Z.; Bao, Y. High-Sensitivity Refractive Index Sensor Based on D-Shaped Photonic Crystal Fiber with Rectangular Lattice and Nanoscale Gold Film. Plasmonics 2014, 9, 1355–1360. [Google Scholar] [CrossRef]
- Mahani, F.F.; Mokhtari, A.; Mehran, M. Dual mode operation, highly selective nanohole array-based plasmonic colour filters. Nanotechnology 2017, 28, 385203. [Google Scholar] [CrossRef]
- Paul, D.; Biswas, R. [INVITED] Highly sensitive LSPR based photonic crystal fiber sensor with embodiment of nanospheres in different material domain. Opt. Laser Technol. 2018, 101, 379–387. [Google Scholar] [CrossRef]
- Chen, J.; Zhang, Q.; Peng, C.; Tang, C.; Shen, X.; Deng, L.; Park, G. Optical Cavity-Enhanced Localized Surface Plasmon Resonance for High-Quality Sensing. IEEE Photonics Technol. Lett. 2018, 30, 728–731. [Google Scholar] [CrossRef]
- Jiao, S.; Gu, S. Research on dual-core photonic crystal fiber based on local surface plasmon resonance sensor with silver nanowires. J. Nanophotonics 2018, 12, 1. [Google Scholar] [CrossRef]
- Chamanzar, M.; Xia, Z.; Yegnanarayanan, S.; Adibi, A. Hybrid integrated plasmonic-photonic waveguides for on-chip localized surface plasmon resonance (LSPR) sensing and spectroscopy. Opt. Express 2013, 21, 32086. [Google Scholar] [CrossRef]
- Xu, X.; Hu, X.; Chen, X.; Kang, Y.; Zhang, Z.B.; Parizi, K.; Wong, H.S.P. Engineering a Large Scale Indium Nanodot Array for Refractive Index Sensing. ACS Appl. Mater. Interfaces 2016, 8, 31871–31877. [Google Scholar] [CrossRef]
- Lu, X.R.; Liu, F.T. High-sensitivity plasmonic sensor based on perfect absorber with metallic nanoring structures. J. Mod. Opt. 2016, 63, 177–183. [Google Scholar] [CrossRef]
- Tsai, C.; Lu, S.; Lin, J.; Lee, P. High sensitivity plasmonic index sensor using slablike gold nanoring arrays. Appl. Phys. Lett. 2011, 98, 153108. [Google Scholar] [CrossRef] [PubMed] [Green Version]
- Chen, C.D.; Cheng, S.F.; Chau, L.K.; Wang, C.R.C. Sensing capability of the localized surface plasmon resonance of gold nanorods. Biosens. Bioelectron. 2007, 22, 926–932. [Google Scholar] [CrossRef] [PubMed]
- Kim, S.W.; Cha, S.H.; Kang, B.H.; Lee, S.W.; Kang, S.W. Optical gas sensor based on LSPR using ZnO nanoparticles and AAO nanostructure. In Proceedings of the 2015 IEEE SENSORS, Busan, Korea, 1–4 November 2015; pp. 1–3. [Google Scholar]
- Qadami, F.; Molaeirad, A.; Alijanianzadeh, M.; Azizi, A.; Kamali, N. Localized Surface Plasmon Resonance (LSPR)-Based Nanobiosensor for Methamphetamin Measurement. Plasmonics 2018, 13, 2091–2098. [Google Scholar] [CrossRef]
- Semwal, V.; Gupta, B.D. LSPR and SPR Based Fiber Optic Cholesterol Sensor using Immobilization of Cholesterol Oxidase over Silver Nanoparticles Coated Graphene Oxide Nanosheets. IEEE Sens. J. 2018, 18, 1039–1046. [Google Scholar] [CrossRef]
- Wang, S.; Sun, X.M.; Peng, G.; Qi, Y.; Wang, Y.; Ren, J. The investigation of an LSPR refractive index sensor based on periodic gold nanorings array. J. Phys. D Appl. Phys. 2018, 51, 45101. [Google Scholar] [CrossRef]
- Malani, S.B.; Viswanath, P. Impact of ordering of gold nanohole arrays on refractive index sensing. JOSA B 2018, 35, 2501. [Google Scholar] [CrossRef]
- Liu, H.; Wang, M.; Wang, Q.; Li, H.; Ding, Y.; Zhu, C. Simultaneous measurement of hydrogen and methane based on PCF-SPR structure with compound film-coated side-holes. Opt. Fiber Technol. 2018, 45, 1–7. [Google Scholar] [CrossRef]
- Yang, J.; Zhou, L.; Che, X.; Huang, J.; Li, X.; Chen, W. Photonic crystal fiber methane sensor based on modal interference with an ultraviolet curable fluoro-siloxane nano-film incorporating cryptophane A. Sens. Actuators B Chem. 2016, 235, 717–722. [Google Scholar] [CrossRef]
- Yang, J.; Tao, C.; Li, X.; Zhu, G.; Chen, W. Long-period fiber grating sensor with a styrene-acrylonitrile nano-film incorporating cryptophane A for methane detection. Opt. Express 2011, 19, 14696–14706. [Google Scholar]
- Min, W.; Wang, D.N.; Yang, M.; Jie, C.; Li, J. In-line Mach-Zehnder Interferometer and FBG with Pd film for simultaneous hydrogen and temperature detection. Sens. Actuators B Chem. 2014, 202, 893–896. [Google Scholar] [CrossRef]
- Chen, B.F.; Lee, C.S.; Elsberry, R.L. On Tropical Cyclone Size and Intensity Changes Associated with Two Types of Long-lasting Rainbands in Monsoonal Environments. Geophys. Res. Lett. 2014, 41, 2575–2581. [Google Scholar] [CrossRef]
- Derenko, S.; Härtling, T.; Unglaube, G.; Eng, L.M.; Opitz, J. A compact differential refractive index sensor based on localized surface plasmons. Sens. Actuators A Phys. 2014, 214, 252–258. [Google Scholar] [CrossRef]
- He, X.; O’Keefe, N.; Liu, Y.; Sun, D.; Uddin, H.; Nirmalathas, A.; Unnithan, R.R. Transmission Enhancement in Coaxial Hole Array Based Plasmonic Color Filter for Image Sensor Applications. IEEE Photonics J. 2018, 10, 1–9. [Google Scholar] [CrossRef]
- Wang, C.; Yang, J.; Shen, R.; Chen, W.; Che, X.; Li, X. High-sensitivity photonic crystal fiber long-period grating methane sensor with cryptophane-A-6Me absorbed on a PAA-CNTs/PAH nanofilm. Opt. Express 2017, 25, 20258. [Google Scholar]
- Zhang, Y.N.; Zhou, T.; Bo, H.; Zhang, L.; Wu, Q. Simultaneous Measurement of Hydrogen Concentration and Temperature Based on Fiber Loop Mirror Combined with PCF. IEEE Sens. J. 2018, 18, 2369–2376. [Google Scholar] [CrossRef]


| d [nm] | a [nm] | h [nm] | Resonance Peak [nm] | Full Width at Half Maximum (FWHM) [nm] | Extinction Ratio % |
|---|---|---|---|---|---|
| 20 | 400 | 160 | 760 | 87 | 83.1 |
| 30 | 400 | 160 | 731 | 80 | 80.5 |
| 40 | 400 | 160 | 737 | 72 | 80.2 |
| 50 | 400 | 160 | 743 | 79 | 81.9 |
| 40 | 310 | 160 | 778 | 88 | 87.2 |
| 40 | 320 | 160 | 772 | 73 | 89.2 |
| 40 | 330 | 160 | 763 | 76 | 93.7 |
| 40 | 340 | 160 | 731 | 80 | 90 |
| 40 | 320 | 140 | 734 | 78 | 92.9 |
| 40 | 320 | 150 | 753 | 64 | 97.2 |
| 40 | 320 | 160 | 772 | 73 | 87.2 |
| 40 | 320 | 170 | 802 | 76 | 74 |
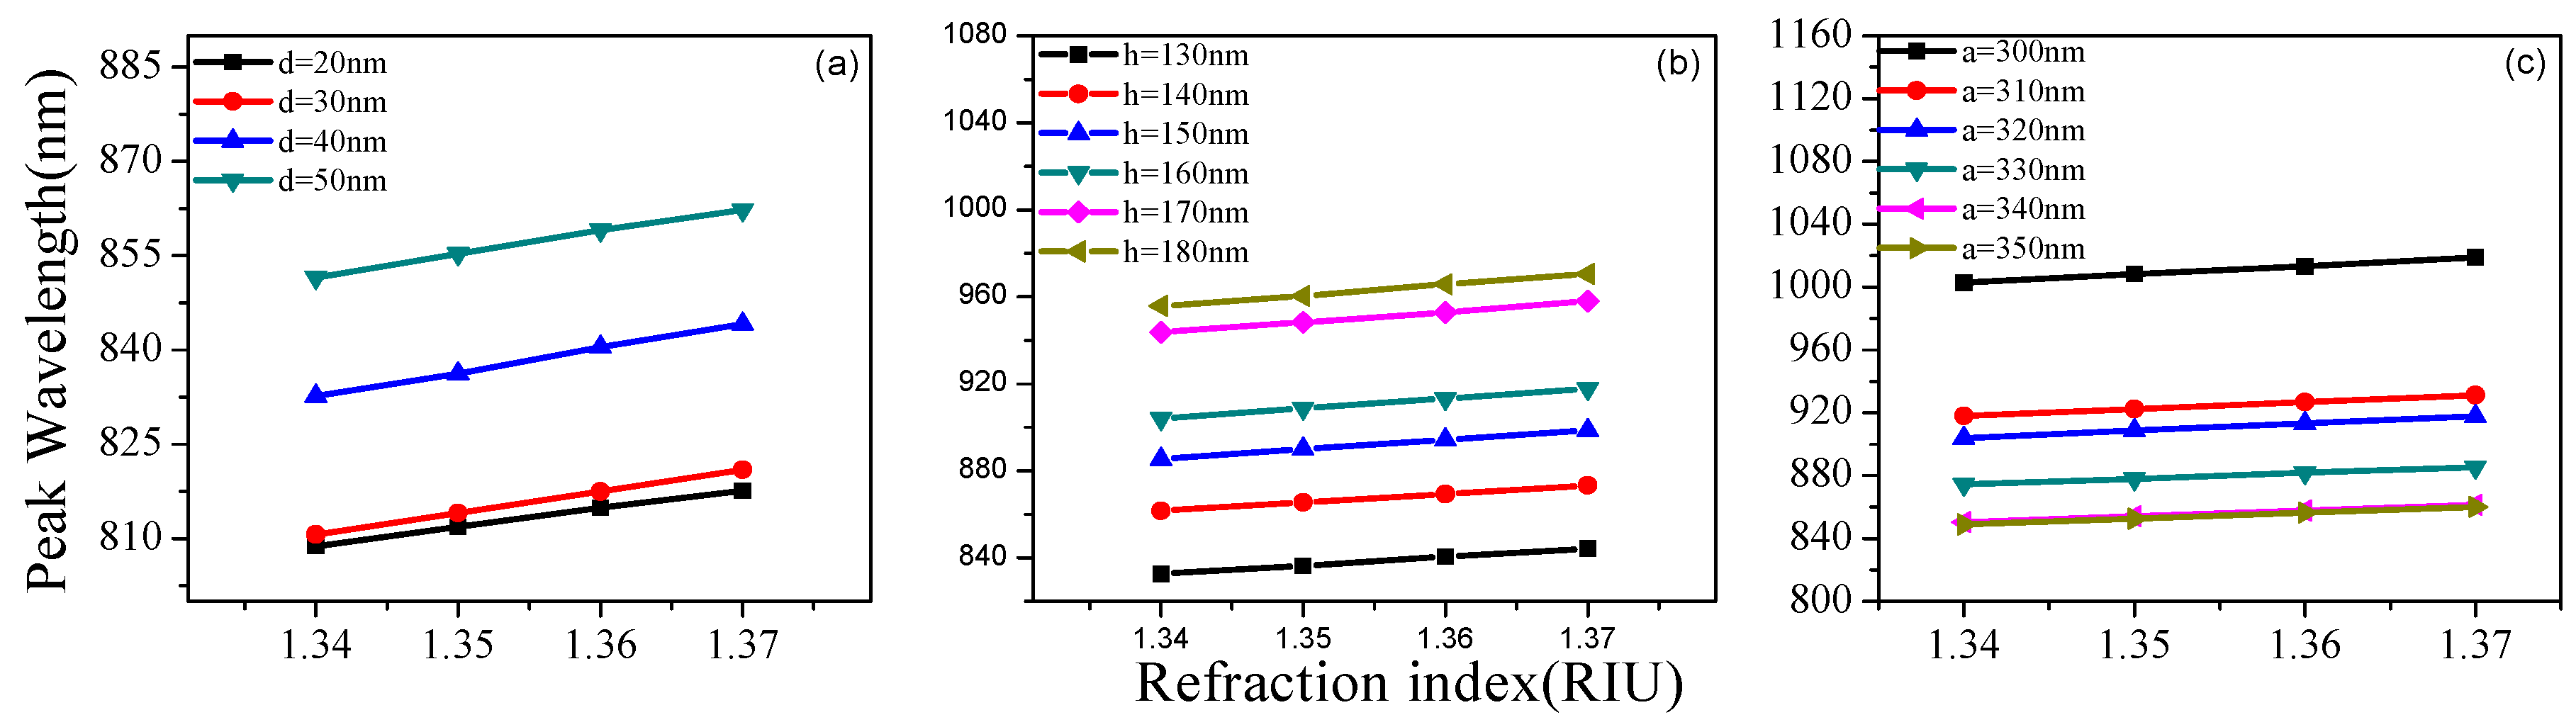
| Group Number | Period | Height | Sensitivity |
|---|---|---|---|
| [nm/RIU] | |||
| 300 | 150 | 449.87 | |
| 320 | 150 | 441.05 | |
| 340 | 150 | 370.2 | |
| 300 | 160 | 530.4 | |
| 320 | 160 | 453.66 | |
| 340 | 160 | 372.9 | |
| 300 | 170 | 449.72 | |
| 320 | 170 | 473.63 | |
| 340 | 170 | 412.4 |
| Group Number | Period | High | Thickness | Sensitivity | Increase Rate |
|---|---|---|---|---|---|
| t [nm] | [nm/RIU] | [%] | |||
| 300 | 150 | 20 | 533.24 | 18.5 | |
| 320 | 150 | 20 | 509.22 | 15.5 | |
| 340 | 150 | 20 | 390.9 | 5.6 | |
| 300 | 160 | 20 | 550.08 | 3.7 | |
| 320 | 160 | 20 | 532.71 | 17.4 | |
| 340 | 160 | 20 | 398.53 | 6.9 | |
| 300 | 170 | 20 | 486.06 | 8.1 | |
| 320 | 170 | 20 | 528.6 | 11.6 | |
| 340 | 170 | 20 | 457.86 | 11 |
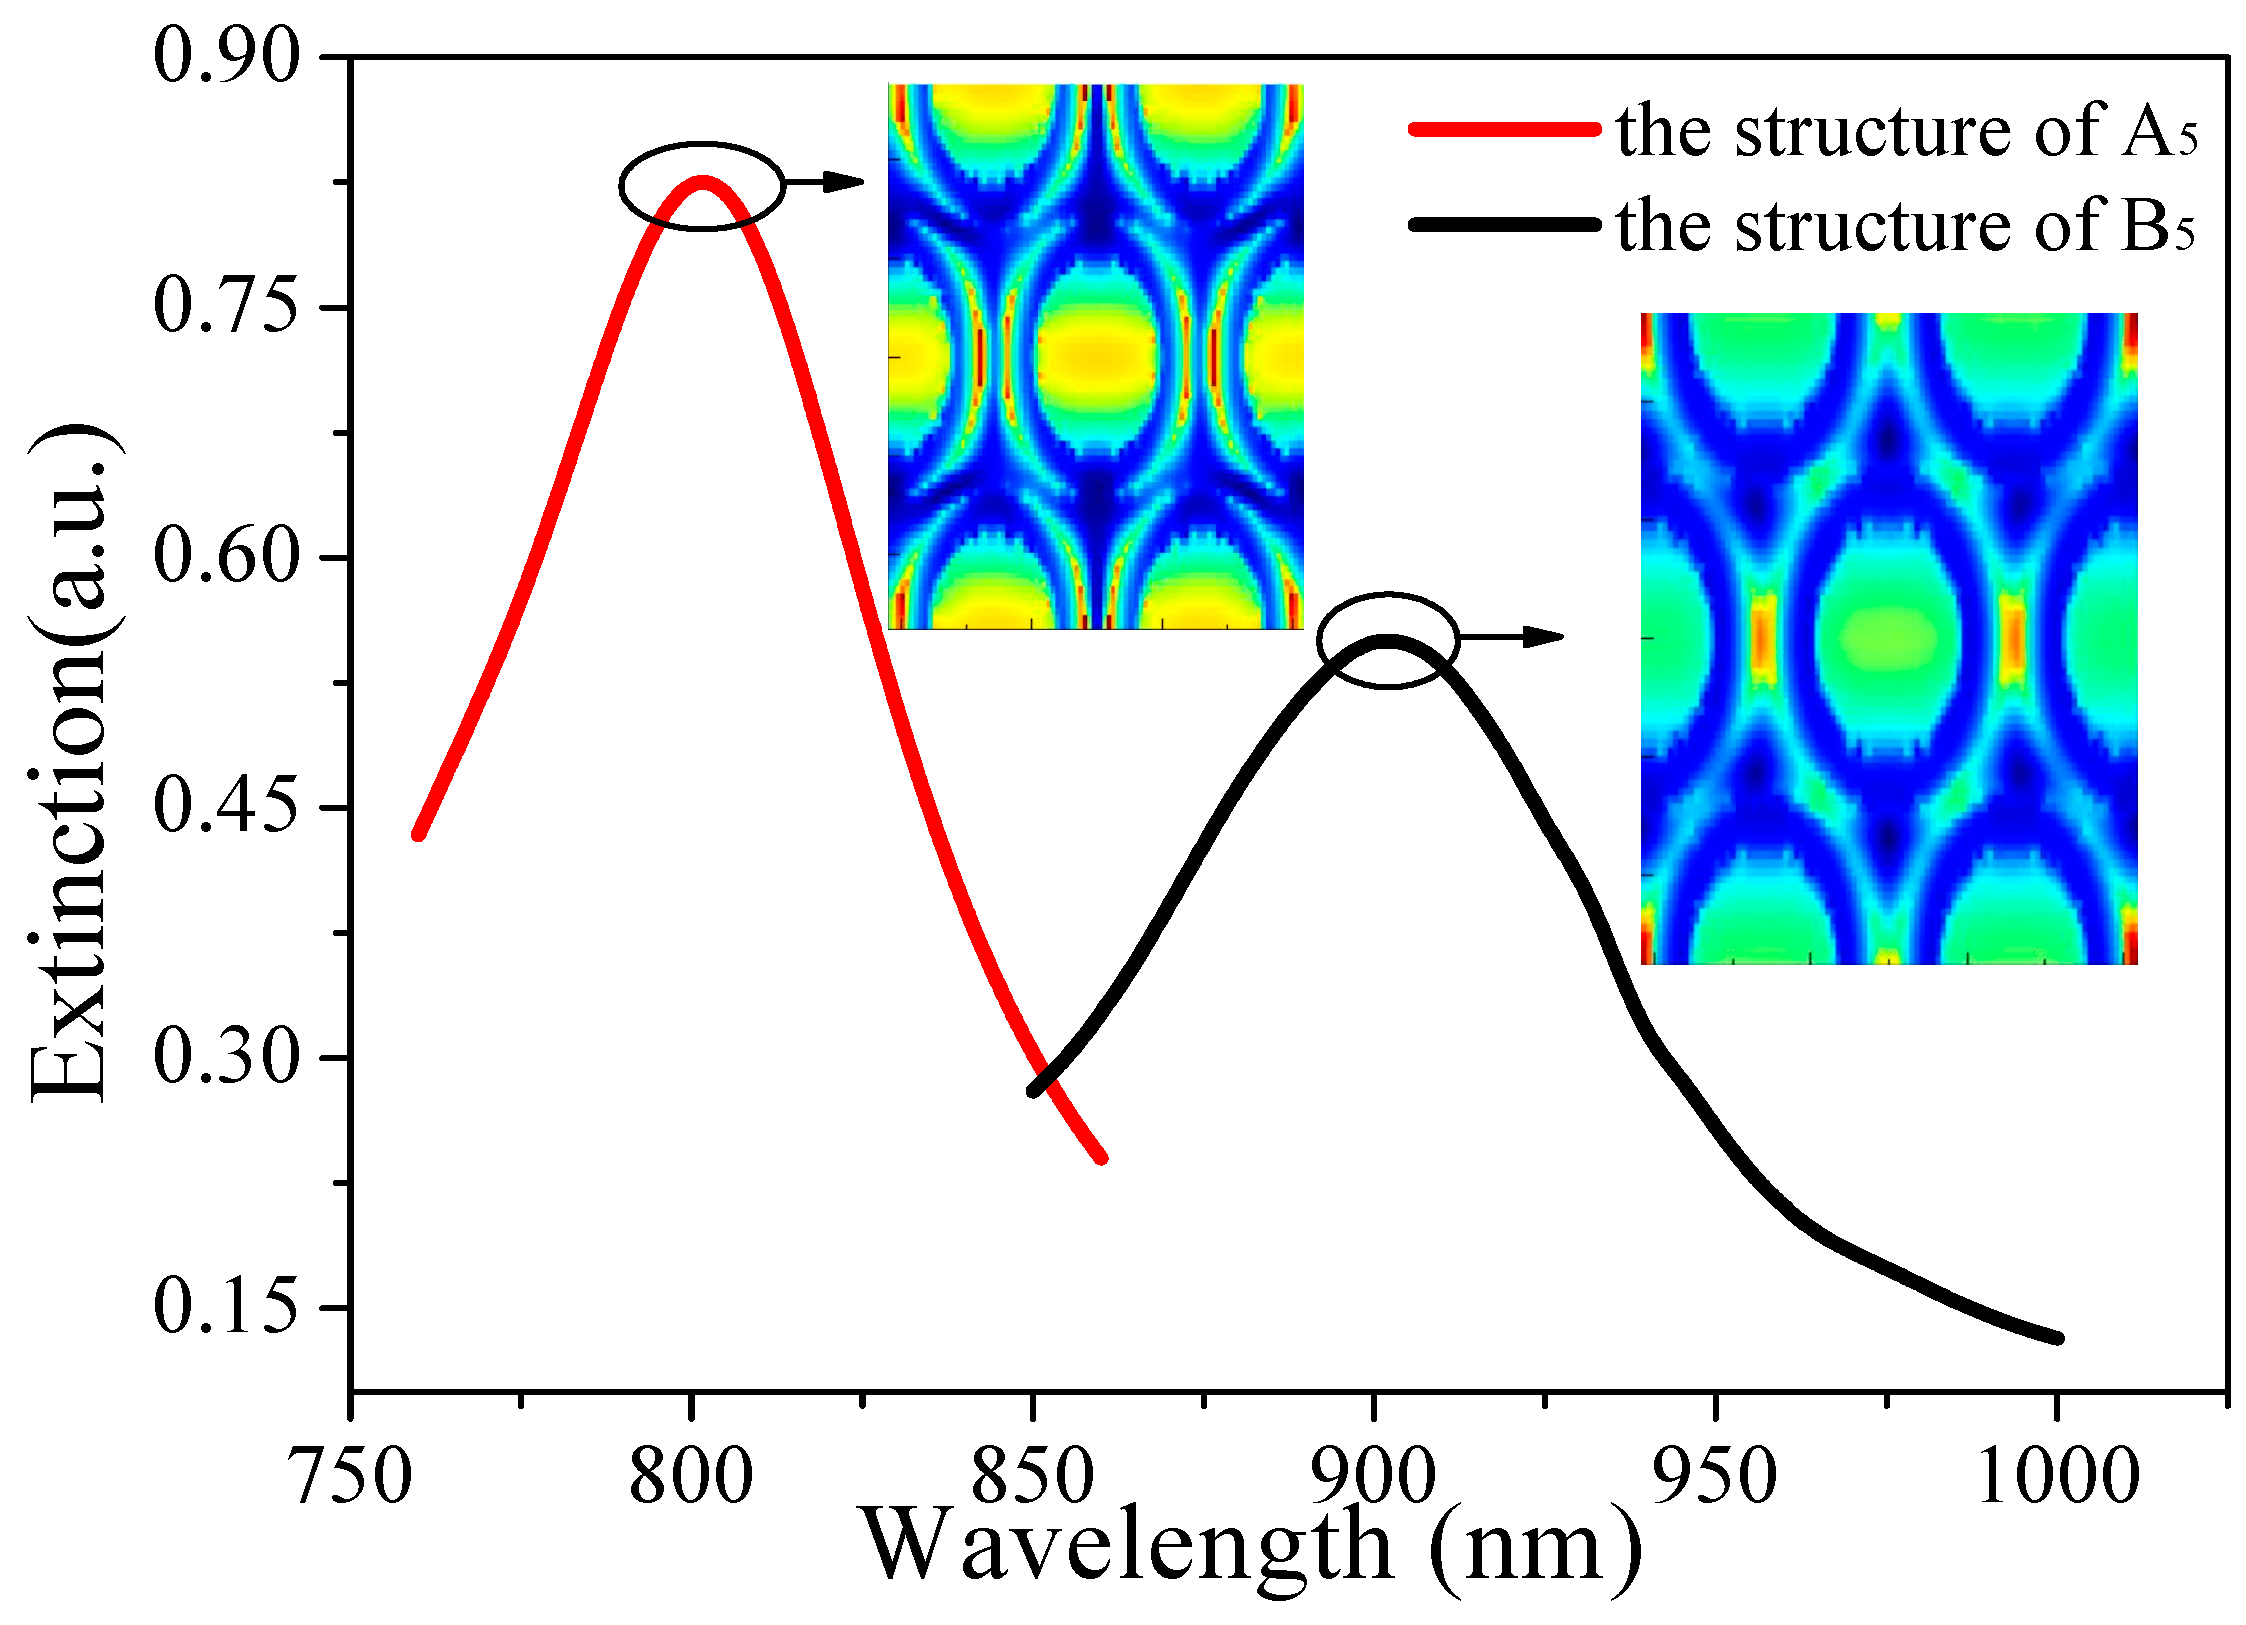
| Type of Gas | The Structure | The Sensitivity of Gas [nm/%] | Increase Rate [%] |
|---|---|---|---|
| CH4 | B5 | −1.04 | 159 |
| A5 | −0.394 |
© 2019 by the authors. Licensee MDPI, Basel, Switzerland. This article is an open access article distributed under the terms and conditions of the Creative Commons Attribution (CC BY) license (http://creativecommons.org/licenses/by/4.0/).
Share and Cite
Liu, H.; Chen, C.; Zhang, Y.; Bai, B.; Tang, S. A High-Sensitivity Methane Sensor with Localized Surface Plasmon Resonance Behavior in an Improved Hexagonal Gold Nanoring Array. Sensors 2019, 19, 4803. https://0-doi-org.brum.beds.ac.uk/10.3390/s19214803
Liu H, Chen C, Zhang Y, Bai B, Tang S. A High-Sensitivity Methane Sensor with Localized Surface Plasmon Resonance Behavior in an Improved Hexagonal Gold Nanoring Array. Sensors. 2019; 19(21):4803. https://0-doi-org.brum.beds.ac.uk/10.3390/s19214803
Chicago/Turabian StyleLiu, Hai, Cong Chen, Yanzeng Zhang, Bingbing Bai, and Shoufeng Tang. 2019. "A High-Sensitivity Methane Sensor with Localized Surface Plasmon Resonance Behavior in an Improved Hexagonal Gold Nanoring Array" Sensors 19, no. 21: 4803. https://0-doi-org.brum.beds.ac.uk/10.3390/s19214803