Integration of Computer Vision and Wireless Networks to Provide Indoor Positioning

 ,
,  ,
,  , and
, and
Abstract
:1. Introduction
2. Overview of Related Work
3. Analysis of the System
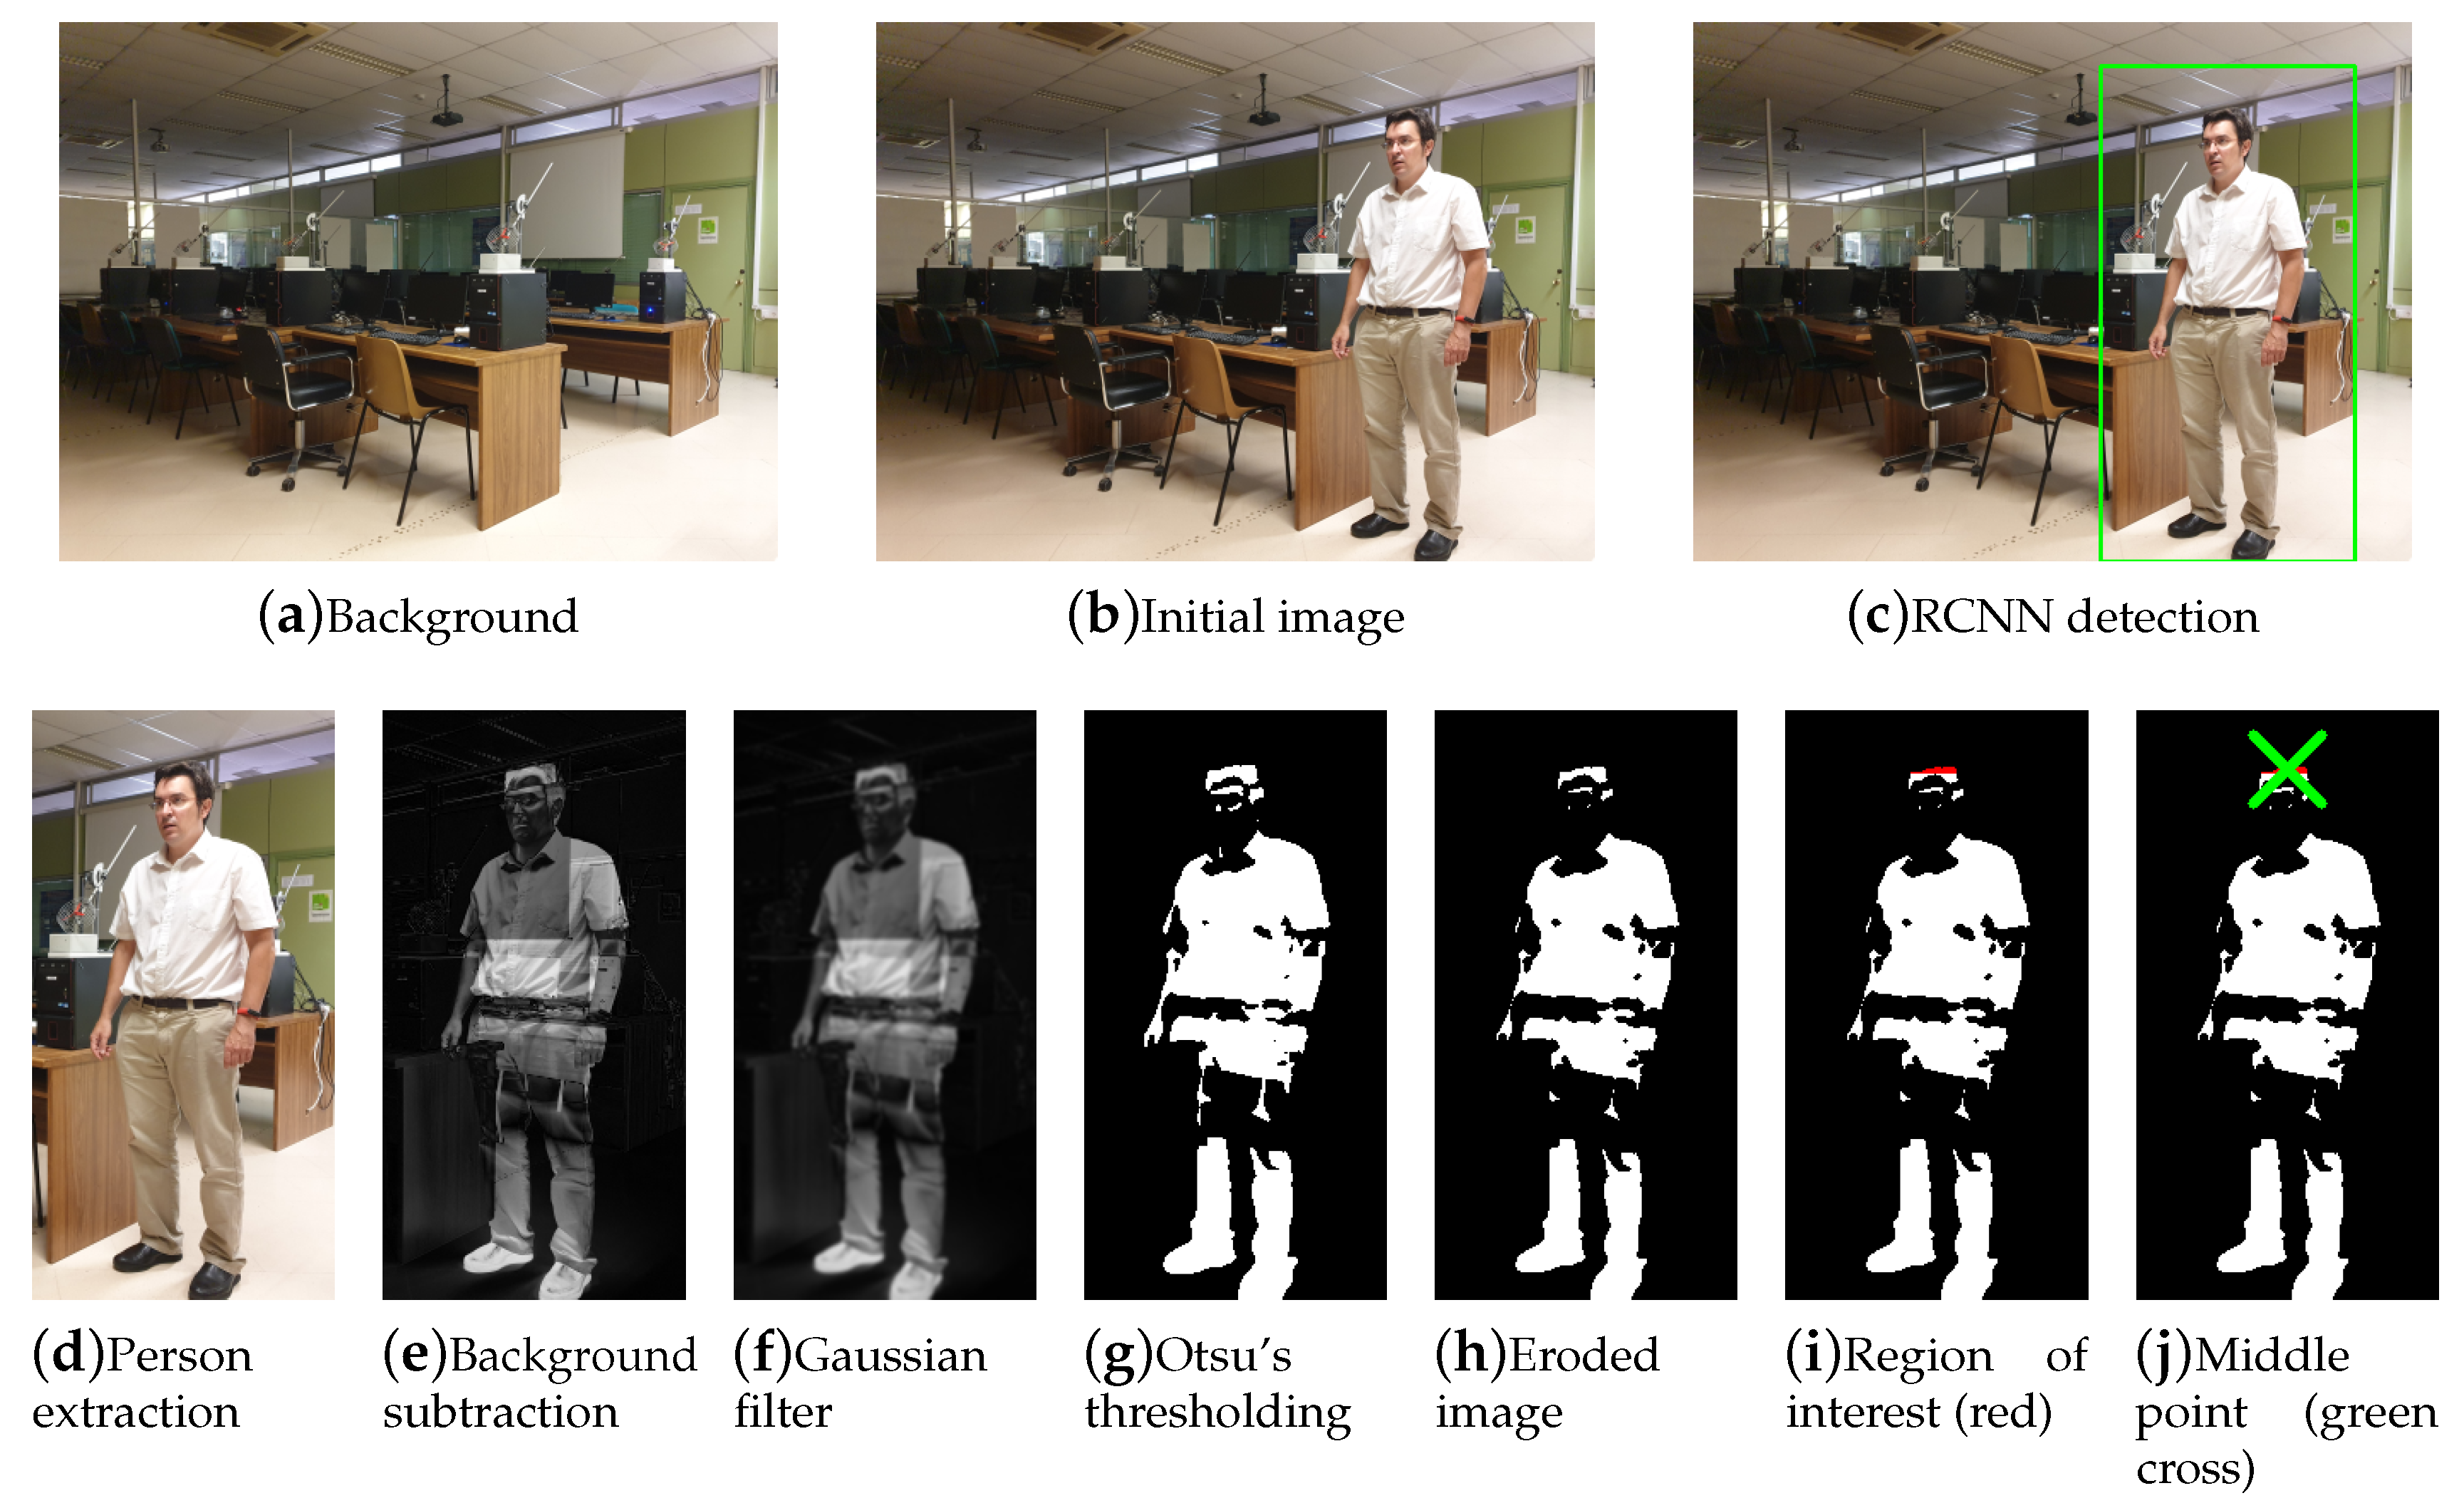
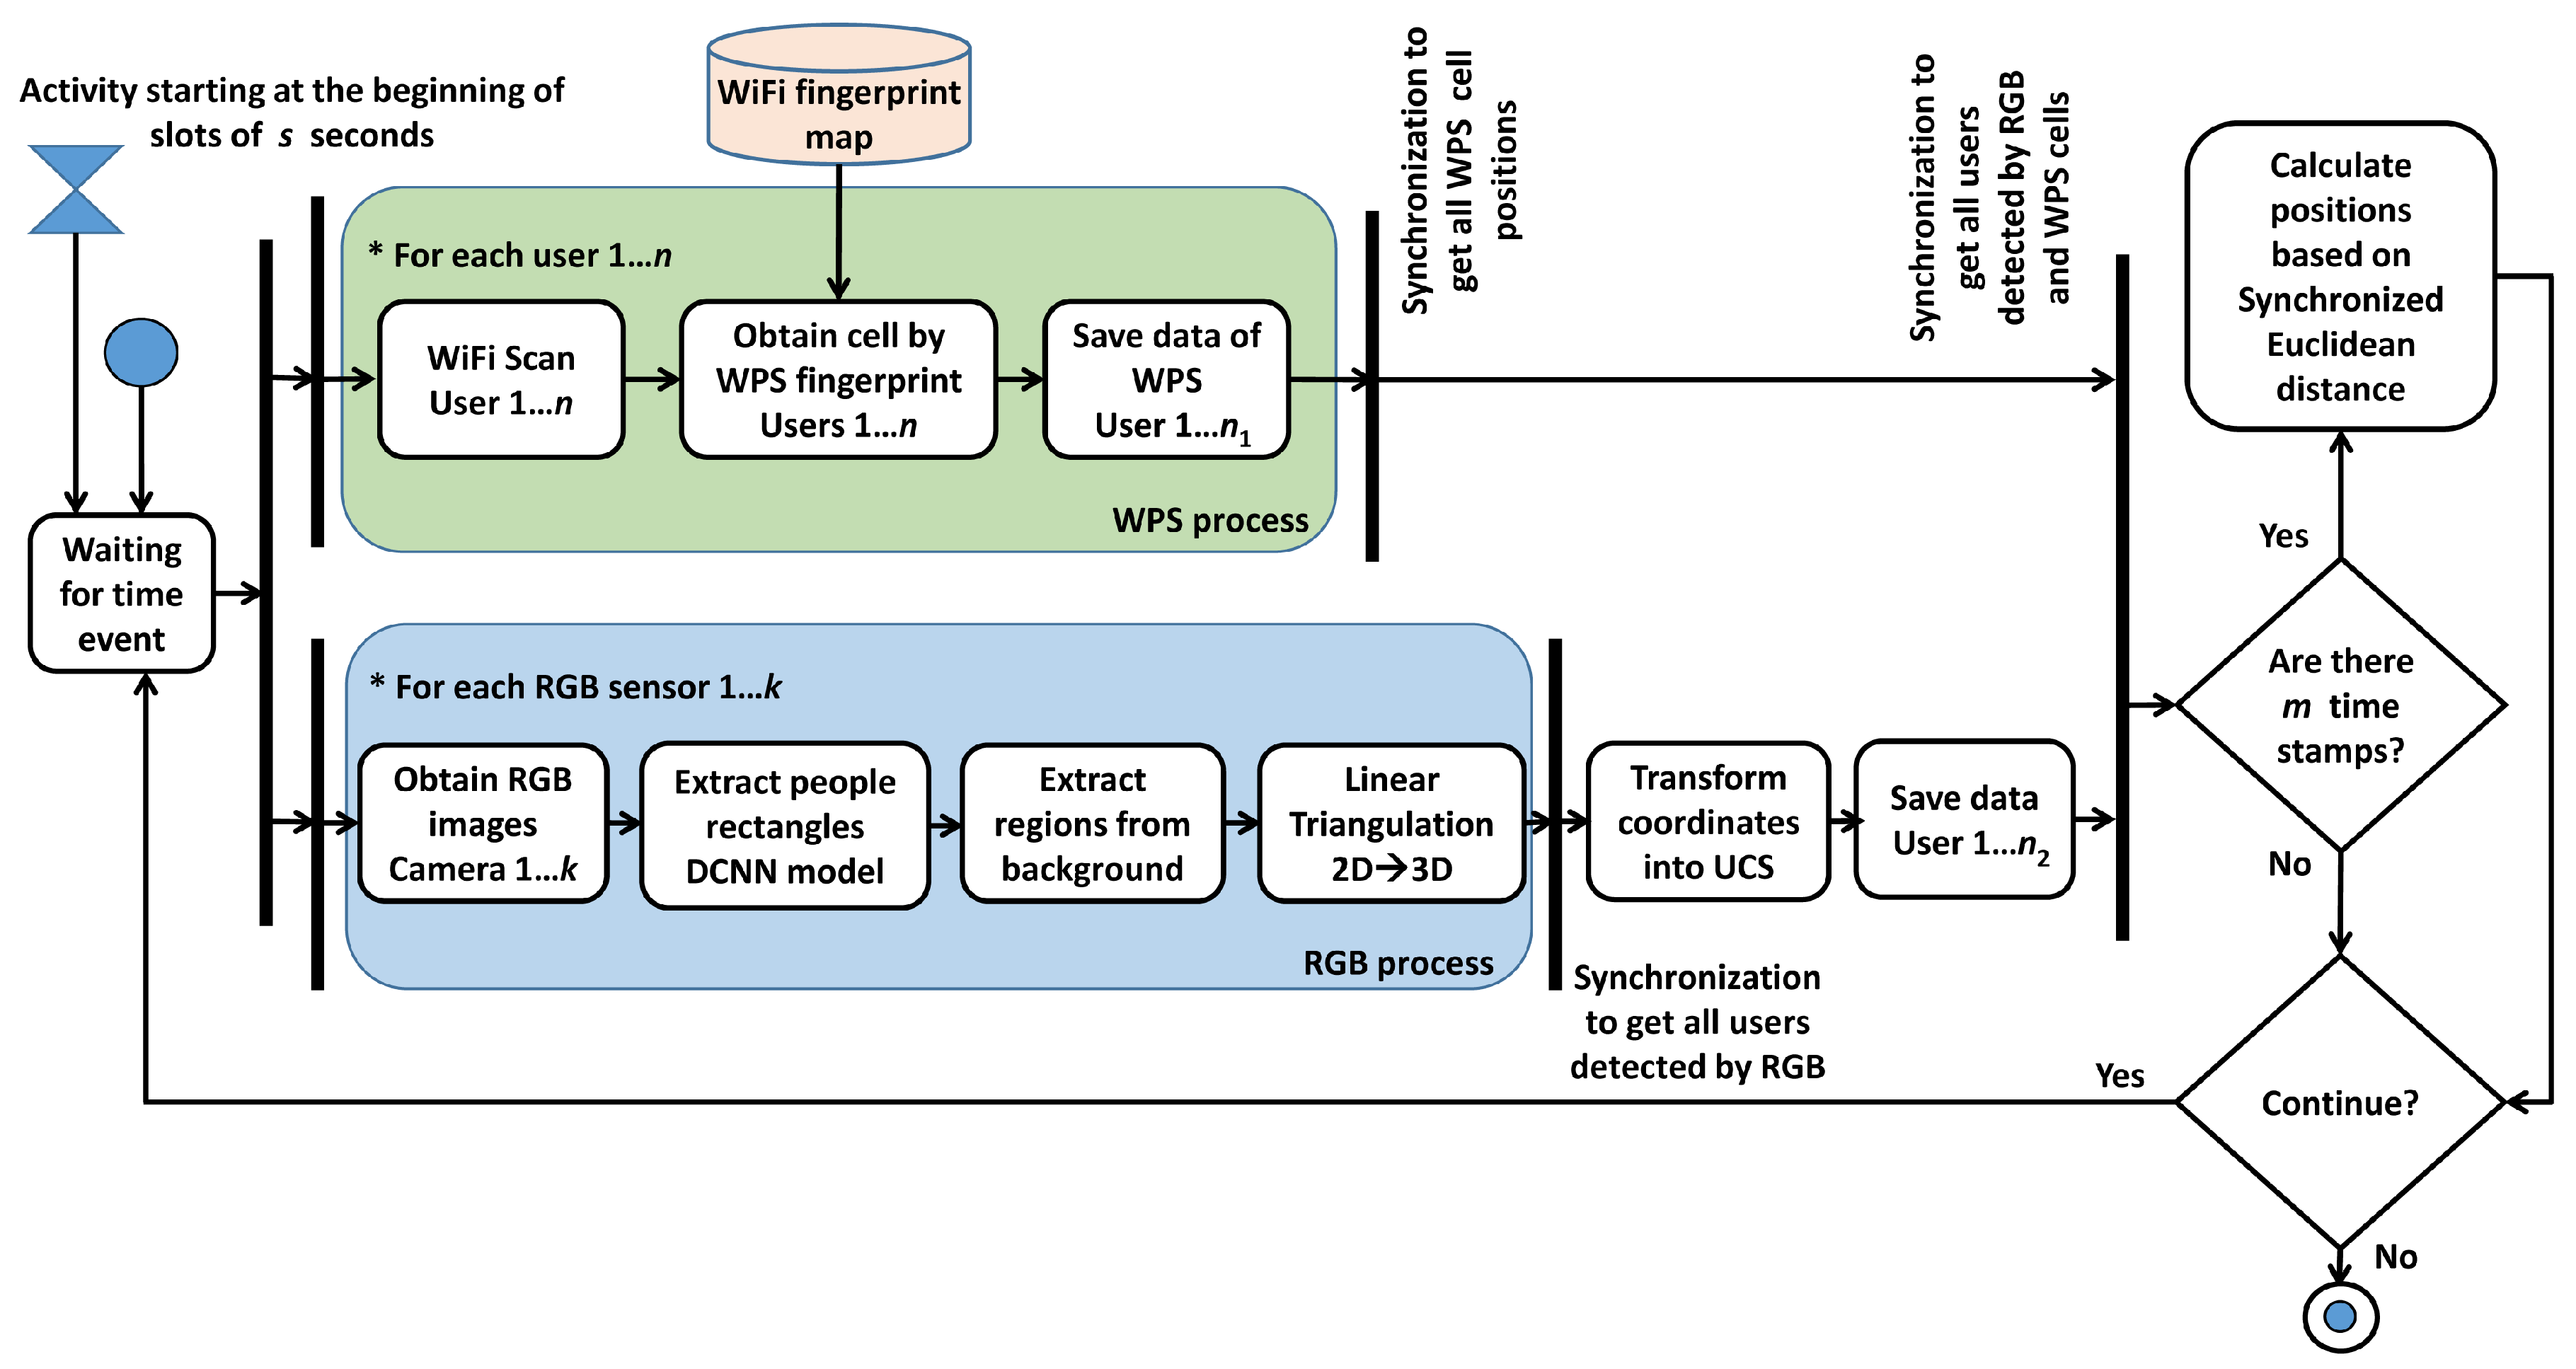
3.1. People-Tracking in RGB
- A first step consists of determining the camera projection matrix, L, associated to each camera, before the experiments. It is important to mention that all cameras involved in the process must satisfy the epipolar constraint. The L matrix allows the 3D coordinates to be related to the 2D image perceived by the camera, according to , where are the 3D coordinates of a given point and are its corresponding image coordinates. To obtain L, six different normalized points are registered in the scenario, indicating the 3D coordinates with respect to the room and 2D position in each image obtained by its respective camera. A Direct Linear Transformation (DLT) algorithm estimates L from 2D/3D coordinates.
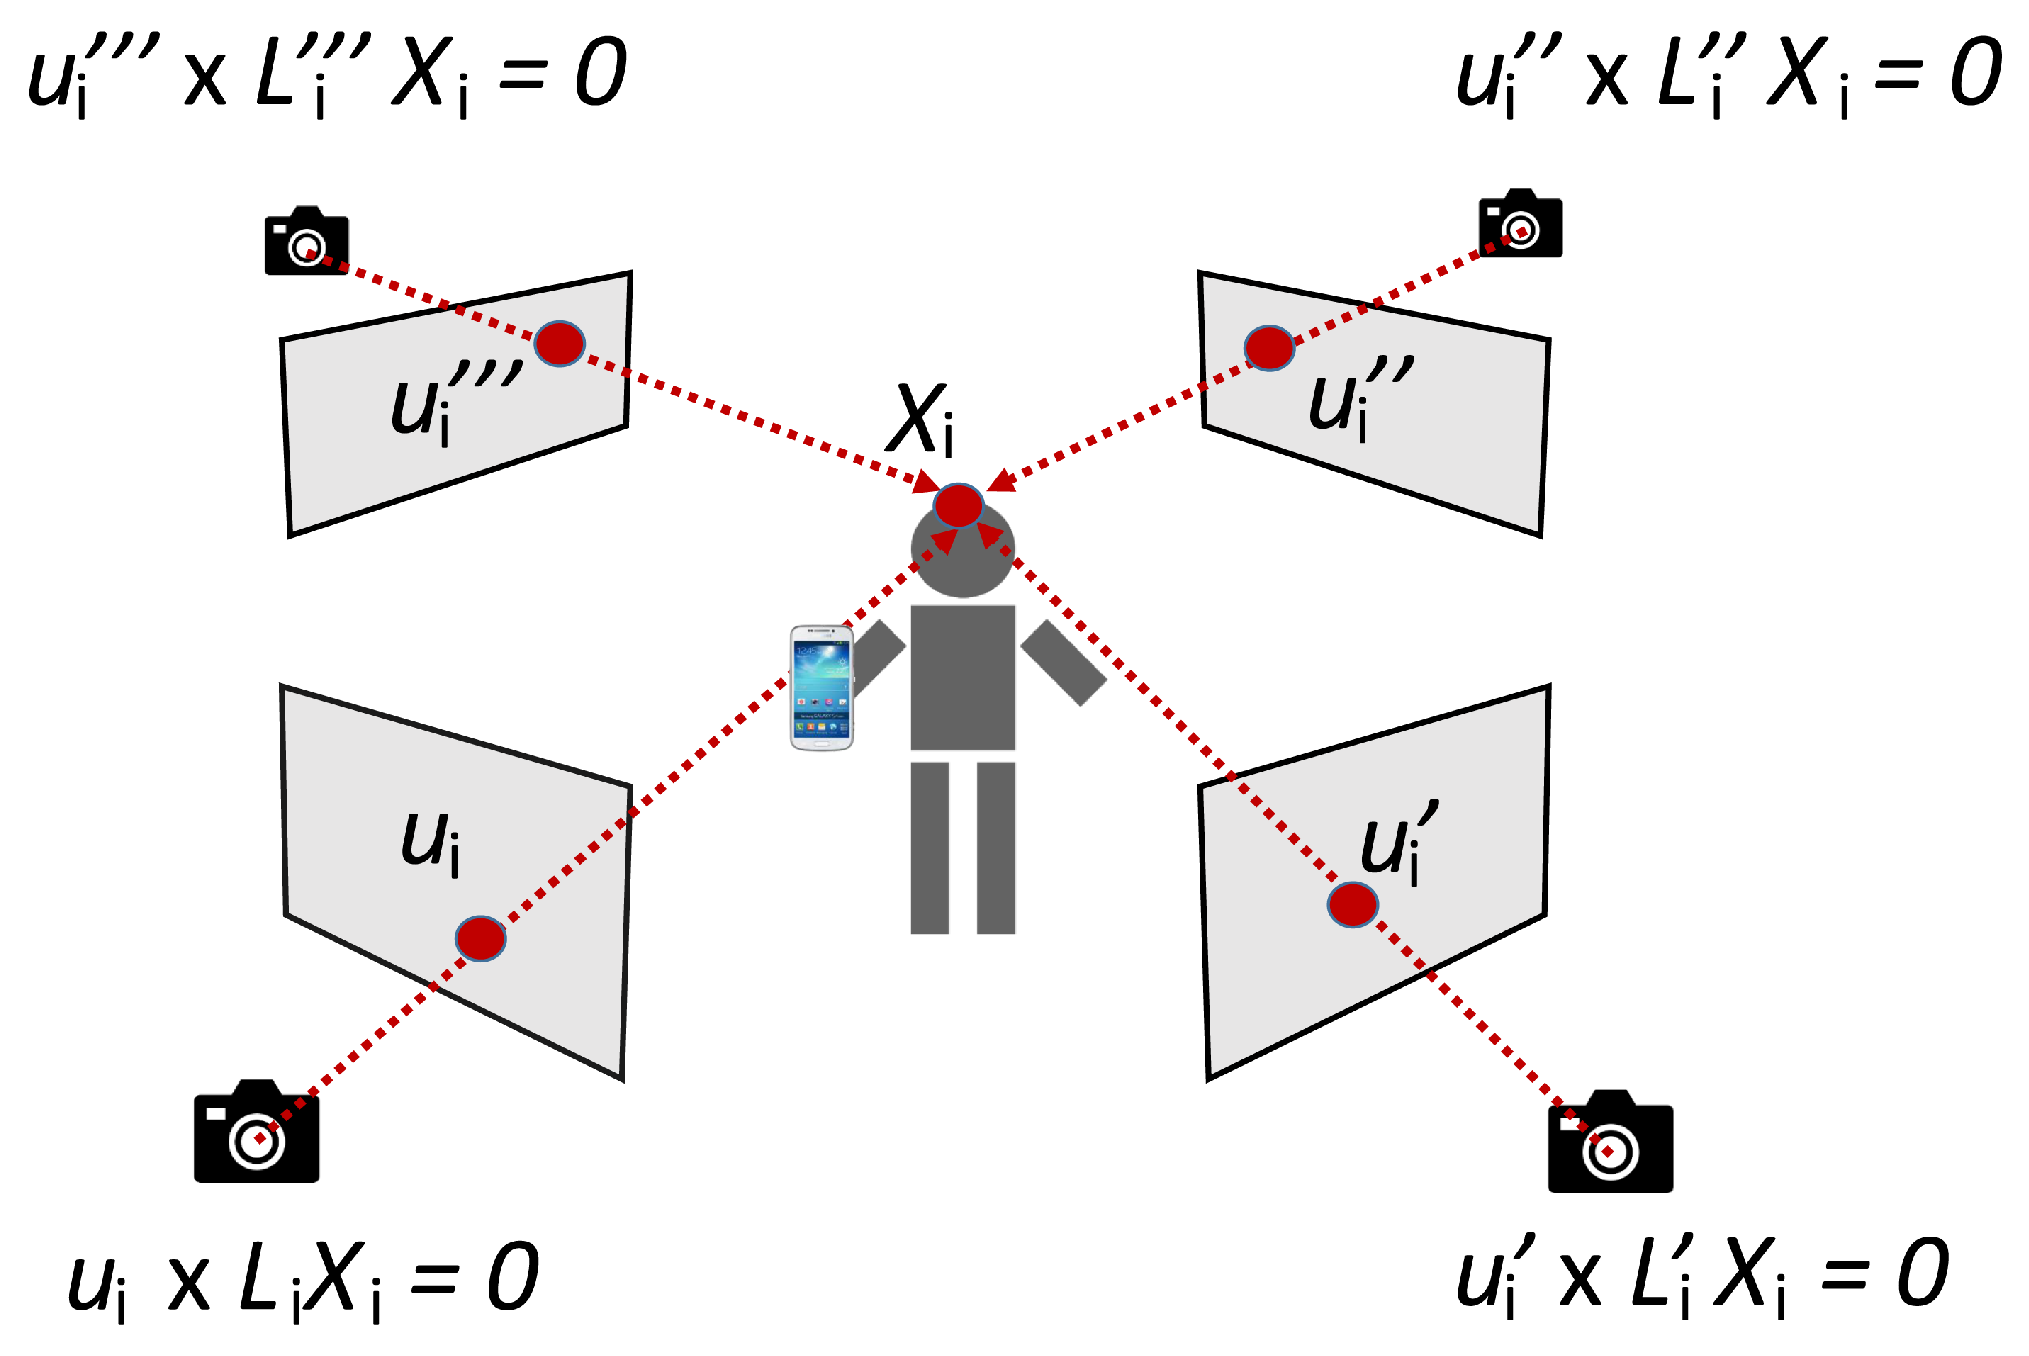
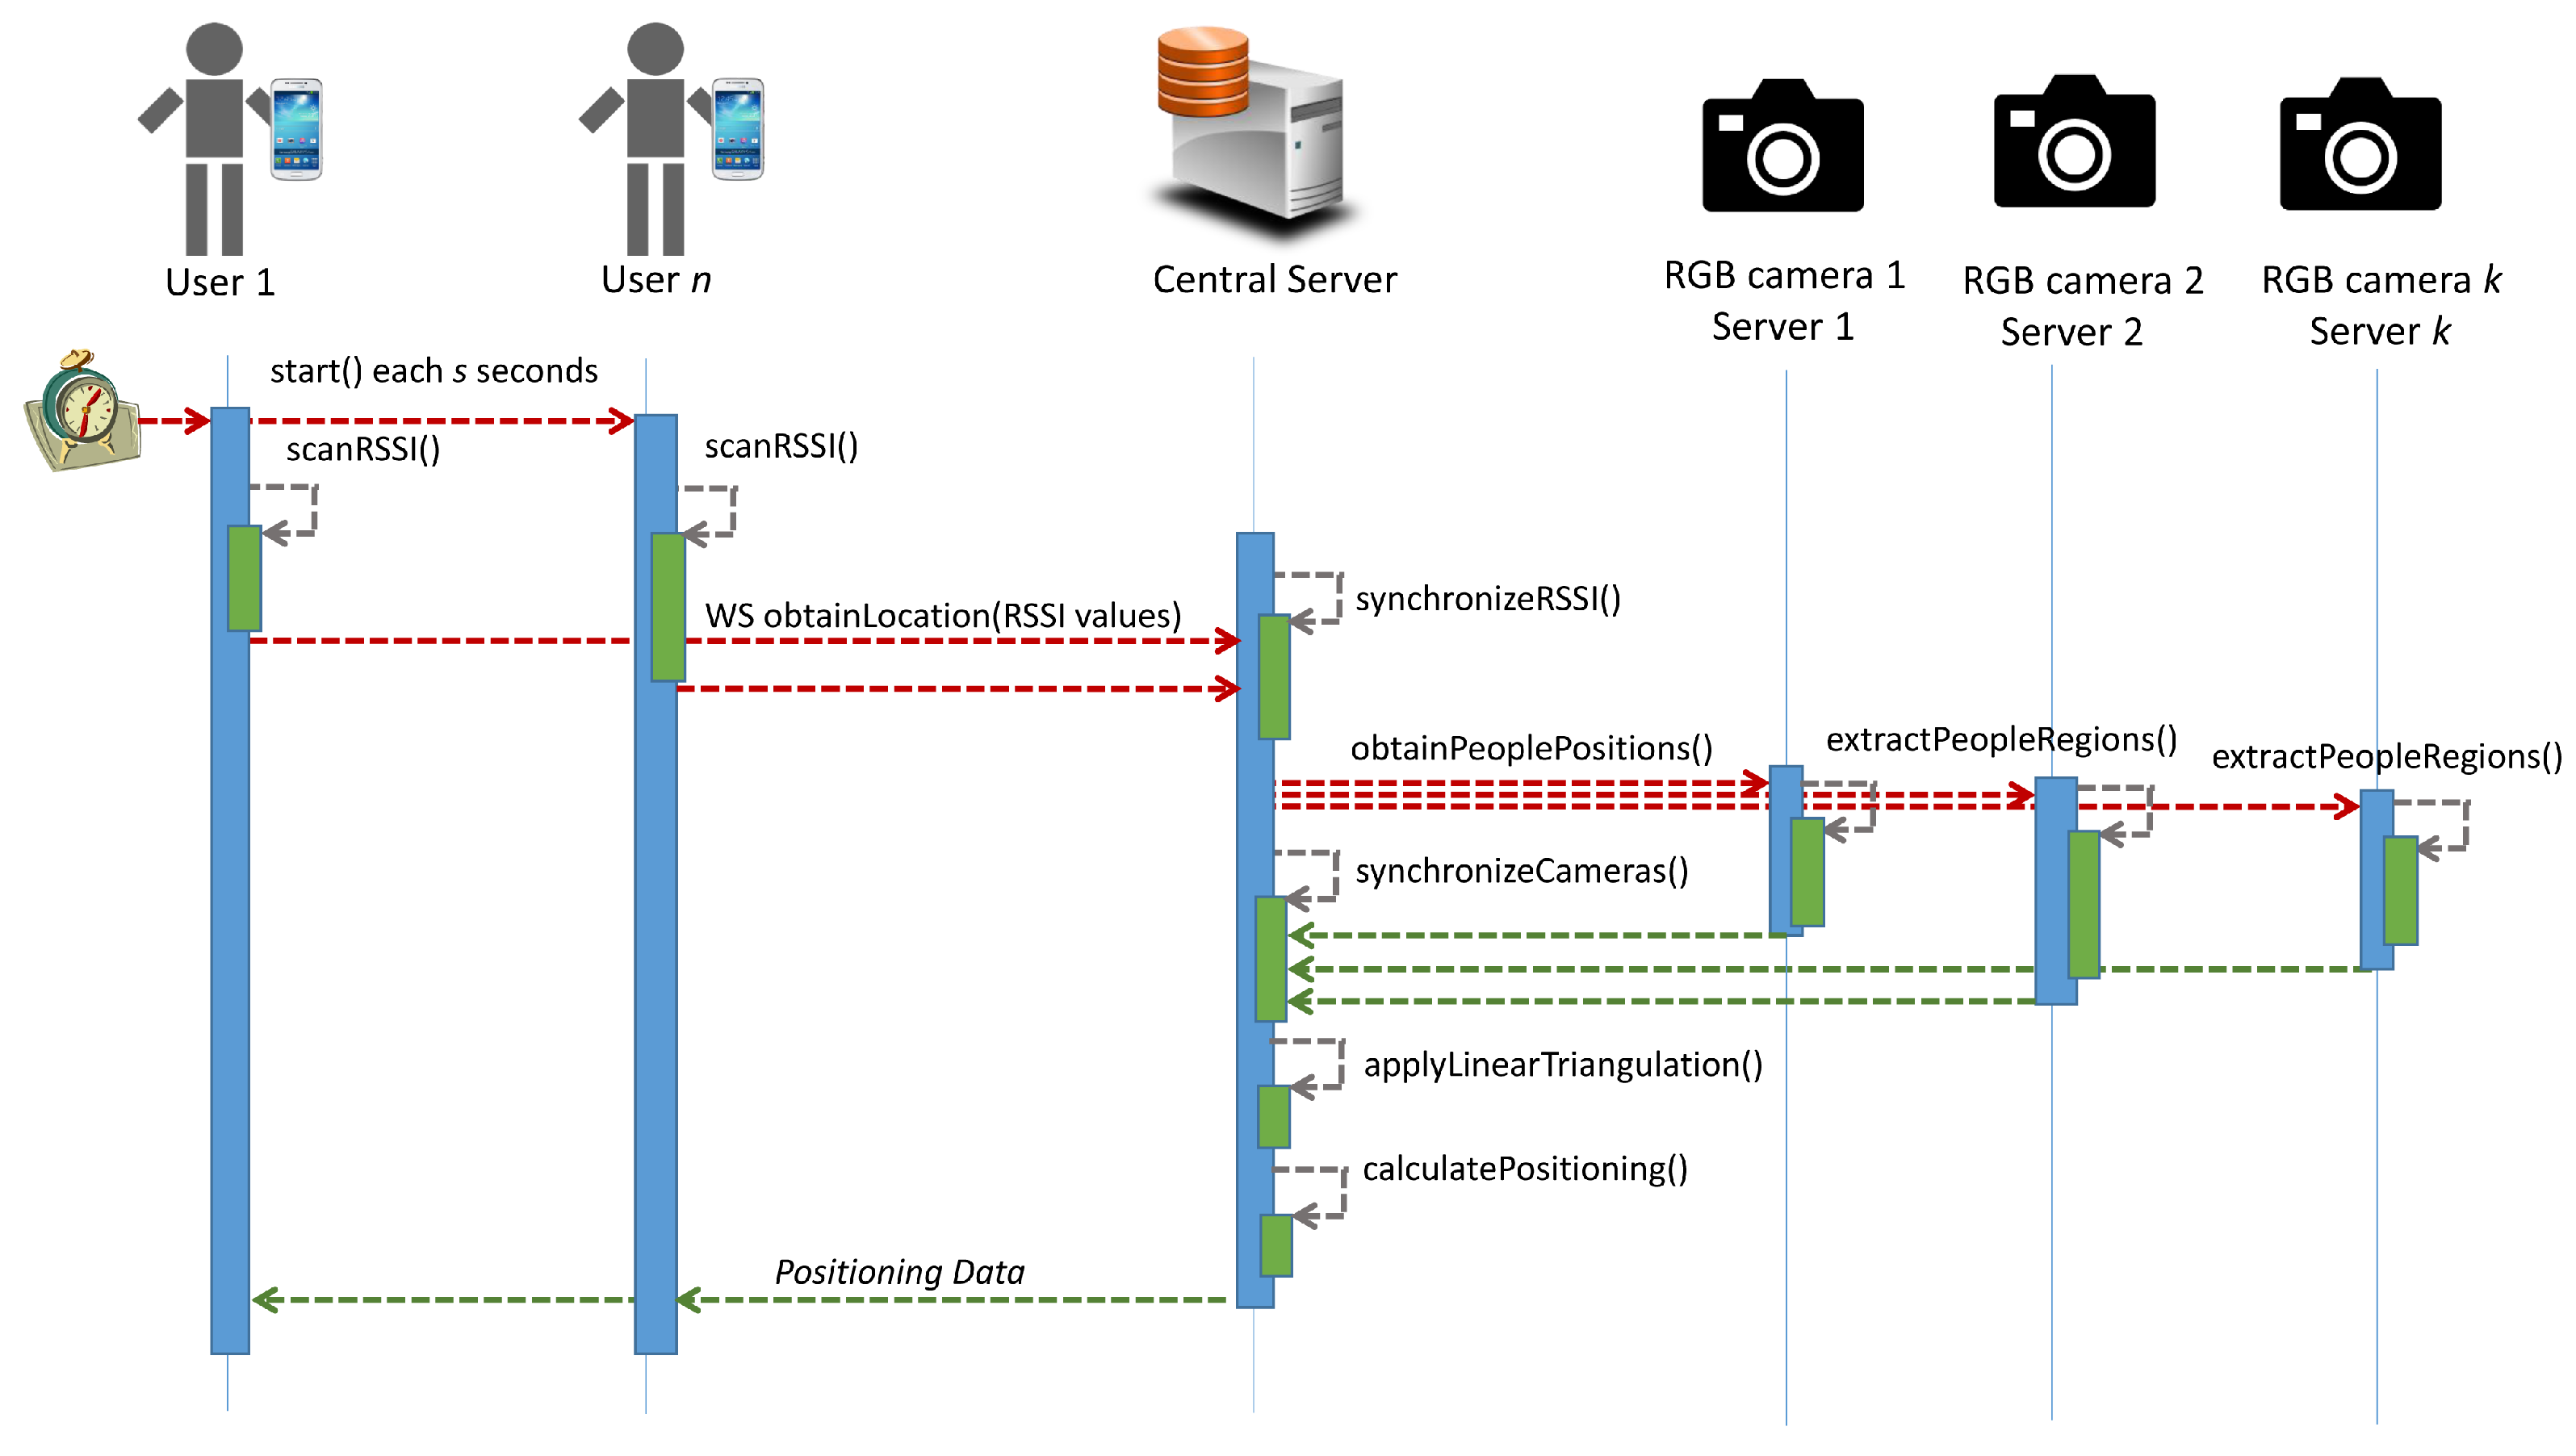
- A second step, performed during execution time, allows 3D coordinates to be identified from a set of different 2D points for each camera: , , , etc., (see Figure 2). Each camera has its respective L matrix, relating 3D common coordinates with their respective 2D ones, such as or . These expressions are equivalent to x or x . Based on these expressions, each perspective camera model produces two equations. The complete set of equations represents an overdetermined homogeneous system of linear equations which is solved with SVD, obtaining a 3D point that is optimal in a least squares sense.
3.2. People-Tracking in WiFi
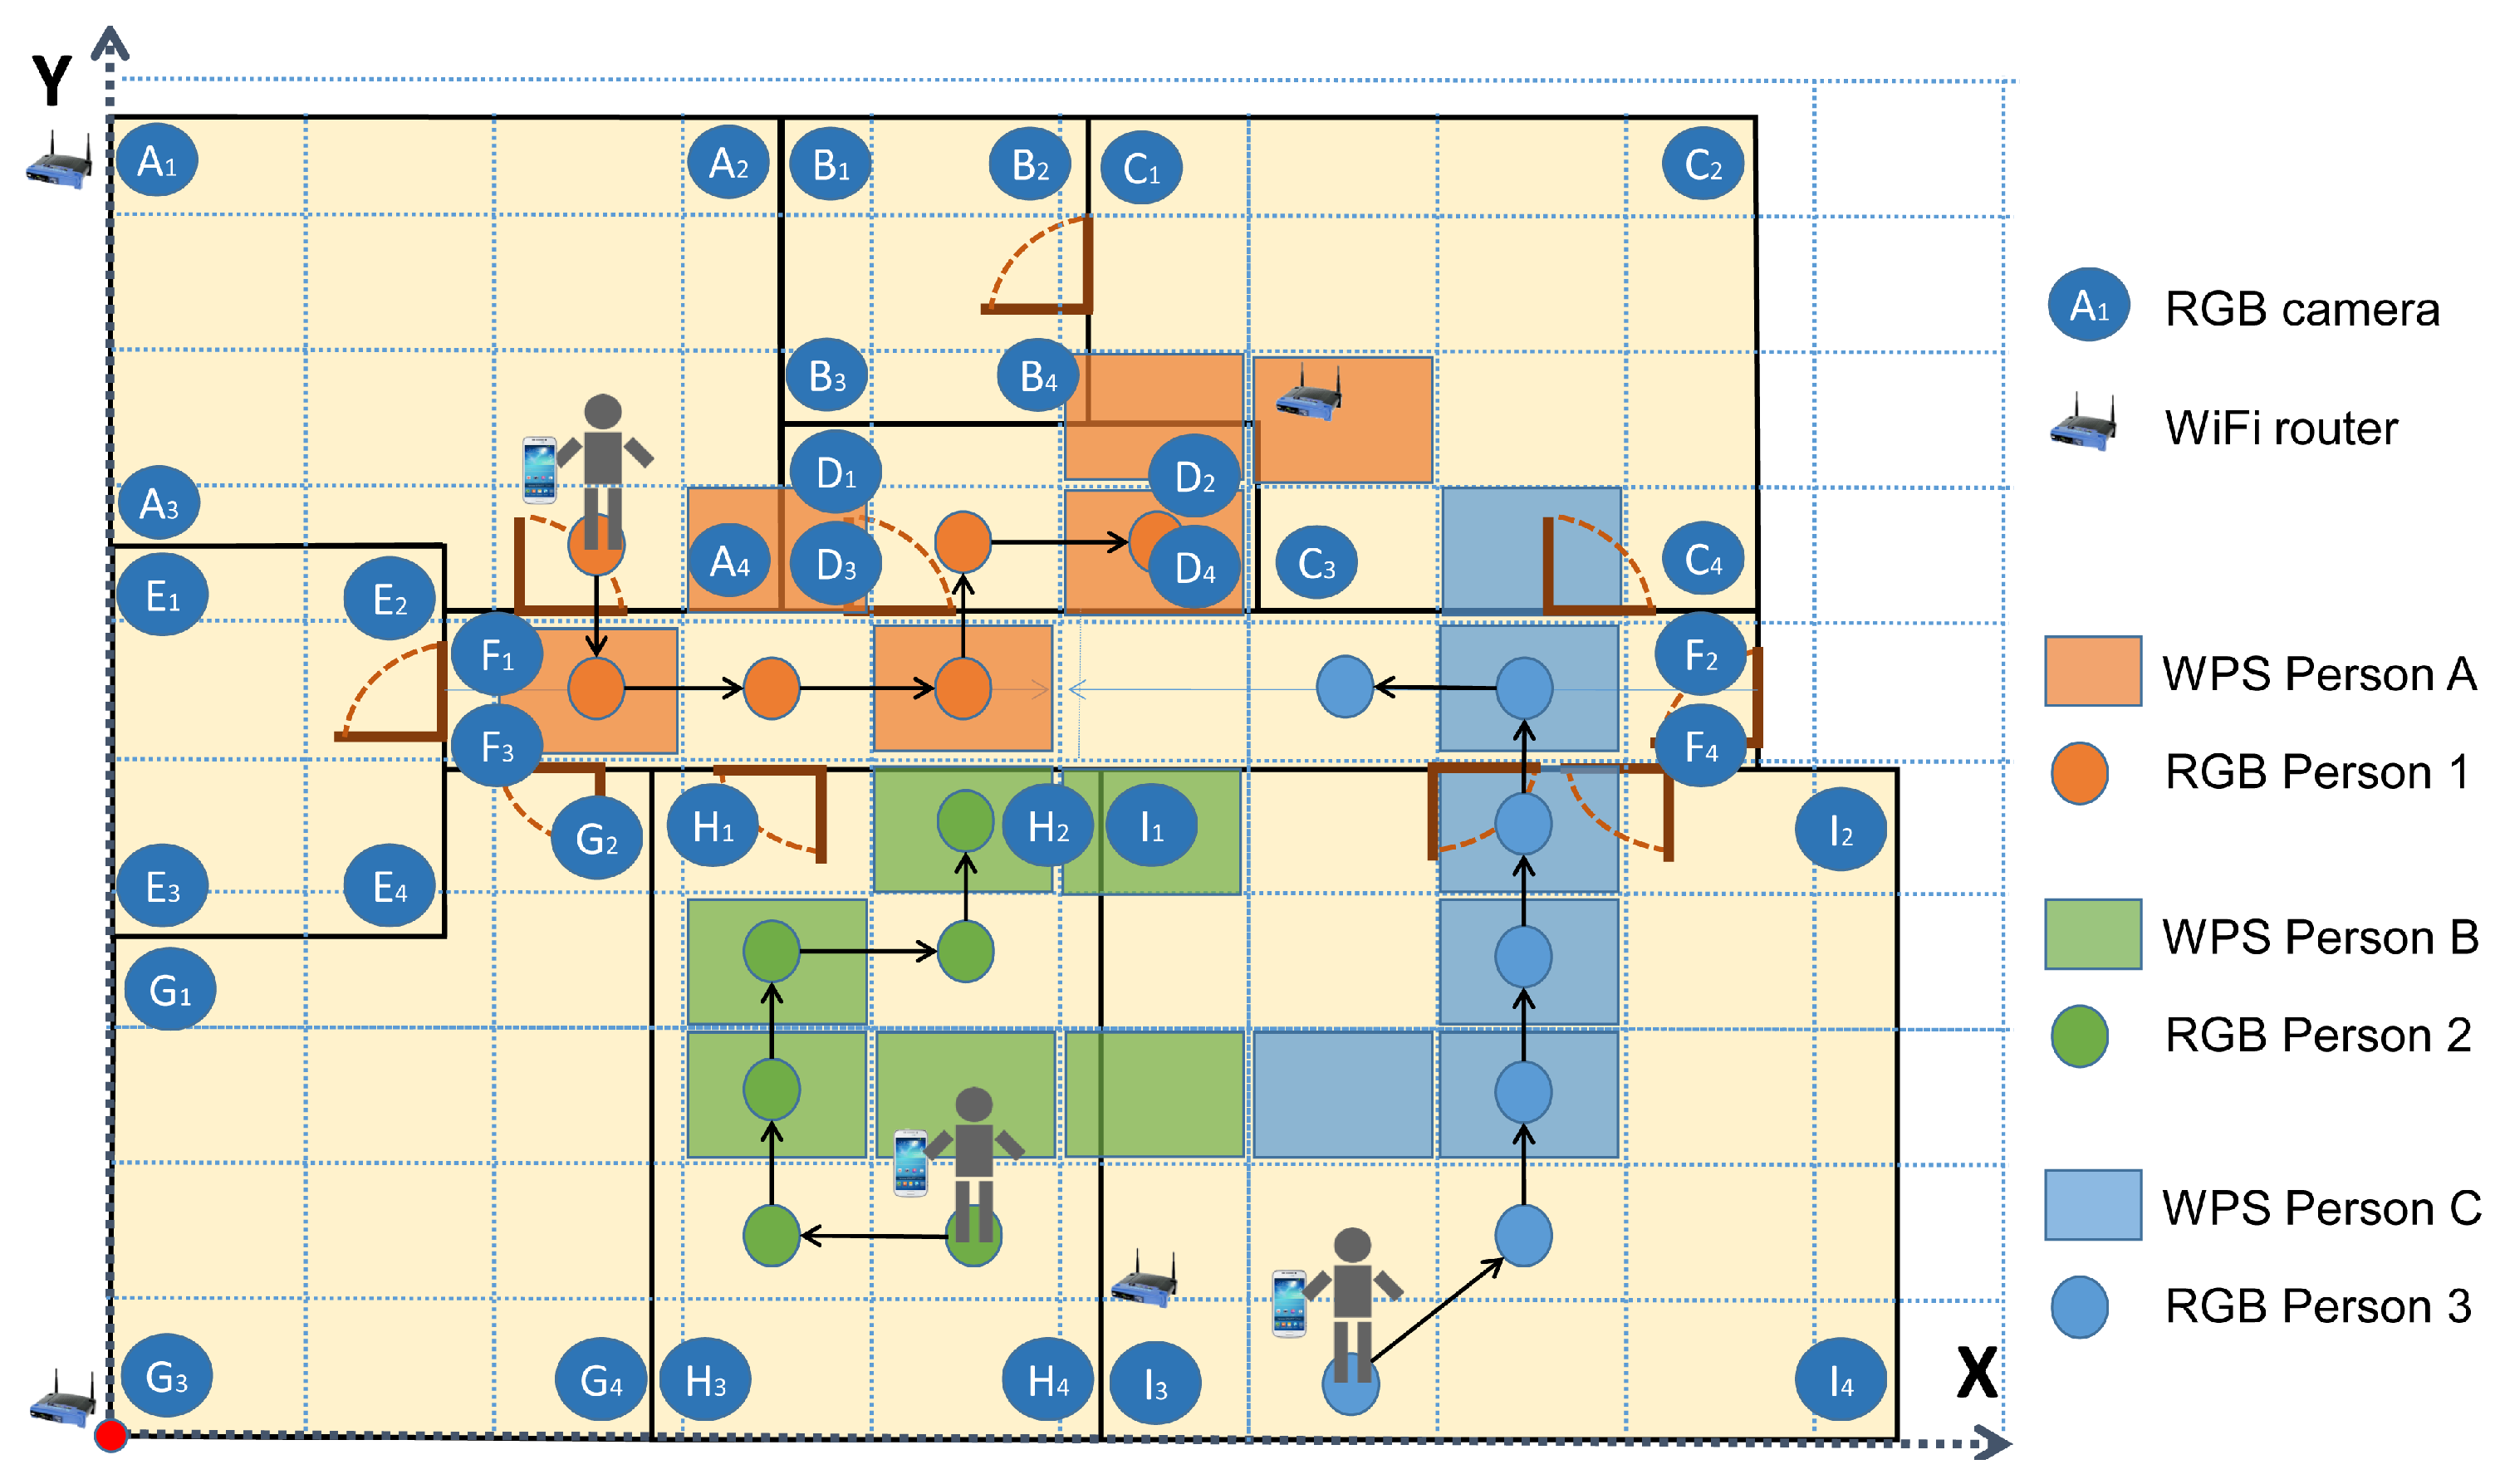
3.3. RGB and WiFi Integration
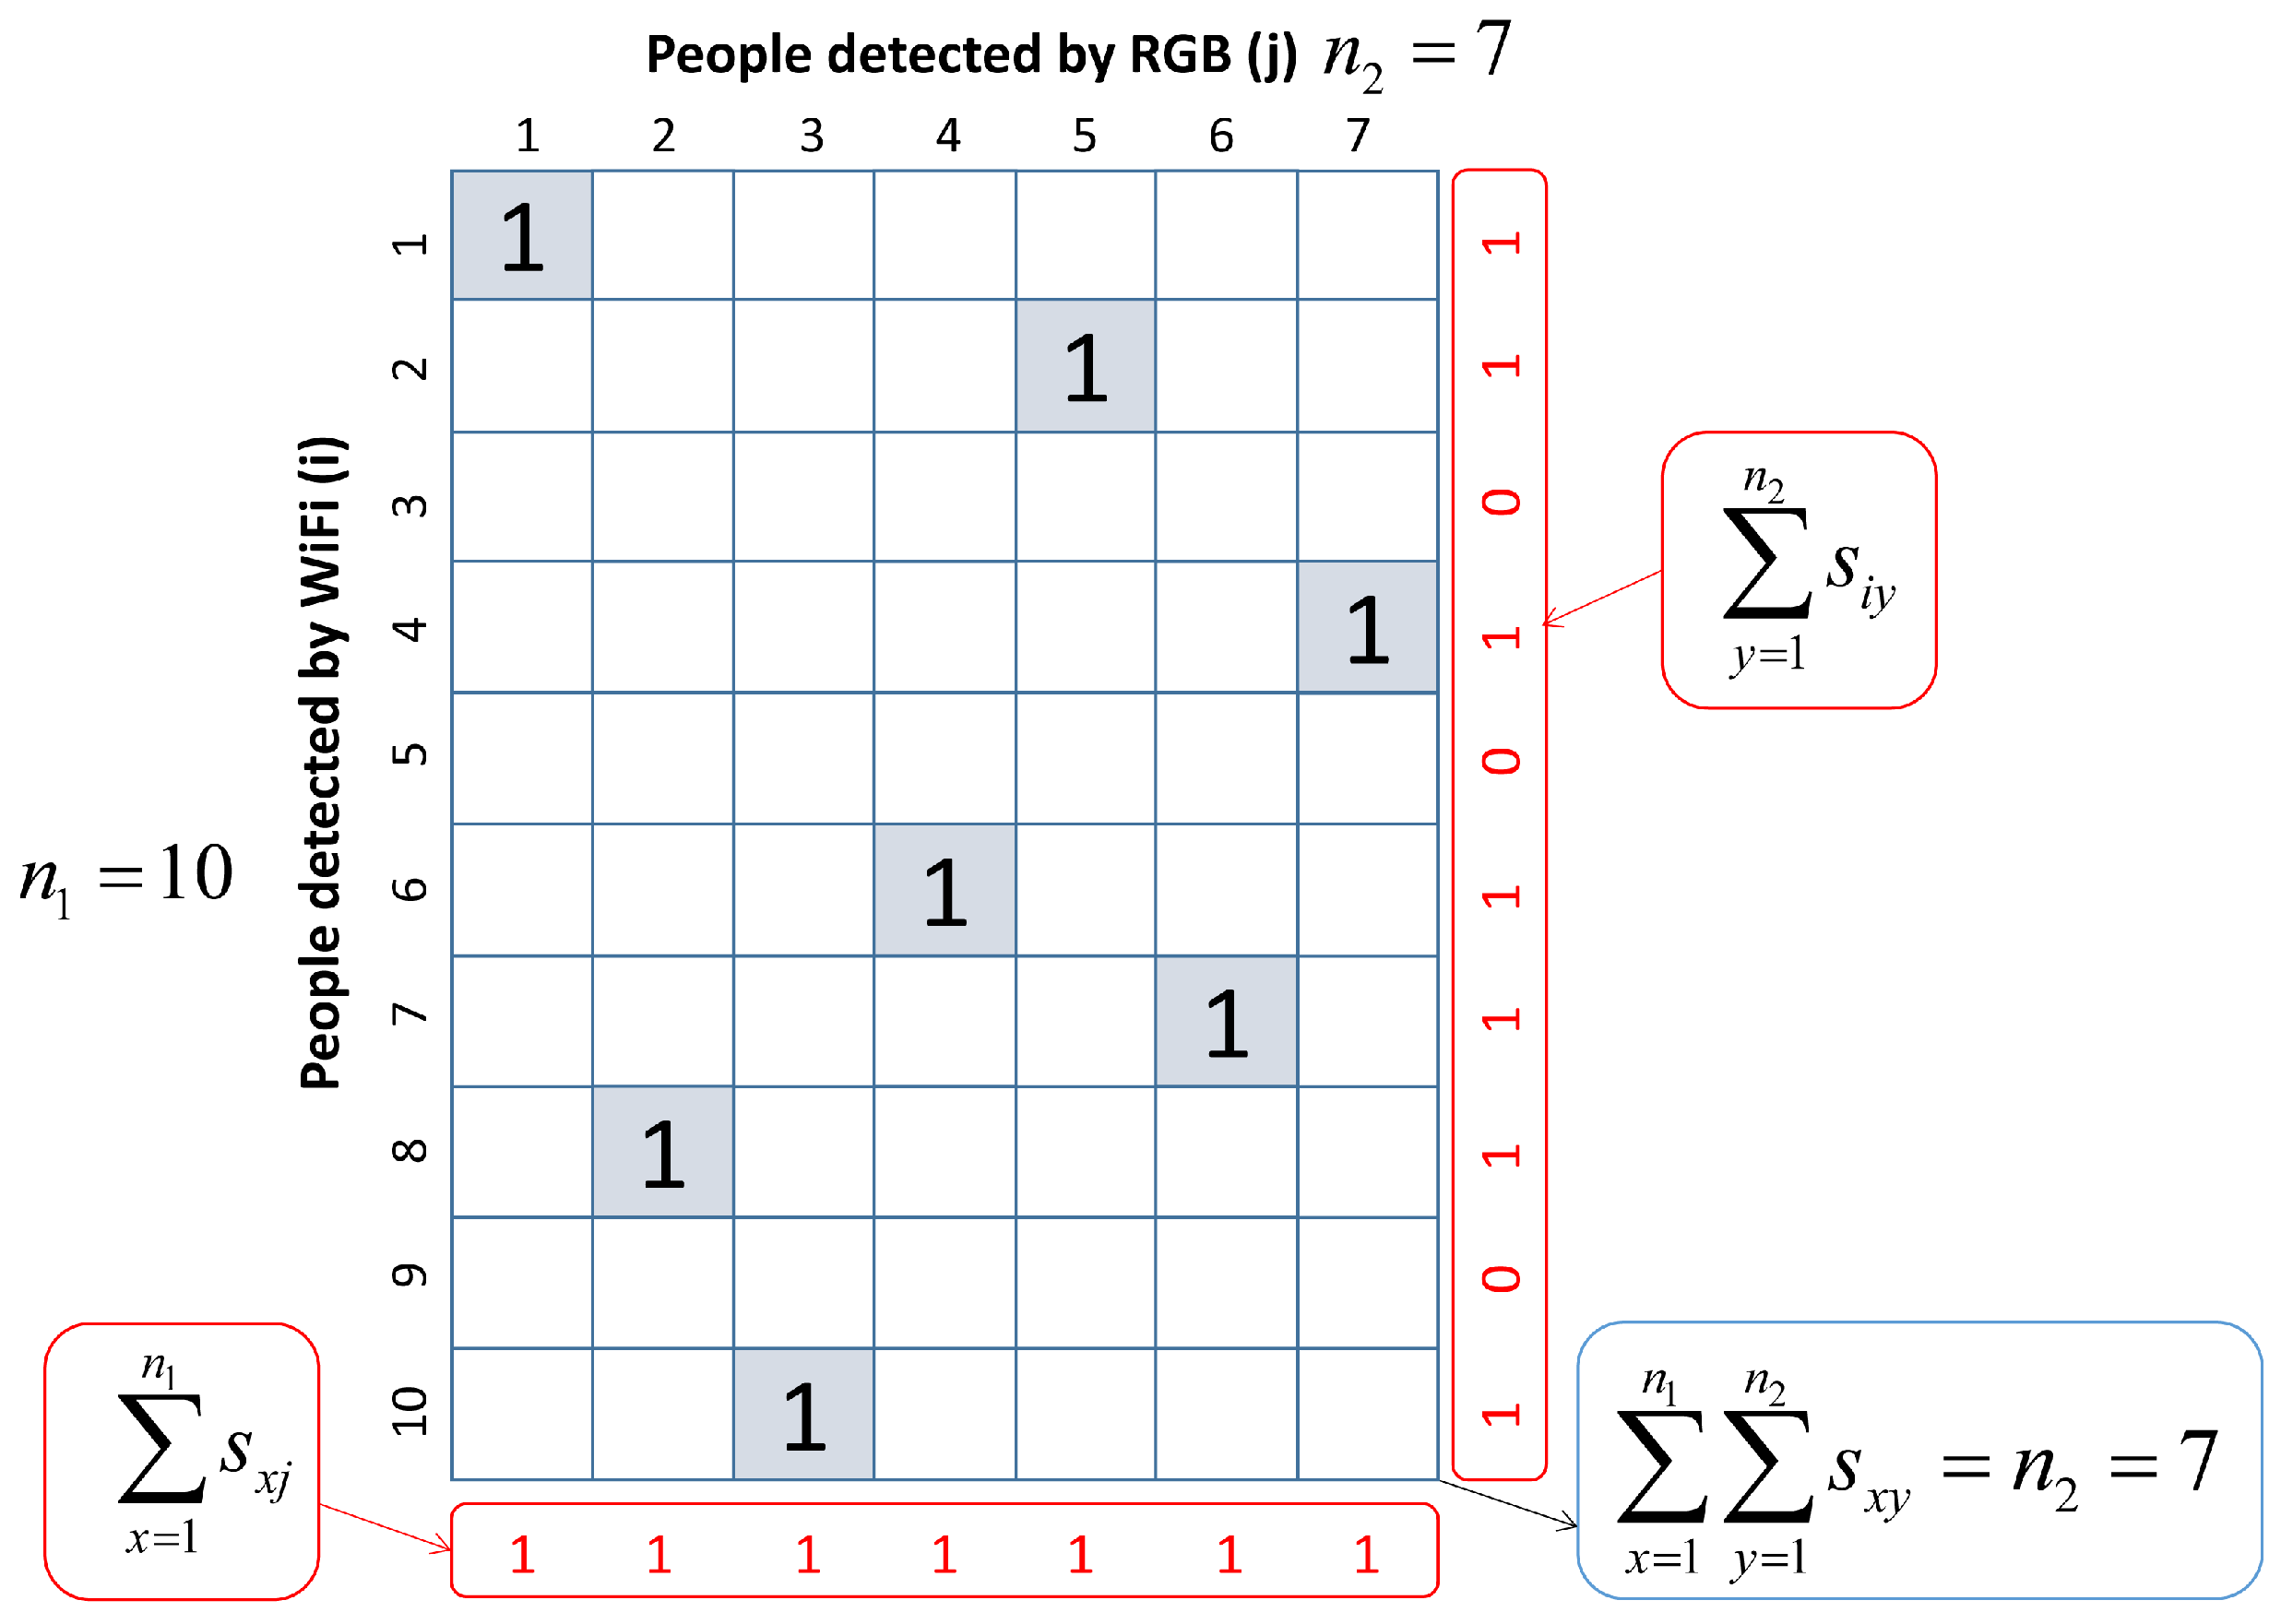
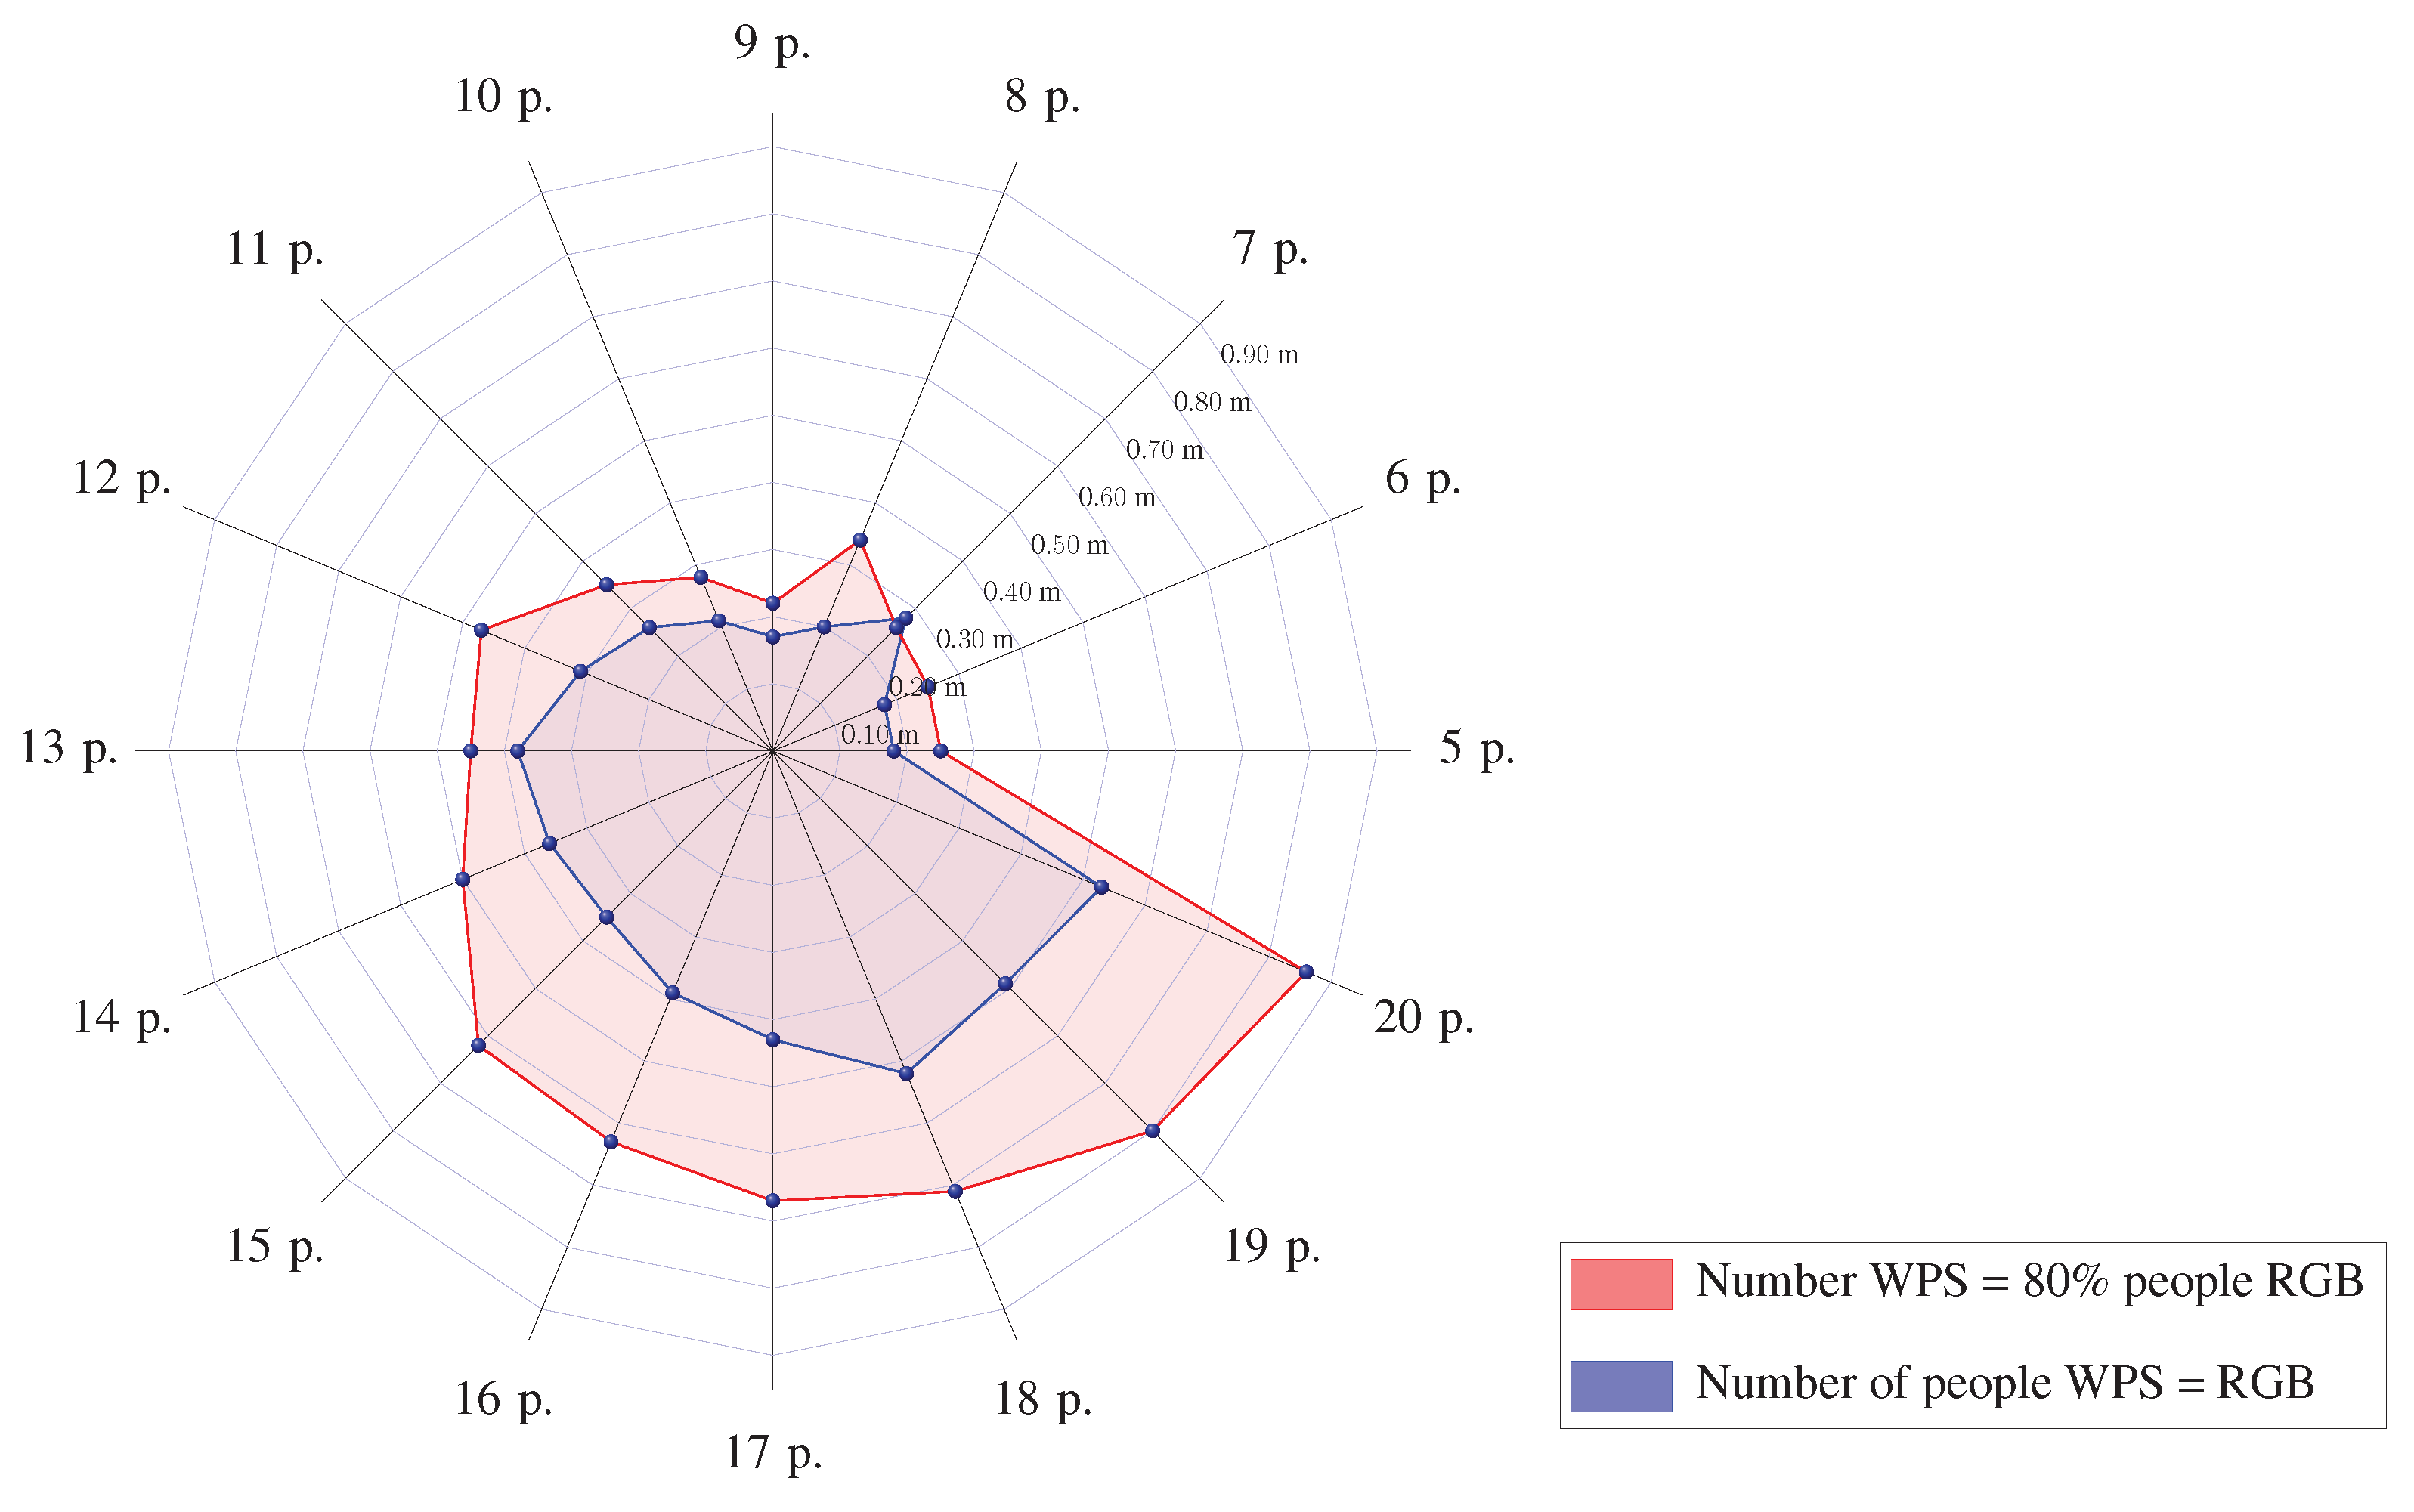
- Let be the number of persons detected by WiFi and be the number of persons detected by RGB.
- Let m be the number of time stamps to be considered and T the time stamp duration. Both positioning systems provide their corresponding position measurement for a concrete number of people in each time stamp: people in WiFi and in RGB.
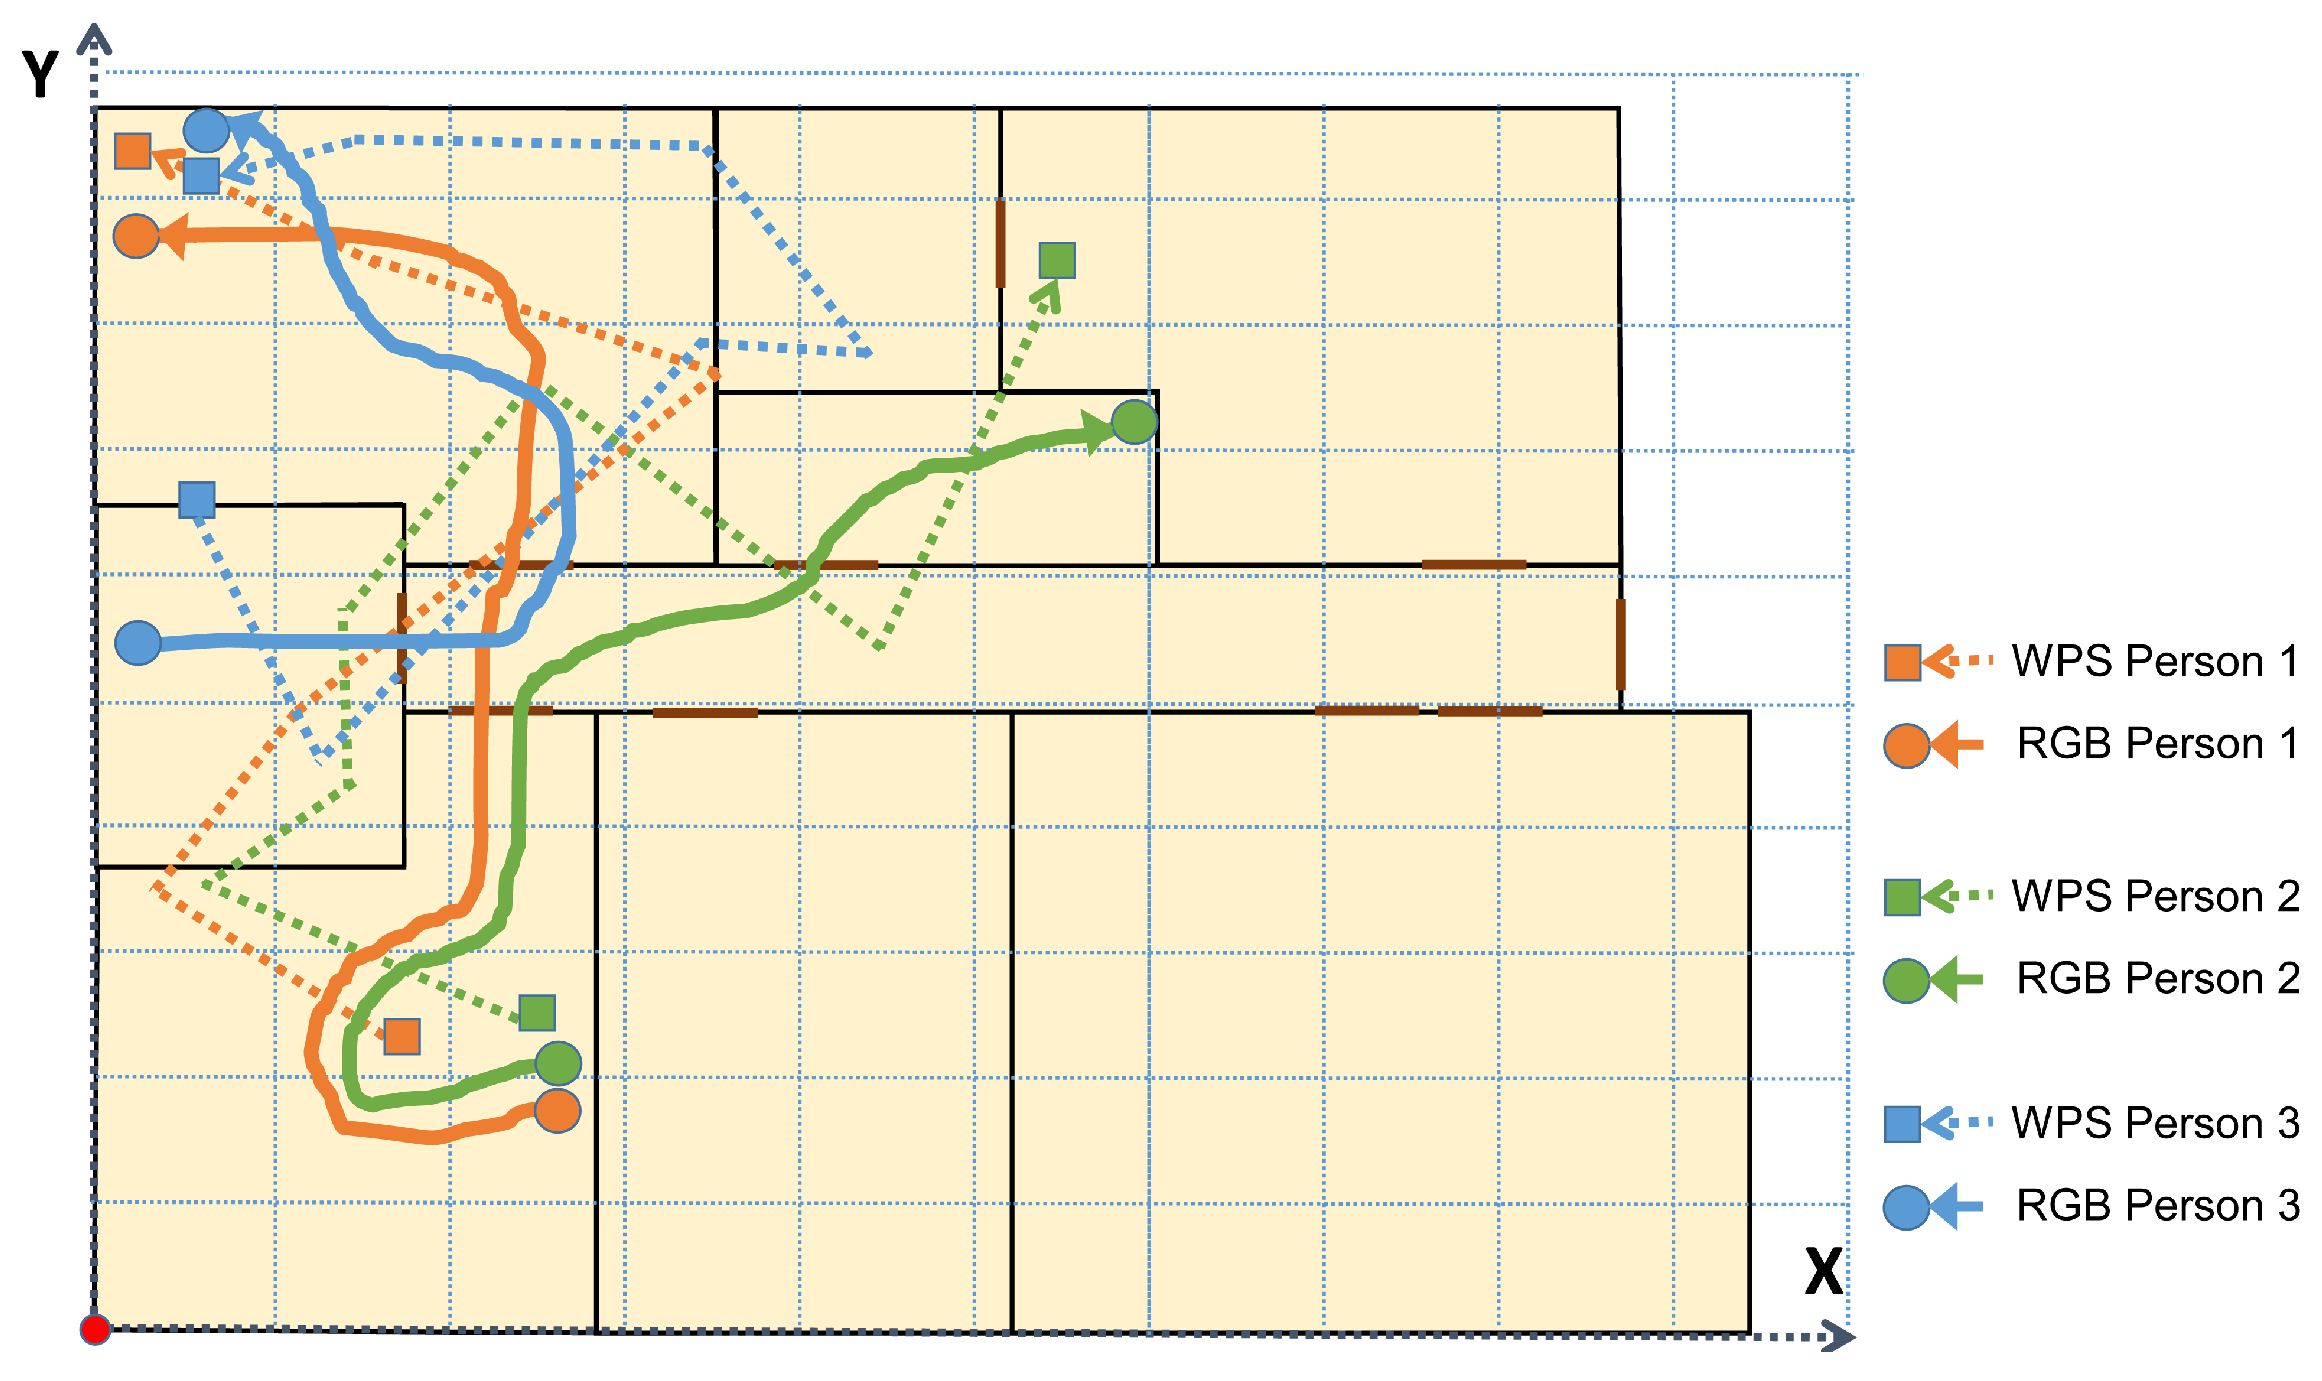
- Let be the position of the person i provided by the WiFi at the time stamp kT, and be the position of the person j provided by the RGB cameras at the time stamp t. The problem consists in determining, for all the time stamps considered, the best trajectory estimation of people by determining the data pairing set that corresponds to individuals detected by WiFi (smartphone signal) and RGB cameras.
- Let be the binary element of the Matching Matrix, S, in row i, column j. This matrix links the WiFi trajectories with their respective RGB, being if the person is detected by the WiFi and cameras, and 0 otherwise.
4. Experiments and Discussion
5. Conclusions
Author Contributions
Funding
Conflicts of Interest
References
- Lymberopoulos, D.; Liu, J.; Yang, X.; Choudhury, R.R.; Handziski, V.; Sen, S. A realistic evaluation and comparison of indoor location technologies: Experiences and lessons learned. In Proceedings of the 14th International Conference on Information Processing in Sensor Networks, Seattle, WC, USA, 13–16 April 2015; pp. 178–189. [Google Scholar]
- Beder, C.; Klepal, M. Fingerprinting based localisation revisited: A rigorous approach for comparing RSSI measurements coping with missed access points and differing antenna attenuations. In Proceedings of the 2012 International Conference on Indoor Positioning and Indoor Navigation (IPIN), Sydney, NSW, Australia, 13–15 November 2012; pp. 1–7. [Google Scholar]
- Viola, P.; Jones, M.J. Robust real-time face detection. Int. J. Comput. Vis. 2004, 57, 137–154. [Google Scholar] [CrossRef]
- Schroff, F.; Kalenichenko, D.; Philbin, J. Facenet: A unified embedding for face recognition and clustering. In Proceedings of the IEEE Conference on Computer Vision and Pattern Recognition, Boston, MA, USA, 7–12 June 2015; pp. 815–823. [Google Scholar]
- Narayan, N.; Sankaran, N.; Arpit, D.; Dantu, K.; Setlur, S.; Govindaraju, V. Person Re-identification for Improved Multi-person Multi-camera Tracking by Continuous Entity Association. In Proceedings of the IEEE Conference on Computer Vision and Pattern Recognition Workshops, Honolulu, HI, USA, 21–26 July 2017; pp. 64–70. [Google Scholar]
- Weerasinghe, I.T.; Ruwanpura, J.Y.; Boyd, J.E.; Habib, A.F. Application of Microsoft Kinect sensor for tracking construction workers. In Proceedings of the Construction Research Congress, West Lafayette, IN, USA, 21–23 May 2012; pp. 858–867. [Google Scholar]
- Duque Domingo, J.; Cerrada, C.; Valero, E.; Cerrada, J. An improved indoor positioning system using RGB-D cameras and wireless networks for use in complex environments. Sensors 2017, 17, 2391. [Google Scholar] [CrossRef] [PubMed] [Green Version]
- Mohedano, R.; Del-Blanco, C.R.; Jaureguizar, F.; Salgado, L.; García, N. Robust 3d people tracking and positioning system in a semi-overlapped multi-camera environment. In Proceedings of the 2008 15th IEEE International Conference on Image Processing, San Diego, CA, USA, 12–15 October 2008; pp. 2656–2659. [Google Scholar]
- Koyuncu, H.; Yang, S.H. A survey of indoor positioning and object locating systems. IJCSNS Int. J. Comput. Sci. Netw. Secur. 2010, 10, 121–128. [Google Scholar]
- Mautz, R.; Tilch, S. Survey of optical indoor positioning systems. In Proceedings of the 2011 International Conference on Indoor Positioning and Indoor Navigation, Guimaraes, Portugal, 21–23 September 2011; pp. 1–7. [Google Scholar]
- Munaro, M.; Basso, F.; Menegatti, E. OpenPTrack: Open source multi-camera calibration and people tracking for RGB-D camera networks. Robot. Autonomous Syst. 2016, 75, 525–538. [Google Scholar] [CrossRef] [Green Version]
- Saputra, M.R.U.; Widyawan, W.; Putra, G.D.; Santosa, P.I. Indoor human tracking application using multiple depth-cameras. In Proceedings of the 2012 International Conference on Advanced Computer Science and Information Systems (ICACSIS), Depok, Indonesia, 1–2 December 2012; pp. 307–312. [Google Scholar]
- Sevrin, L.; Noury, N.; Abouchi, N.; Jumel, F.; Massot, B.; Saraydaryan, J. Characterization of a multi-user indoor positioning system based on low cost depth vision (Kinect) for monitoring human activity in a smart home. In Proceedings of the 2015 37th Annual International Conference of the IEEE Engineering in Medicine and Biology Society (EMBC), Milan, Italy, 25–29 August 2015; pp. 5003–5007. [Google Scholar]
- Nakano, Y.; Izutsu, K.; Tajitsu, K.; Kai, K.; Tatsumi, T. Kinect Positioning System (KPS) and its potential applications. In Proceedings of the International Conference on Indoor Positioning and Indoor Navigation, Sydney, Australia, 13–15 November 2012; Volume 13, p. 15. [Google Scholar]
- Elhayek, A.; Stoll, C.; Kim, K.I.; Theobalt, C. Outdoor human motion capture by simultaneous optimization of pose and camera parameters. Comput. Gr. Forum 2015, 34, 86–98. [Google Scholar] [CrossRef] [Green Version]
- Liu, W.; Chen, Y.; Xiong, Y.; Sun, L.; Zhu, H. Optimization of Sampling Cell Size for Fingerprint Positioning. Int. J. Distrib. Sens. Netw. 2014, 2014, 273801. [Google Scholar] [CrossRef] [Green Version]
- Khoshelham, K.; Zlatanova, S. Sensors for Indoor Mapping and Navigation; Multidisciplinary Digital Publishing Institute: Basel, Switzerland, 2016. [Google Scholar]
- He, S.; Chan, S.H.G. Wi-Fi fingerprint-based indoor positioning: Recent advances and comparisons. IEEE Commun. Surv. Tutor. 2016, 18, 466–490. [Google Scholar] [CrossRef]
- Torres-Sospedra, J.; Jiménez, A.; Moreira, A.; Lungenstrass, T.; Lu, W.C.; Knauth, S.; Mendoza-Silva, G.; Seco, F.; Pérez-Navarro, A.; Nicolau, M.; et al. Off-line evaluation of mobile-centric indoor positioning systems: The experiences from the 2017 IPIN competition. Sensors 2018, 18, 487. [Google Scholar] [CrossRef] [Green Version]
- Guo, X.; Shao, W.; Zhao, F.; Wang, Q.; Li, D.; Luo, H. WiMag: Multimode fusion localization system based on Magnetic/WiFi/PDR. In Proceedings of the 2016 International Conference on Indoor Positioning and Indoor Navigation (IPIN), Alcala de Henares, Spain, 4–7 October 2016; pp. 1–8. [Google Scholar]
- Chen, G.; Meng, X.; Wang, Y.; Zhang, Y.; Tian, P.; Yang, H. Integrated WiFi/PDR/Smartphone using an unscented kalman filter algorithm for 3D indoor localization. Sensors 2015, 15, 24595–24614. [Google Scholar] [CrossRef] [Green Version]
- Chen, Z.; Zou, H.; Jiang, H.; Zhu, Q.; Soh, Y.; Xie, L. Fusion of WiFi, smartphone sensors and landmarks using the Kalman filter for indoor localization. Sensors 2015, 15, 715–732. [Google Scholar] [CrossRef]
- Li, X.; Wang, J.; Liu, C.; Zhang, L.; Li, Z. Integrated WiFi/PDR/smartphone using an adaptive system noise extended Kalman filter algorithm for indoor localization. ISPRS Int. J. Geo-Inf. 2016, 5, 8. [Google Scholar] [CrossRef] [Green Version]
- Deng, Z.; Yu, Y.; Yuan, X.; Wan, N.; Yang, L. Situation and development tendency of indoor positioning. China Commun. 2013, 10, 42–55. [Google Scholar] [CrossRef]
- Harle, R. A Survey of Indoor Inertial Positioning Systems for Pedestrians. IEEE Commun. Surv. Tutor. 2013, 15, 1281–1293. [Google Scholar] [CrossRef]
- Barton, R.; Henry, J.; Bassaly, J.; Sulikowski, V. Integrating Computer Vision and Wireless Data to Provide Identification. U.S. Patent 10/176,379, 8 January 2019. [Google Scholar]
- Su, H.K.; Liao, Z.X.; Lin, C.H.; Lin, T.M. A hybrid indoor-position mechanism based on bluetooth and WiFi communications for smart mobile devices. In Proceedings of the 2015 International Symposium on Bioelectronics and Bioinformatics (ISBB), Beijing, China, 14–17 October 2015; pp. 188–191. [Google Scholar]
- Papapostolou, A.; Chaouchi, H. Integrating RFID and WLAN for indoor positioning and IP movement detection. Wirel. Netw. 2012, 18, 861–879. [Google Scholar] [CrossRef]
- Machaj, J.; Brida, P. Impact of optimization algorithms on hybrid indoor positioning based on GSM and Wi-Fi signals. Concurr. Comput. Pract. Exp. 2016, 29, e3911. [Google Scholar] [CrossRef]
- Jang, B.; Kim, H.; Kim, J.W. IPSCL: An Accurate Indoor Positioning Algorithm Using Sensors and Crowdsourced Landmarks. Sensors 2019, 19, 2891. [Google Scholar] [CrossRef] [Green Version]
- Feliz Alonso, R.; Zalama Casanova, E.; Gómez García-Bermejo, J. Pedestrian Tracking Using Inertial Sensors. J. Phys. Agents 2009, 3. [Google Scholar] [CrossRef] [Green Version]
- Biswas, J.; Veloso, M. Multi-sensor mobile robot localization for diverse environments. In RoboCup 2013: Robot World Cup XVII; Springer: Berlin, Germany, 2014; pp. 468–479. [Google Scholar]
- Tsetsos, V.; Anagnostopoulos, C.; Kikiras, P.; Hasiotis, P.; Hadjiefthymiades, S. A human-centered semantic navigation system for indoor environments. In Proceedings of the International Conference on Pervasive Services, Santorini, Greece, 11–14 July 2005; pp. 146–155. [Google Scholar]
- Dudas, P.M.; Ghafourian, M.; Karimi, H.A. ONALIN: Ontology and algorithm for indoor routing. In Proceedings of the Tenth International Conference on Mobile Data Management: Systems, Services and Middleware, Taipei, Taiwan, 18–20 May 2009; pp. 720–725. [Google Scholar]
- Matuszka, T.; Gombos, G.; Kiss, A. A new approach for indoor navigation using semantic web technologies and augmented reality. In International Conference on Virtual, Augmented and Mixed Reality; Springer: Berlin, Germany, 2013; pp. 202–210. [Google Scholar]
- Lee, K.; Lee, J.; Kwan, M.P. Location-based service using ontology-based semantic queries: A study with a focus on indoor activities in a university context. Comput. Environ. Urban Syst. 2017, 62, 41–52. [Google Scholar] [CrossRef]
- Viola, P.; Jones, M. Rapid object detection using a boosted cascade of simple features. In Proceedings of the 2001 IEEE Computer Society Conference on Computer Vision and Pattern Recognition, Kauai, HI, USA, 8–14 December 2001; pp. 511–518. [Google Scholar]
- Dalal, N.; Triggs, B. Histograms of oriented gradients for human detection. In Proceedings of the International Conference on Computer Vision & Pattern Recognition (CVPR’05), Boston, MA, USA, 7–12 June 2015; Volume 1, pp. 886–893. [Google Scholar]
- Ren, S.; He, K.; Girshick, R.; Sun, J. Faster r-cnn: Towards real-time object detection with region proposal networks. In Proceedings of the Advances in Neural Information Processing, Systems, Montreal, QC, Canada, 7–12 December 2015; pp. 91–99. [Google Scholar]
- Hartley, R.; Zisserman, A. Multiple View Geometry in Computer Vision; Cambridge University Press: Cambridge, UK, 2003. [Google Scholar]
- Focken, D.; Stiefelhagen, R. Towards vision-based 3-d people tracking in a smart room. In Proceedings of the Fourth IEEE International Conference on Multimodal Interfaces, Pittsburgh, PA, USA, 16 October 2002; pp. 400–405. [Google Scholar]
- Mikic, S. Jain. Tracking Objects in 3d Using Multiple Camera Views; Technical Report; University of California: San Diego, CA, USA, 2000. [Google Scholar]
- Chen, L.; Li, B.; Zhao, K.; Rizos, C.; Zheng, Z. An improved algorithm to generate a Wi-Fi fingerprint database for indoor positioning. Sensors 2013, 13, 11085–11096. [Google Scholar] [CrossRef] [Green Version]
- Tang, J.; Chen, Y.; Chen, L.; Liu, J.; Hyyppä, J.; Kukko, A.; Kaartinen, H.; Hyyppä, H.; Chen, R. Fast fingerprint database maintenance for indoor positioning based on UGV SLAM. Sensors 2015, 15, 5311–5330. [Google Scholar] [CrossRef] [Green Version]
- Zhang, P.; Zhao, Q.; Li, Y.; Niu, X.; Zhuang, Y.; Liu, J. Collaborative WiFi fingerprinting using sensor-based navigation on smartphones. Sensors 2015, 15, 17534–17557. [Google Scholar] [CrossRef] [PubMed]
- Duque Domingo, J.; Cerrada, C.; Valero, E.; Cerrada, J. Indoor Positioning System Using Depth Maps and Wireless Networks. J. Sens. 2016. [Google Scholar] [CrossRef] [Green Version]
- Lawson, C.T.; Ravi, S.; Hwang, J.H. Compression and Mining of GPS Trace Data: New Techniques and Applications; Technical Report; Region II University Transportation Research Center; University at Albany: Albany, NY, USA, 2011. [Google Scholar]
- Berkelaar, M.; Eikland, K.; Notebaert, P. lpsolve: Open Source (Mixed-Integer) Linear Programming System; Eindhoven University of Technology: Eindhoven, The Netherlands, 2004; Volume 63. [Google Scholar]
- Domingo, J.D.; Cerrada, C.; Valero, E.; Cerrada, J.A. A Semantic Approach to Enrich User Experience in Museums Through Indoor Positioning. In International Conference on Ubiquitous Computing and Ambient Intelligence; Springer: Berlin, Germany, 2017; pp. 612–623. [Google Scholar]
- Isaac, A.; Haslhofer, B. Europeana linked open data (data.europeana.eu). Semantic Web 2013, 4, 291–297. [Google Scholar] [CrossRef]


| Time Stamp | RSSI Values (dBm) | RSSI Fingerprint map of Corresponding WPS Cell (dBm) | WPS Cell | RGB UCS Coordinates (m) |
|---|---|---|---|---|
| 1 | AP1:72.0; AP2:25.0; AP3:67.0; AP4:72.0; AP5:72.0; AP6:77.0; AP7:54.0; AP8:87.0; AP9:82.0; AP10:93.0; AP11:85.0; AP12:86.0; AP13:86.0; AP14:87.0; AP15:92.0; AP16:93.0; | AP1:66.96; AP2:36.52; AP3:67.11; AP4:65.74; AP5:69.92; AP6:79.96; AP7:57.14; AP8:84.77; AP9:83.46; AP11:87.12; AP12:89.39; AP13:89.9; AP15:92.14; | (2, 7) | (2.73, 7.01) |
| 2 | AP1:75.0; AP2:26.0; AP3:65.0; AP4:75.0; AP5:73.0; AP6:76.0; AP7:56.0; AP8:87.0; AP9:80.0; AP10:93.0; AP11:85.0; AP12:93.0; AP13:93.0; AP14:90.0; AP15:93.0; AP16:93.0; | AP1:66.96; AP2:36.52; AP3:67.11; AP4:65.74; AP5:69.92; AP6:79.96; AP7:57.14; AP8:84.77; AP9:83.46; AP11:87.12; AP12:89.39; AP13:89.9; AP15:92.14; | (2, 7) | (1.94, 8.05) |
| 3 | AP1:79.0; AP2:32.0; AP3:68.0; AP4:76.0; AP5:75.0; AP6:78.0; AP7:63.0; AP8:84.0; AP9:89.0; AP11:90.0; AP12:87.0; AP13:87.0; AP14:92.0; AP15:93.0; AP16:94.0; | AP1:66.96; AP2:36.52; AP3:67.11; AP4:65.74; AP5:69.92; AP6:79.96; AP7:57.14; AP8:84.77; AP9:83.46; AP11:87.12; AP12:89.39; AP13:89.9; AP15:92.14; | (2, 7) | (2.04, 7.21) |
| 4 | AP1:77.0; AP2:37.0; AP3:70.0; AP4:77.0; AP5:60.0; AP6:80.0; AP7:59.0; AP8:89.0; AP9:79.0; AP11:90.0; AP12:91.0; AP13:92.0; AP15:93.0; AP16:94.0; | AP1:66.96; AP2:36.52; AP3:67.11; AP4:65.74; AP5:69.92; AP6:79.96; AP7:57.14; AP8:84.77; AP9:83.46; AP11:87.12; AP12:89.39; AP13:89.9; AP15:92.14; | (2, 7) | (2.06, 7.19) |
| 5 | AP1:59.0; AP2:31.0; AP3:69.0; AP4:58.0; AP5:63.0; AP6:80.0; AP7:57.0; AP8:84.0; AP9:90.0; AP11:90.0; AP12:89.0; AP13:89.0; | AP1:66.45; AP2:33.32; AP3:68.55; AP4:66.59; AP5:67.95; AP6:77.86; AP7:56.45; AP8:85.95; AP9:83.27; AP11:86.0; AP12:87.65; AP13:86.82; | (1, 7) | (2.34, 6.54) |
| 6 | AP1:67.0; AP2:54.0; AP3:62.0; AP5:62.0; AP4:67.0; AP8:81.0; AP6:73.0; AP7:70.0; AP9:86.0; AP10:88.0; | AP1:63.81; AP2:42.18; AP3:61.81; AP5:67.63; AP4:64.09; AP8:82.8; AP6:79.36; AP7:58.09; AP10:91.0; AP9:84.8; | (2, 6) | (3.16, 3.61) |
| 7 | AP1:53.0; AP3:38.0; AP4:53.0; AP5:65.0; AP2:49.0; AP6:60.0; AP8:73.0; 8c:0c:a3:45:38:5f:82.0; AP7:65.0; AP10:84.0; | AP1:43.0; AP3:54.0; AP4:43.0; AP5:60.0; AP2:60.5; AP6:71.0; AP8:70.0; AP7:62.5; AP10:77.5; | (4, 3) | (1.50, 1.58) |
| 8 | AP1:51.0; AP3:42.0; AP4:51.0; AP5:62.0; AP2:52.0; AP6:61.0; AP7:64.0; AP8:74.0; AP10:82.0; | AP1:50.33; AP3:41.5; AP4:50.66; AP5:65.33; AP2:55.66; AP6:60.16; AP8:73.83; AP7:73.67; AP10:81.33; | (1, 2) | (1.10, 1.20) |
| 9 | AP1:57.0; AP3:43.0; AP4:57.0; AP5:62.0; AP2:55.0; AP6:61.0; AP7:64.0; AP8:71.0; AP9:89.0; AP10:74.0; | AP1:57.85; AP3:42.57; AP4:55.38; AP5:62.57; AP2:55.81; AP6:62.66; AP8:78.0; AP7:70.43; AP10:82.45; AP9:92.67; | (1, 1) | (1.04, 1.17) |
| 10 | AP1:50.0; AP3:37.0; AP4:50.0; AP5:60.0; AP2:51.0; AP6:65.0; AP7:64.0; AP8:74.0; AP10:78.0; | AP1:57.85; AP3:42.57; AP4:55.38; AP5:62.57; AP2:55.81; AP6:62.66; AP8:78.0; AP7:70.43; AP10:82.45; AP9:92.67; | (1, 1) | (0.28, 1.49) |
| WiFiRGB | 5 | 6 | 7 | 8 | 9 | 10 | 11 | 12 | 13 | 14 | 15 | 16 | 17 | 18 | 19 | 20 |
|---|---|---|---|---|---|---|---|---|---|---|---|---|---|---|---|---|
| 5 | 97 | 97 | 93 | 92 | 86 | 81 | 68 | 89 | 77 | 80 | 85 | 67 | 81 | 75 | 50 | 71 |
| 6 | 96 | 98 | 95 | 89 | 92 | 77 | 75 | 93 | 81 | 79 | 72 | 84 | 71 | 45 | 62 | 56 |
| 7 | 92 | 92 | 92 | 90 | 91 | 89 | 84 | 83 | 81 | 70 | 82 | 73 | 69 | 75 | 66 | 62 |
| 8 | 88 | 95 | 90 | 96 | 95 | 92 | 77 | 81 | 82 | 84 | 51 | 80 | 77 | 65 | 60 | 68 |
| 9 | 84 | 74 | 88 | 77 | 98 | 91 | 88 | 72 | 84 | 77 | 71 | 68 | 51 | 66 | 71 | 32 |
| 10 | 81 | 81 | 80 | 82 | 88 | 96 | 76 | 82 | 83 | 75 | 73 | 52 | 80 | 48 | 67 | 45 |
| 11 | 81 | 72 | 86 | 76 | 78 | 93 | 93 | 84 | 83 | 90 | 70 | 72 | 42 | 50 | 43 | 43 |
| 12 | 89 | 82 | 84 | 72 | 78 | 87 | 88 | 90 | 88 | 80 | 74 | 83 | 76 | 71 | 66 | 58 |
| 13 | 82 | 76 | 80 | 79 | 80 | 69 | 80 | 80 | 86 | 85 | 81 | 73 | 78 | 73 | 58 | 70 |
| 14 | 76 | 74 | 73 | 63 | 64 | 80 | 78 | 73 | 83 | 88 | 85 | 79 | 71 | 69 | 65 | 58 |
| 15 | 75 | 77 | 75 | 81 | 72 | 71 | 65 | 69 | 84 | 82 | 88 | 85 | 71 | 71 | 64 | 65 |
| 16 | 81 | 65 | 66 | 69 | 74 | 70 | 55 | 61 | 58 | 71 | 80 | 86 | 81 | 66 | 70 | 61 |
| 17 | 71 | 45 | 68 | 57 | 54 | 68 | 50 | 51 | 68 | 64 | 73 | 66 | 84 | 57 | 47 | 56 |
| 18 | 75 | 76 | 43 | 41 | 61 | 36 | 46 | 67 | 52 | 71 | 58 | 70 | 67 | 79 | 74 | 74 |
| 19 | 50 | 74 | 64 | 35 | 61 | 51 | 57 | 62 | 56 | 57 | 52 | 63 | 69 | 62 | 81 | 58 |
| 20 | 61 | 48 | 65 | 62 | 58 | 31 | 54 | 56 | 63 | 58 | 49 | 61 | 65 | 52 | 60 | 79 |
© 2019 by the authors. Licensee MDPI, Basel, Switzerland. This article is an open access article distributed under the terms and conditions of the Creative Commons Attribution (CC BY) license (http://creativecommons.org/licenses/by/4.0/).
Share and Cite
Duque Domingo, J.; Gómez-García-Bermejo, J.; Zalama, E.; Cerrada, C.; Valero, E. Integration of Computer Vision and Wireless Networks to Provide Indoor Positioning. Sensors 2019, 19, 5495. https://0-doi-org.brum.beds.ac.uk/10.3390/s19245495
Duque Domingo J, Gómez-García-Bermejo J, Zalama E, Cerrada C, Valero E. Integration of Computer Vision and Wireless Networks to Provide Indoor Positioning. Sensors. 2019; 19(24):5495. https://0-doi-org.brum.beds.ac.uk/10.3390/s19245495
Chicago/Turabian StyleDuque Domingo, Jaime, Jaime Gómez-García-Bermejo, Eduardo Zalama, Carlos Cerrada, and Enrique Valero. 2019. "Integration of Computer Vision and Wireless Networks to Provide Indoor Positioning" Sensors 19, no. 24: 5495. https://0-doi-org.brum.beds.ac.uk/10.3390/s19245495