SPR Biosensor Based on Polymer Multi-Mode Optical Waveguide and Nanoparticle Signal Enhancement


 , and
, and 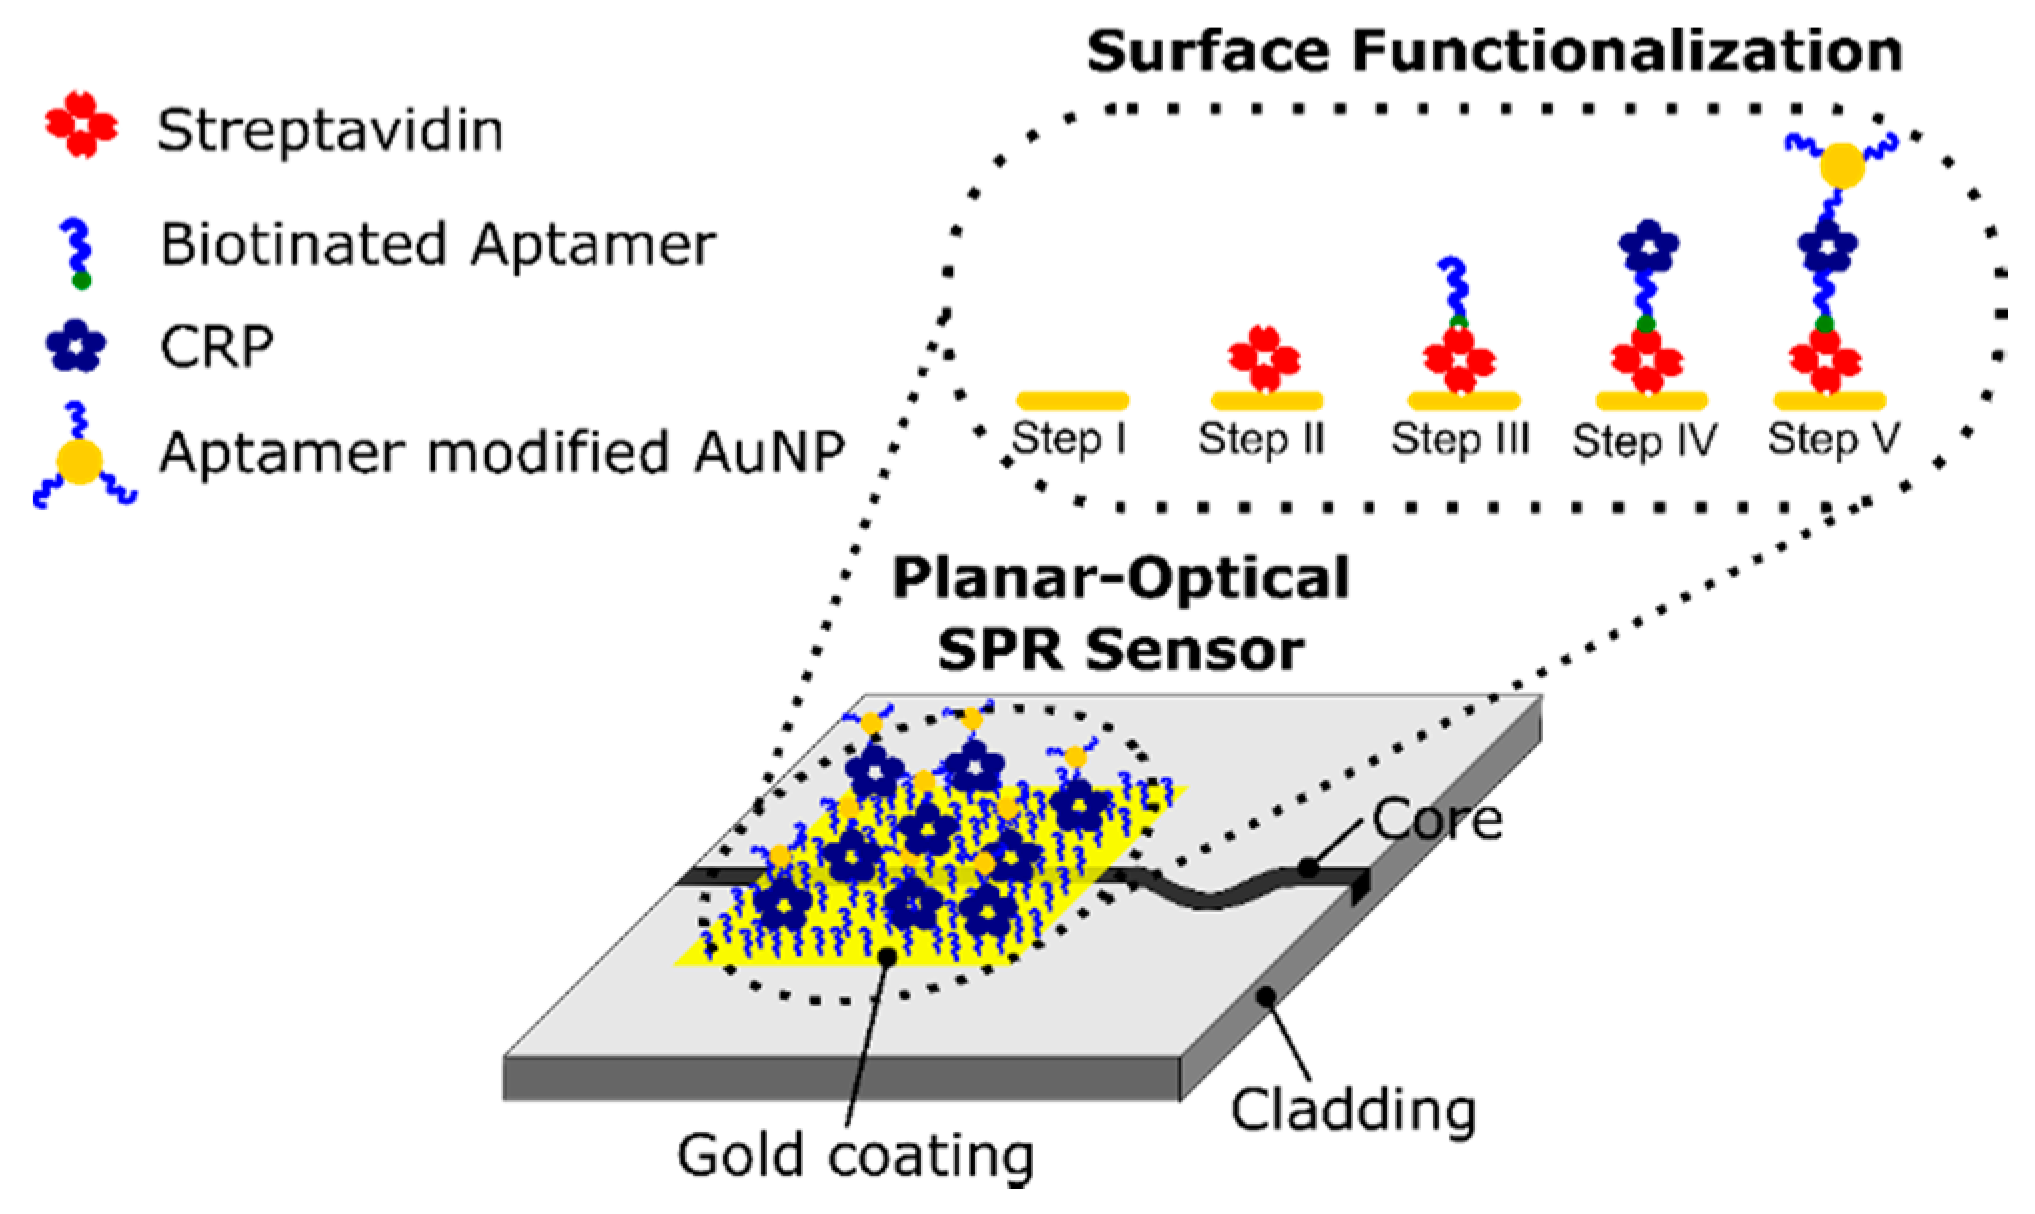
Abstract
:1. Introduction
2. Sensor Design and Fabrication
3. Materials and Methods
3.1. Fabrication of Planar-Optical SPR Waveguide Sensors
3.2. Surface Functionalization for the Detection of CRP
3.3. Synthesis and Modification of AuNPs
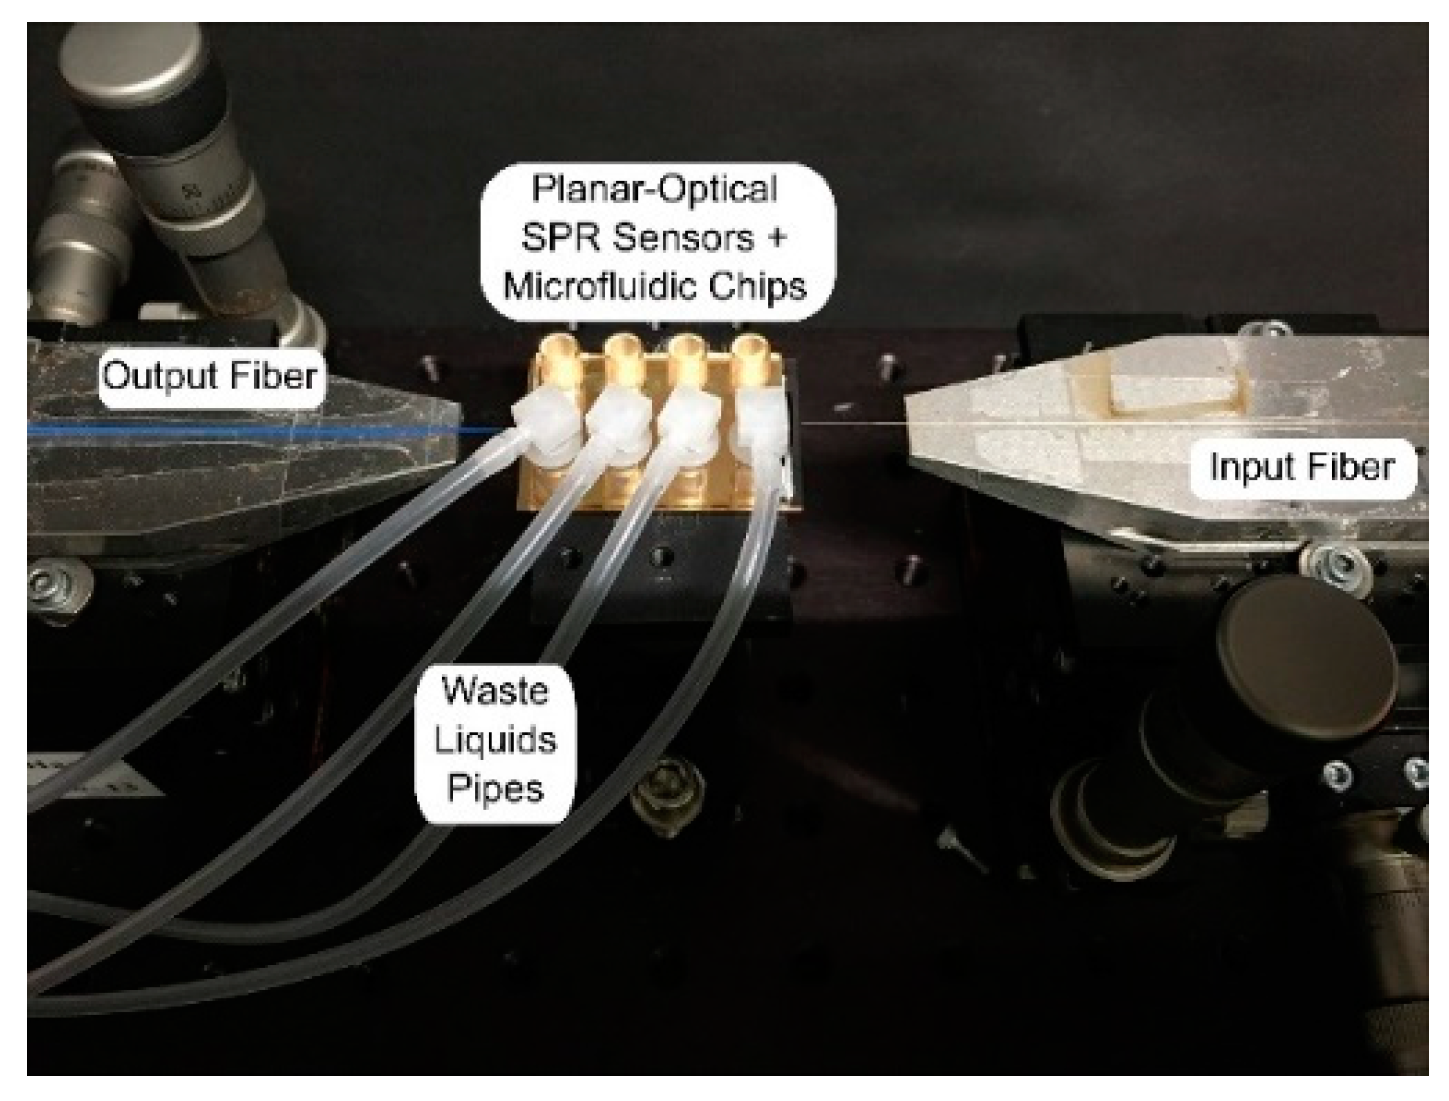
3.4. Experimental Setup
3.5. CRP Sensing
4. Results
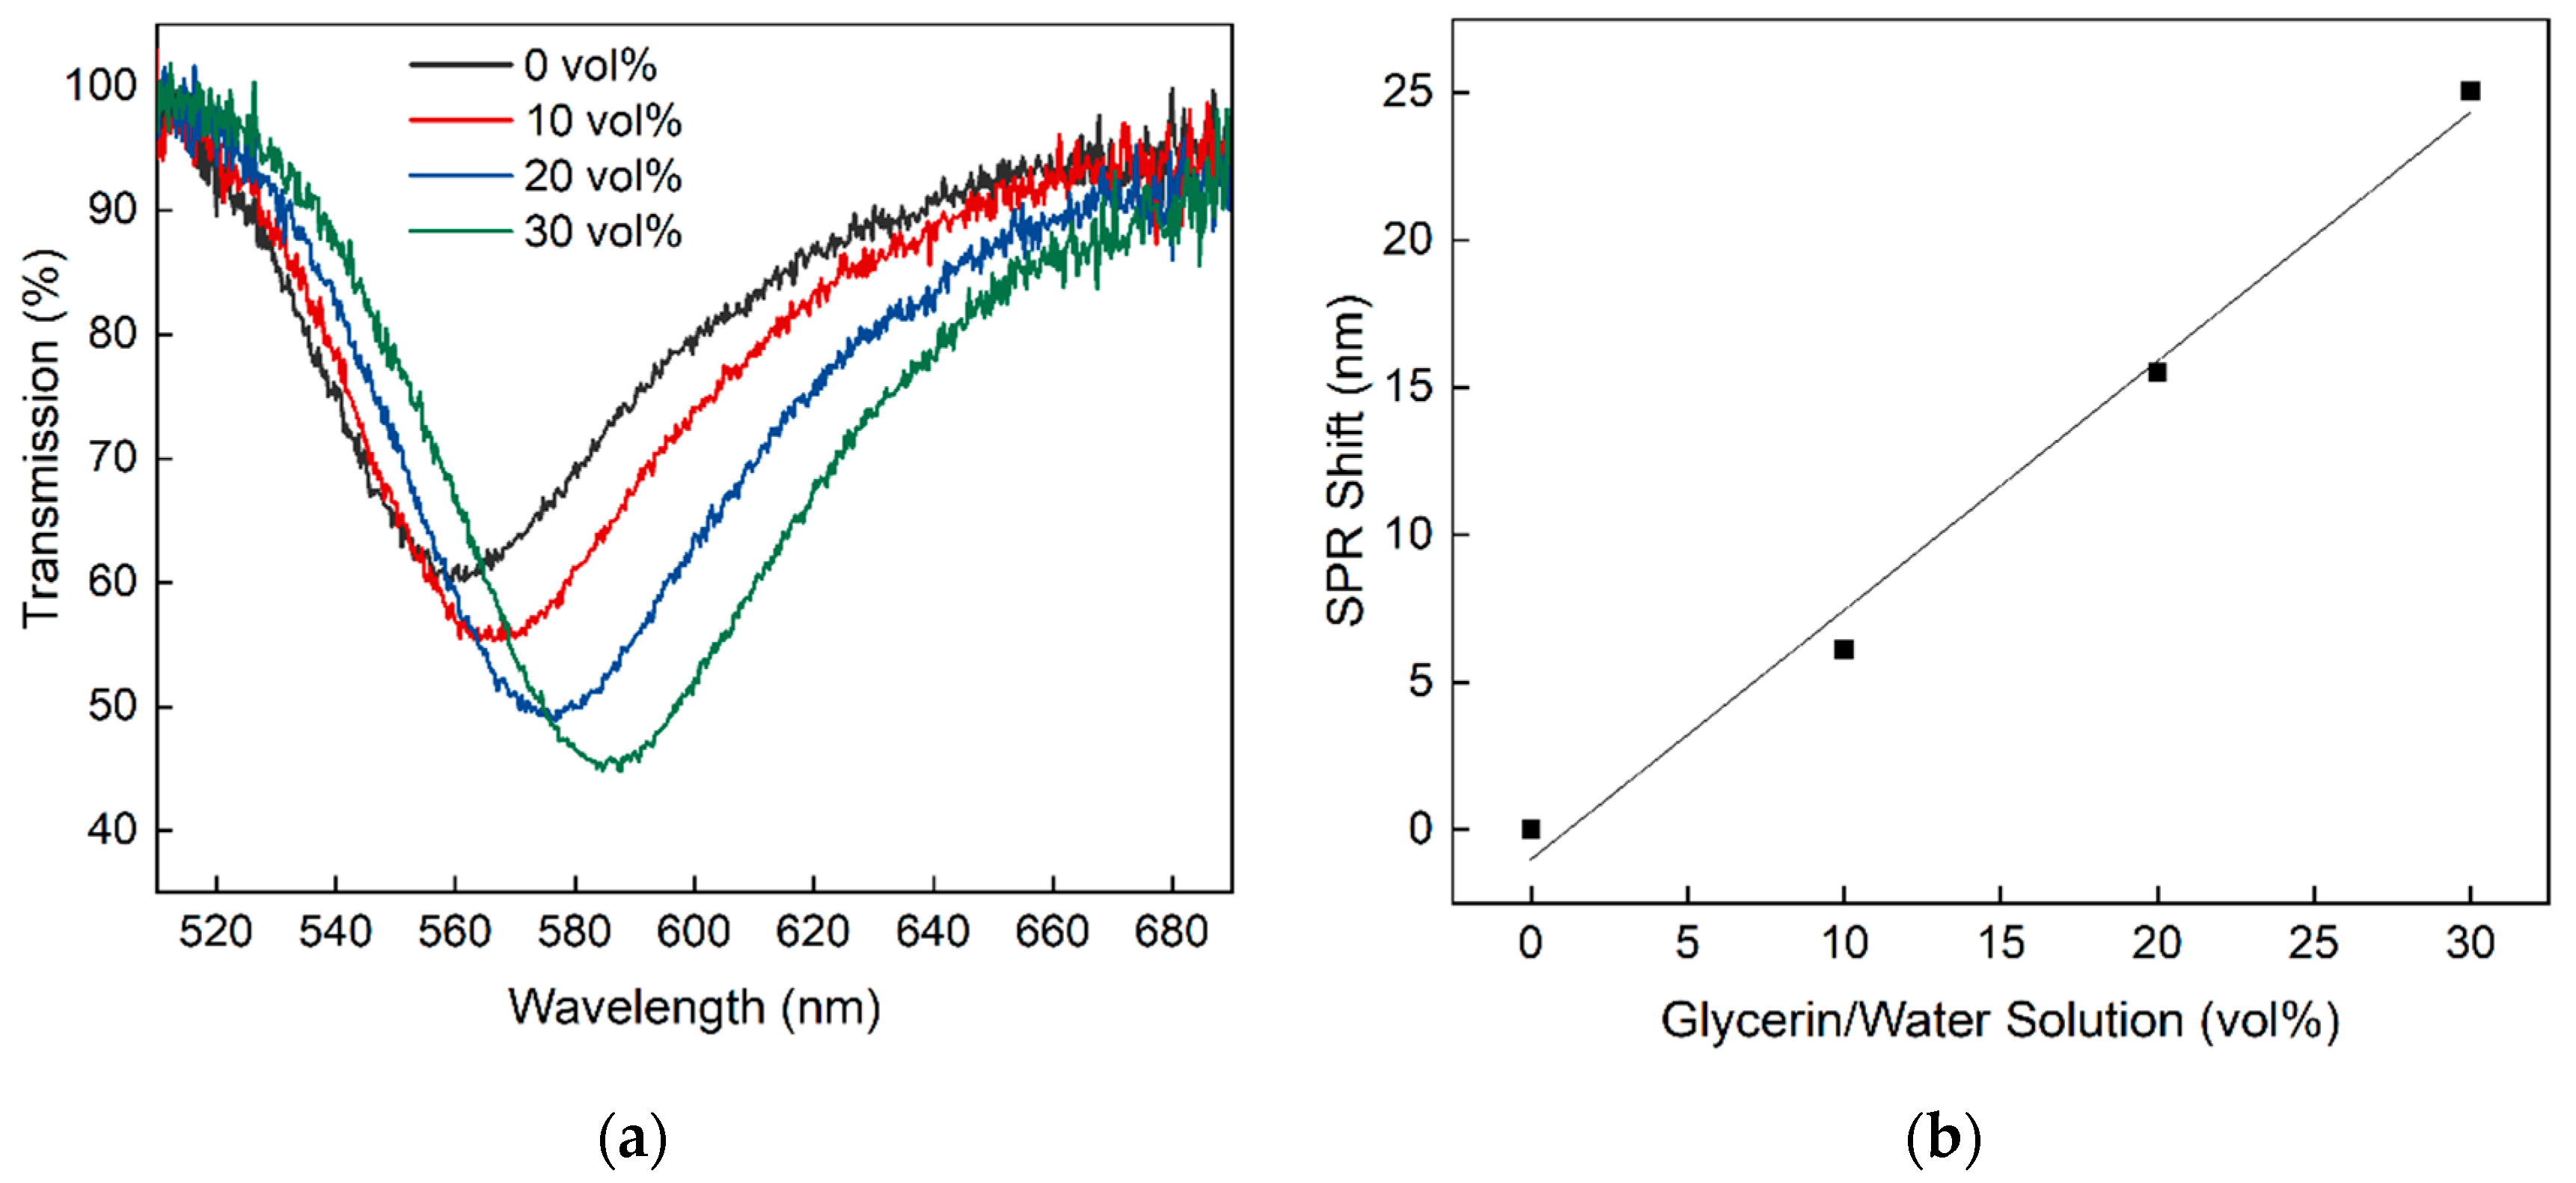
4.1. Response of the Polymer Based Planar MM Optical SPR Sensor to RI Changes
4.2. Signal Noise of Polymer Based MM Planar Optical SPR Sensor
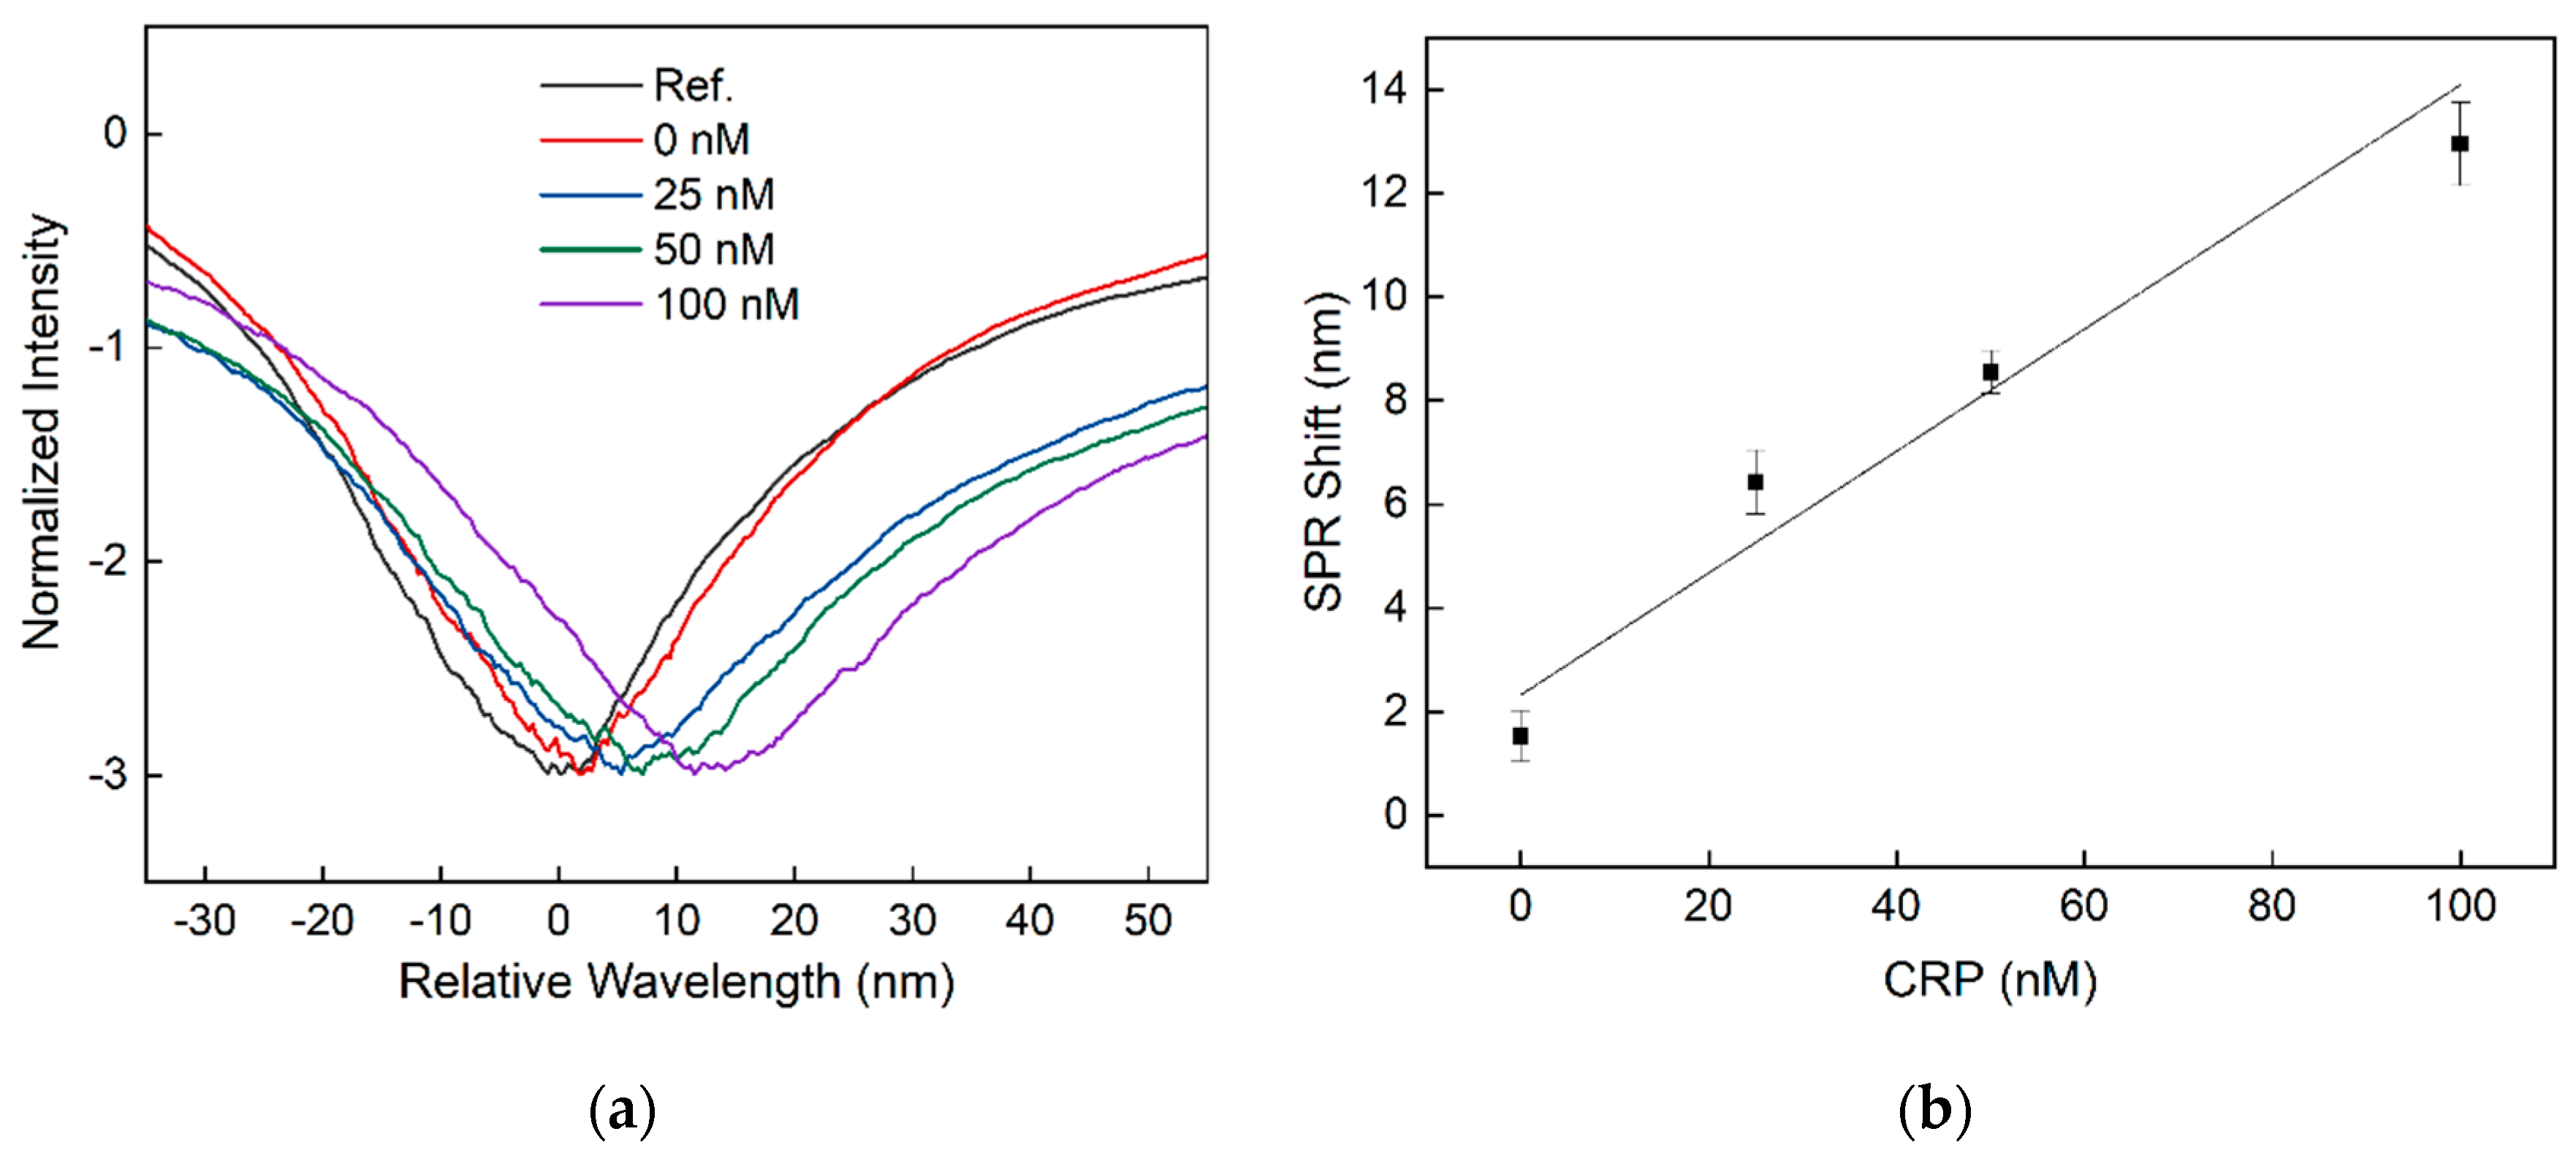
4.3. Detection of CRP Concentration
5. Discussion
6. Conclusions
Author Contributions
Funding
Conflicts of Interest
References
- Sawyers, C. The cancer biomarker problem. Nature 2008, 452, 548–552. [Google Scholar] [CrossRef] [PubMed]
- Nimse, S.; Sonawane, M.; Song, K.; Kim, T. Biomarker detection technologies and future directions. Analyst 2016, 141, 740–755. [Google Scholar] [CrossRef] [PubMed] [Green Version]
- Pirzada, M.; Altintas, Z. Recent Progress in Optical Sensors for Biomedical Diagnostics. Micromachines 2020, 11, 356. [Google Scholar] [CrossRef] [PubMed] [Green Version]
- Liu, J.; Jalali, M.; Mahshid, S.; Wachsmann-Hogiu, S. Are plasmonic optical biosensors ready for use in point-of-need applications? Analyst 2020, 145, 364–384. [Google Scholar] [CrossRef] [PubMed] [Green Version]
- Narayan, T.; Kumar, S.; Kumar, S.; Augustine, S.; Yadav, B.K.; Malhotra, B.D. Protein functionalised self-assembled monolayer based biosensor for colon cancer detection. Talanta 2019, 201, 465–473. [Google Scholar] [CrossRef]
- Liu, X.; Lin, W.; Xiao, P.; Yang, M.; Sun, L.-P.; Zhang, Y.; Xue, W.; Guan, B.-O. Polydopamine-based molecular imprinted optic microfiber sensor enhanced by template-mediated molecular rearrangement for ultra-sensitive C-reactive protein detection. Chem. Eng. J. 2020, 387, 124074. [Google Scholar] [CrossRef]
- Nguyen, H.H.; Park, J.; Kang, S.; Kim, M. Surface plasmon resonance: A versatile technique for biosensor applications. Sensors 2015, 15, 10481–10510. [Google Scholar] [CrossRef] [Green Version]
- Bhardwaj, H.; Sumana, G.; Marquette, C.A. A label-free ultrasensitive microfluidic surface Plasmon resonance biosensor for Aflatoxin B1 detection using nanoparticles integrated gold chip. Food Chem. 2020, 307, 125530. [Google Scholar] [CrossRef]
- Schasfoort, R.B.M. Future Trends in SPR Technology. In Handbook of Surface Plasmon Resonance, 2nd ed.; The Royal Society of Chemistry: London, UK, 2017. [Google Scholar]
- Homola, J. Present and future of surface plasmon resonance biosensors. Anal. Bioanal. Chem. 2003, 377, 528–539. [Google Scholar] [CrossRef]
- Homola, J.; Vaisocherová, H.; Dostálek, J.; Piliarik, M. Multi-analyte surface plasmon resonance biosensing. Methods 2005, 37, 26–36. [Google Scholar] [CrossRef]
- Boozer, C.; Kim, G.; Cong, S.X.; Guan, H.W.; Londergan, T. Looking towards label-free biomolecular interaction analysis in a high-throughput format: A review of new surface plasmon resonance technologies. Curr. Opin. Biotechnol. 2006, 17, 400–405. [Google Scholar] [CrossRef] [PubMed]
- Estevez, M.; Otte, M.A.; Sepulveda, B.; Lechuga, L.M. Trends and challenges of refractometric nanoplasmonic biosensors: A review. Anal. Chim. Acta 2014, 806, 55–73. [Google Scholar] [CrossRef] [PubMed] [Green Version]
- Piliarik, M.; Vaisocherová, H.; Homola, J. Surface Plasmon Resonance Biosensing. In Biosensors and Biodetection; Rasooly, A., Herold, K.E., Eds.; Methods in Molecular Biology™; Humana Press: Totowa, NJ, USA, 2009; Volume 503. [Google Scholar]
- Srivastava, T.; Jha, R.; Das, R. High-Performance Bimetallic SPR Sensor Based on Periodic-Multilayer-Waveguides. IEEE Photon. Technol. Lett. 2011, 23, 1448–1450. [Google Scholar] [CrossRef]
- Wang, Q.; Wang, B. Sensitivity enhanced SPR immunosensor based on graphene oxide and SPA co-modified photonic crystal fiber. Opt. Laser Technol. 2018, 107, 210–215. [Google Scholar] [CrossRef]
- Wang, X.; Wolfbeis, O.S. Fiber-Optic Chemical Sensors and Biosensors (2013–2015). Anal. Chem. 2016, 88, 203–227. [Google Scholar] [CrossRef]
- Wang, X.; Wolfbeis, O.S. Fiber-Optic Chemical Sensors and Biosensors (2015–2019). Anal. Chem. 2020, 92, 397–430. [Google Scholar] [CrossRef]
- Wei, Y.; Liu, C.; Zhang, Y.; Luo, Y.; Nie, X.; Liu, Z.; Zhang, Y.; Peng, F.; Zhou, Z. Multi-channel SPR sensor based on the cascade application of the Single-mode and multimode optical fiber. Opt. Commun. 2017, 390, 82–87. [Google Scholar] [CrossRef]
- Kozma, P.; Kehl, F.; Ehrentreich-Förster, E.; Stamm, C.; Bier, F.F. Integrated planar optical waveguide interferometer biosensors: A comparative review. Biosens. Bioelectron. 2014, 58, 287–307. [Google Scholar] [CrossRef]
- Cennamo, N.; Zeni, L. Polymer Optical Fibers for Sensing. Macromol. Symp. 2020, 389, 1900074. [Google Scholar] [CrossRef]
- Matsushita, T.; Nishikawa, T.; Yamashita, H.; Kishimoto, J.; Okuno, Y. Development of new single-mode waveguide surface plasmon resonance sensor using a polymer imprint process for high-throughput fabrication and improved design flexibility. Sens. Actuators B Chem. 2008, 129, 881–887. [Google Scholar] [CrossRef]
- Mishra, K.S.; Zou, B.; Chiang, K.S. Surface-Plasmon-Resonance Refractive-Index Sensor with Cu-Coated Polymer Waveguide. IEEE Photon. Technol. Lett. 2016, 28, 1835–1838. [Google Scholar] [CrossRef]
- Zeni, L.; Pesavento, M.; Marchetti, S.; Cennamo, N. [INVITED] Slab plasmonic platforms combined with Plastic Optical Fibers and Molecularly Imprinted Polymers for chemical sensing. Opt. Laser Technol. 2018, 107, 484–490. [Google Scholar] [CrossRef]
- Bremer, K.; Roth, B. Fibre optic surface plasmon resonance sensor system designed for smartphones. Opt. Express. 2015, 23, 17179–17184. [Google Scholar] [CrossRef]
- Hastings, J.T. Optimizing surface-plasmon resonance sensors for limit of detection based on a Cramer-Rao bound. IEEE Sens. J. 2008, 8, 170–175. [Google Scholar] [CrossRef]
- Caucheteur, C.; Guo, T.; Albert, J. Review of plasmonic fiber optic biochemical sensors: Improving the limit of detection. Anal. Bioanal. Chem. 2015, 407, 3883–3897. [Google Scholar] [CrossRef] [PubMed]
- Zhan, S.; Lou, X.; Zhou, P.; Xia, F. Sandwich Assays Based on SPR, SERS, GMR, QCM, Microcantilever, SAW, and RRS Techniques for Protein Detection. In Biosensors Based on Sandwich Assays; Xia, F., Zhang, X., Lou, X., Yuan, Q., Eds.; Springer: Singapore, 2018. [Google Scholar]
- Liu, C.; Xue, N.; Cai, H.; Sun, J.; Qi, Z.; Zhao, P.; Xiong, F.; Geng, Z.; Jiang, L.; Li, L. Nanoparticles Enhanced Self-driven Microfludic Biosensor. Micromachines 2020, 11, 350. [Google Scholar] [CrossRef] [PubMed]
- Li, R.; Feng, F.; Chen, Z.Z.; Bai, Y.F.; Guo, F.F.; Wu, F.Y.; Zhou, G. Sensitive detection of carcinoembryonic antigen using surface plasmon resonance biosensor with gold nanoparticles signal amplification. Talanta 2015, 140, 143–149. [Google Scholar] [CrossRef]
- Kim, S.; Lee, J.; Lee, S.J.; Lee, H.J. Ultra-sensitive detection of IgE using biofunctionalized nanoparticle-enhanced SPR. Talanta 2010, 81, 1755–1759. [Google Scholar] [CrossRef]
- Clyne, B.; Olshaker, J.S. The C-reactive protein. J. Emerg. Med. 1999, 17, 1019–1025. [Google Scholar] [CrossRef]
- Wang, W.; Mai, Z.; Chen, Y.; Wang, J.; Li, L.; Su, Q.; Li, X.; Hong, X. A label-free fiber optic SPR biosensor for specific detection of C-reactive protein. Sci. Rep. 2017, 7, 16904. [Google Scholar] [CrossRef]
- Aray, A.; Chiavaioli, F.; Arjmand, M.; Trono, C.; Tombelli, S.; Giannetti, A.; Cennamo, N.; Soltanolkotabi, M.; Zeni, L.; Baldini, F. SPR-based plastic optical fibre biosensor for the detection of C-reactive protein in serum. J. Biophoton. 2016, 9, 1077–1084. [Google Scholar] [CrossRef] [PubMed]
- Kaiser, L.; Weisser, J.; Kohl, M.; Deigner, H. Small molecule detection with aptamer based lateral flow assays: Applying aptamer-C-reactive protein cross-recognition for ampicillin detection. Sci. Rep. 2018, 8, 5628. [Google Scholar] [CrossRef] [PubMed]
- Bini, A.; Centi, S.; Tombelli, S.; Mascini, M. Development of an optical RNA-based aptasensor for C-reactive protein. Anal. Bioanal. Chem. 2008, 390, 1077–1086. [Google Scholar] [CrossRef] [PubMed]
- Johnson, A.; Song, O.; Ferrigno, P.K.; Bueno, P.R.; Davis, J.J. Sensitive Affimer and Antibody Based Impedimetric Label-Free Assays for C-Reactive Protein. Anal. Chem. 2012, 84, 6553–6560. [Google Scholar] [CrossRef]
- Rezem, M.; Günther, A.; Roth, B.; Reithmeier, E.; Rahlves, M. Low-Cost Fabrication of All-Polymer Components for Integrated Photonics. J. Lightwave Technol. 2017, 35, 299–308. [Google Scholar] [CrossRef]
- Rahlves, M.; Günther, A.; Rezem, M.; Roth, B. Polymer-based transmission path for communication and sensing applications. J. Lightwave Technol. 2018, 37, 729–735. [Google Scholar] [CrossRef]
- Huang, C.-J.; Lin, H.I.; Shiesh, S.C.; Lee, G.B. Integrated microfluidic system for rapid screening of CRP aptamers utilizingsystematic evolution of ligands by exponential enrichment (SELEX). Biosens. Bioelectron. 2010, 25, 1761–1766. [Google Scholar] [CrossRef]
- Bastus, N.G.; Comenge, J.; Puntes, V. Kinetically Controlled Seeded Growth Synthesis of Citrate-Stabilized Gold Nanoparticles of up to 200 nm: Size Focusing versus Ostwald Ripening. Langmuir 2011, 27, 11098–11105. [Google Scholar] [CrossRef]
- Bremer, K.; Alwis, L.S.M.; Zheng, Y.; Roth, B. Towards mode-multiplexed fiber sensors: An investigation on the spectral response of etched graded index OM4 multi-mode fiber with Bragg grating for refractive index and temperature measurement. Appl. Sci. 2020, 10, 337. [Google Scholar] [CrossRef] [Green Version]
- Suzuki, A.; Kondoh, J.; Matsui, Y.; Shiokawa, S.; Suzuki, K. Development of novel optical waveguide surface plasmon resonance (SPR) sensor with dual light emitting diodes. Sens. Actuators B Chem. 2005, 106, 383–398. [Google Scholar] [CrossRef]
- Špringer, T.; Homola, J. Biofunctionalized gold nanoparticles for SPR-biosensor-based detection of CEA in blood plasma. Anal. Bioanal. Chem. 2012, 404, 2869–2875. [Google Scholar] [CrossRef] [PubMed]
- Hong, Y.; Hall, E.A.H. Contribution of gold nanoparticles to the signal amplification in surface plasmon resonance. Analyst 2012, 137, 4712. [Google Scholar] [CrossRef] [PubMed]
- Haran, J.P.; Beaudoin, F.L.; Suner, S.; Lu, S. C-reactive protein as predictor of bacterial infection among patients with an influenza-like illness. Am. J. Emerg. Med. 2013, 31, 137–144. [Google Scholar] [CrossRef] [PubMed]


© 2020 by the authors. Licensee MDPI, Basel, Switzerland. This article is an open access article distributed under the terms and conditions of the Creative Commons Attribution (CC BY) license (http://creativecommons.org/licenses/by/4.0/).
Share and Cite
Walter, J.-G.; Eilers, A.; Alwis, L.S.M.; Roth, B.W.; Bremer, K. SPR Biosensor Based on Polymer Multi-Mode Optical Waveguide and Nanoparticle Signal Enhancement. Sensors 2020, 20, 2889. https://0-doi-org.brum.beds.ac.uk/10.3390/s20102889
Walter J-G, Eilers A, Alwis LSM, Roth BW, Bremer K. SPR Biosensor Based on Polymer Multi-Mode Optical Waveguide and Nanoparticle Signal Enhancement. Sensors. 2020; 20(10):2889. https://0-doi-org.brum.beds.ac.uk/10.3390/s20102889
Chicago/Turabian StyleWalter, Johanna-Gabriela, Alina Eilers, Lourdes Shanika Malindi Alwis, Bernhard Wilhelm Roth, and Kort Bremer. 2020. "SPR Biosensor Based on Polymer Multi-Mode Optical Waveguide and Nanoparticle Signal Enhancement" Sensors 20, no. 10: 2889. https://0-doi-org.brum.beds.ac.uk/10.3390/s20102889