Implementation and Evaluation of Open-Source Hardware to Monitor Water Quality in Precision Aquaculture

 ,
,  ,
,
Abstract
:1. Introduction
2. Materials and Methods
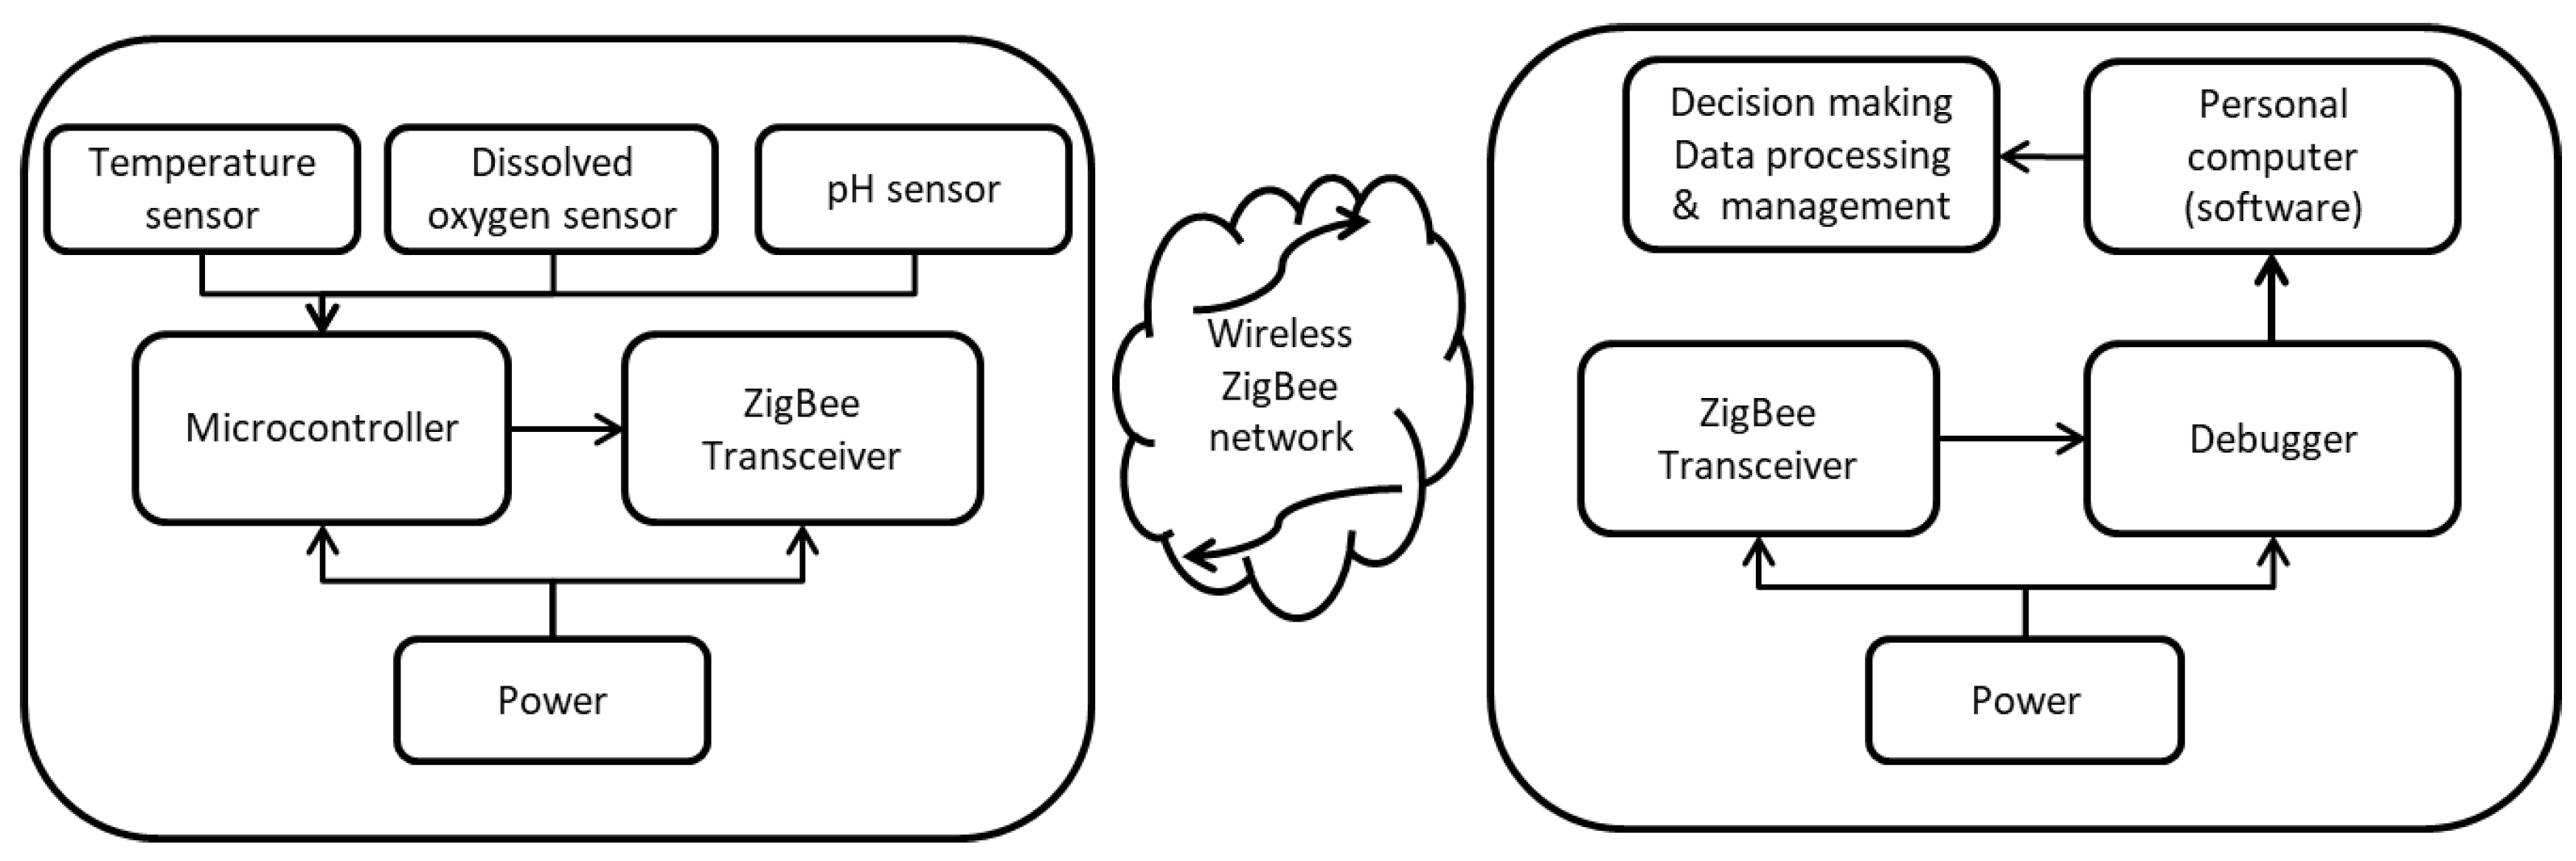
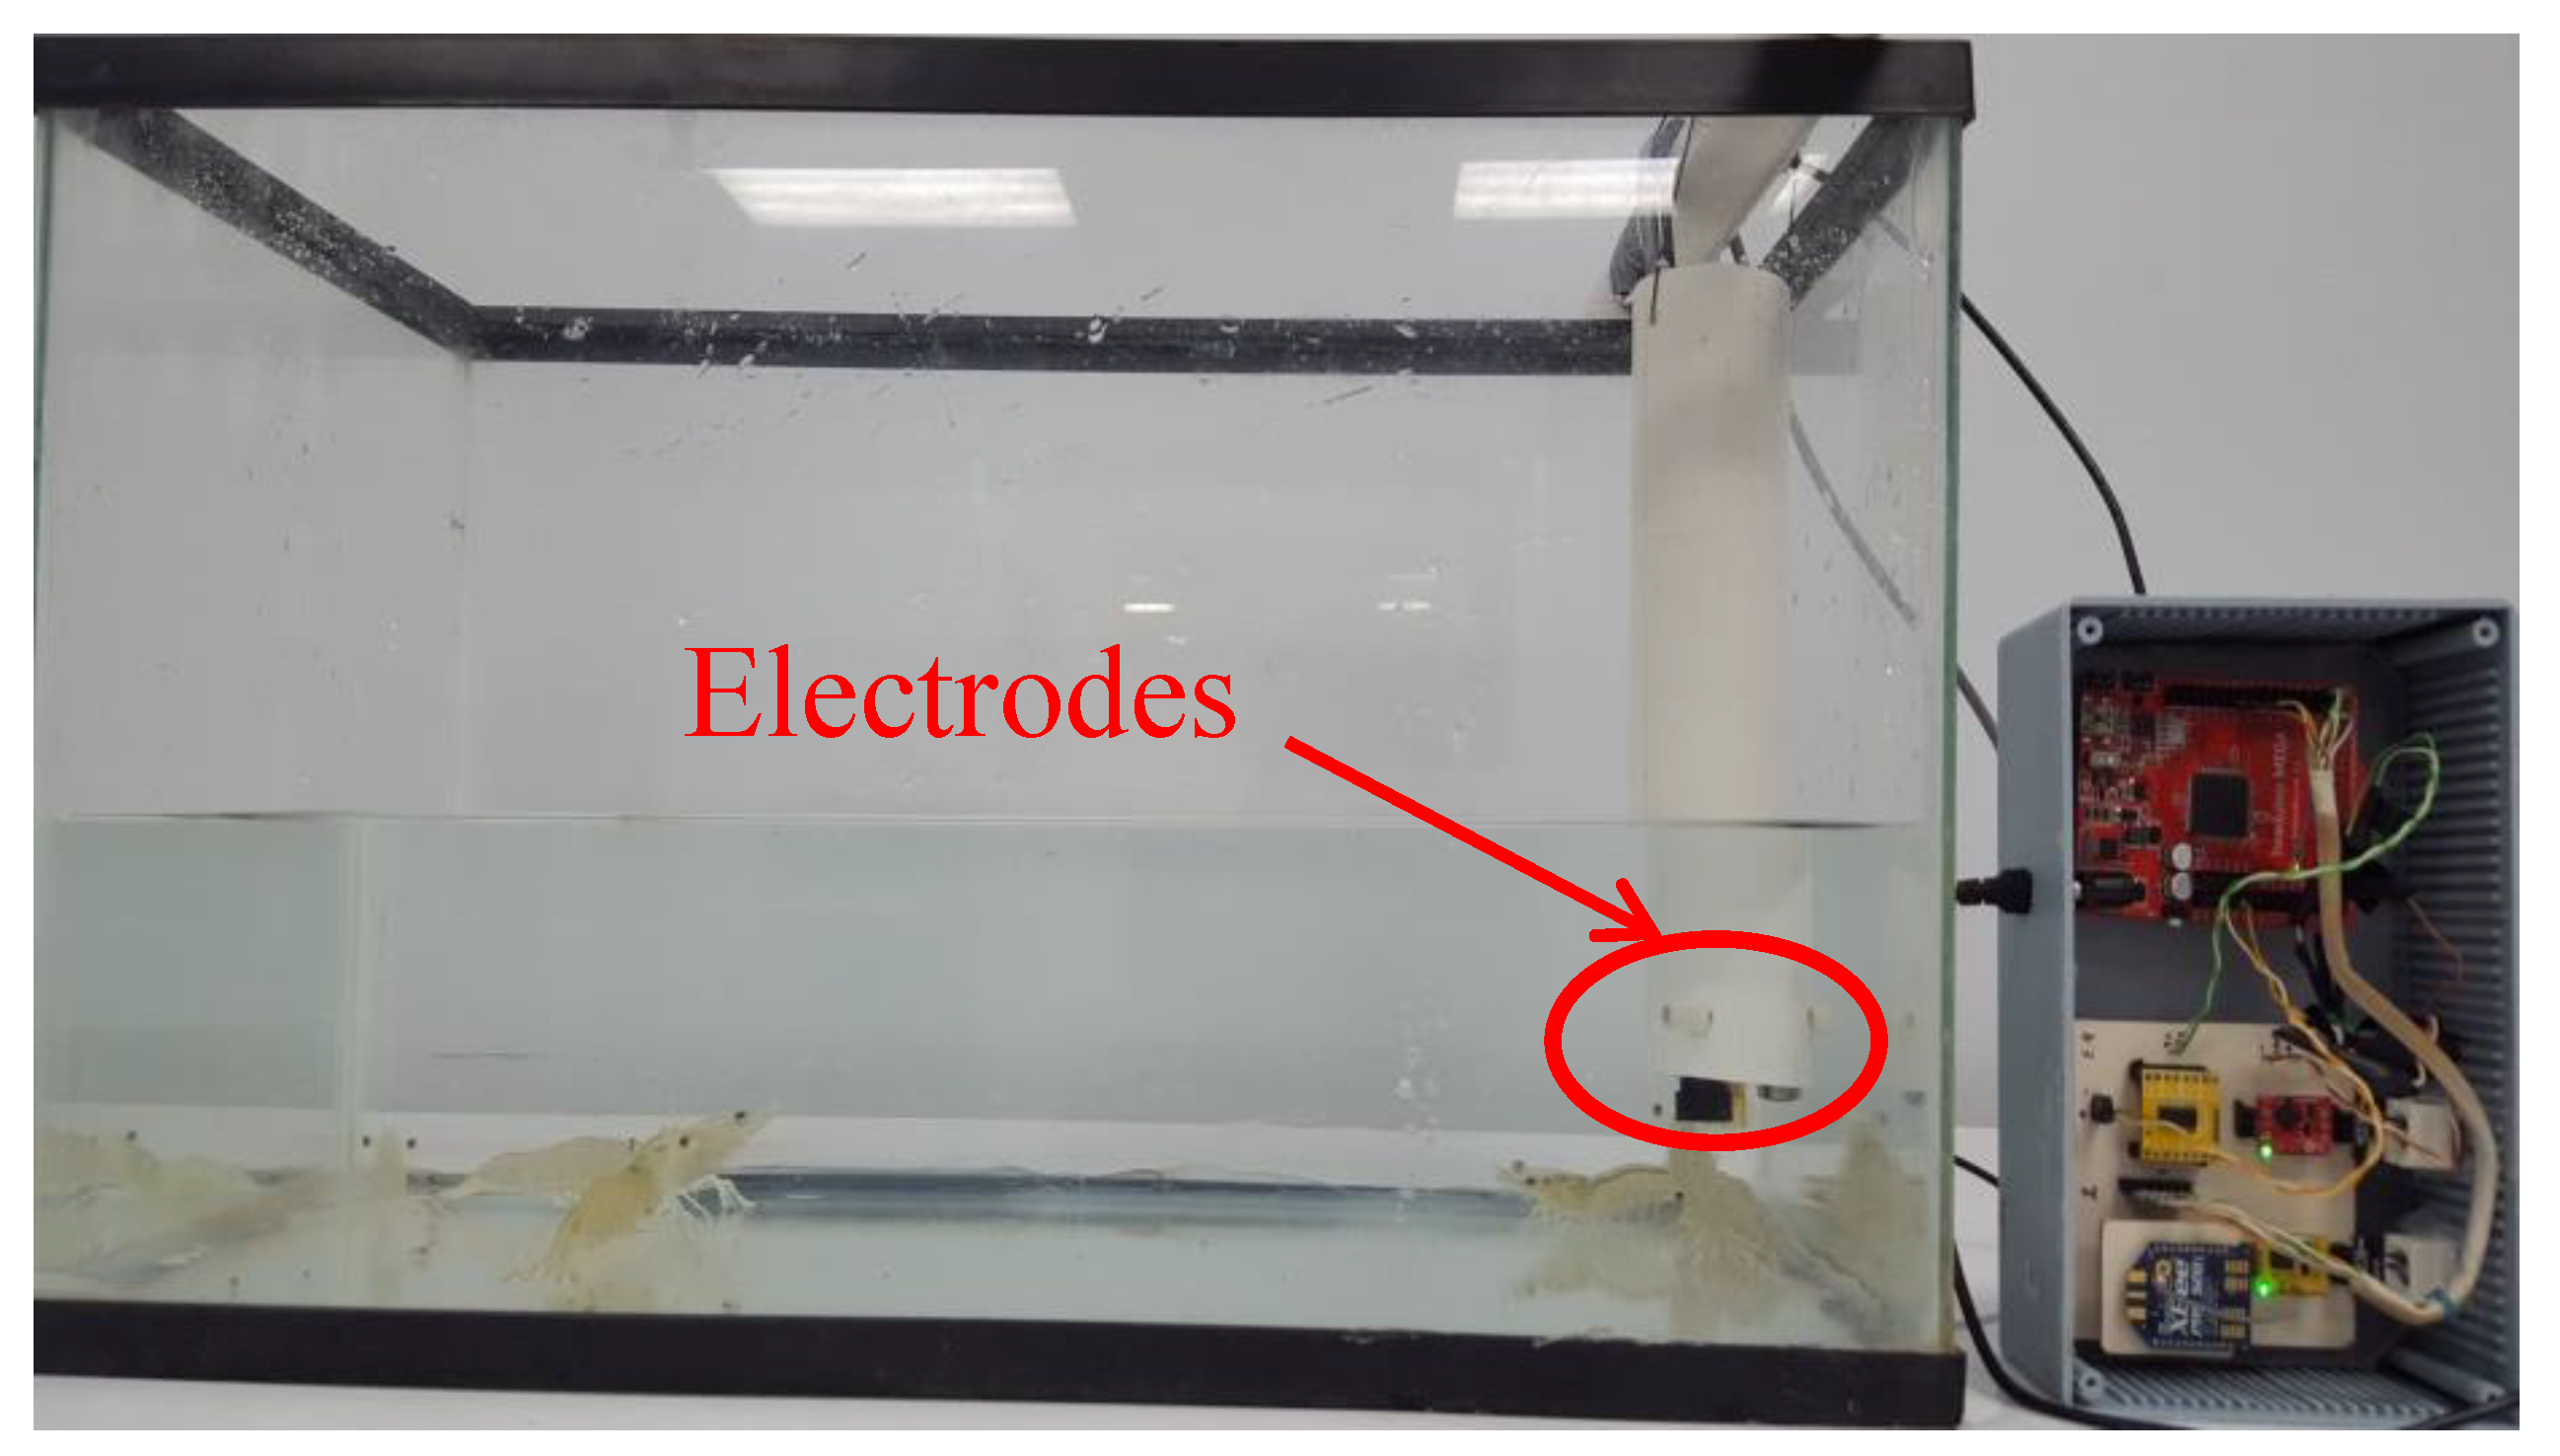
2.1. Hardware
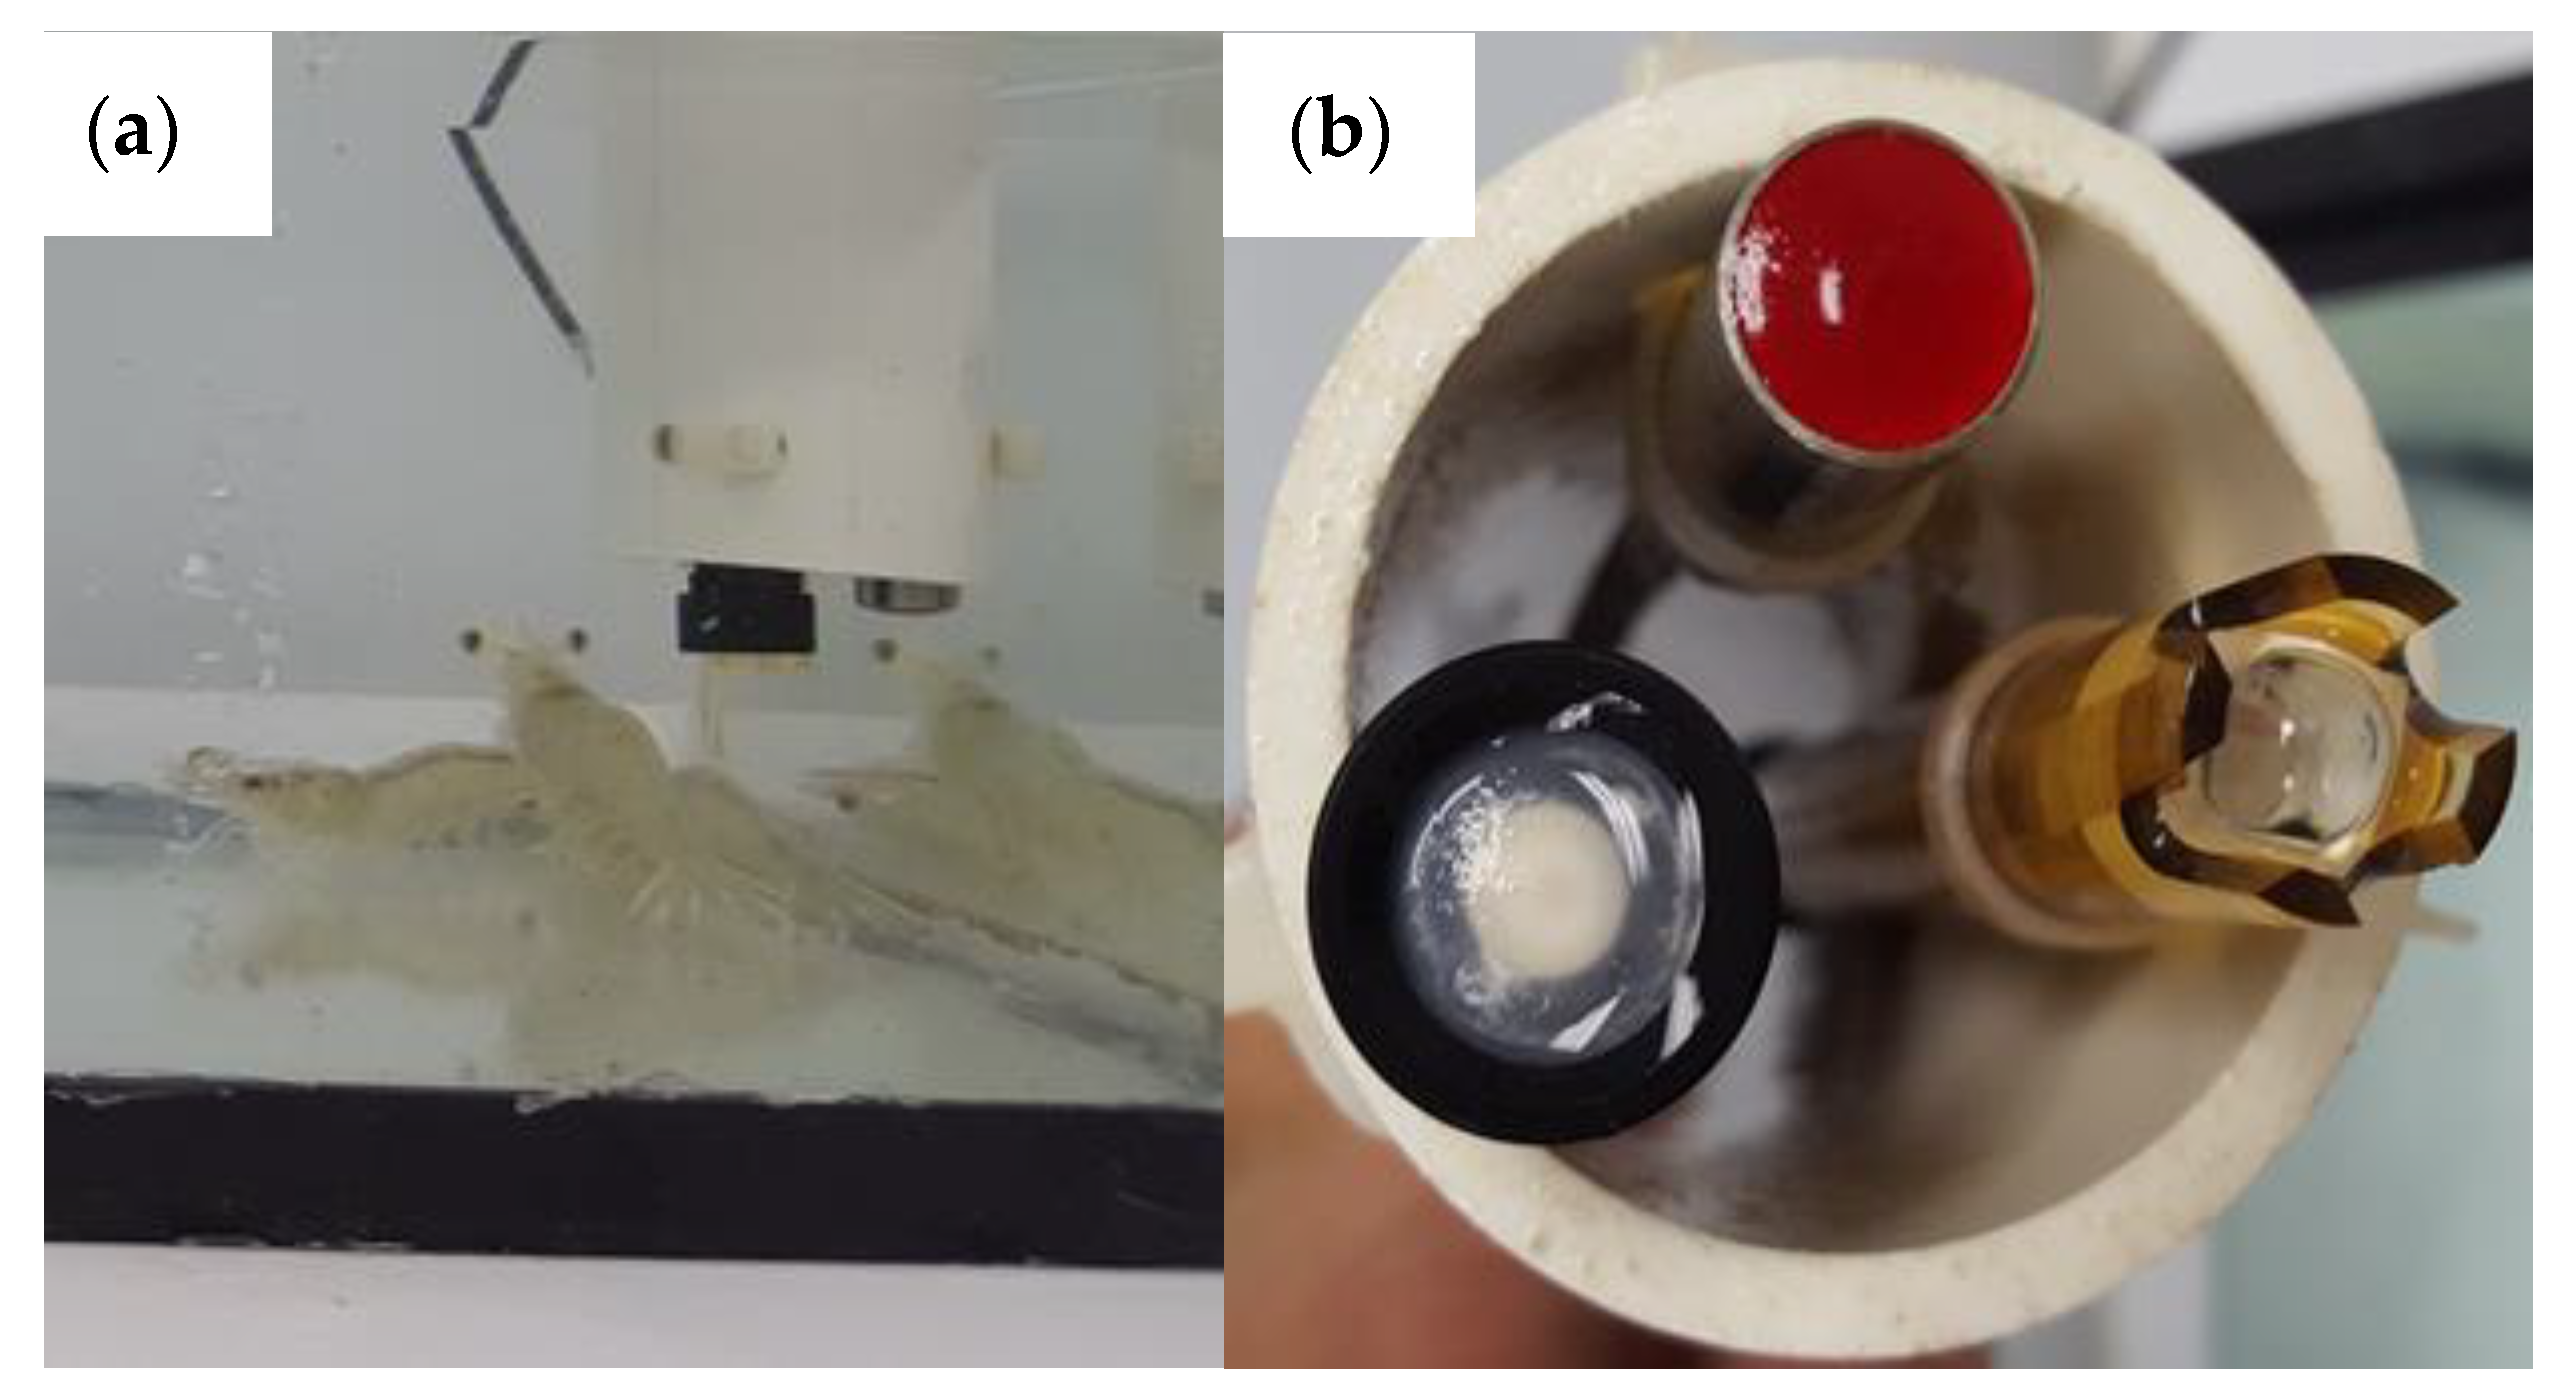
2.2. Sensors
2.2.1. Dissolved Oxygen (DO)
2.2.2. PH
2.2.3. Temperature
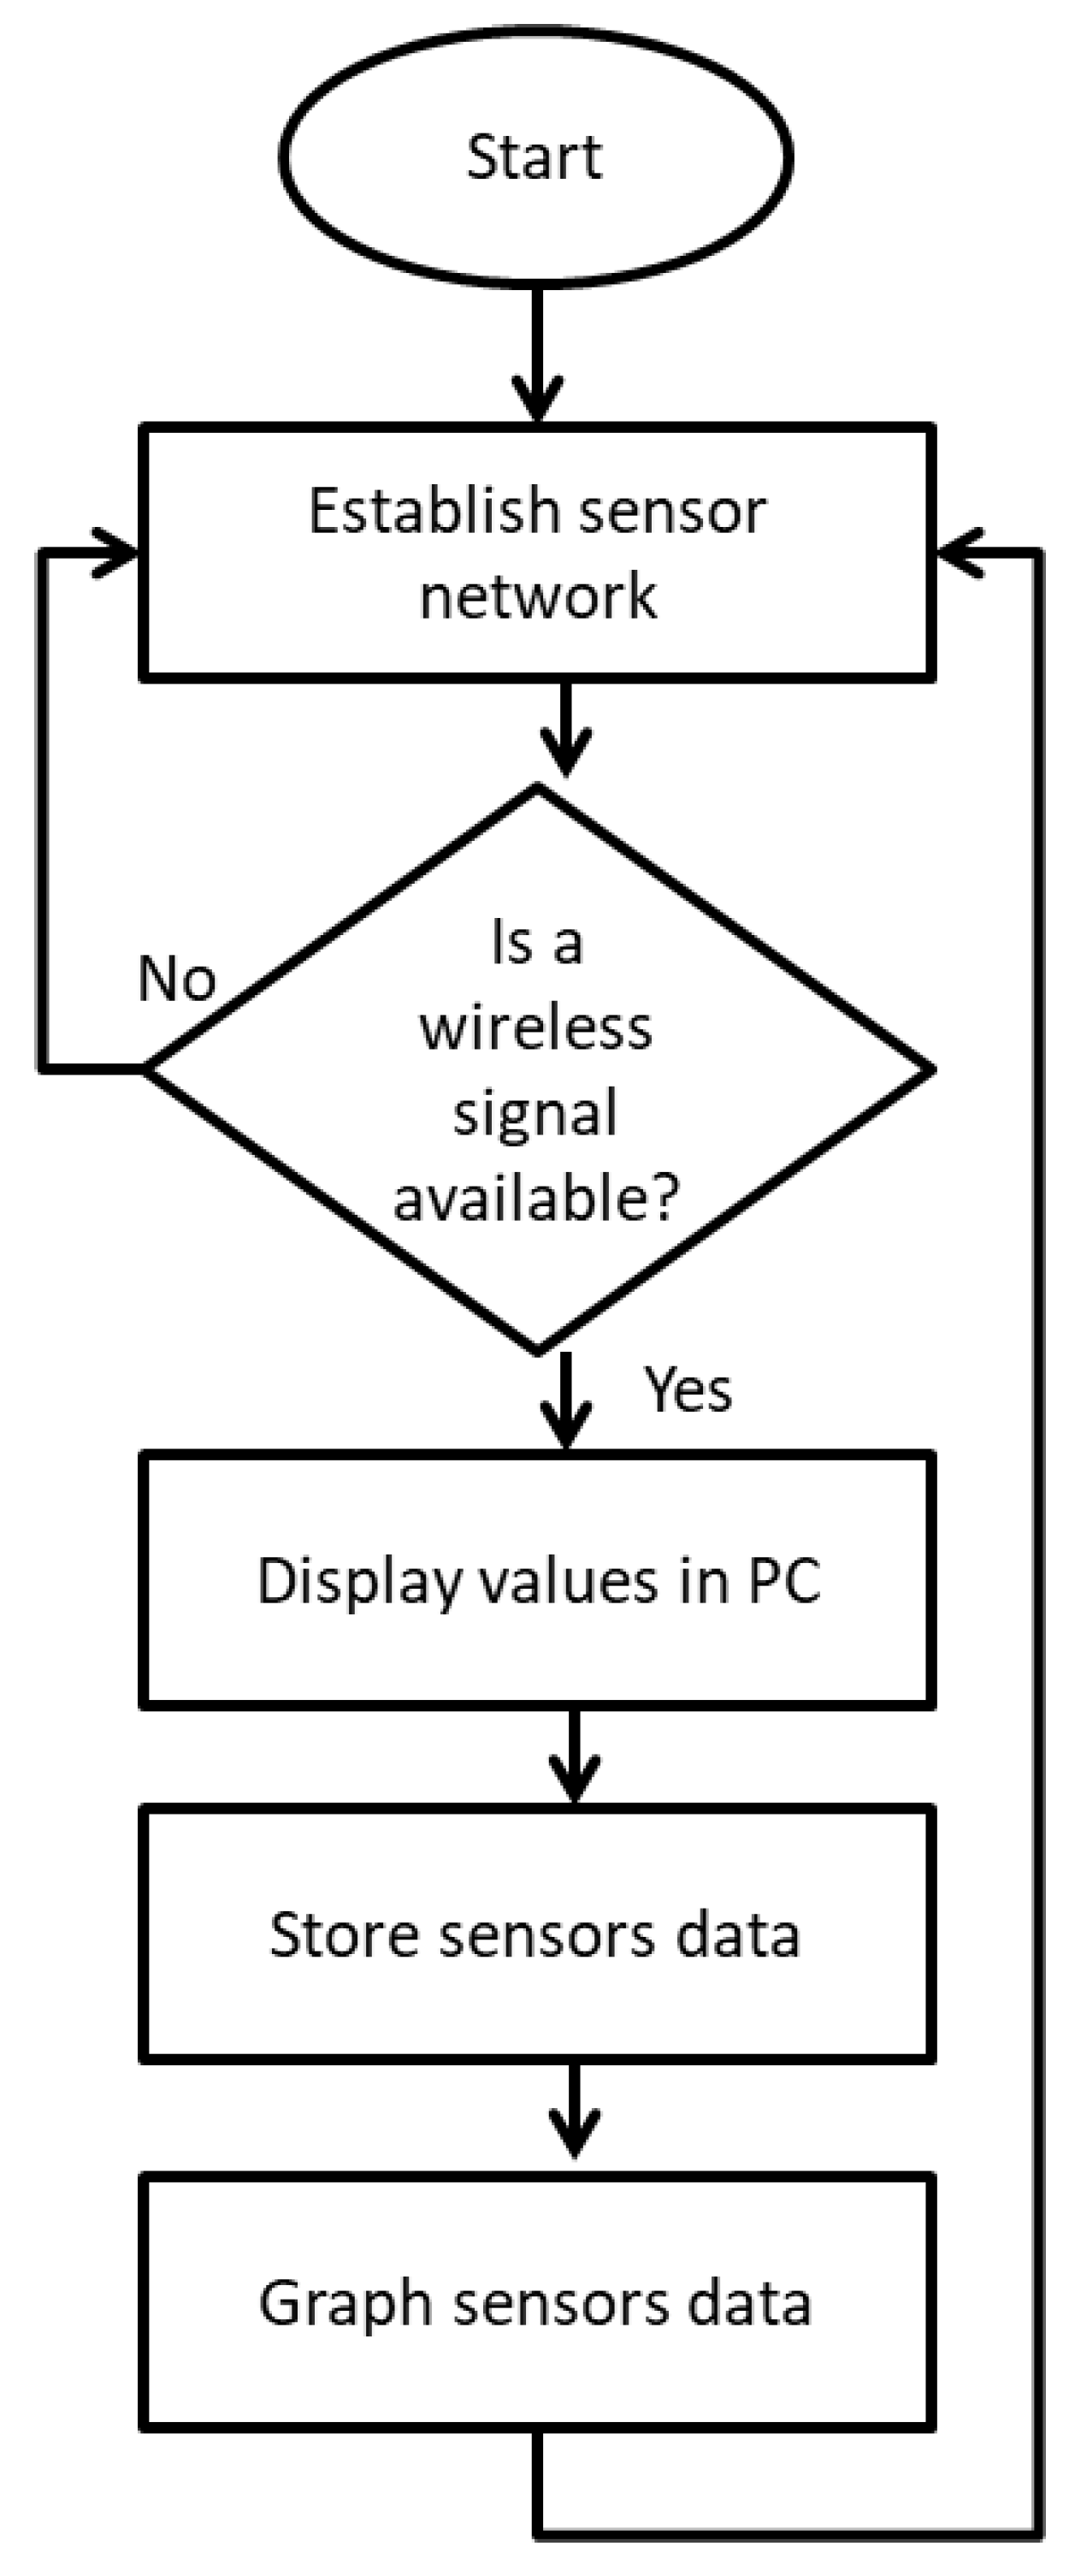
2.3. Software
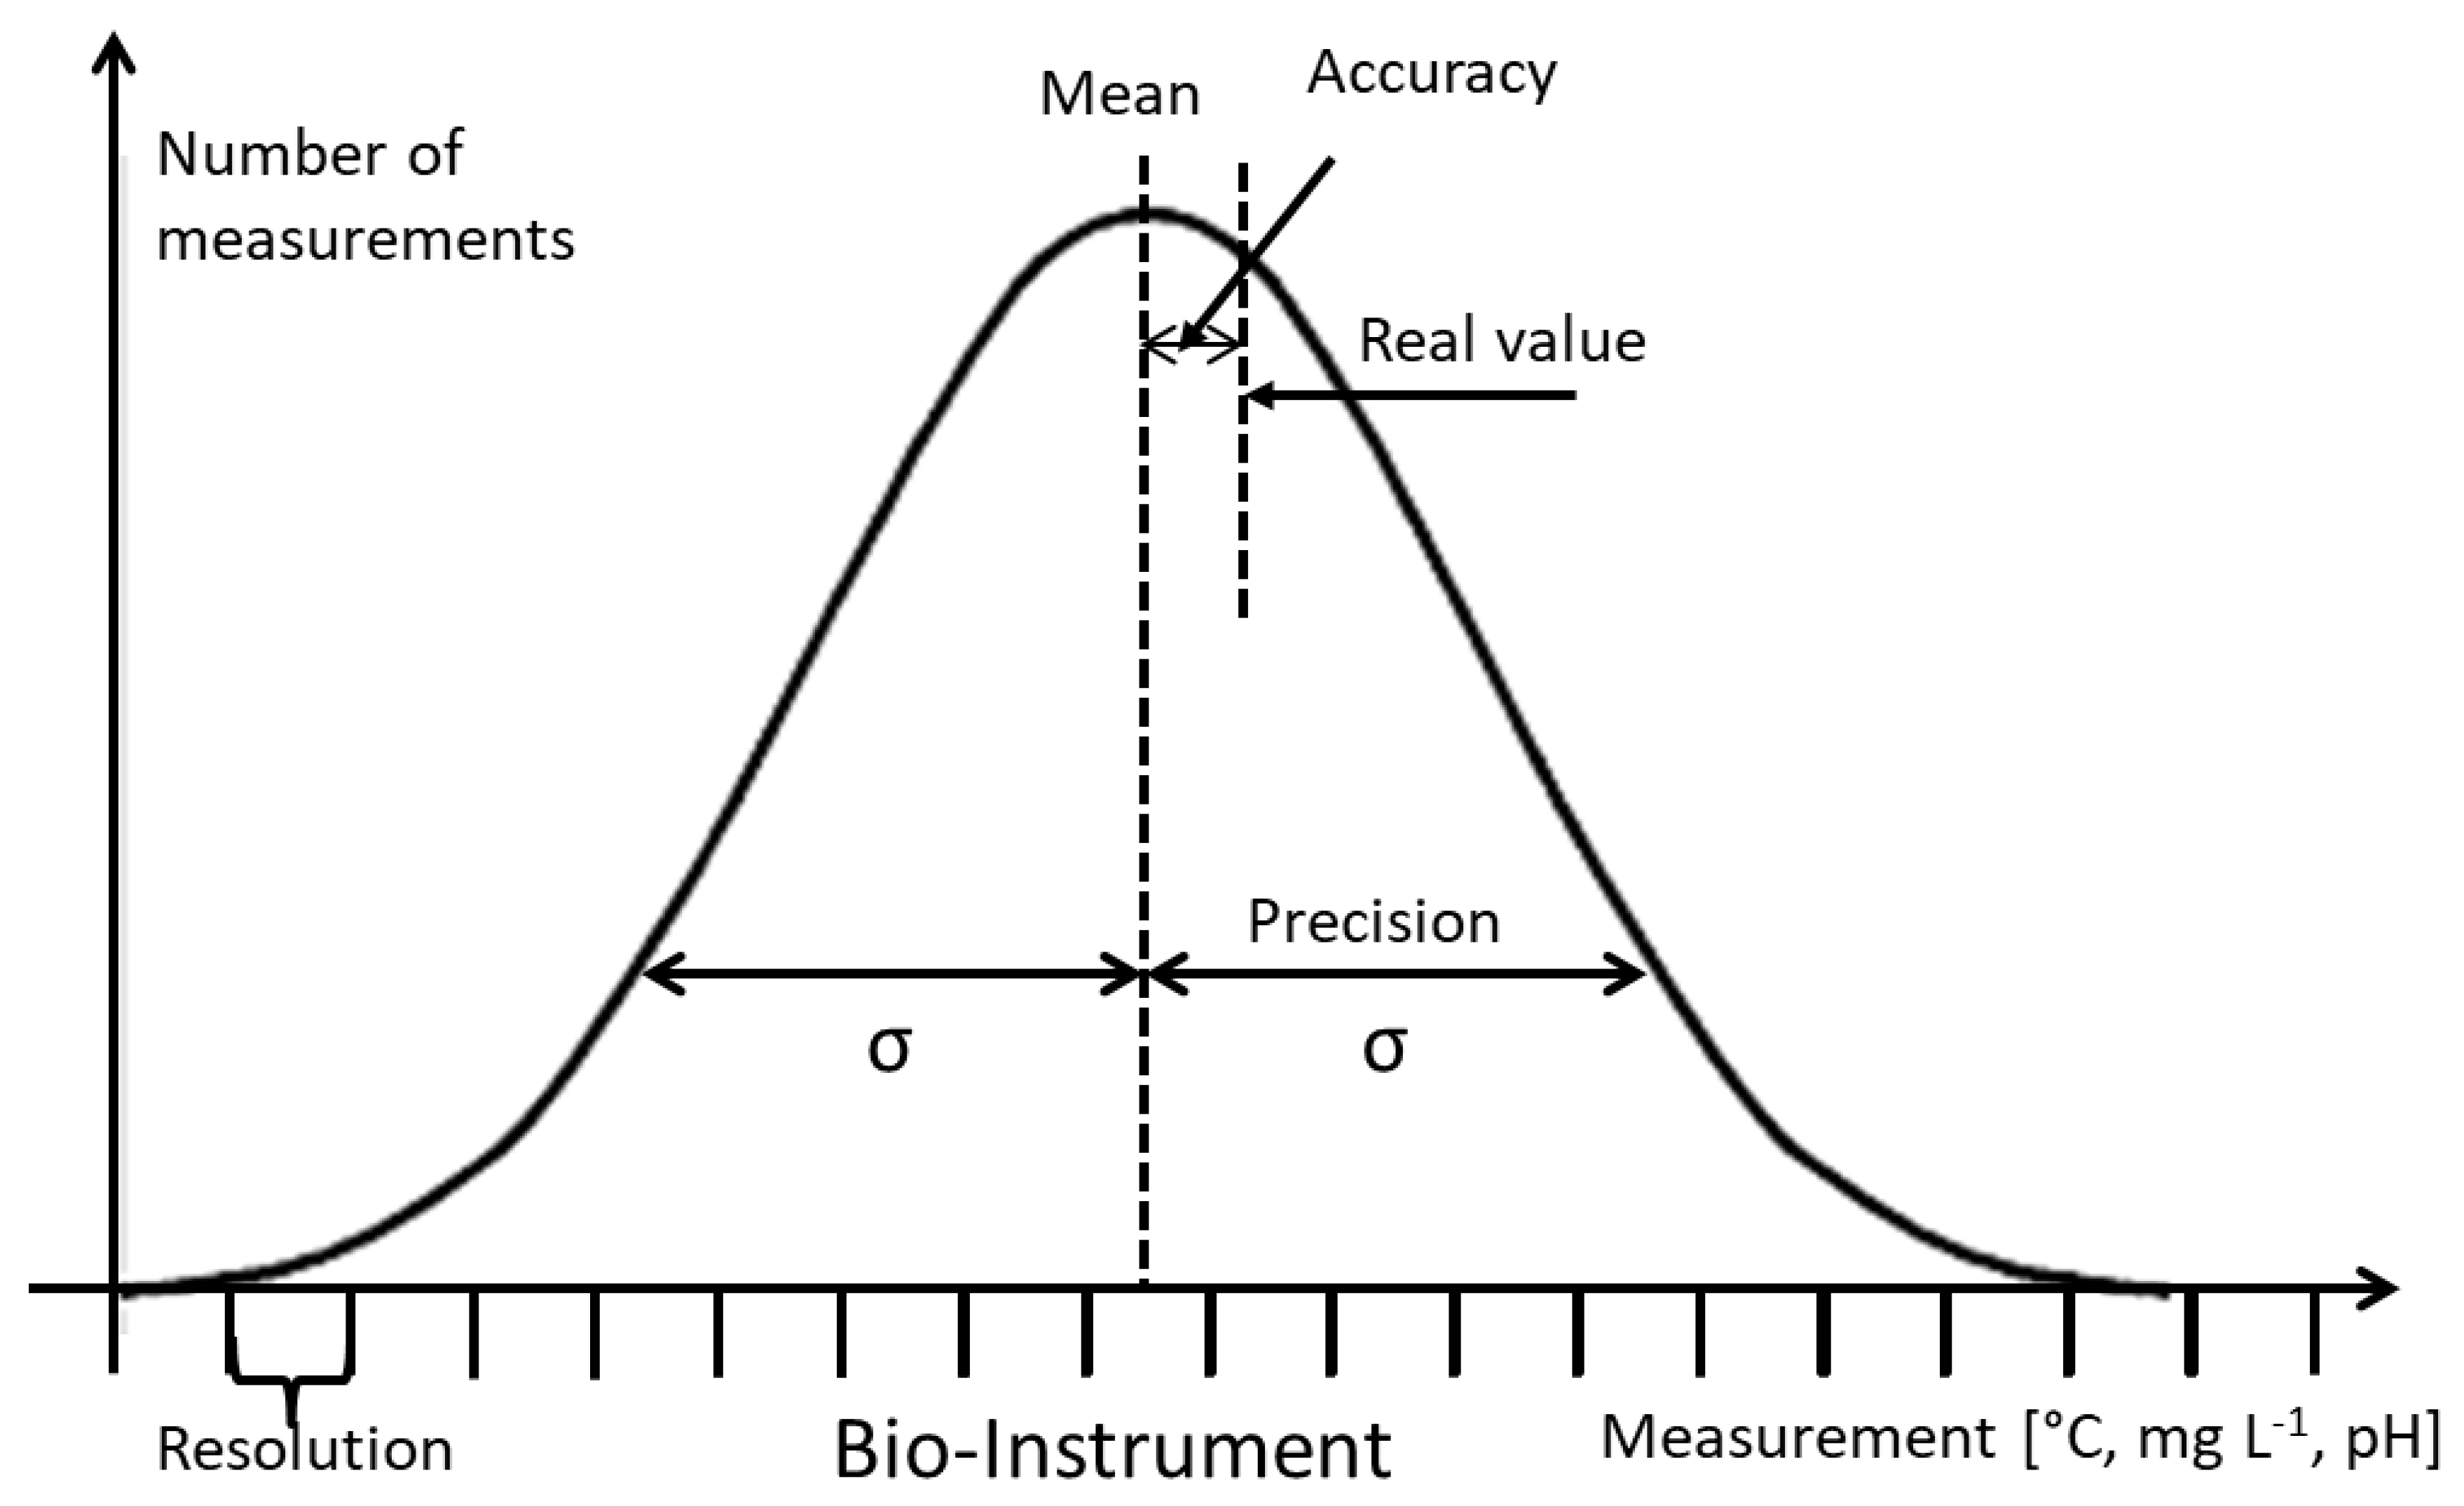
2.4. Performance Assessment
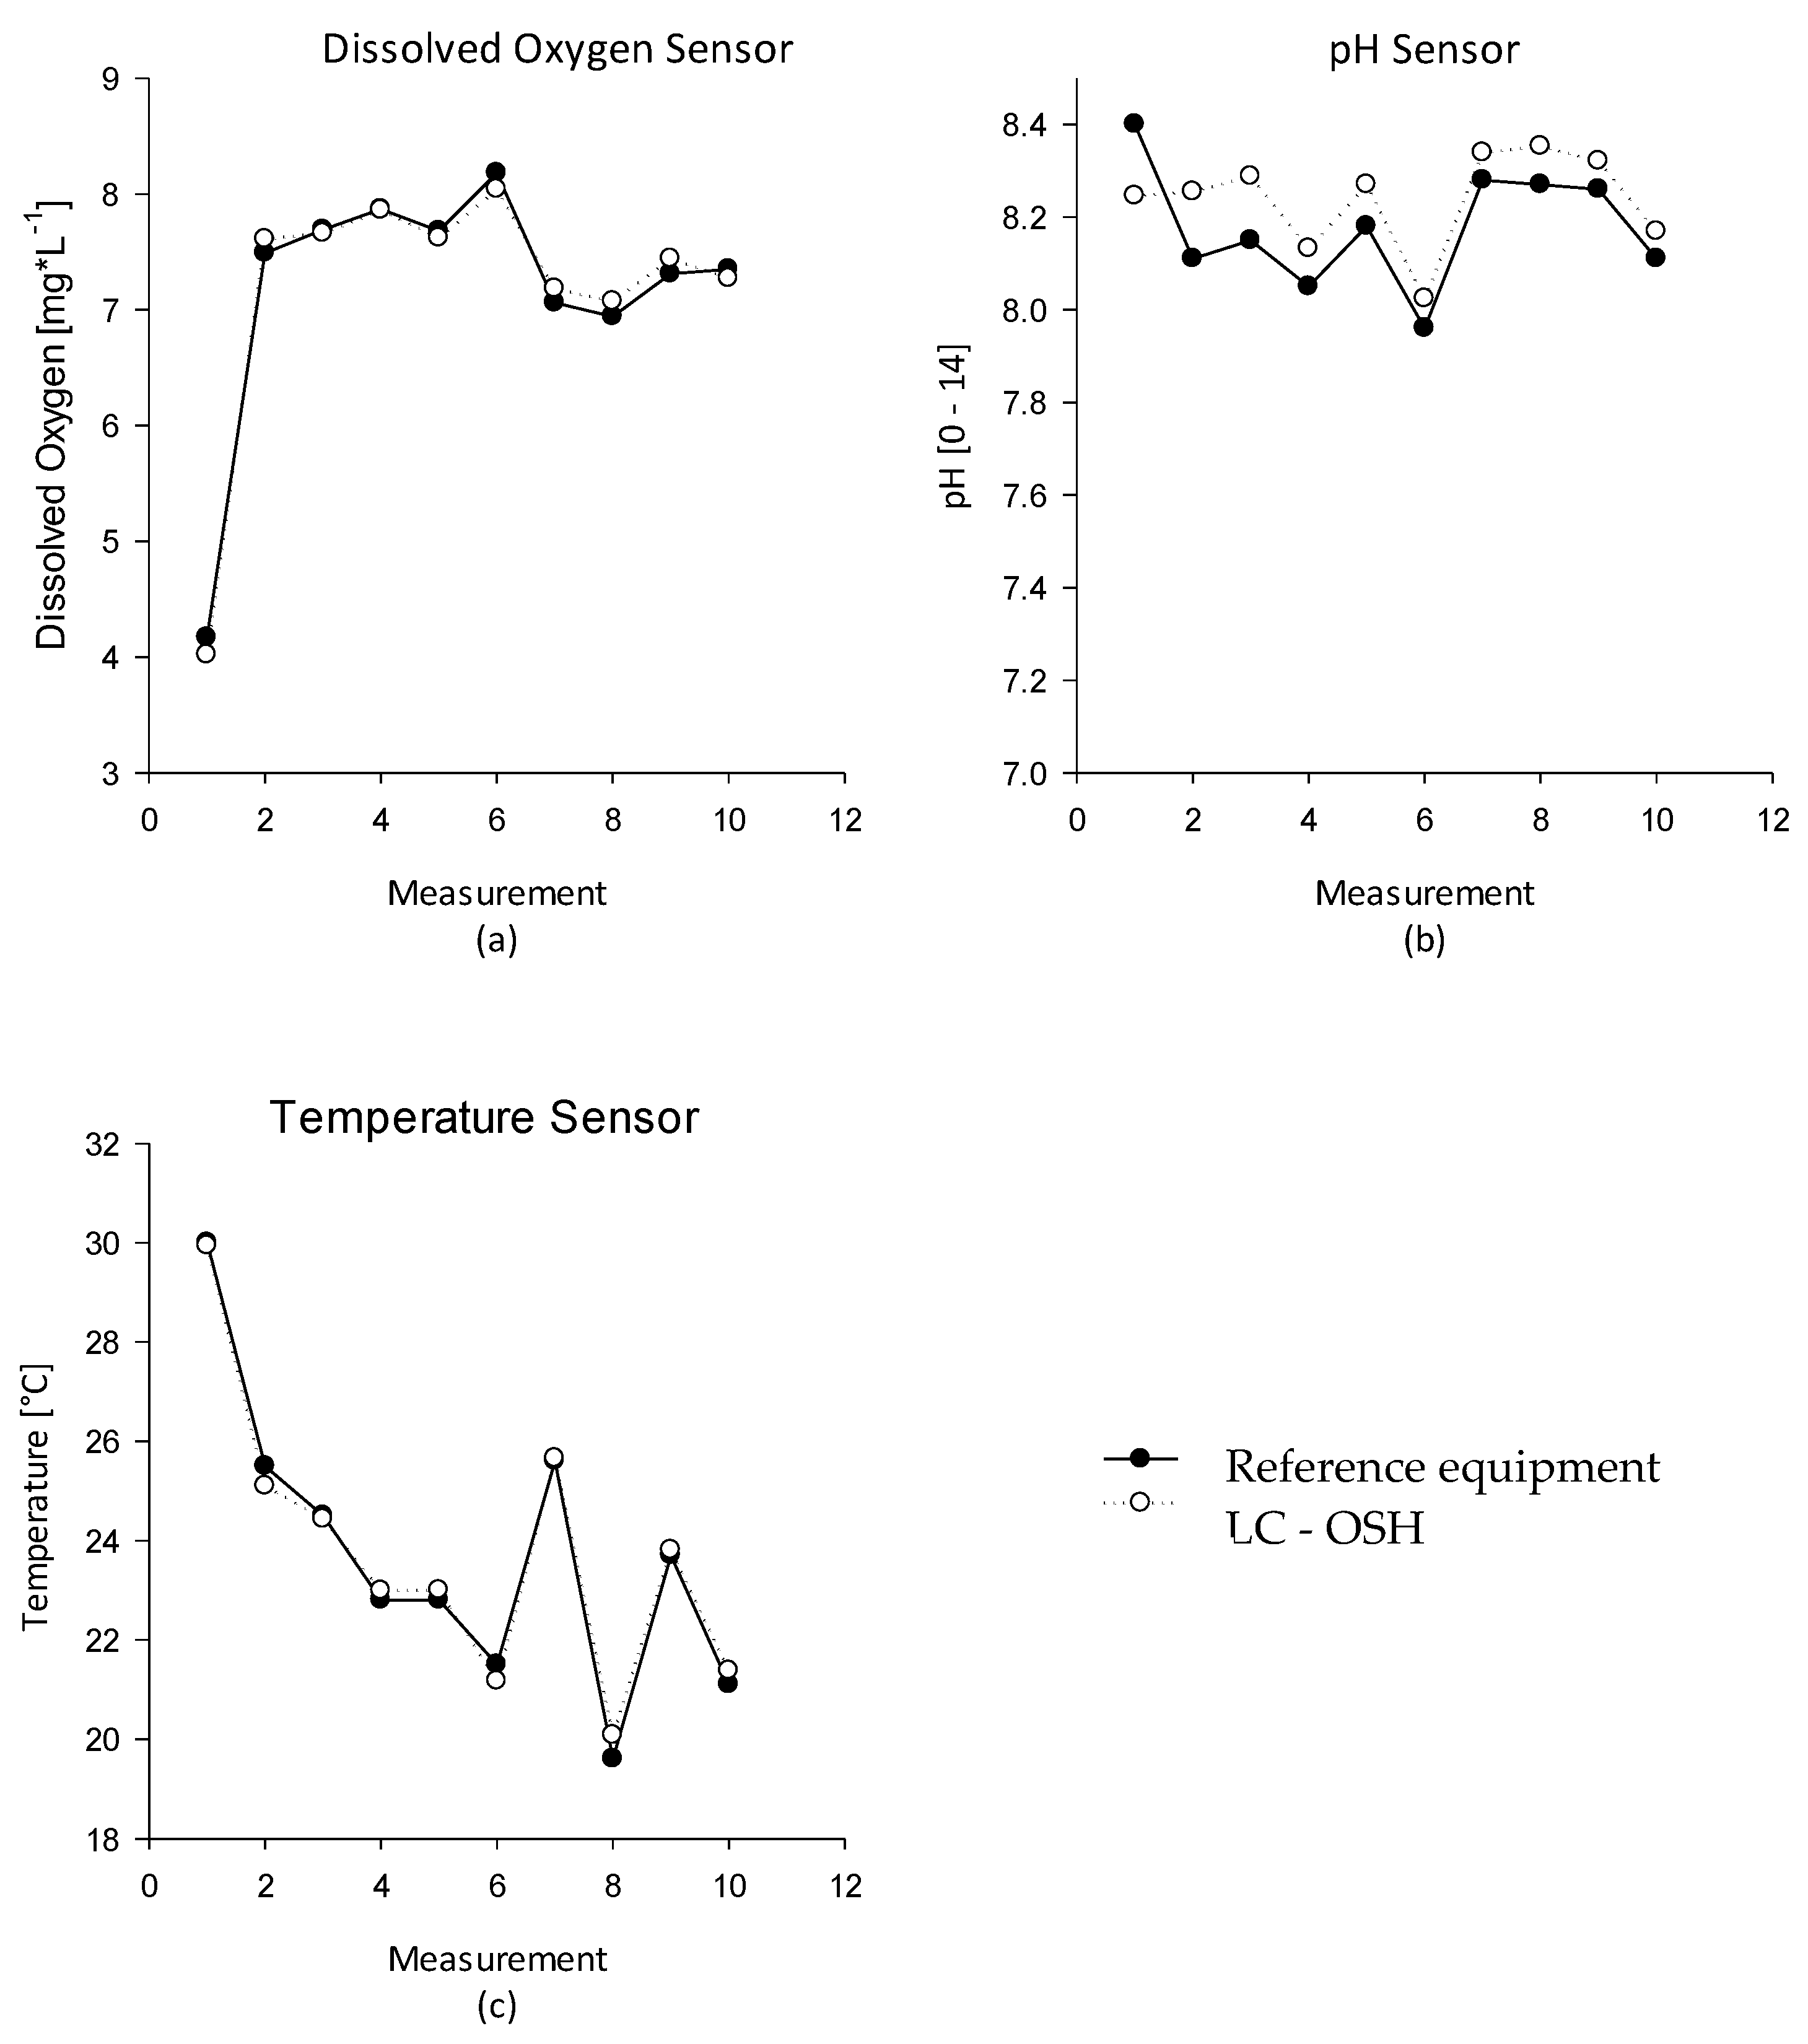
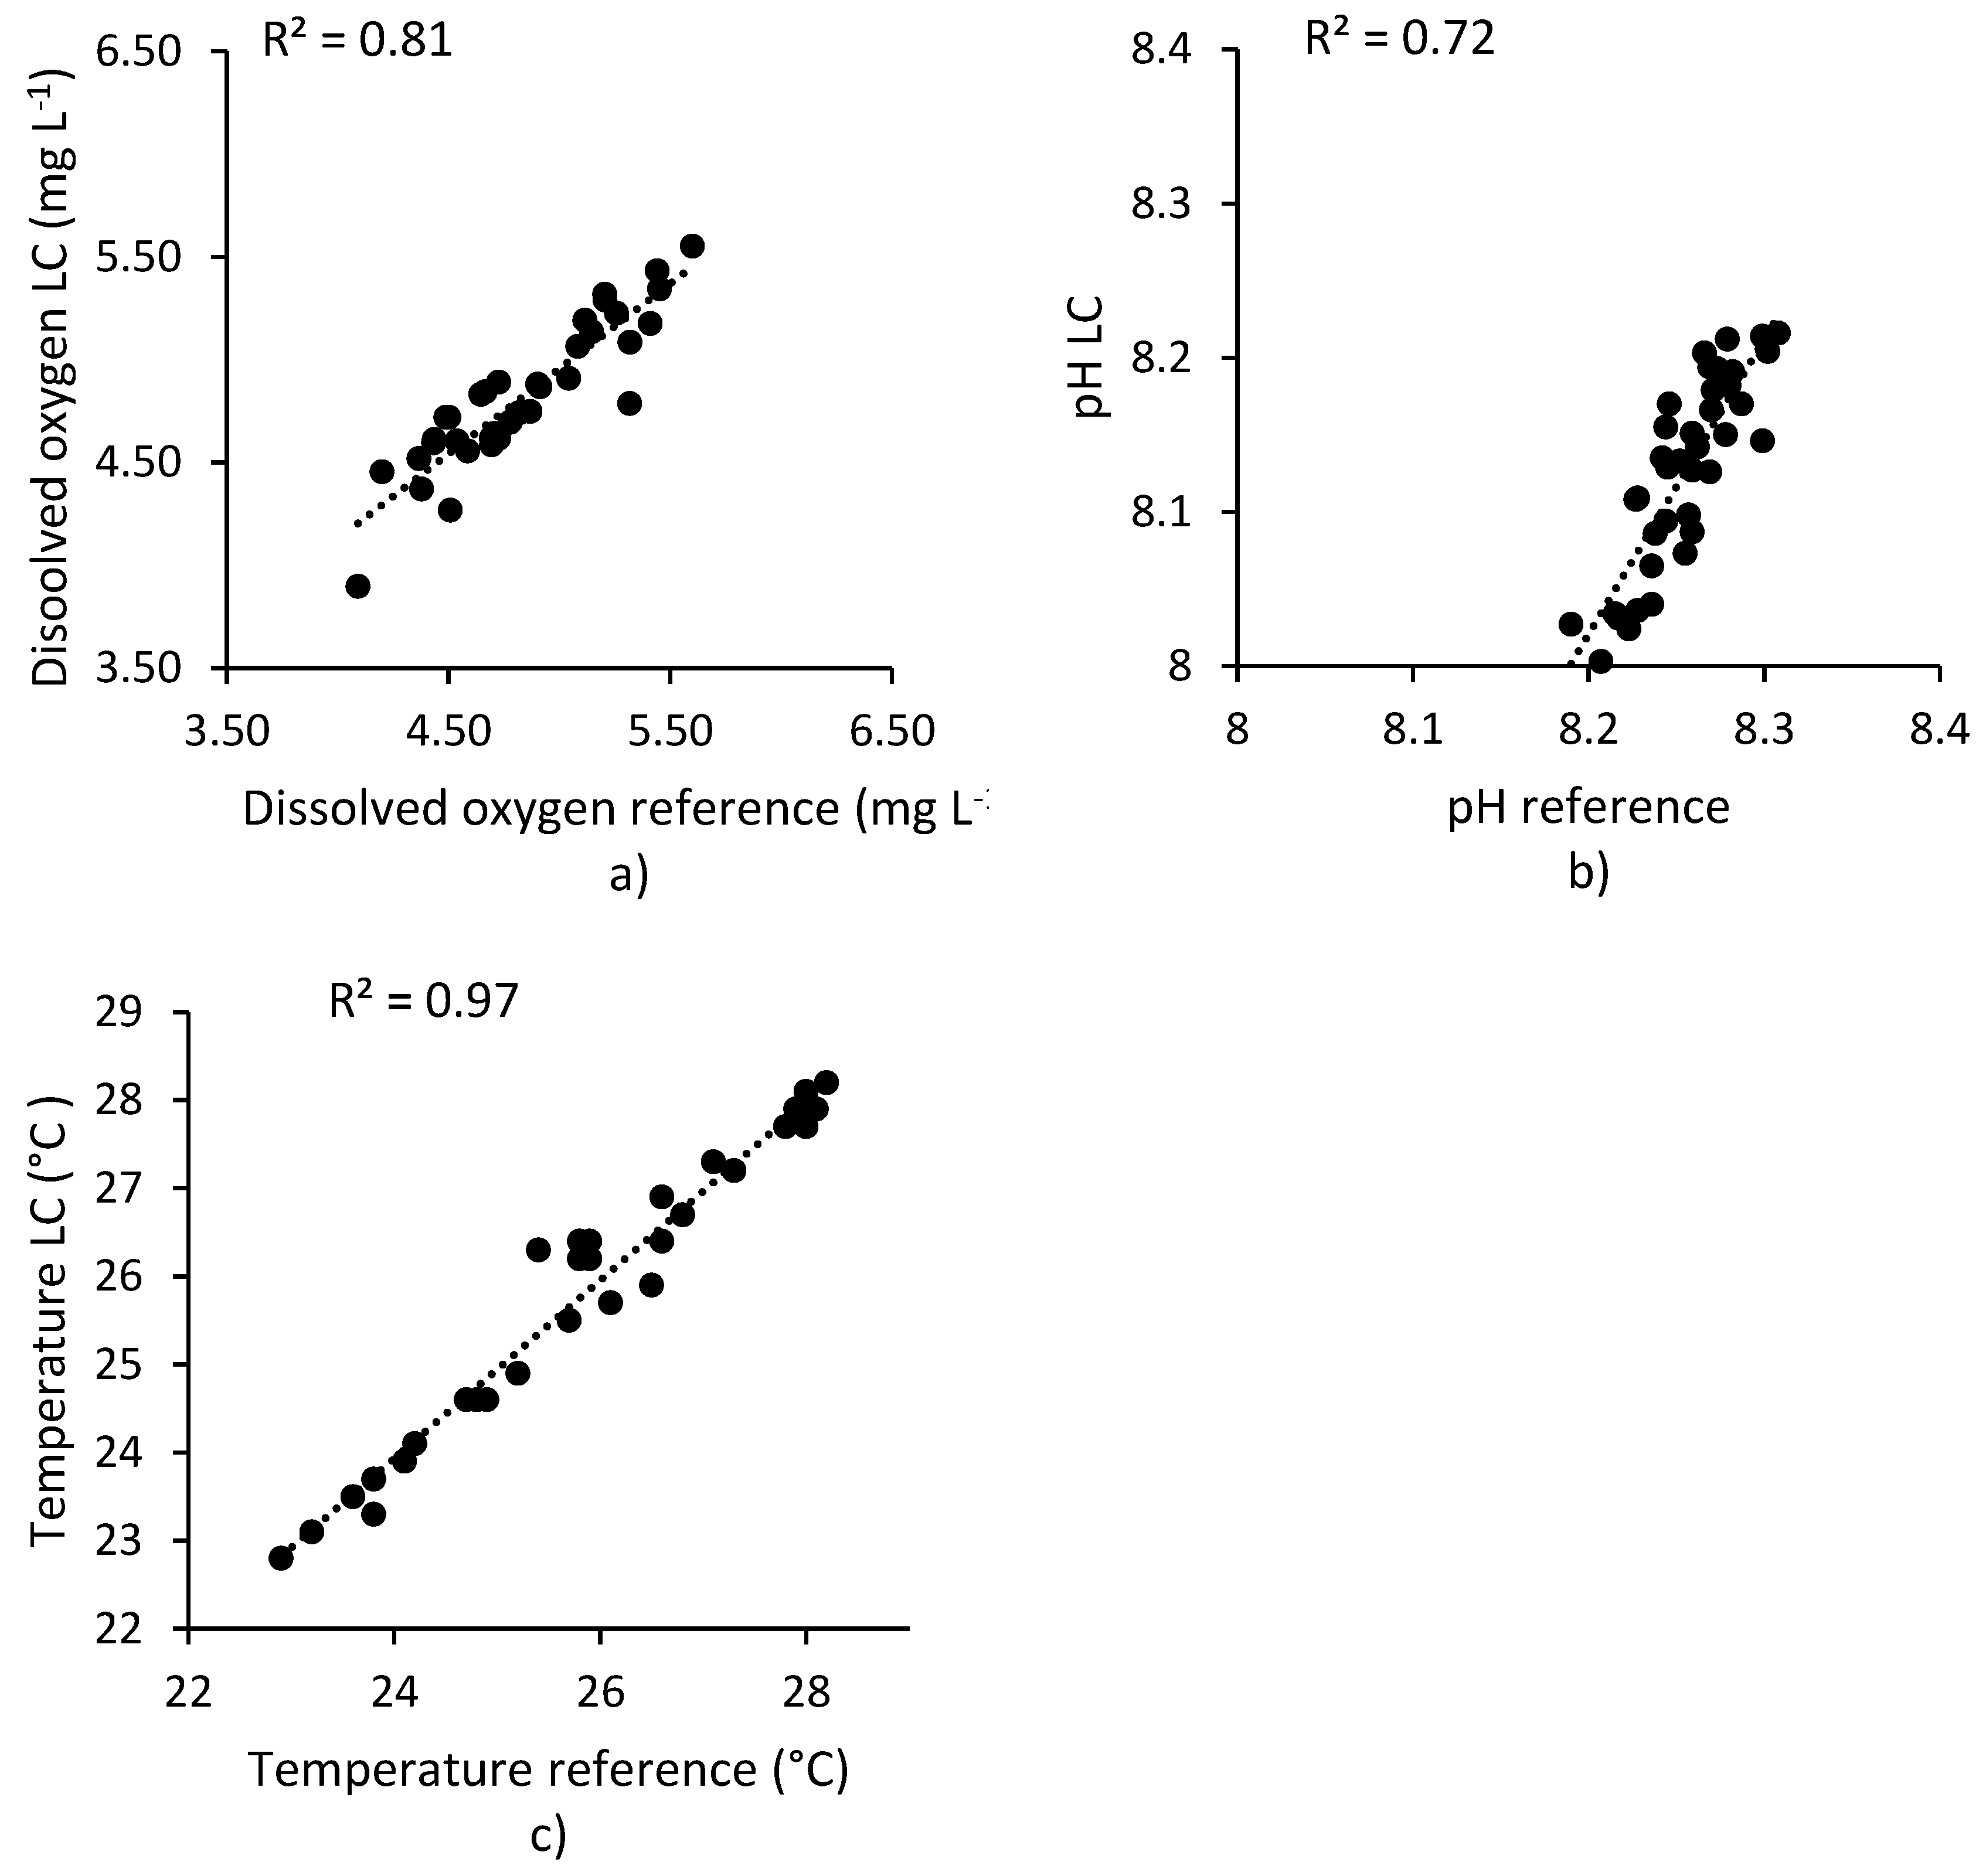
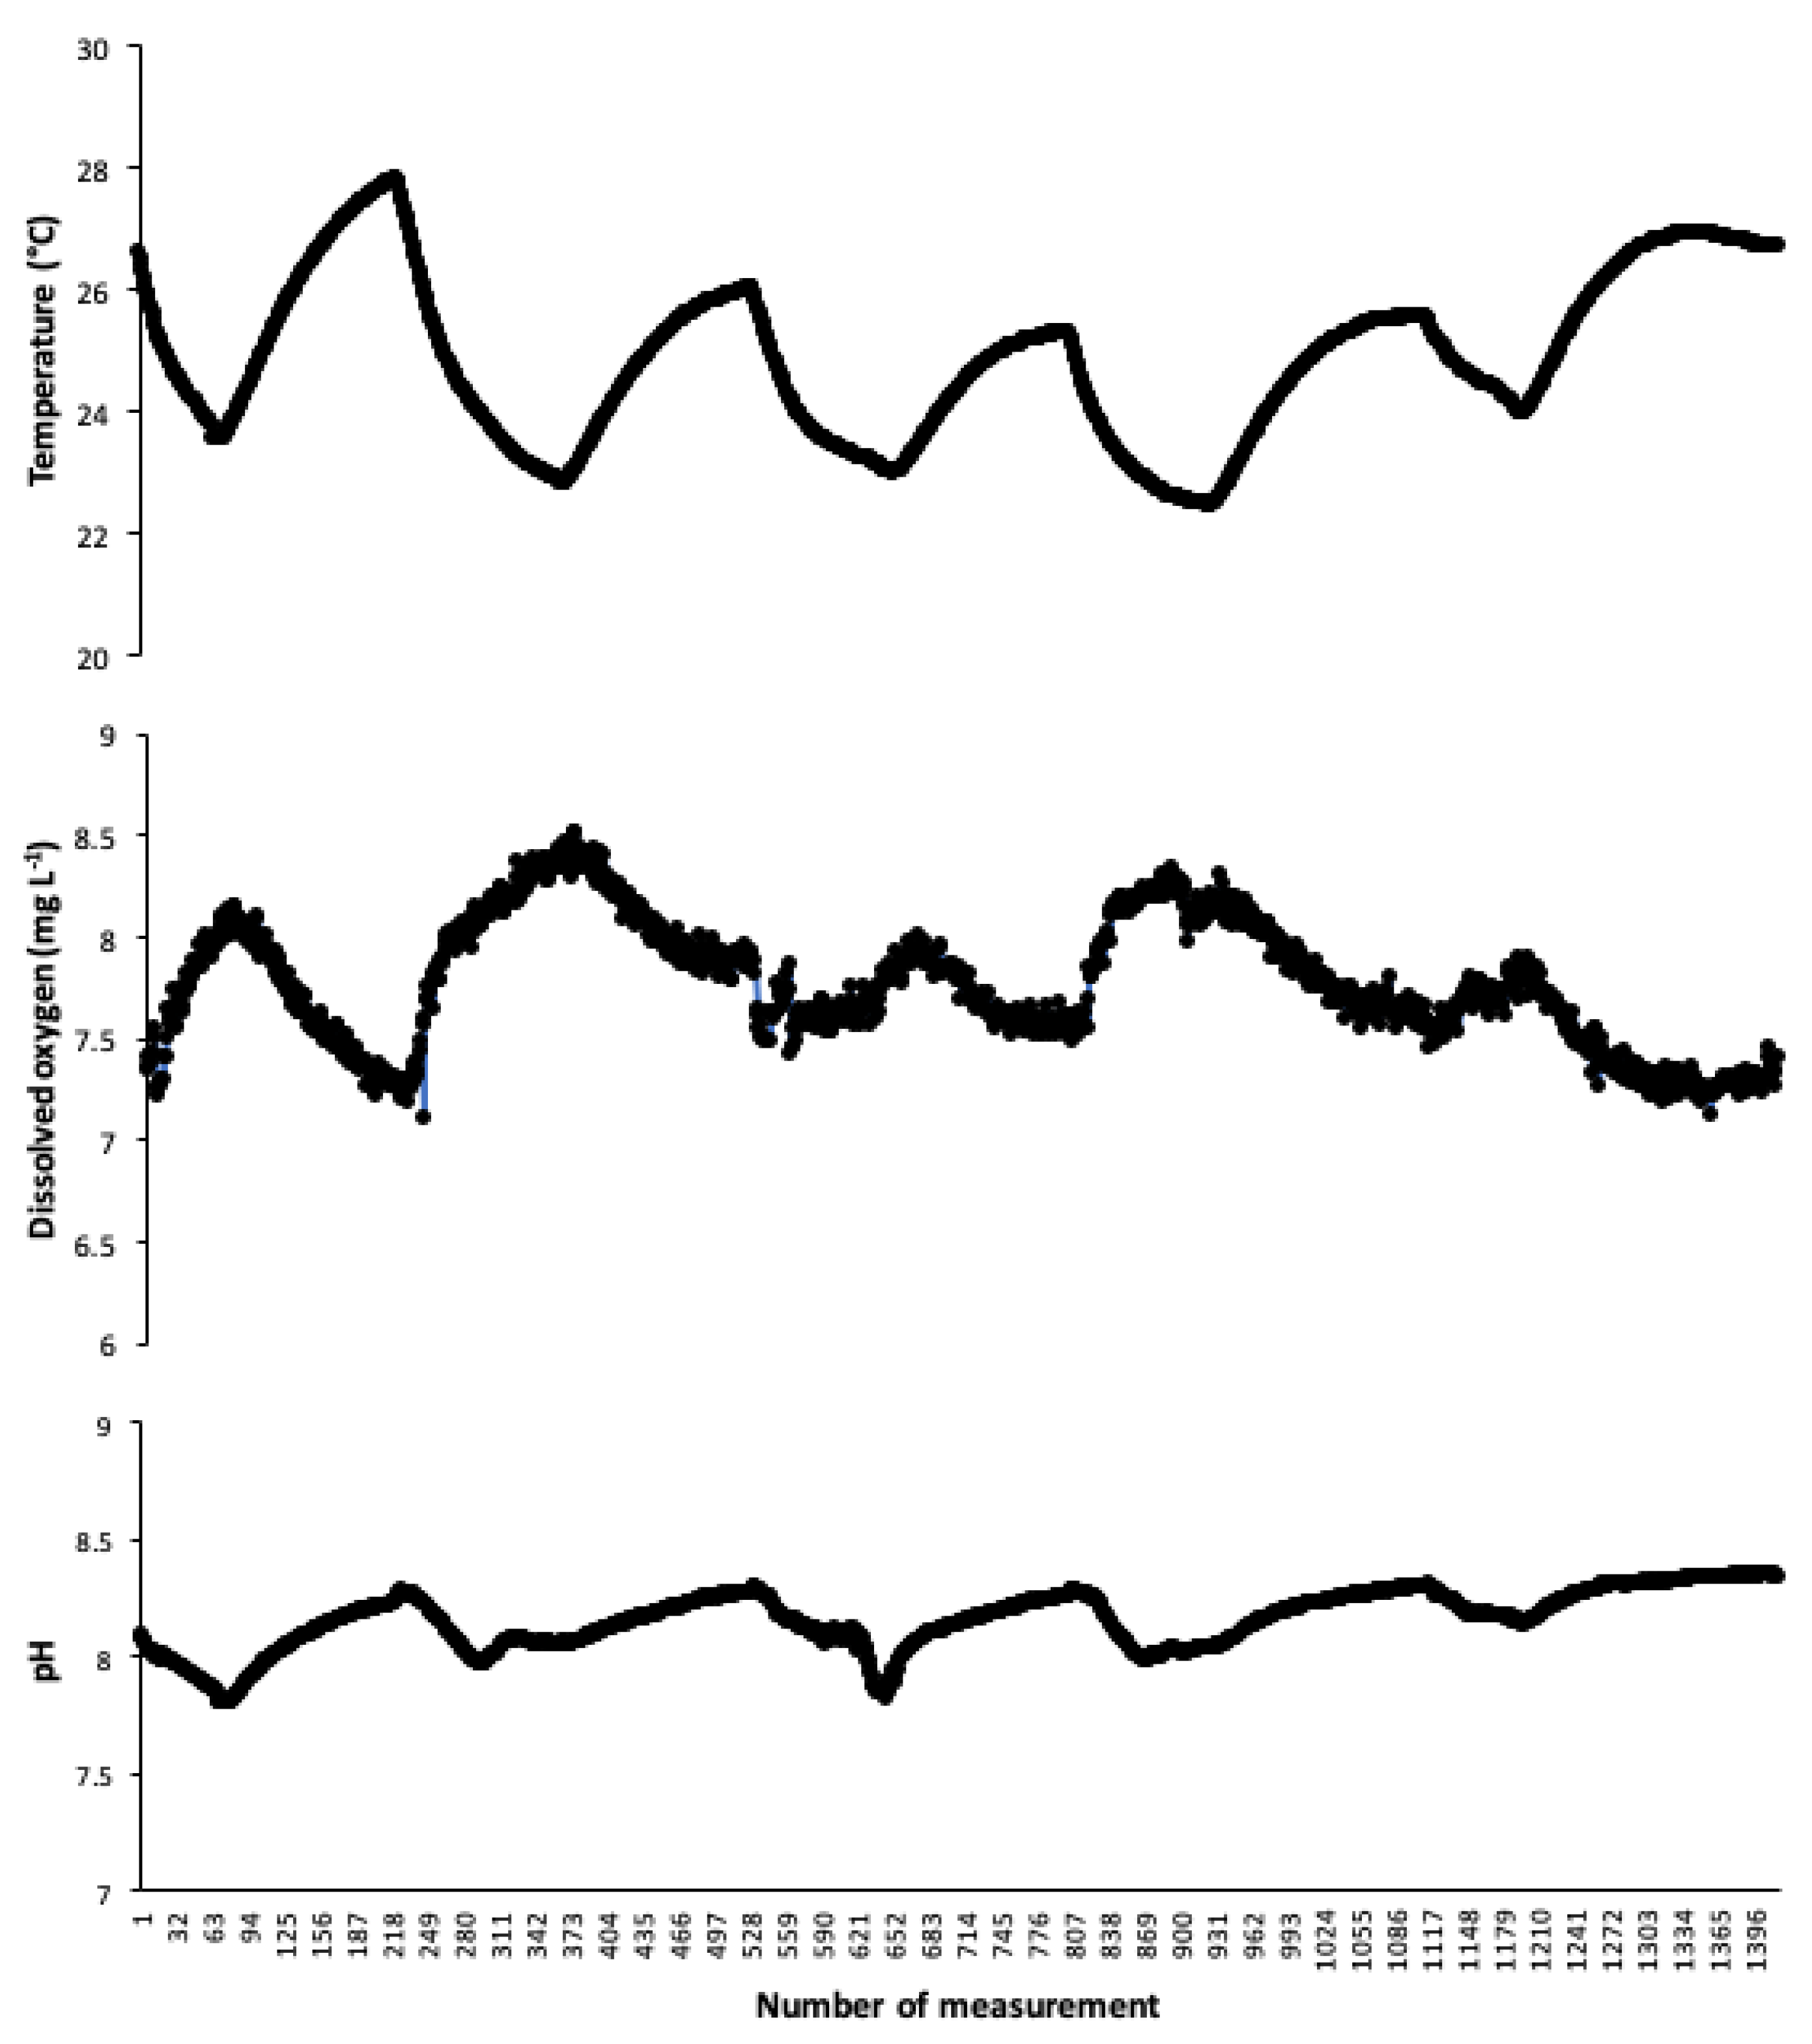
3. Results
4. Discussion
5. Conclusions
Author Contributions
Funding
Acknowledgments
Conflicts of Interest
References
- Martinez-Porchas, M.; Martinez-Cordova, L.R. Article world aquaculture: Environmental impacts and troubleshooting alternatives. Sci. World J. 2012, 4, 389623. [Google Scholar] [CrossRef] [Green Version]
- FAO. The State of World Fisheries and Aquaculture; FAO: Rome, Italy, 2018. [Google Scholar]
- Papandroulakis, N.; Dimitris, P.; Pascal, D. An automated feeding system for intensive hatcheries. Aquac. Eng. 2002, 26, 13–26. [Google Scholar] [CrossRef]
- Carbajal-Hernández, J.J.; Sánchez-Fernández, L.P.; Villa-Vargas, L.A.; Carrasco-Ochoa, J.A.; Martínez-Trinidad, J.F. Water quality assessment in shrimp culture using an analytical hierarchical process. Ecol. Indic. 2013, 29, 148–158. [Google Scholar] [CrossRef]
- Ferreira, N.C.; Bonetti, C.; Seiffert, W.Q. Hydrological and water quality indices as management tools in marine shrimp culture. Aquaculture 2011, 318, 425–433. [Google Scholar] [CrossRef]
- Harun, A.; Ndzi, D.L.; Ramli, M.F.; Shakaff, A.Y.M.; Ahmad, M.N.; Kamarudin, L.M.; Zakaria, A.; Yang, Y. Signal propagation in aquaculture enviroment for wireless sensor networks applications. Prog. Electromagn. Res. 2012, 131, 477–494. [Google Scholar] [CrossRef] [Green Version]
- Casillas-Hernández, R.; Nolasco-Soria, H.; García-Galano, T.; Carrillo-Farnes, O.; Páez-Osuna, F. Water quality, chemical fluxes and production in semi-intensive Pacific white shrimp (Litopenaeus vannamei) culture ponds utilizing two different feeding strategies. Aquac. Eng. 2007, 36, 105–114. [Google Scholar] [CrossRef]
- Martinez-Cordova, L.R.; Porchas-Cornejo, M.A.; Villarreal-Colmenares, H.; Calderon-Perez, J.A. Evaluation of three feeding practices on the winter culture of yellowleg shrimp, Penaeus californiensis (Holmes), in low water exchange ponds. Aquac. Res. 1998, 29, 573–578. [Google Scholar] [CrossRef]
- García Sánchez, S.; Juárez Agis, A.; Olivier Salome, B.; Rivas González, M.; Zeferino Torres, J. Environmental physicochemical variables that affect the shrimp farming Litopenaeus vannamei, Coyuca de Benítez, Guerrero, México. Revista Mexicana de Agroecosistemas 2018, 2, 135–155. [Google Scholar]
- Mesas-Carrascosa, F.J.; Verdú Santano, D.; Meroño, J.E.; Sánchez de la Orden, M.; García-Ferrer, A. Open source hardware to monitor environmental parameters in precision agriculture. Biosyst. Eng. 2015, 137, 73–83. [Google Scholar] [CrossRef]
- Bonarini, A.; Matteucci, M.; Migliavacca, M.; Rizzi, D. R2P: An open source hardware and software modular approach to robot prototyping. Robot. Auton. Syst. 2014, 62, 1073–1084. [Google Scholar] [CrossRef]
- Faugel, H.; Bobkov, V. Open source hard- and software: Using Arduino boards to keep old hardware running. Fusion Eng. Des. 2013, 88, 1276–1279. [Google Scholar] [CrossRef] [Green Version]
- Zhang, M.; Li, D.; Wang, L. Design and development of water quality monitoring system based on wireless sensor network in aquaculture. In Advances in Information and Communication Technology; Springer: Berlin/Heidelberg, Germany, 2011; Volume 347. [Google Scholar]
- Yoshikawa, T.; Murata, O.; Furuya, K.; Eguchi, M. Short-term covariation of dissolved oxygen and phytoplankton photosynthesis in a coastal fish aquaculture site. Estuar. Coast. Shelf Sci. 2007, 74, 515–527. [Google Scholar] [CrossRef]
- Lin, Q.; Jian, Z.; Xu, M.; Zetian, F.; Wei, C.; Xiaoshuan, Z. Developing WSN-based traceability system for recirculation aquaculture. Math. Comput. Model. 2011, 53, 2162–2172. [Google Scholar] [CrossRef] [Green Version]
- Ferdoush, S.; Li, X. Wireless sensor network system design using raspberry pi and arduino for environmental monitoring applications. Procedia Comput. Sci. 2014, 34, 103–110. [Google Scholar] [CrossRef] [Green Version]
- Miller, G.A.; Farahani, H.J.; Hassell, R.L.; Khalilian, A.; Adelberg, J.W.; Wells, C.E. Field evaluation and performance of capacitance probes for automated drip irrigation of watermelons. Agric. Water Manag. 2014, 131, 124–134. [Google Scholar] [CrossRef]
- Ehret, D.L.; Hill, B.D.; Helmer, T.; Edwards, D.R. Neural network modeling of greenhouse tomato yield, growth and water use from automated crop monitoring data. Comput. Electron. Agric. 2011, 79, 82–89. [Google Scholar] [CrossRef]
- Chiu, Y.-C.; Yang, P.-Y.; Grift, T.E. A wireless communication system for automated greenhouse operations. Eng. Agric. Environ. Food 2014, 7, 78–85. [Google Scholar] [CrossRef]
- Espinosa-Calderon, A.; Bórquez-López, R.A.; Rico-García, E.; Martin, O.-L.; Guevara-Gonzales, R. Optical spectroscopy as a first step for noninvasive plant nutrition evaluation. Mex. Opt. Photonics Meet. 2013, 52, 82–89. [Google Scholar]
- Arduino Homepage. Available online: http://www.arduino.cc/ (accessed on 10 July 2020).
- Atlas Scientific Homepage. Available online: https://www.atlas-scientific.com/ (accessed on 10 July 2020).
- Sardarinejad, A.; Maurya, D.K.; Khaled, M.; Alameh, K. Temperature effects on the performance of RuO2 thin-film pH sensor. Sens. Actuators A Phys. 2015, 233, 414–421. [Google Scholar] [CrossRef]
- Mandel, J.; Stiehler, R.D. Sensitivity—A criterion for the comparison of methods of test. J Res Natl. Bur. Stand. 1954, 53, 155–159. [Google Scholar] [CrossRef]
- Simbeye, D.S.; Zhao, J.; Yang, S. Design and deployment of wireless sensor networks for aquaculture monitoring and control based on virtual instruments. Comput. Electron. Agric. 2014, 102, 31–42. [Google Scholar] [CrossRef]
- Schmidt, M.; Penner, D.; Burkl, A.; Stojanovic, R.; Schümann, T.; Beckerle, P. Implementation and evaluation of a low-cost and compact electrodermal activity measurement system. Measurement 2016, 92, 96–102. [Google Scholar] [CrossRef]
- Savic, M.; Gersak, G. Metrological traceability of a system for measuring electrodermal activity. Measurement 2015, 59, 192–197. [Google Scholar] [CrossRef]
- Ferrero Martín, F.J.; Valledor Llopis, M.; Campo Rodríguez, J.C.; Blanco González, J.R.; Menéndez Blanco, J. Low-cost open-source multifunction data acquisition system for accurate measurements. Measurement 2014, 55, 265–271. [Google Scholar] [CrossRef]
- Braibanti, A.; Fisicaro, E.; Compari, C. Solubility of oxygen and inert substances in water. Polyhedron 2000, 19, 2457–2461. [Google Scholar] [CrossRef]
- Tromans, D. Temperatura and pressure dependent solubility of oxygen in water: A thermodynamic analysis. Hydrometallurgy 1998, 48, 327–342. [Google Scholar] [CrossRef]
- Lewis, A.J.; Campbell, M.; Stavroulakis, P. Performance evaluation of a cheap, open source, digital environmental monitor based on the Raspberry Pi. Measurement 2016, 87, 228–235. [Google Scholar] [CrossRef]
- Fatoni, A.; Nur Aziz, A.; Dwi Anggraeni, M. Low-cot and real-time color detector developments for glucose biosensor. Sens. Bio-Sens. Res. 2020, 28, 100325. [Google Scholar] [CrossRef]
- Groene, B.; Knopp, N.; Korgan, K.; Perry, R.; Romero, J.; Smith, K.; Stainback, A.; Strzelczyk, A.; Henriques, J. Preliminary design of a low-cost greenhouse with open source control systems. Procedia Eng. 2015, 107, 470–479. [Google Scholar] [CrossRef] [Green Version]
- Martínez-Córdova, L.R.; Porchas-Cornejo, M.A.; Villareal - Colemnares, H.; Calderon-Perez, J.A.; Naranjo-Paramo, J. Evaluation of three feeding strategies on the culture of white shrimp penaeus vannamei boone 1931 in low water exchange ponds. Aquac. Eng. 1998, 17, pp. 21–28. Available online: https://0-doi-org.brum.beds.ac.uk/10.1016/S0144-8609(97)00010-1 (accessed on 27 October 2020).
- Bórquez-Lopez, R.A.; Casillas-Hernández, R.; Lopez-Elías, J.A.; Barraza-Guardado, R.H.; Martinez-Cordova, L.R. Improving feeding strategies for shrimp farming using fuzzy logic, based on water quality parameters. Aquac. Eng. 2018, 81, 38–45. [Google Scholar] [CrossRef]
- Zhao, S.; Ding, W.; Zhao, S.; Gu, J. Adaptive neural fuzzy inference system for feeding decision-making of grass carp (Ctenopharyngodon idellus) in outdoor intensive culturing ponds. Aquaculture 2008, 498, 28–36. [Google Scholar] [CrossRef]
- Soto-Zarazúa, G.M.; Rico-García, E.; Ocampo, R.; Guevara-González, R.G.; Herrera-Ruiz, G. Fuzzy-logic-based feeder system for intensive tilapia production (Oreochromis niloticus). Aquac. Int. 2010, 18, 379–391. [Google Scholar] [CrossRef]
- IEG Review Team.2016. Mexico-MX (CRL2) Integrated Energy Services (English). Washington, D.C.: World Bank Group. Available online: http://documents.worldbank.org/curated/en/277391483127810759/Mexico-MX-CRL2-Integrated-Energy-Services (accessed on 27 October 2020).
- Martínez-Domínguez, M.; Mora-Rivera, J. Internet adoption and usage patterns in rural Mexico. Technol. Soc. 2020, 60, 101226. [Google Scholar] [CrossRef]
- Colmenarejo, M.F.; Vicente, J.; Rubio, A.; Garcia, G. Use of the water quality index and dissolved oxygen deficit as simple indicators of watersheds pollution. Ecol. Indic. 2007, 7315–7328. [Google Scholar] [CrossRef]
- Lermontov, M.; Augusta, M.; Machado, S. River quality analysis using fuzzy water quality index: Ribeira do Iguape river watershed, Brazil. Ecol. Indic. 2009, 9, 1188–1197. [Google Scholar] [CrossRef]
- Simo, S.; Nobre, S.M.; Josefa, M.; Yabe, S. Water quality index as a simple indicator of aquaculture effects on aquatic bodies. Ecol. Indic. 2008, 8, 476–484. [Google Scholar] [CrossRef]
- Barraza-Guardado, R.H.; Arreola-Lizárraga, J.A.; Miranda-Baeza, A.; Juárez-García, M.; Juvera-Hoyos, A.; Casillas-Hernández, R. Enhancing ecoefficiency in shrimp farming through interconnected ponds. J. Biomed. Biotechnol. 2015, 1, 1–11. [Google Scholar] [CrossRef] [Green Version]
- Roy, L.A.; Davis, D.A.; Saoud, I.P.; Boyd, C.A.; Pine, H.J.; Boyd, C.E. Shrimp culture in inland low salinity waters. Rev. Aquac. 2010, 2, 191–208. [Google Scholar] [CrossRef]
- Roy, L.A.; Davis, D.A.; Saoud, I.P.; Henry, R.P. Effects of varying levels of aqueous potassium and magnesium on survival, growth, and respiration of the Pacific white shrimp, Litopenaeus vannamei, reared in low salinity waters. Aquaculture 2007, 262, 461–469. [Google Scholar] [CrossRef]


| Temperature [°C] | Dissolved Oxygen [mg L−1] | pH | ||||
|---|---|---|---|---|---|---|
| Reference | LC | Reference | LC | Reference | LC | |
| Mean | 24.02 | 24.05 | 7.14 | 7.13 | 8.18 | 8.24 |
| Std. Dev. | 2.92 | 2.81 | 1.12 | 1.15 | 0.14 | 0.11 |
| C.V. | 12.31% | 11.83% | 15.59% | 16.01% | 1.71% | 1.33% |
| Min. | 19.60 | 20.08 | 4.17 | 4.02 | 7.96 | 8.02 |
| Max. | 30.00 | 29.94 | 8.81 | 8.04 | 8.40 | 8.35 |
| Temperature [°C] | Dissolved Oxygen [mg L−1] | pH | |||||||
|---|---|---|---|---|---|---|---|---|---|
| LC 1 | LC 2 | LC 3 | LC 1 | LC 2 | LC 3 | LC 1 | LC 2 | LC 3 | |
| Mean | 23.66 a | 23.72 a | 23.86 a | 6.44 a | 6.95 a | 6.85 a | 8.05 a | 8.37 a | 7.94 a |
| Std. Dev. | 0.248 | 0.271 | 0.251 | 0.104 | 0.080 | 0.066 | 0.119 | 0.056 | 0.055 |
| C.V. | 1.04% | 1.14% | 1.05% | 1.61% | 1.15% | 0.96% | 1.47% | 0.66% | 0.69% |
| Min. | 23.35 | 23.26 | 23.56 | 6.20 | 6.77 | 6.73 | 7.873 | 8.345 | 7.891 |
| Max. | 24.11 | 24.15 | 24.36 | 6.62 | 7.11 | 6.98 | 8.199 | 8.415 | 8.059 |
| Label | Type | Quantity | Approximate Price (€) |
|---|---|---|---|
| Power unit | 9 V | 1 | 4 |
| Transceiver modules | XBEE XBP24-BZ7UIT-004 | 2 | 72 |
| Microcontroller | Iteaduino MEGA2650 | 1 | 13 |
| Debugger | USB FOCA FT232RL | 1 | 7 |
| Serial port expander | 74HC4052 Multiplexor | 1 | 10 |
| Embedded dissolved oxygen circuit | Atlas Scientific | 1 | 39 |
| Dissolved oxygen probe | Membrane-type PTFE | 1 | 200 |
| Embedded pH circuit | Atlas Scientific | 1 | 35 |
| pH probe | Silver/silver chloride | 1 | 70 |
| Total | 450 |
| Temperature | Dissolved Oxygen | pH | |
|---|---|---|---|
| Precision [σ, C.V.] | ±0.106 °C, 0.42% | ±0.177 mg L−1, 4.28% | ±0.242, 2.6% |
| Accuracy | 0.18 °C | 0.016 | 0.006 |
| Sensibility | 0.038 °C | 0.017 mg L−1 | 0.018 |
Publisher’s Note: MDPI stays neutral with regard to jurisdictional claims in published maps and institutional affiliations. |
© 2020 by the authors. Licensee MDPI, Basel, Switzerland. This article is an open access article distributed under the terms and conditions of the Creative Commons Attribution (CC BY) license (http://creativecommons.org/licenses/by/4.0/).
Share and Cite
Bórquez López, R.A.; Martinez Cordova, L.R.; Gil Nuñez, J.C.; Gonzalez Galaviz, J.R.; Ibarra Gamez, J.C.; Casillas Hernandez, R. Implementation and Evaluation of Open-Source Hardware to Monitor Water Quality in Precision Aquaculture. Sensors 2020, 20, 6112. https://0-doi-org.brum.beds.ac.uk/10.3390/s20216112
Bórquez López RA, Martinez Cordova LR, Gil Nuñez JC, Gonzalez Galaviz JR, Ibarra Gamez JC, Casillas Hernandez R. Implementation and Evaluation of Open-Source Hardware to Monitor Water Quality in Precision Aquaculture. Sensors. 2020; 20(21):6112. https://0-doi-org.brum.beds.ac.uk/10.3390/s20216112
Chicago/Turabian StyleBórquez López, Rafael Apolinar, Luis Rafael Martinez Cordova, Juan Carlos Gil Nuñez, Jose Reyes Gonzalez Galaviz, Jose Cuauhtemoc Ibarra Gamez, and Ramon Casillas Hernandez. 2020. "Implementation and Evaluation of Open-Source Hardware to Monitor Water Quality in Precision Aquaculture" Sensors 20, no. 21: 6112. https://0-doi-org.brum.beds.ac.uk/10.3390/s20216112