Photoacoustic-Based Gas Sensing: A Review


Department of Computer Science, Universidad Autónoma de Madrid, Francisco Tomás y Valiente 11, 28049 Madrid, Spain
Sensors 2020, 20(9), 2745; https://0-doi-org.brum.beds.ac.uk/10.3390/s20092745
Submission received: 31 March 2020
/
Revised: 6 May 2020
/
Accepted: 9 May 2020
/
Published: 11 May 2020
(This article belongs to the Special Issue Optical Spectroscopy, Sensing, and Imaging from UV to THz Range)
Abstract
:The use of the photoacoustic effect to gauge the concentration of gases is an attractive alternative in the realm of optical detection methods. Even though the effect has been applied for gas sensing for almost a century, its potential for ultra-sensitive and miniaturized devices is still not fully explored. This review article revisits two fundamentally different setups commonly used to build photoacoustic-based gas sensors and presents some distinguished results in terms of sensitivity, ultra-low detection limits, and miniaturization. The review contrasts the two setups in terms of the respective possibilities to tune the selectivity, sensitivity, and potential for miniaturization.
1. Introduction
The photoacoustic effect has been described as early as the 19th century by several scientists [1,2,3,4,5], i.e., quite some time before the invention of the condenser transmitter [6,7] or other devices that would have allowed recording and quantifying of the parameters of a sound wave. However, the potential of converting light into sound was soon recognized and employed to detect gases. In particular, the possibility to gauge the light intensity using a gas-filled hermetically sealed cell has been explored in the context of improving the selectivity of the first so-called non-dispersive infrared spectrometer (NDIR) devices [8,9,10]. NDIR sensors at the time and still today show cross sensitivities to a large number of gas species because of the broad spectral response of solid-state-based light detectors. To overcome this drawback, first Schick in the 1920s and then Veingorow, Luft, and Lehrer realized the potential of using the target gas itself as the filter medium since it features near-identical spectral characteristics. This allows for maximizing the information content of the signal of the light transducer [11,12]. While working for the IG Farben constituent BASF, Ludwigshafen, Germany, Luft and Lehrer developed a measurement instrument based on this idea and applied for patent, which was granted in 1942 [13]. The so-called Ultrarotabsorptionsschreiber (URAS) (literal translation: ultra-red absorption writer) is still sold under this name and the rights and trademarks have since passed from BASF to Hartman&Braun, which currently is part of ABB, Zürich, Switzerland.
Of course, research and development efforts related to the photoacoustic effect did not stop 70 years ago, including the establishment of theoretical foundations [14]. The historic evolution of technologies relying on the photoacoustic effect [11,15,16] as well as the closely related photothermal effect [17] are not the subject of this contribution. The application of the effect has branched out to various fields of application [18,19], including photoacoustic-based imaging, which is already covered in a number of reviews [20,21,22]. Because of the sheer vastness of the topic, this review focuses on the use of photoacoustics for gas sensing and in addition to previous related reviews [23,24,25,26]. Photoacoustics is a spectroscopic technique based on absorption of light and governed by the corresponding interactions of photons with matter. Therefore, this review will briefly revisit the relevant basic principles. As an absorption spectroscopy technique, it unites all the advantages of this approach, in particular the selectivity, sensitivity, and possibility for contactless sensing. Today, many research and development teams are working on improving the performance and devising new ways to employ the photoacoustic effect. This review on the topic can only hope to provide an overview over the most important aspects and results in this area. It is not intended to provide a complete list of all the literature available to date.
2. Fundamentals of Photoacoustics
The prerequisite for photoacoustics is the absorption of light by particles and all considerations here are valid for the complete spectral range, even though the infrared spectral range may often seem the focus of attention. In terms of selectivity in gas sensing, this makes photoacoustics comparable to other absorption-based methods, most notably the so-called tunable diode laser absorption spectroscopy (TDLAS) [27,28] and non-dispersive infrared absorption spectroscopy (NDIR) [10,29], depending on the light source and setup used. Strong absorption features are linked with dipole-allowed transitions between electronic, vibrational, or rotational states as well as combinations thereof [30]. The strength of individual transitions between two states of a molecule or atom is summarized in a temperature (T)-, pressure (p)-, and frequency (ν)-dependent parameter, the so-called absorption cross section σT,p (ν). The line shape of σT,p (ν) is pressure and temperature dependent and for typically used light intensities, the saturation effects of a single absorption line [31] may be disregarded. The pressure-induced collisions of molecules/atoms give rise to a shortened lifetime of excited states, which in turn leads to a Lorentzian line shape in the frequency space. Likewise, temperature-induced random movement of an ensemble gives rise to Gaussian line shapes. In consequence, the relative importance of pressure and temperature for a given σT,p (ν) gives rise to the finally observed line shapes.
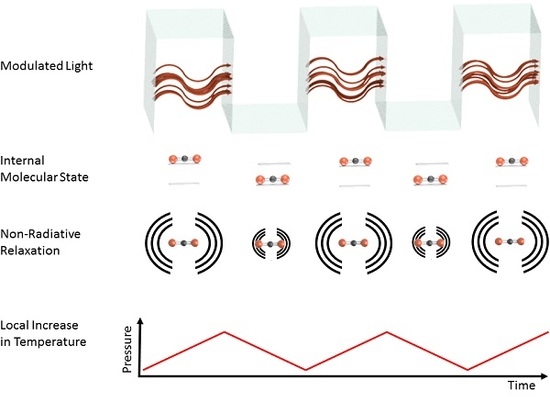
In principle, various paths for relaxation of the excited system are possible upon absorption of a photon. Roughly, they may be separated into radiative and non-radiative processes or a combination thereof. For a strong photoacoustic signal, non-radiative relaxation processes should dominate over the re-emission of photons. In those cases where non-radiative processes are much quicker than radiative processes, most of the photon energy is converted into rovibrational and translational energy [18,32]. Ideally, the complete photon energy Ep = h v is converted into the internal and translational energy of the molecule. These systems tend to be well-suited for generating strong photoacoustic signals, since this will lead to local heating, which translates into an increase of temperature and pressure. Therefore, photoacoustic spectroscopy may be viewed as complementary to fluorescence spectroscopy.
By modulating the light intensity, a periodic pressure variation can be generated, which in turn can readily be captured with a sound-detecting device like a microphone, a lever, or a tuning fork. This may be done by electronic means [33,34], opto-acoustic components [35], or mechanical choppers [36] in order to adjust the modulation frequency to the resonance frequency of the acoustic resonators. Figure 1 schematically depicts the processes involved in generating a sound wave. The type of modulation may vary, and the type of light source may limit the available soundwave excitation frequencies. When relying on using the light source’s driving current for intensity modulation, then thermal light sources are currently limited to frequencies on the order of 30 Hz [37]. Higher modulation frequencies using thermal sources may be achieved using a chopper. On the other hand, light-emitting diodes (LEDs) and diode lasers may easily be intensity modulated via their driving current. Frequencies up to several MHz can be achieved in theory. When using single-mode lasers, the use of wavelength modulation is a further option [34,38] to generate a photoacoustic signal. In any case, the intensity modulation frequency νM range is limited by fundamental considerations: On the one hand, it should be faster than the inverse of the molecular diffusion time 1/tdiff, because otherwise no pressure wave may form. On the other hand, the modulation frequency has to be slower than the inverse of the molecular relaxation time 1/τR, such that the system may react to changes [39].
However, instead of a classification in terms of light sources used, the discussion here will distinguish between two fundamentally different setups to use the photoacoustic effect for gas detection. For the remainder of the manuscript, setups are denoted as “indirect photoacoustics” when the sound-detecting device is not directly coupled with the analyte, i.e., the gas matrix to be analyzed. In contrast, in a “direct photoacoustic” setup, the sound generated by the analyte is detected while it is acoustically coupled with the medium to be analyzed. The potential in terms of sensitivity and miniaturization of the two approaches is governed by different parameters, which will become apparent in the corresponding discussion.
3. Direct vs. Indirect Setups
Figure 2 schematically shows the detection of a representative trace gas (carbon dioxide—CO2), the main constituents of air (nitrogen—N2 and oxygen—O2), as well as often occurring and strongly varying humidity (water—H2O), which may also be the cause for cross-sensitivities. It depicts the two types of photoacoustic setups that can be distinguished depending on whether the gas mixture is to be analyzed is in direct contact with the sound detection device or not.
While this might seem a minor difference, it has important implications as to the modus operandi of systems and their respective potential in terms of miniaturization, sensitivity, and long-term stability. Many different and sophisticated devices have been developed using both types of setup. However, the inherent differences due to the different setups remain. Considering the application requirements is essential in opting for one way or another. Hopefully, this review and included discussion may act as a guide and orientation for the reader.
3.1. Indirect Photoacoustic (NDIR Setups)
The first commercially available photoacoustic-based gas detection devices were based on an NDIR-type setup, using a two-chamber system. Luft and Lehrer published [10] and patented [13] the so-called Ultrarotabsorptionsschreiben (URAS). The setup is depicted in Figure 3 and highlights several well-thought features, including an ingrained reference channel and a zero signal in the absence of the analyte. The basic idea of the setup is to use a hermetically sealed cell filled with the type of gas to be detected and equipped with a sound-detecting device to gauge the light absorption. This means that the setup is a non-dispersive absorption spectroscopy (NDIR) approach [29,40], where the attenuation of light in the optical path between the light source and light detector is used to infer the gas concentration. For trace gas sensing, one may assume that the Beer–Lambert–Bouguer law (also Beer–Lambert law) [41] is a valid approximation of the light attenuation:
where I (ν, l) and I (ν, 0) is the light intensity at emission frequency ν after and before the optical path l, respectively, σp,T (ν) is the frequency-dependent absorption cross section of the gas species, and n is the number density. The very idea of NDIR spectroscopy is that no dispersive optical element is necessary to retrieve information regarding the gas concentration, hence the name. This in turn means, that the light detector performs an integration of all frequencies emitted by the light source within the response function, i.e., its output signal may be written as:
where D (ν) is the frequency-dependent responsivity of the detector. The dependence on the optical path length l means that the sensitivity and dynamic range of the setup can be tuned by that parameter. Saturation effects may occur if too many molecules absorb light prior to reaching the detector, which limits the dynamic range. The optical path length l is therefore the principal design tool to adjust the measurement range and resolution of NDIR devices. The degree of selectivity of this setup is subject to the spectral functions of both the light emitter as well as the detector, since the final signal is the result of a spectral convolution of the emitter and detector. In its most basic version, a spectrally broad-band [42] or narrow-band [43] thermal emitter may be combined with a broad band detector, such as a thermistor or photoresistor [44], which gives rise to a large number of cross-sensitivities to other gases. For that reason, spectral filters are oftentimes employed to limit the relevant spectral range to cover relevant absorption bands. Spectral filters can also be used to implement a reference channel that may account for fluctuations of the optical power emitted by the light source, e.g., a typical setup for an NDIR sensing device would employ two spectral filters, the first one a band pass for strong absorption bands of the gas to be detected and the second one a band pass where no or only very few molecules exhibit absorption [45].
Luft and Lehrer realized as early as the 1930s that the detector response function of standard broad-band detectors, such as photoresistors, introduce a larger number of sensitivities to other gas species and a suitable spectral filter may not always be feasible. This is especially relevant where many molecules show overlapping spectral features, e.g., in the 3 µm/3000 cm−1 spectral region, where many hydrocarbons exhibit strong absorption lines due to C-H stretch vibrations. They therefore came up with the idea of using the gas to be detected itself as a spectral filter. Additionally, they used the photoacoustic effect as a transducer mechanism to convert light power into an electrical signal. In order to realize a reference channel, two parallel optical paths of equal length are illuminated by the same light source. One path is filled with the gas mixture to be analyzed while the second path features an unchanging gas mixture containing a fixed concentration of the analyte. The detector devised in the URAS was (and is) made up of two hermetically sealed chambers filled with the gas to be detected. Both chambers are separated by a membrane that converts emerging pressure differences due to a non-zero difference in absorption along the optical path into an electronic signal. This means that a difference in the absorption along the respective optical paths results in a pressure difference in the URAS-type detector, serving as an indicator for the number density of the analyte. Since the excited sound wave amplitude is directly proportional to the light intensity, this allows for measurement of the concentration. The setup also ensures that there is no signal when no analyte is present.
The development of the URAS-type sensor expanded from carbon monoxide (CO) sensing to include many other small molecules, including methane (CH4) and carbon dioxide (CO2) [46]. Additionally, more companies have since developed their own solutions based on similar principles. With the emergence of microsystems technology, efforts have begun to miniaturize the URAS setup [47,48,49]. To this end, simulations of the sensitivity function of standard NDIR and photoacoustic NDIR underscore the potential for miniaturization [50] and experimental data does support this [51].
The sensitivity is increased by roughly one order of magnitude as compared to NDIR devices using narrow-band interference filters depending on the spectral properties of the gas [52]. The reason is that only photons at frequencies coinciding with the absorption features of the target gas add to the signal for photoacoustic NDIR. Several versions of miniaturized photoacoustic NDIR have been demonstrated in recent years using thermal emitters, light-emitting diodes (LEDs), and lasers as light sources, and microelectromechanical systems (MEMS) microphones, quartz tuning forks (QTF) [53], or cantilevers [54] as sound transducers. Because most microphones offer a constant sensitivity over a large frequency range, the intensity modulation of the light source may be chosen quite freely, always taking into account that the photoacoustic signal amplitude decreases with an increasing modulation frequency 1/νMOD [14]. However, when using, e.g., a QTF, the photoacoustic signal has to coincide with the resonance of the system [55]. While this poses a restriction of the possible modulation frequencies, it also introduces a build-in narrow-band acoustic filter to reject ambient noise. Table 1 gives an overview of recent contributions that aim at miniaturizing URAS-type solutions, i.e., indirect photoacoustic spectroscopy setups, employing optical path lengths as short as 1 mm [56]. Most of these examples do not feature a reference channel, which is a shortcoming as compared to the original URAS-type devices because it hinders the construction of long-term stable devices that automatically correct for changes of the emission characteristics of the light source. One reason is that QTFs or MEMS microphones are often used as readily available standard transducers of sound to present proof-of-principle systems. Additionally, realizing URAS-type detectors in microsystems technology as well as system’s engineering is more challenging. Hence, it remains a task to come up with a configuration that realizes a reference channel when using photoacoustic detectors to build NDIR devices. One possibility is to build a system using a single light source featuring two identical detectors at different optical paths [51]. This way, the effective optical path length is reduced, but long-term changes in the light source may be corrected for. Alternatively, two photoacoustic detectors can be serially aligned, with one containing the target gas and the other filled with a gas that does not exhibit any or only partially overlapping spectral signatures. A correction for intensity fluctuations of the light source can be derived if both absorption spectra are within the emission spectrum of the light source, but only one reacts to the gas to be detected.
3.2. Direct Setups
A setup for direct photoacoustics differs fundamentally from NDIR, i.e., indirect setups, in its means of increasing sensitivity and achieving selectivity. While for indirect photoacoustics setups, sensitivity is mostly defined by the optical path length l, direct setups rely on increasing the optical power P0 to increase the acoustic signal generated. This becomes apparent when looking at the generation of a signal S [39]:
where C is a system-specific constant, n is the number density, and σp,T (ν) is the absorption cross section. In contrast to indirect setups, the selectivity is achieved via the spectral properties of the light source, including possible spectral filters. The implications of the signal generation on the gas response of sensing systems extends to the dynamic range because in direct setups, it is limited by the signal to noise ratio on the one hand, and the dynamic range of the sound transducer on the other hand. The latter may be extremely large, since, e.g., MEMS microphones typically have a 100-dB dynamic range, which is equivalent 5 orders of magnitude in the number density of the gas. Equation (3) shows that increasing the optical power will improve the system’s performance. Additionally, a reduction in acoustic noise and/or enhancement of the generated sound will help improve the signal to noise ratio, leading to ever more sensitive gas detectors, which is summarized in the parameter C. In fact, photoacoustic-based resonator-enhanced gas detection systems are among the most sensitive chemical sensors built to date, reaching limits of detection in the ppq (parts-per-quadrillion) range [65,66]. Especially since laser sources in the mid infrared range have become readily available [67,68], the field of laser-based photoacoustic spectroscopy has seen a stark increase in contributions. Nonetheless, the first laser-based photoacoustic-based gas sensing systems were demonstrated more than 50 years ago [69] and an ultra-sensitive device was reported as early as 1971 [70], highlighting the potential of the combination of a laser as the light source and the photoacoustic effect for chemical analysis and environmental studies [71]. Depending on the requirements of a specific measurement task, LEDs or thermal light sources might prove more suitable and in fact, many commercially available solutions use simple direct photoacoustic setups. Figure 4 summarizes the basic setups used to perform direct photoacoustic spectroscopy. It should be pointed out that a combination of acoustic resonator and, e.g., a QTF, is of course possible and has been demonstrated already [72]. Nonetheless, the choice for one approach or another will always depend on the system requirements as becomes clear from a comparison of microphone-based setups and a lever setup [73].
To optimize the photoacoustic signal and enable specific detection of a gas species, the use of laser sources plays a pivotal role in most laboratory setups. The high spectral density and beam quality allows for the design of ultra-sensitive devices and the use of enhancement strategies to increase the acoustic signal allows for the building of highly sensitivity and specific analyzers.
3.2.1. Non-Resonator Based Setups
Depending on the requirements of a measurement task, the focus may lay on a simpler and less expensive setup rather than achieving ultra-sensitive and specific detection. Additionally, the usefulness of laser sources depends on the spectral functions of the analyte. One example is nitrogen dioxide (NO2), with an absorption spectrum in the blue/UV spectral range around 400 nm. The strongly overlapping electronic absorption features have a full width at half maximum (FWHM) width exceeding 100 nm [74,75] and the associated radiant decay gives rise to the typically brownish/red color of smog in polluted cities [76]. Hence, commercially available LEDs have a sufficiently narrow band to provide a reasonable degree of selectivity. Other examples include the CO2 absorption band near 4.2 µm, where few other gases absorb. In these cases, selectivity that is basically equal to standard NDIR is achieved using the most simple photoacoustic setup, i.e., a light source illuminating a volume and generating periodic pressure variations. A combined standard NDIR and direct photoacoustic device was presented in [77] and demonstrates a direct comparison. However, commercial examples of direct photoacoustic setups include the recently launched miniature sensors of Sensirion [78], and Infineon [79], the latter including a spectral filter around 4.2 µm to limit cross-sensitivities. The size of these systems is comparable to miniaturized indirect photoacoustic setups [52] but feature a lower degree of selectivity. Advanced Energy does offer the “Innova” series of systems based on the same principle but uses several spectral filters to excite soundwaves belonging to different gas molecules (formerly Lumasense) [80]. While the signal of these setups is proportional to the number density, they are also prone to drifts due to fluctuations of the emitted power as well as cross sensitivities towards other molecules with absorption lines overlapping the emission spectrum of the employed light source. However, current manufacturers prefer a simple setup in exchange for lower selectivity, and sensitivity. In order to improve both figures of merit, more complex setups are necessary, which often incorporate laser light sources. The potential of a non-resonant photoacoustic cell is highlighted in [66,81], where it is combined with a high-quality optical cavity to enhance the optical power to generate the photoacoustic signal. The limits of detection achieved in those works are in the ppt range.
3.2.2. Acoustic Resonator-Enhanced Photoacoustic Spectroscopy
From the very beginning of direct photoacoustic spectroscopy, the use of acoustic resonators has been a central engineering task and [32] provides a review of the basic concepts. An acoustic resonator may perform two tasks, namely the insulation from environmental acoustic noise and enhancement of the photoacoustic signal. Depending on the size of the system, different regimes of acoustic wave propagation and the formation of standing waves apply [82]. In any case, the most important figure of merit of this element is the Q-factor, which is an often-used figure of merit describing the quality of a resonator and the associated enhancement factor of a resonant wave. For acoustic resonators, the Q-factor may be expressed as [83]:
where ν0 is the resonance frequency and δν the full-width half-maximum linewidth of the resonance. Consequently, the photoacoustic wave should match one of the resonance frequencies in order to achieve signal amplification. To build ultra-sensitive devices, a cancelation of ambient noise and parasitic signals, e.g., from windows, sophisticated and clever designs and modus operandi have been devised. Among the most widely used approaches is the use of so-called differential photoacoustic cells. The setup employs two equal acoustic resonators and compares the signals of the microphone placed in each. Two different methods to use this setup have been proposed: The more common method is to excite gas only in one of the resonators [84] but have a single buffer volume and windows for both resonators. This way, the noise detected by both microphones is equal and may be used to retrieve a signal only dependent on the light power and number density. Alternatively, the acoustic wave may be excited in both resonators but at a phase difference of π, i.e. 180°, which increases the signal by about a factor of 2 [85]. In any case, the problem of compensating for drifts in the light power of microphone sensitivity remains with these setups. Among the examples to improve the long-term stability and enable an automated compensation of drifts is the so-called differential mode excitation scheme [86]. It makes use of the detection of different modes of the resonator that carry different information regarding the gas concentration and noise, which ultimately leads to the retrieval of a purely gas-dependent signal using only a single resonator. A single resonator may also be used to detect various gases, e.g., by multiplexing the laser sources [87]. While many efforts are aimed at improving sensitivity, the long-standing goal of miniaturization of these setups to make them portable is being pursued as well. In terms of miniaturization, 3-D printers and silicon technology have been used to build simpler and smaller setups with diminished performances but at much lower cost and requiring less infrastructure [88,89,90,91,92,93,94].
Since the signal strength improves the performance in terms of a lower limit of detection and better resolution, the use of either multi-reflection cells or optical resonators has started to attract much interest over the years [95,96,97,98,99,100,101]. To this end, high-quality resonators may enhance the available optical power for signal generation by several orders of magnitude [102]. It is, however, important to note that changes in the optical alignment of mirror quality may lead to notable chances in the performance, which is why these parameters have to be precisely controlled. After all, as evident from Equation (3), any change in the optical power will lead to a change in the signal. The use of various enhancement techniques also makes the setup more complex, since several resonance conditions have to be fulfilled at once, including the absorption transition (central lasing frequency), the optical resonator (central lasing frequency), and the acoustic resonator (modulation frequency). In any case, it remains a fundamental issue that acoustic resonators are subject to changes in their Q-factor and resonance frequency resulting from changes in environmental parameters, including temperature [103,104], humidity [105], and the gas matrix itself [106], since the speed of sound depends on all these factors. Additionally, the collisional partner influences the sensing behavior as well [107]. This has to be taken into account when characterizing and deploying acoustic resonator-enhanced photoacoustic systems. Table 2 summarizes some systems that have employed acoustic resonators in the past years.
3.2.3. Quartz-Enhanced and Cantilever Photoacoustic Absorption Spectroscopy
Low-cost reliable MEMS devices often allow for advances in miniaturization and improvement of performances in originally unforeseen applications. The last two decades have seen an increasing use of so-called quartz tuning forks (QTFs) [53] as well as micromachined levers [154] in sensing applications. Originally, these devices served, e.g., as a stable frequency reference [155] but since have found alternative applications, e.g., to read out atomic force microscopy (AFM) tips [156] as well as a sound transducer in photoacoustic setups. Levers as well as QTFs are governed by highly similar physical concepts from which their usefulness derives and are treated as equivalent for the remainder of this discussion. These readily available low-cost components feature a high Q factor and have been employed to gauge the photoacoustic sound wave amplitude for almost two decades now. When using a QTF, the setups are denominated as quartz-enhanced photoacoustic absorption spectroscopy (QEPAS) [157] and this name shall include lever-based setups here as well. As opposed to cavity-enhanced photoacoustic setups, QEPAS does not realize an acoustic resonator but the QTF is a resonator itself, i.e., the prongs of the fork (or the lever) resonate(s) when exited by a sound wave. Because of the high Q-factors of miniature low-cost tuning forks, it has become a central building block for small high-performance gas sensing devices. The higher the Q factor, the longer the time delay between two independent measurements. A number of reviews on QEPAS are available [158,159,160] and current research and development efforts are focused on reducing the size of systems, designing custom QTFs to lower the resonance frequency [72,161], as well as increasing the efficiency of the coupling sound to the prongs via excitation of the sound parallel to the prongs [162] as well as adding an acoustic resonator to a QEPAS setup [163].
The setup of QEPAS/lever systems is based on exciting the acoustic wave in-between the prongs of the fork or in proximity to a lever. Similar to acoustic resonators, QTFs also exhibit higher order vibrational modes that may be taken advantage of, e.g., by using a single QTF to detect various gases simultaneously [164,165]. To this end, a precise alignment of the laser beam is required in order to efficiently couple sound into the transducing device. The most common approaches include free-space optics using a focusing lens [166], tapered fiber setups, and fiber-coupled systems [167]. The read-out is usually based on a lock-in scheme in order to determine the oscillation amplitude at the resonance frequency using the 2f signal. Again, the laser power is crucial for the resulting signal and needs to be stabilized or at least measured with high precision in order to extract reliable number density readings. A change in the background gas composition may influence the signal and read-out strategies need to take this into account [168]. Additionally, environmental parameters influence the resonance frequency and bandwidth of the QTF. To overcome some of these issues, an alternative operational scheme was presented in [169] allowing for retrieval of the Q factor and resonance frequency of QTF with each measurement thus improving the calibration issues and long-term stability.
4. Discussion and Conclusions
Direct and indirect photoacoustic systems both employ the photoacoustic effect for gas detection but differ fundamentally in their setups and working principles. When designing a gas sensing system, one therefore must be aware of the distinct factors that influence their respective performances in terms of selectivity, sensitivity, stability, robustness, and potential for miniaturization.
For setups of indirect photoacoustic spectroscopy, the selectivity of the system is introduced via the gas filling of the hermetically sealed photoacoustic cell. An acoustic signal may only be generated when the emission spectrum of the light source and the absorption spectrum coincide. The gas filling hence acts as a near-ideal spectral filter and the gas to be detected can be chosen according to the requirements of the measurement task. On the other hand, selectivity in direct photoacoustic setups is entirely dependent on the spectral function of the light source, since an acoustic signal will be generated whenever a molecule absorbs radiation. For this reason, thermal emitters are usually combined with spectral filters in order to improve selectivity. Most setups use lasers as light sources because it enables the construction of specific gas detection systems.
In order to tailor the limit of detection, the sensitivity and the dynamic range of gas detection systems’ indirect setups use the optical path between the light source and detector. Using this knob, one may change these parameters, but a fundamental limit remains, namely that the sensor signal saturates for strong absorption along the optical path, thus limiting the achievable dynamic range. Additionally, increasing the optical path length, i.e., the sensitivity, will become more difficult the longer the optical path becomes. The use of acoustic resonators to improve the signal to noise ratio is of course possible, but little work has been done on this so far, other than using QTF as the sound transducer. In direct setups, the dynamic range is given by the sound-transducing device and hence can be improved by choosing or engineering suitable components. Both the limit of detection as well as the sensitivity may be engineered by the optical power used to excite the acoustic wave as well as enhancing the acoustic wave and improve its detection.
Finally, the potential for miniaturization of both approaches is a more complex issue and depends very much on the application, in particular the required resolution and limit of detection. Indirect, i.e., photoacoustic NDIR, setups may be designed about one order of magnitude smaller as compared to standard NDIR setups while maintaining the same sensitivity and improved performance in terms of selectivity. However, a direct comparison with direct photoacoustics is more difficult, since the performance depends on the optical power available as well as the concentration range one has to monitor. When employing acoustic resonators, the size of the system cannot be reduced indefinitely, since an increase in the acoustic frequency leads to a decreasing amplitude. In terms of miniaturization, employing a QTF currently appears to be a promising candidate. However, it is difficult to combine with thermal light sources, because of the required high modulation frequency in the kHz range. At the same time, mid-infrared lasers are currently still expensive, meaning that miniaturization is feasible but not commercially reasonable. In any case, the technological choice depends on a multitude of parameters, including requirements on prize, system size, sensitivity, stability, selectivity, and calibration efforts. An example of this is the first commercially available miniaturized photoacoustic gas sensors, which employ a thermal light source at a low modulation frequency in combination with a spectral filter to detect carbon dioxide. Both the cross-sensitivities and the resolution are comparable to standard NDIR devices, thus not making full use of the potential of photoacoustics. The use of the photoacoustic effect in gas sensing has a long-standing history, but current research and development efforts show that the potential of the technique is far from fully exploited. Especially the use of MEMS technology in gas sensing systems will probably lead to further improvements in terms of the long-term stability, miniaturization, integration, and selectivity. The aim of this manuscript was to provide a quick introduction to the main areas of photoacoustic-based gas sensing and discussion of the different aspects of a specific implementation.
Funding
S.P. acknowledges funding from the Community of Madrid under grant number 2016-T1/AMB-1695.
Conflicts of Interest
The author declares no conflict of interest.
References
- Bell, A.G. On the Production and Reproduction of Sound by Light. Am. J. Sci. 1880, 20, 305–324. [Google Scholar] [CrossRef] [Green Version]
- Tyndall, J. Action of an Intermittent Beam of Radiant Heat upon Gaseaous Matter. Proc. R. Soc. Lond. 1881, 31, 307–317. [Google Scholar]
- Röntgen, W.C. On tones produced by the intermittent irradiation of a gas. Lond. Edinb. Dublin Philos. Mag. J. Sci. 1881, 11, 308–311. [Google Scholar] [CrossRef] [Green Version]
- Mercadier, E. Sur la radiophonie. J. Phys. Theor. Appl. 1881, 10, 53–68. [Google Scholar] [CrossRef]
- Preece, W.H.I. On the conversion of radiant energy into sonorous vibrations. Proc. R. Soc. Lond. 1881, 31, 506–520. [Google Scholar]
- Wente, E.C. A Condenser Transmitter as a Uniformly Sensitive Instrument for the Absolute Measurement of Sound Intensity. Phys. Rev. 1917, 10, 39–63. [Google Scholar] [CrossRef] [Green Version]
- Wente, E.C. Telephone-Transmitter. U.S. Patent 1,383,744, 16 March 1920. [Google Scholar]
- Veingorow, M.L. Eine neue Methode der Gasanalyse beruhend auf dem optisch-akustischen Tyndall-Röntgeneffekt. Proc. USSR Acad. Sci. 1938, 19, 687–688. [Google Scholar]
- Pfund, A.H. Atmospheric Contamination. Science 1939, 90, 326–327. [Google Scholar] [CrossRef]
- Luft, K.F. Über eine Neue Methode der Registrierenden Gasanalyse mit Hilfe der Absorption Ultraroter Strahlen ohne spektrale Zerlegung. Z. Tech. Phys. 1943, 5, 97–104. [Google Scholar]
- Luft, K.F.; Schaefter, W.; Wiegleb, G. 50 Jahre NDIR-Gasanalyse. Tech. Mess. 1993, 60, 363–371. [Google Scholar] [CrossRef]
- Schmick, H. Determining the Contents of a Gas. U.S. Patent 1,691,138, 13 November 1926. [Google Scholar]
- Lehrer, G.; Luft, K. Verfahren zur Bestimmung von Bestandteilen in Stoffgemischen Mittels Strahlungsabsorption. DE Patent DE730478C, 14 January 1943. [Google Scholar]
- Mcdonald, F.A.; Wetsel, G.C.; Mcdonald, F.A.; Wetsel, G.C. Generalized theory of the photoacoustic effect Generalized theory of the photoacoustic effect. J. Appl. Phys. 1978, 49, 2313–2322. [Google Scholar] [CrossRef]
- Manohar, S.; Razansky, D. Photoacoustics: A historical review. Adv. Opt. Photonics 2016, 8, 586–617. [Google Scholar] [CrossRef] [Green Version]
- Mandelis, A. Photoacoustic, Photothermal, and Diffusion-Wave Sciences in the Twenty-First Century: Triumphs of the Past Set the Trends for the Future. Int. J. 2012, 33, 1776–1777. [Google Scholar] [CrossRef]
- Krzempek, K. A Review of Photothermal Detection Techniques for Gas Sensing Applications. Appl. Sci. 2019, 9, 2826. [Google Scholar] [CrossRef] [Green Version]
- Tam, A.C. Appliacations of photoacoustic sensing techniques. Rev. Mod. Phys. 1986, 58, 381–431. [Google Scholar] [CrossRef]
- West, G.A.; Barrett, J.J.; Siebert, D.R.; Reddy, K.V. Photoacoustic spectroscopy. Rev. Sci. Instrum. 1983, 54, 797–817. [Google Scholar] [CrossRef]
- Steinberg, I.; Huland, D.M.; Vermesh, O.; Frostig, H.E.; Tummers, W.S.; Gambhir, S.S. Photoacoustic clinical imaging. Photoacoustics 2019, 14, 77–98. [Google Scholar] [CrossRef]
- Van Den Berg, P.J.; Daoudi, K.; Steenbergen, W. Review of photoacoustic flow imaging: Its current state and its promises. Photoacoustics 2015, 3, 89–99. [Google Scholar] [CrossRef] [Green Version]
- Xu, M.; Wang, L.V. Photoacoustic imaging in biomedicine. Rev. Sci. Instrum. 2006, 77, 41101. [Google Scholar] [CrossRef] [Green Version]
- Bozóki, Z.; Pogány, A.; Szabó, G. Photoacoustic Instruments for Practical Applications: Present, Potentials, and Future Challenges. Appl. Spectrosc. Rev. 2011, 46, 1–37. [Google Scholar] [CrossRef]
- Li, J.; Chen, W.; Yu, B. Recent Progress on Infrared Photoacoustic Spectroscopy Techniques. Appl. Spectrosc. Rev. 2011, 46, 440–471. [Google Scholar] [CrossRef]
- Haisch, C. Photoacoustic spectroscopy for analytical measurements. Meas. Sci. Technol. 2011, 23, 12001. [Google Scholar] [CrossRef]
- Harren, F.J.M.; Cristescu, S.M. Photoacoustic Spectroscopy in Trace Gas Monitoring. In Encyclopedia of Analytical Chemistry; American Cancer Society: New York City, NY, USA, 2019; pp. 1–29. [Google Scholar]
- Werle, P.; Slemr, F.; Maurer, K.; Kormann, R.; Mücke, R.; Jänker, B. Near- and mid-infrared laser-optical sensors for gas analysis. Opt. Lasers Eng. 2002, 37, 101–114. [Google Scholar] [CrossRef]
- Werle, P. A review of recent advances in semiconductor laser based gas monitors. Spectrochim. Acta Part A Mol. Biomol. Spectrosc. 1998, 54, 197–236. [Google Scholar] [CrossRef]
- Dinh, T.V.; Choi, I.Y.; Son, Y.S.; Kim, J.C. A review on non-dispersive infrared gas sensors: Improvement of sensor detection limit and interference correction. Sens. Actuatorsb Chem. 2016, 231, 529–538. [Google Scholar] [CrossRef]
- Ball, D.W. The Basics of Spectroscopy; SPIE Press: Bellingham, WA, USA, 2001. [Google Scholar]
- Demtröder, W. Laser Spectroscopy 1; Springer: Berlin/Heidelberg, Germany, 2014. [Google Scholar]
- Miklós, A.; Hess, P.; Bozóki, Z. Application of acoustic resonators in photoacoustic trace gas analysis and metrology. Rev. Sci. Instrum. 2001, 72, 1937–1955. [Google Scholar] [CrossRef] [Green Version]
- Gondal, M.A.; Yamani, Z.H. Highly sensitive electronically modulated photoacoustic spectrometer for ozone detection. Appl. Opt. 2007, 46, 7083–7090. [Google Scholar] [CrossRef]
- Angelmahr, M.; Miklós, A.; Hess, P. Wavelength- and amplitude-modulated photoacoustics: Comparison of simulated and measured spectra of higher harmonics. Appl. Opt. 2008, 47, 2806–2812. [Google Scholar] [CrossRef]
- Daoudi, K.; Hussain, A.; Hondebrink, E.; Steenbergen, W. Correcting photoacoustic signals for fluence variations using acousto-optic modulation. Opt. Express 2012, 20, 14117–14129. [Google Scholar] [CrossRef] [Green Version]
- Germer, M.; Wolff, M. Photoacoustic investigation of QCL modulation techniques. J. Phys. Conf. Ser. 2010, 214, 012067. [Google Scholar] [CrossRef] [Green Version]
- Walden, P.; Kneer, J.; Knobelspies, S.; Kronast, W.; Mescheder, U.; Palzer, S. Micromachined Hotplate Platform for the Investigation of Ink-Jet Printed, Functionalized Metal Oxide Nanoparticles. J. Microelectromech. Syst. 2015, 24, 1384–1390. [Google Scholar] [CrossRef]
- Schilt, S.; Thévenaz, L. Wavelength modulation photoacoustic spectroscopy: Theoretical description and experimental results. Infrared Phys. Technol. 2006, 48, 154–162. [Google Scholar] [CrossRef]
- Sigrist, M.W. Trace gas monitoring by laser photoacoustic spectroscopy and related techniques (plenary). Rev. Sci. Instrum. 2003, 74, 486–490. [Google Scholar] [CrossRef]
- Hodgkinson, J.; Tatam, R.P. Optical gas sensing: A review. Meas. Sci. Technol. 2013, 24, 012004. [Google Scholar] [CrossRef] [Green Version]
- Swinehart, D.F. The Beer-Lambert Law. J. Chem. Educ. 1962, 39, 333–335. [Google Scholar] [CrossRef]
- Macisaac, D.; Kanner, G.; Anderson, G. Basic Physics of the Incandescent Lamp (Lightbulb). Phys. Teach. 1999, 37, 520–525. [Google Scholar] [CrossRef]
- Lochbaum, A.; Fedoryshyn, Y.; Dorodnyy, A.; Koch, U.; Hafner, C.; Leuthold, J. On-Chip Narrowband Thermal Emitter for Mid-IR Optical Gas Sensing. ACS Photonics 2017, 4, 1371–1380. [Google Scholar] [CrossRef] [Green Version]
- Rogalski, A. Infrared detectors: An overview. Infrared Phys. Technol. 2002, 43, 187–210. [Google Scholar] [CrossRef] [Green Version]
- Hodgkinson, J.; Smith, R.; Ho, W.O.; Saffell, J.R.; Tatam, R.P. Non-dispersive infra-red (NDIR) measurement of carbon dioxide at 4.2 μm in a compact and optically efficient sensor. Sens. Actuatorsb Chem. 2013, 186, 580–588. [Google Scholar] [CrossRef] [Green Version]
- Tranquillini, W. Der Ultrarot-Absorptions-schreiber im Dienste ökologischer Messungen des pflanzlichen CO2-Umsatzes. Plant Biol. 1952, 65, 102–112. [Google Scholar]
- Schjølberg-Henriksen, K.; Schulz, O.; Ferber, A.; Moe, S.; Lloyd, M.; Müller, G.; Suphar, K.H.; Wang, D.T.; Bernstein, R.W. Sensitive and Selective Photoacoustic Gas Sensor Suitable for High-Volume Manufacturing. IEEE Sens. J. 2008, 8, 1539–1545. [Google Scholar] [CrossRef]
- Ohlckers, P.; Dmitriev, V.K.; Kirpilenko, G.; Coatings, P. A Photoacoustic Gas Sensing Silicon Microsystem. In Proceedings of the 11th International Conference on Solid-State Sensors and Actuators, Munich, Germany, 10–14 June 2001; pp. 780–781. [Google Scholar]
- Schjølberg-Henriksen, K.; Wang, D.T.; Rogne, H.; Ferber, A.; Vogl, A.; Moe, S.; Bernstein, R.; Lapadatu, D.; Sandven, K.; Brida, S. High-resolution pressure sensor for photo acoustic gas detection. Sens. Actuators A 2006, 132, 207–213. [Google Scholar] [CrossRef]
- Scholz, L.; Ortiz Perez, A.; Bierer, B.; Wöllenstein, J.; Palzer, S. Gas sensors for climate research. J. Sens. Sens. Syst. 2018, 7, 535–541. [Google Scholar] [CrossRef] [Green Version]
- Wittstock, V.; Scholz, L.; Bierer, B.; Ortiz Perez, A.; Wöllenstein, J.; Palzer, S. Design of a LED-based sensor for monitoring the lower explosion limit of methane. Sens. Actuatorsb Chem. 2017, 247, 930–939. [Google Scholar] [CrossRef]
- Scholz, L.; Ortiz Perez, A.; Bierer, B.; Eaksen, P.; Wöllenstein, J.; Palzer, S. Miniature low-cost carbon dioxide sensor for mobile devices. IEEE Sens. J. 2017, 17, 2889–2895. [Google Scholar] [CrossRef]
- Friedt, J.-M.; Carry, É. Introduction to the quartz tuning fork. Am. J. Phys. 2007, 75, 415–422. [Google Scholar] [CrossRef] [Green Version]
- Fukuma, T.; Kimura, M.; Kobayashi, K.; Matsushige, K.; Yamada, H. Development of low noise cantilever deflection sensor for multienvironment frequency-modulation atomic force microscopy. Rev. Sci. Instrum. 2005, 76, 053704. [Google Scholar] [CrossRef] [Green Version]
- Elia, A.; Lugarà, P.M.; di Franco, C.; Spagnolo, V. Photoacoustic techniques for trace gas sensing based on semiconductor laser sources. Sensors 2009, 9, 9616–9628. [Google Scholar] [CrossRef] [Green Version]
- Bierer, B.; Kress, P.; Nägele, H.; Lemmer, A.; Palzer, S. Investigating flexible feeding effects on the biogas quality in full-scale anaerobic digestion by high resolution, photoacoustic-based NDIR sensing. Eng. Life Sci. 2019, 19, 700–710. [Google Scholar] [CrossRef] [Green Version]
- Knobelspies, S.; Bierer, B.; Ortiz Perez, A.; Wöllenstein, J.; Kneer, J.; Palzer, S. Low-cost gas sensing system for the reliable and precise measurement of methane, carbon dioxide and hydrogen sulfide in natural gas and biomethane. Sens. Actuatorsb Chem. 2016, 236, 885–892. [Google Scholar] [CrossRef]
- Dong, M.; Zheng, C.; Miao, S.; Zhang, Y.; Du, Q.; Wang, Y.; Tittel, F.K. Development and Measurements of a Mid-Infrared Multi-Gas Sensor System for CO, CO2 and CH4 Detection. Sensors 2017, 17, 2221. [Google Scholar] [CrossRef] [PubMed] [Green Version]
- Chen, T.; Su, G.; Yuan, H. In situ gas filter correlation: Photoacoustic CO detection method for fire warning. Sens. Actuatorsb Chem. 2005, 109, 233–237. [Google Scholar] [CrossRef]
- Perez, A.O.; Bierer, B.; Scholz, L.; Wöllenstein, J.; Palzer, S. A Wireless Gas Sensor Network to Monitor Indoor Environmental Quality in Schools. Sensors 2018, 18, 4345. [Google Scholar] [CrossRef] [Green Version]
- Bierer, B.; Nägele, H.J.; Ortiz Perez, A.; Wöllenstein, J.; Kress, P.; Lemmer, A.; Palzer, S. Real-Time Gas Quality Data for On-Demand Production of Biogas. Chem. Eng. Technol. 2018, 41, 696–701. [Google Scholar] [CrossRef]
- Köhring, M.; Böttger, S.; Willer, U.; Schade, W. LED-absorption-QEPAS sensor for biogas plants. Sensors 2015, 15, 12092–12102. [Google Scholar] [CrossRef]
- Scholz, L.; Palzer, S. Photoacoustic-based detector for infrared laser spectroscopy. Appl. Phys. Lett. 2016, 109, 041102. [Google Scholar] [CrossRef]
- Uotila, J. Comparison of infrared sources for a differential photoacoustic gas detection system. Infrared Phys. Technol. 2007, 51, 122–130. [Google Scholar] [CrossRef]
- Xiong, L.; Bai, W.; Chen, F.; Zhao, X.; Yu, F.; Diebold, G.J. Photoacoustic trace detection of gases at the parts-per-quadrillion level with a moving optical grating. Proc. Natl. Acad. Sci. USA 2017, 114, 7246–7249. [Google Scholar] [CrossRef] [Green Version]
- Tomberg, T.; Vainio, M.; Hieta, T.; Halonen, L. Sub-parts-per-trillion level sensitivity in trace gas detection by cantilever-enhanced photo- acoustic spectroscopy. Sci. Rep. 2018, 8, 1848. [Google Scholar] [CrossRef] [Green Version]
- Belkin, M.A.; Capasso, F. New frontiers in quantum cascade lasers: High performance room temperature terahertz sources. Phys. Scr. 2015, 90, 118002. [Google Scholar] [CrossRef]
- Faist, J.; Capasso, F.; Sivco, D.L.; Sirtori, C.; Hutchinson, A.L.; Cho, A.Y. Quantum Cascade Laser. Science 1994, 264, 553–556. [Google Scholar] [CrossRef] [PubMed]
- Kerr, E.L.; Atwood, J.G. The Laser Illuminated Absorptivity Spectrophone: A Method for Measurement of Weak Absorptivity in Gases at Laser Wavelengths. Appl. Opt. 1968, 7, 915–921. [Google Scholar] [CrossRef] [PubMed]
- Kreuzer, L.B. Ultralow Gas Concentration Infrared Absorption Spectroscopy. J. Appl. Phys. 1971, 42, 2934–2943. [Google Scholar] [CrossRef]
- Patel, C.K.N.; Burkhardt, E.G.; Lambert, C.A. Spectroscopic Measurements of Stratospheric Nitric Oxide and Water Vapor. Science 1974, 184, 1173–1177. [Google Scholar] [CrossRef] [PubMed]
- Patimisco, P.; Sampaolo, A.; Giglio, M.; dello Russo, S.; Mackowiak, V.; Rossmadl, H.; Cable, A.; Tittel, F.K.; Spagnolo, V. Tuning forks with optimized geometries for quartz-enhanced photoacoustic spectroscopy. Opt. Express 2019, 27, 1401–1415. [Google Scholar] [CrossRef] [PubMed] [Green Version]
- Lindley, R.E.; Parkes, A.M.; Keen, K.A.; McNaghten, E.D.; Orr-Ewing, A.J. A sensitivity comparison of three photoacoustic cells containing a single microphone, a differential dual microphone or a cantilever pressure sensor. Appl. Phys. B Lasers Opt. 2007, 86, 707–713. [Google Scholar] [CrossRef]
- Bogumil, K.; Orphal, J.; Homann, T.; Voigt, S.; Spietz, P.; Fleischmann, O.C.; Vogel, A.; Hartmann, M.; Kromminga, H.; Bovensmann, H.; et al. Measurements of molecular absorption spectra with the SCIAMACHY pre-flight model: Instrument characterization and reference data for atmospheric remote-sensing in the 230–2380 nm region. J. Photochem. Photobiol. A Chem. 2003, 157, 167–184. [Google Scholar] [CrossRef]
- Hall, T.C.; Blacet, F.E. Separation of the Absorption Spectra of NO2 and N2O4 in the Range of 2400–5000 A. J. Chem. Phys. 1952, 20, 1745–1749. [Google Scholar] [CrossRef]
- Gelbwachs, J.A.; Birnbaum, M.; Tucker, A.W.; Fincher, C.L. Fluorescence determination of atmospheric NO2. Opto-Electronics 1972, 4, 155–160. [Google Scholar] [CrossRef]
- Kühn, K.; Pignanelli, E.; Schütze, A. Versatile gas detection system based on combined NDIR transmission and photoacoustic absorption measurements. IEEE Sens. J. 2012, 13, 934–940. [Google Scholar] [CrossRef]
- Sensirion. CO2, Humidity and Temperature Sensor SCD40; Sensirion: Stäfa, Switzerland, 2020. [Google Scholar]
- Infineon Technologies, A.G. XENSIVTM Environmental Sensor; Infineon Technologies AG: Neubiberg, Germany, 2020. [Google Scholar]
- Advanced Energy. INNOVA 1314i—Highly Accurate, Reliable, Stable, and Remote Controllable Quantitative Gas Monitoring System. 2019. Available online: https://www.advancedenergy.com/globalassets/resources-root/data-sheets/en-gs-innova1314i-data-sheet.pdf (accessed on 9 May 2020).
- Tomberg, T.; Hieta, T.; Vainio, M.; Halonen, L. Cavity-enhanced cantilever-enhanced photo-acoustic spectroscopy. Analyst 2019, 144, 2291–2296. [Google Scholar] [CrossRef] [PubMed] [Green Version]
- Kinsler, L.E.; Frey, A.R.; Coppens, A.B.; Sanders, J.V. Fundamentals of Acoustics, 4th ed.; John Wiley & Sons: Hoboken, NJ, USA, 2000. [Google Scholar]
- Green, E.I. The Story of Q. Am. Sci. 1955, 43, 584–594. [Google Scholar]
- Miklós, A.; Hess, P.; Mohácsi, Á.; Sneider, J.; Kamm, S.; Schäfer, S. Improved photoacoustic detector for monitoring polar molecules such as ammonia with a 1.53 μm DFB diode laser. AIP Conf. Proc. 1999, 463, 126–128. [Google Scholar]
- Zeninari, V.; Kapitanov, V.A.; Courtois, D.; Ponomarev, Y.N. Design and characteristics of a differential Helmholtz resonant photoacoustic cell for infrared gas detection. Infrared Phys. Technol. 1999, 40, 1–23. [Google Scholar] [CrossRef]
- Rey, J.M.; Sigrist, M.W. Differential mode excitation photoacoustic spectroscopy: A new photoacoustic detection scheme. Rev. Sci. Instrum. 2007, 78, 063104. [Google Scholar] [CrossRef]
- McNaghten, E.D.; Grant, K.A.; Parkes, A.M.; Martin, P.A. Simultaneous detection of trace gases using multiplexed tunable diode lasers and a photoacoustic cell containing a cantilever microphone. Appl. Phys. B 2012, 107, 861–871. [Google Scholar] [CrossRef]
- Glière, A.; Barritault, P.; Berthelot, A.; Constancias, C.; Coutard, J.; Desloges, B.; Duraffourg, L.; Fedeli, J.; Garcia, M.; Lartigue, O. Downsizing and Silicon Integration of Photoacoustic Gas. Int. J. Thermophys. 2020, 41, 16. [Google Scholar] [CrossRef] [Green Version]
- Glière, A.; Rouxel, J.; Brun, M.; Parvitte, B.; Zéninari, V.; Nicoletti, S. Challenges in the Design and Fabrication of a Lab-on-a-Chip Photoacoustic Gas Sensor. Sensors 2014, 14, 957–974. [Google Scholar] [CrossRef] [Green Version]
- Gorelik, A.V.; Ulasevich, A.L.; Kuz, A.A.; Starovoitov, V.S. A Miniature Prototype of a Resonance Photoacoustic Cell for Gas Sensing. Opt. Spectrosc. 2013, 115, 567–573. [Google Scholar] [CrossRef]
- Bauer, R.; Stewart, G.; Johnstone, W.; Boyd, E.; Lengden, M. 3D-printed miniature gas cell for photoacoustic spectroscopy of trace gases. Opt. Lett. 2014, 39, 4796–4799. [Google Scholar] [CrossRef] [Green Version]
- Rouxel, J.; Coutard, J.; Gidon, S.; Lartigue, O.; Nicoletti, S.; Parvitte, B.; Vallon, R.; Zéninari, V.; Glière, A. Miniaturized differential Helmholtz resonators for photoacoustic trace gas detection. Sens. Actuators B Chem. 2016, 236, 1104–1110. [Google Scholar] [CrossRef]
- Gorelik, A.V.; Ulasevich, A.L.; Nikonovich, F.N.; Zakharich, M.P.; Firago, V.A.; Kazak, N.S.; Starovoitov, V.S. Miniaturized resonant photoacoustic cell of inclined geometry for trace-gas detection. Appl. Phys. B 2010, 100, 283–289. [Google Scholar] [CrossRef] [Green Version]
- Holthoff, E.L.; Heaps, D.A.; Pellegrino, P.M. Development of a MEMS-Scale Photoacoustic Chemical Sensor Using a Quantum Cascade Laser. IEEE Sens. J. 2010, 10, 572–577. [Google Scholar] [CrossRef]
- Hippler, M.; Mohr, C.; Keen, K.A.; Mcnaghten, E.D. Cavity-enhanced resonant photoacoustic spectroscopy with optical feedback cw diode lasers: A novel technique for ultratrace gas analysis and high-resolution spectroscopy Cavity-enhanced resonant photoacoustic spectroscopy with optical analysis and high-r. J. Chem. Phys. 2010, 133, 044308. [Google Scholar] [CrossRef]
- Rossi, A.; Buffa, R.; Scotoni, M.; Bassi, D.; Iannotta, S.; Boschetti, A. Optical enhancement of diode laser- photoacoustic trace gas detection by means of external Fabry-Perot. Appl. Phys. Lett. 2005, 87, 041110. [Google Scholar] [CrossRef]
- Rey, J.M.; Marinov, D.; Vogler, D.E.; Sigrist, M.W. Investigation and optimisation of a multipass resonant photoacoustic cell at high absorption levels. Appl. Phys. B 2005, 80, 261–266. [Google Scholar] [CrossRef] [Green Version]
- Harren, F.J.M.; Bijnen, F.G.C.; Reuss, J.; Voesenek, L.A.C.J.; Blom, C.W.P.M. Sensitive intracavity photoacoustic measurements with a CO2 waveguide laser. Appl. Phys. B 1990, 50, 137–144. [Google Scholar] [CrossRef]
- Harren, F.J.M.; Berkelmans, R.; Kuiper, K.; te Lintel Hekkert, S.; Scheepers, P.; Dekhuijzen, R.; Hollander, P.; Parker, D.H. On-line laser photoacoustic detection of ethene in exhaled air as biomarker of ultraviolet radiation damage of the human skin. Appl. Phys. Lett. 1999, 74, 1761–1763. [Google Scholar] [CrossRef] [Green Version]
- Nägele, M.; Sigrist, M.W. Mobile laser spectrometer with novel resonant multipass photoacoustic cell for trace-gas sensing. Appl. Phys. B 2000, 70, 895–901. [Google Scholar] [CrossRef]
- Koch, K.P.; Lahmann, W. Optoacoustic detection of sulphur dioxide below the parts per billion level. Appl. Phys. Lett. 1978, 32, 289–291. [Google Scholar] [CrossRef]
- Sandfort, V.; Goldschmidt, J.; Wöllenstein, J.; Palzer, S. Cavity-Enhanced Raman Spectroscopy for Food Chain Management. Sensors 2018, 18, 709. [Google Scholar] [CrossRef] [PubMed] [Green Version]
- Niu, M.; Liu, Q.; Liu, K.; Yuan, Y.; Gao, X. Temperature-dependent characteristics of a photoacoustic detector. Optik 2013, 124, 2450–2454. [Google Scholar] [CrossRef]
- Szakáll, M.; Csikós, J.; Bozóki, Z.; Szabó, G. On the temperature dependent characteristics of a photoacoustic water vapor detector for airborne application. Infrared Phys. Technol. 2007, 51, 113–121. [Google Scholar] [CrossRef]
- Barreiro, N.; Peuriot, A.; Santiago, G.; Slezak, V. Water-based enhancement of the resonant photoacoustic signal from methane – air samples excited at 3.3 µm. Appl. Phys. B 2012, 108, 369–375. [Google Scholar] [CrossRef]
- Barreiro, N.; Vallespi, A.; Santiago, G.; Slezak, V.; Peuriot, A. Influence of oxygen on the resonant photoacoustic signal from methane excited at the ν 3 mode. Appl. Phys. B 2011, 104, 983–987. [Google Scholar] [CrossRef]
- Barreiro, N.; Peuriot, A.; Slezak, V.; Santiago, G. Vibrational Spectroscopy Study of the dependence of the photoacoustic signal amplitude from methane on different collisional partners. Vib. Spectrosc. 2013, 68, 158–161. [Google Scholar] [CrossRef]
- Pan, Y.; Dong, L.; Yin, X.; Wu, H. Compact and Highly Sensitive NO2 Photoacoustic Sensor for Environmental Monitoring. Molecules 2020, 25, 1201. [Google Scholar] [CrossRef] [Green Version]
- Rück, T.; Bierl, R.; Matysik, F. Physical Low-cost photoacoustic NO2 trace gas monitoring at the pptV-level. Sens. Actuators A Phys. 2017, 263, 501–509. [Google Scholar] [CrossRef]
- Gondal, M.A.; Dastageer, M.A. Design, fabrication, and optimization of photo acoustic gas sensor for the trace level detection of NO2 in the atmosphere. J. Environ. Sci. Heal. Part A 2010, 45, 1406–1412. [Google Scholar] [CrossRef]
- Kalkman, J.; van Kesteren, H.W. Relaxation effects and high sensitivity photoacoustic detection of NO2 with a blue laser diode. Appl. Phys. B 2008, 90, 197–200. [Google Scholar] [CrossRef]
- Lima, J.P.; Vargas, H.; Miklós, A.; Angelmahr, M.; Hess, P. Photoacoustic detection of NO2 and N2O using quantum cascade lasers. Appl. Phys. B 2006, 85, 279–284. [Google Scholar] [CrossRef]
- Yin, X.; Dong, L.; Wu, H.; Zheng, H.; Ma, W.; Zhang, L.; Yin, W.; Jia, S.; Tittel, F.K. Sub-ppb nitrogen dioxide detection with a large linear dynamic range by use of a differential photoacoustic cell and a 3.5 W blue multimode diode laser. Sens. Actuators B Chem. 2017, 247, 329–335. [Google Scholar] [CrossRef] [Green Version]
- Bernhardt, R.; Santiago, G.D.; Slezak, V.B.; Peuriot, A.; González, M.G. Differential, LED-excited, resonant NO2 photoacoustic system. Sens. Actuatorsb Chem. 2010, 150, 513–516. [Google Scholar] [CrossRef]
- González, M.; Santiago, G.; Slezak, V.; Peuriot, A. Novel optical method for background reduction in resonant photoacoustics. Rev. Sci. Instrum. 2007, 78, 084903. [Google Scholar] [CrossRef] [PubMed]
- Kapp, J.; Weber, C.; Schmitt, K.; Pernau, H.-F.; Wöllenstein, J. Resonant Photoacoustic Spectroscopy of NO2 with a UV-LED Based Sensor. Sensors 2019, 19, 724. [Google Scholar] [CrossRef] [Green Version]
- Santiago, G.D.; González, M.G.; Peuriot, A.L.; González, F.; Slezak, V.B. Blue light-emitting diode-based, enhanced resonant excitation of longitudinal acoustic modes in a closed pipe with application to NO2. Rev. Sci. Instrum. 2006, 77, 023108. [Google Scholar] [CrossRef]
- Saarela, J.; Sorvajärvi, T.; Laurila, T.; Toivonen, J. Phase-sensitive method for background-compensated photoacoustic detection of NO2 using high-power LEDs. Opt. Express 2011, 19, A725–A732. [Google Scholar] [CrossRef]
- Linhares, F.G.; Lima, M.A.; Mothe, G.A.; de Castro, M.P.P.; Silva, M.G.; Sthel, M.S. Photoacoustic spectroscopy for detection of N2O emitted from combustion of diesel/beef tallow biodiesel/sugarcane diesel and diesel/beef tallow biodiesel blends. Biomass Convers. Biorefinery 2019, 9, 577–583. [Google Scholar] [CrossRef]
- Da Silva, M.G.; Miklós, A.; Falkenroth, A.; Hess, P. Photoacoustic measurement of N2O concentrations in ambient air with a pulsed optical parametric oscillator. Appl. Phys. B 2006, 82, 329–336. [Google Scholar] [CrossRef]
- Wu, H.; Yin, X.; Dong, L.; Jia, Z.; Zhang, J.; Liu, F.; Ma, W.; Zhang, L.; Yin, W.; Xiao, L.; et al. Ppb-level nitric oxide photoacoustic sensor based on a mid-IR quantum cascade laser operating at 52 °C. Sens. Actuators B Chem. 2019, 290, 426–433. [Google Scholar] [CrossRef]
- Gondal, M.A.; Khalil, A.A.I.; Al-Suliman, N. High sensitive detection of nitric oxide using laser induced photoacoustic spectroscopy at 213 nm. Appl. Opt. 2012, 51, 5724–5734. [Google Scholar] [CrossRef]
- Baptista-Filho, M.; Gonc, H.; Gomes, M.; Luna, F.J.; Werneck, C.G.; Rech, I.; Carlos, J.; Bezerra, M.; Monte, M.; Souza-barros, F.; et al. Ammonia traces detection based on photoacoustic spectroscopy for evaluating ammonia volatization from natural zeolites at typical crop field temperature. Sens. Actuators B Chem. 2011, 158, 241–245. [Google Scholar] [CrossRef] [Green Version]
- Baptista-Filho, M.; da Silva, M.G.; Sthel, M.S.; Schramm, D.U.; Vargas, H.; Miklós, A.; Hess, P. Ammonia detection by using quantum-cascade laser photoacoustic spectroscopy. Appl. Opt. 2006, 45, 4966–4971. [Google Scholar] [CrossRef]
- Paldus, B.A.; Spence, T.G.; Zare, R.N.; Oomens, J.; Harren, F.J.M.; Parker, D.H.; Gmachl, C.; Cappasso, F.; Sivco, D.L.; Baillargeon, J.N.; et al. Photoacoustic spectroscopy using quantum-cascade lasers. Opt. Lett. 1999, 24, 178–180. [Google Scholar] [CrossRef] [PubMed] [Green Version]
- Ulasevich, A.L.; Gorelik, A.V.; Kouzmouk, A.A.; Starovoitov, V.S. A compact resonant P -shaped photoacoustic cell with low window background for gas sensing. Appl. Phys. B 2014, 117, 549–561. [Google Scholar] [CrossRef]
- Pushkarsky, M.B.; Webber, M.E.; Patel, C.K.N. Ultra-sensitive ambient ammonia detection using CO2-laser-based photoacoustic. Appl. Phys. B 2003, 77, 381–385. [Google Scholar] [CrossRef]
- Bonilla-Manrique, O.E.; Posada-Roman, J.E.; Garcia-Souto, J.A.; Ruiz-Llata, M. Sub-ppm-Level Ammonia Detection Using Photoacoustic Spectroscopy with an Optical Microphone Based on a Phase Interferometer. Sensors 2019, 19, 2890. [Google Scholar] [CrossRef] [PubMed] [Green Version]
- Qiao, S.; Qu, Y.; Ma, Y.; He, Y.; Wang, Y.; Hu, Y.; Yu, X.; Zhang, Z.; Tittel, F.K. A Sensitive Carbon Dioxide Sensor Based on Photoacoustic Spectroscopy with a Fixed Wavelength Quantum Cascade Laser. Sensors 2019, 19, 4187. [Google Scholar] [CrossRef] [Green Version]
- Dumitras, D.C.; Banita, S.; Bratu, A.M.; Cernat, R.; Dutu, D.C.A.; Matei, C.; Patachia, M.; Petrus, M.; Popa, C. Infrared Physics & Technology Ultrasensitive CO2 laser photoacoustic system. Infrared Phys. Technol. 2010, 53, 308–314. [Google Scholar]
- Alahmari, S.; Kang, X.; Hippler, M. Diode laser photoacoustic spectroscopy of CO2, H2S and O2 in a differential Helmholtz resonator for trace gas analysis in the biosciences and petrochemistry. Anal. Bioanal. Chem. 2019, 411, 3777–3787. [Google Scholar] [CrossRef] [Green Version]
- Reed, Z.D.; Sperling, B.; van Zee, R.D.; Hodges, J.T.; Gillis, L.A.; Hodges, J.T. Photoacoustic spectrometer for accurate, continuous measurements of atmospheric carbon dioxide concentration. Appl. Phys. B 2014, 117, 645–657. [Google Scholar] [CrossRef]
- Liu, K.; Mei, J.; Zhang, W.; Chen, W.; Gao, X. Multi-resonator photoacoustic spectroscopy. Sens. Actuators B Chem. 2017, 251, 632–636. [Google Scholar] [CrossRef]
- Hanyecz, V.; Mohácsi, Á.; Pogány, A.; Varga, A.; Bozoki, Z.; Kovács, I.; Szabó, G. Multi-component photoacoustic gas analyzer for industrial applications. Vib. Spectrosc. 2010, 52, 63–68. [Google Scholar] [CrossRef]
- Miklós, A.; Pei, S.-C.; Kung, A.H. Multipass acoustically open photoacoustic detector for trace gas measurements. Appl. Opt. 2006, 45, 2529–2534. [Google Scholar] [CrossRef] [PubMed] [Green Version]
- Bonilla-Manrique, O.E.; Moser, H.; Martín-Mateos, P.; Lendl, B.; Ruiz-Llata, M. Hydrogen Sulfide Detection in the Midinfrared Using a 3D-Printed Resonant Gas Cell. J. Sens. 2019, 2019, 6437431. [Google Scholar] [CrossRef] [Green Version]
- Varga, A.; Bozóki, Z.; Szakáll, M.; Szabó, G. Photoacoustic system for on-line process monitoring of hydrogen sulfide (H2S) concentration in natural gas streams. Appl. Phys. B Lasers Opt. 2006, 85, 315–321. [Google Scholar] [CrossRef]
- Szabó, A.; Mohácsi, A.; Gulyás, G.; Bozóki, Z.; Szabó, G. In situ and wide range quantification of hydrogen sulfide in industrial gases by means of photoacoustic spectroscopy. Meas. Sci. Technol. 2013, 24, 065501. [Google Scholar] [CrossRef]
- Yin, X.; Dong, L.; Wu, H.; Ma, W.; Zhang, L.; Yin, W.; Xiao, L.; Jia, S.; Tittel, F.K. Ppb-level H2S detection for SF 6 decomposition based on a fiber-amplified telecommunication diode laser and a background-gas-induced high-Q photoacoustic cell. Appl. Phys. Lett. 2017, 111, 031109. [Google Scholar] [CrossRef] [Green Version]
- Starovoitov, V.S.; Kischkat, J.F.; Semtsiv, M.P.; Masselink, W.T. Intracavity photoacoustic sensing of water vapor with a continuously tunable external-cavity quantum-cascade laser operating near 5.5 μm. Opt. Lett. 2016, 41, 4955–4958. [Google Scholar] [CrossRef]
- Bozókia, Z.; Szakáll, M.; Mohácsi, Á.; Szabó, G.; Bor, Z. Diode laser based photoacoustic humidity sensors. Sens. Actuators B Chem. 2003, 91, 219–226. [Google Scholar] [CrossRef]
- Rey, J.M.; Romer, C.; Gianella, M.; Sigrist, M.W. Near-infrared resonant photoacoustic gas measurement using simultaneous dual-frequency excitation. Appl. Phys. B Lasers Opt. 2010, 100, 189–194. [Google Scholar] [CrossRef] [Green Version]
- Teodoro, C.G.; Schramm, D.U.; Sthel, M.S.; Lima, G.R.; Rocha, M.V.; Tavares, J.R.; Vargas, H. CO2 laser photoacoustic detection of ethylene emitted by diesel engines used in urban public transports. Infrared Phys. Technol. 2010, 53, 151–155. [Google Scholar] [CrossRef]
- Chen, K.; Gong, Z.; Yu, Q. Fiber-amplifier-enhanced resonant photoacoustic sensor for sub-ppb level acetylene detection. Sens. Actuators A Phys. 2018, 274, 184–188. [Google Scholar] [CrossRef]
- Chen, K.; Deng, H.; Guo, M.; Luo, C.; Liu, S.; Zhang, B.; Ma, F.; Zhu, F.; Gong, Z.; Peng, W.; et al. Tube-cantilever double resonance enhanced fiber-optic photoacoustic spectrometer. Opt. Laser Technol. 2020, 123, 105894. [Google Scholar] [CrossRef]
- Grossel, A.; Zeninari, V.; Joly, L.; Parvitte, B.; Courtois, D.; Durry, G. New improvements in methane detection using a Helmholtz resonant photoacoustic laser sensor: A comparison between near-IR diode lasers and mid-IR quantum cascade lasers. Spectrochim. Acta Part A Mol. Biomol. Spectrosc. 2006, 63, 1021–1028. [Google Scholar] [CrossRef] [PubMed]
- Zeninari, V.; Vallon, R.; Risser, C.; Parvitte, B. Photoacoustic Detection of Methane in Large Concentrations with a Helmholtz Sensor: Simulation and Experimentation. Int. J. Thermophys. 2016, 37, 7. [Google Scholar] [CrossRef]
- Rocha, M.V.; Sthel, M.S.; Silva, M.G.; Paiva, L.B.; Pinheiro, F.W.; Miklòs, A.; Vargas, H. Quantum-cascade laser photoacoustic detection of methane emitted from natural gas powered engines. Appl. Phys. B 2012, 106, 701–706. [Google Scholar] [CrossRef]
- Besson, J.; Schilt, S.; Thévenaz, L. Multi-gas sensing based on photoacoustic spectroscopy using tunable laser diodes. Spectrochim. Acta Part A 2004, 60, 3449–3456. [Google Scholar] [CrossRef]
- Miklós, A.; Lim, C.-H.; Hsiang, W.-W.; Liang, G.-C.; Kung, A.H.; Schmohl, A.; Hess, P. Photoacoustic measurement of methane concentrations with a compact pulsed optical parametric oscillator. Appl. Opt. 2002, 41, 2985–2993. [Google Scholar] [CrossRef] [Green Version]
- Da Silva, M.G.; Vargas, H.; Miklós, A.; Hess, P. Photoacoustic detection of ozone using a quantum cascade laser. Appl. Phys. B 2004, 78, 677–680. [Google Scholar] [CrossRef]
- Ajtai, T.; Filep, Á.; Varga, A.; Motika, G.; Szabó, G. Ozone concentration-monitoring photoacoustic system based on a frequency-quadrupled Nd: YAG laser. Appl. Phys. B 2010, 101, 403–409. [Google Scholar] [CrossRef]
- Besson, J.-P.; Schilt, S.; Thévenaz, L. Molecular relaxation effects in hydrogen chloride photoacoustic detection. Appl. Phys. B 2008, 90, 191–196. [Google Scholar] [CrossRef] [Green Version]
- Vogel, M.; Mooser, C.; Karrai, K.; Warburton, R.J. Optically tunable mechanics of microlevers. Appl. Phys. Lett. 2003, 83, 1337–1339. [Google Scholar] [CrossRef]
- Forrer, M.P. A Flexure-Mode Quartz for an Electronic Wrist-Watch. In Proceedings of the 23rd Annual Symposium on Frequency Control, Atlantic City, NJ, USA, 6–8 May 1969; pp. 157–162. [Google Scholar]
- Edwards, H.; Taylor, L.; Duncan, W.; Melmed, A.J. Fast, high-resolution atomic force microscopy using a quartz tuning fork as actuator and sensor. J. Appl. Phys. 1997, 82, 980–984. [Google Scholar] [CrossRef] [Green Version]
- Kosterev, A.A.; Bakhirkin, Y.A.; Curl, R.F.; Tittel, F.K. Quartz-enhanced photoacoustic spectroscopy. Opt. Lett. 2002, 27, 1902–1904. [Google Scholar] [CrossRef] [Green Version]
- Patimisco, P.; Scamarcio, G.; Tittel, F.K.; Spagnolo, V. Quartz-enhanced photoacoustic spectroscopy: A review. Sensors 2014, 14, 6165–6206. [Google Scholar] [CrossRef] [Green Version]
- Ma, Y. Review of Recent Advances in QEPAS-Based Trace Gas Sensing. Appl. Sci. 2018, 8, 1822. [Google Scholar] [CrossRef] [Green Version]
- Patimisco, P.; Sampaolo, A.; Dong, L.; Tittel, F.K.; Spagnolo, V. Recent advances in quartz enhanced photoacoustic sensing. Appl. Phys. Rev. 2018, 5, 011106. [Google Scholar] [CrossRef]
- Patimisco, P.; Sampaolo, A.; Zheng, H.; Dong, L.; Tittel, F.K.; Spagnolo, V. Quart—Enhanced photoacoustic spectrophones exploiting custom tuning forks: A review. Adv. Phys. X 2017, 2, 169–187. [Google Scholar]
- Ma, Y.; Qiao, S.; Patimisco, P.; Sampaolo, A.; Wang, Y.; Tittel, F.K.; Spagnolo, V. In-plane quartz-enhanced photoacoustic spectroscopy. Appl. Phys. Lett. 2020, 116, 61101. [Google Scholar] [CrossRef]
- Zheng, H.; Dong, L.; Sampaolo, A.; Wu, H.; Patimisco, P.; Yin, X.; Ma, W.; Zhang, L.; Yin, W.; Spagnolo, V.; et al. Single-tube on-beam quartz-enhanced photoacoustic spectroscopy. Opt. Lett. 2016, 41, 978–981. [Google Scholar] [CrossRef] [PubMed]
- Elefante, A.; Giglio, M.; Sampaolo, A.; Menduni, G.; Patimisco, P.; Passaro, V.M.N.; Wu, H.; Rossmadl, H.; Mackowiak, V.; Cable, A.; et al. Dual-Gas Quartz-Enhanced Photoacoustic Sensor for Simultaneous Detection of Methane/Nitrous Oxide and Water Vapor. Anal. Chem. 2019, 91, 12866–12873. [Google Scholar] [CrossRef] [PubMed]
- Wu, H.; Yin, X.; Dong, L.; Pei, K.; Sampaolo, A.; Patimisco, P.; Zheng, H.; Ma, W.; Zhang, L.; Yin, W.; et al. Simultaneous dual-gas QEPAS detection based on a fundamental and overtone combined vibration of quartz tuning fork. Appl. Phys. Lett. 2017, 110, 121104. [Google Scholar] [CrossRef] [Green Version]
- De Cumis, M.S.; Viciani, S.; Borri, S.; Patimisco, P.; Sampaolo, A.; Scamarcio, G.; De Natale, P.; D’Amato, F.; Spagnolo, V. Widely-tunable mid-infrared fiber-coupled quartz-enhanced photoacoustic sensor for environmental monitoring. Opt. Express 2014, 22, 28222–28231. [Google Scholar] [CrossRef] [Green Version]
- Ma, Y.; Tong, Y.; He, Y.; Jin, X.; Tittel, F.K. Compact and sensitive mid-infrared all-fiber quartz-enhanced photoacoustic spectroscopy sensor for carbon monoxide detection. Opt. Express 2019, 27, 9302–9312. [Google Scholar] [CrossRef]
- Mordmueller, M.; Schade, W.; Willer, U. QEPAS with electrical co-excitation for photoacoustic measurements in fluctuating background gases. Appl. Phys. B 2017, 123, 224. [Google Scholar] [CrossRef]
- Wu, H.; Dong, L.; Zheng, H.; Yu, Y.; Ma, W.; Zhang, L.; Yin, W.; Xiao, L.; Jia, S.; Tittel, F.K. Beat frequency quartz-enhanced photoacoustic spectroscopy for fast and calibration-free continuous trace-gas monitoring. Nat. Commun. 2017, 8, 15331. [Google Scholar] [CrossRef] [Green Version]
- Peltola, J.; Vainio, M.; Hieta, T.; Uotila, J.; Sinisalo, S.; Metsälä, M.; Siltanen, M.; Halonen, L. High sensitivity trace gas detection by cantilever-enhanced photoacoustic spectroscopy using a mid-infrared continuous-wave optical parametric oscillator. Opt. Express 2013, 21, 10240–10250. [Google Scholar] [CrossRef]
- Peltola, J.; Hieta, T.; Vainio, M. Parts-per-trillion-level detection of nitrogen dioxide by cantilever-enhanced photo-acoustic spectroscopy. Opt. Lett. 2015, 40, 2933–2936. [Google Scholar] [CrossRef]
- Zheng, H.; Dong, L.; Ma, Y.; Wu, H.; Liu, X.; Yin, X.; Zhang, L.; Ma, W.; Yin, W.; Xiao, L.; et al. Scattered light modulation cancellation method for sub-ppb-level NO2 detection in a LD-excited QEPAS system. Opt. Express 2016, 24, A752–A761. [Google Scholar] [CrossRef]
- Rück, T.; Bierl, R.; Matysik, F.-M. NO2 trace gas monitoring in air using off-beam quartz enhanced photoacoustic spectroscopy (QEPAS) and interference studies towards CO2, H2O and acoustic noise. Sens. Actuators B Chem. 2018, 255, 2462–2471. [Google Scholar] [CrossRef]
- Zheng, H.; Dong, L.; Yin, X.; Liu, X.; Wu, H.; Zhang, L.; Ma, W.; Yin, W.; Jia, S. Ppb-level QEPAS NO2 sensor by use of electrical modulation cancellation method with a high power blue LED. Sens. Actuators B Chem. 2015, 208, 173–179. [Google Scholar] [CrossRef]
- Jahjah, M.; Ren, W.; Stefański, P.; Lewicki, R.; Zhang, J.; Jiang, W.; Tarka, J.; Tittel, F.K. A compact QCL based methane and nitrous oxide sensor for environmental and medical applications. Analyst 2014, 139, 2065–2069. [Google Scholar] [CrossRef] [PubMed]
- Ma, Y.; Lewicki, R.; Razeghi, M.; Tittel, F.K. QEPAS based ppb-level detection of CO and N2O using a high power CW DFB-QCL. Opt. Express 2013, 21, 1008–1019. [Google Scholar] [CrossRef] [PubMed] [Green Version]
- Dong, L.; Spagnolo, V.; Lewicki, R.; Tittel, F.K. Ppb-level detection of nitric oxide using an external cavity quantum cascade laser based QEPAS sensor. Opt. Express 2011, 19, 24037–24045. [Google Scholar] [CrossRef]
- Lewicki, R.; Wysocki, G.; Kosterev, A.A.; Tittel, F.K. Carbon dioxide and ammonia detection using 2 μm diode laser based quartz-enhanced photoacoustic spectroscopy. Appl. Phys. B 2007, 87, 157–162. [Google Scholar] [CrossRef]
- Wu, H.; Dong, L.; Liu, X.; Zheng, H.; Yin, X.; Ma, W.; Zhang, L.; Yin, W.; Jia, S. Fiber-Amplifier-Enhanced QEPAS Sensor for Simultaneous Trace Gas Detection of NH3 and H2S. Sensors 2015, 15, 26743–26755. [Google Scholar] [CrossRef] [Green Version]
- Zheng, H.; Dong, L.; Liu, X.; Liu, Y.; Wu, H.; Ma, W.; Zhang, L.; Yin, W.; Jia, S. Near-IR telecommunication diode laser based double-pass QEPAS sensor for atmospheric CO2 detection. Laser Phys. 2015, 25, 125601. [Google Scholar] [CrossRef]
- Wysocki, G.; Kosterev, A.A.; Tittel, F.K. Influence of molecular relaxation dynamics on quartz-enhanced photoacoustic detection of CO2 at λ = 2 μm. Appl. Phys. B 2006, 85, 301–306. [Google Scholar] [CrossRef]
- Wang, Z.; Wang, Q.; Ching, J.Y.-L.; Wu, J.C.-Y.; Zhang, G.; Ren, W. A portable low-power QEPAS-based CO2 isotope sensor using a fiber-coupled interband cascade laser. Sens. Actuators B Chem. 2017, 246, 710–715. [Google Scholar] [CrossRef]
- Patimisco, P.; Borri, S.; Galli, I.; Mazzotti, D.; Giusfredi, G.; Akikusa, N.; Yamanishi, M.; Scamarcio, G.; De Natale, P.; Spagnolo, V. High finesse optical cavity coupled with a quartz-enhanced photoacoustic spectroscopic sensor. Analyst 2015, 140, 736–743. [Google Scholar] [CrossRef] [PubMed]
- Kuusela, T.; Peura, J.; Matveev, B.A.; Remennyy, M.A.; Stus’, N.M. Photoacoustic gas detection using a cantilever microphone and III-V mid-IR LEDs. Vib. Spectrosc. 2009, 51, 289–293. [Google Scholar] [CrossRef]
- Koskinen, V.; Fonsen, J.; Roth, K.; Kauppinen, J. Cantilever enhanced photoacoustic detection of carbon dioxide using a tunable diode laser source. Appl. Phys. B 2007, 86, 451–454. [Google Scholar] [CrossRef]
- Helman, M.; Moser, H.; Dudkowiak, A.; Lendl, B. Off-beam quartz-enhanced photoacoustic spectroscopy-based sensor for hydrogen sulfide trace gas detection using a mode-hop-free external cavity quantum cascade laser. Appl. Phys. B 2017, 123, 141. [Google Scholar] [CrossRef] [Green Version]
- Wu, H.; Sampaolo, A.; Dong, L.; Patimisco, P.; Liu, X.; Zheng, H.; Yin, X.; Ma, W.; Zhang, L.; Yin, W.; et al. Quartz enhanced photoacoustic H2S gas sensor based on a fiber-amplifier source and a custom tuning fork with large prong spacing. Appl. Phys. Lett. 2015, 107, 111104. [Google Scholar] [CrossRef] [Green Version]
- Spagnolo, V.; Patimisco, P.; Pennetta, R.; Sampaolo, A.; Scamarcio, G.; Vitiello, M.S.; Tittel, F.K. THz Quartz-enhanced photoacoustic sensor for H2S trace gas detection. Opt. Express 2015, 23, 7574–7582. [Google Scholar] [CrossRef] [Green Version]
- Ma, Y.; He, Y.; Yu, X.; Zhang, J.; Sun, R.; Tittel, F.K. Compact all-fiber quartz-enhanced photoacoustic spectroscopy sensor with a 30.72 kHz quartz tuning fork and spatially resolved trace gas detection. Appl. Phys. Lett. 2016, 108, 091115. [Google Scholar] [CrossRef] [Green Version]
- Ma, Y.; Tong, Y.; He, Y.; Long, J.-H.; Yu, X. Quartz-Enhanced Photoacoustic Spectroscopy Sensor with a Small-Gap Quartz Tuning Fork. Sensors 2018, 18, 2047. [Google Scholar] [CrossRef] [Green Version]
- Yang, X.; Xiao, Y.; Ma, Y.; He, Y.; Tittel, F.K. A Miniaturized QEPAS Trace Gas Sensor with a 3D-Printed Acoustic Detection Module. Sensors 2017, 17, 1750. [Google Scholar] [CrossRef] [Green Version]
- Zhang, Q.; Chang, J.; Cong, Z.; Feng, Y.; Wang, Z.; Sun, J. Scanned-wavelength intra-cavity QEPAS sensor with injection seeding technique for C2H2 detection. Opt. Laser Technol. 2019, 120, 105751. [Google Scholar] [CrossRef]
- Cao, Y.; Jin, W.; Ho, H.L.; Qi, L.; Yang, Y.H. Acetylene detection based on diode laser QEPAS: Combined wavelength and residual amplitude modulation. Appl. Phys. B 2012, 109, 359–366. [Google Scholar] [CrossRef]
- Wu, H.; Dong, L.; Yin, X.; Sampaolo, A.; Patimisco, P.; Ma, W.; Zhang, L.; Yin, W.; Xiao, L.; Spagnolo, V.; et al. Atmospheric CH4 measurement near a landfill using an ICL-based QEPAS sensor with V-T relaxation self-calibration. Sens. Actuators B Chem. 2019, 297, 126753. [Google Scholar] [CrossRef]
- Böttger, S.; Köhring, M.; Willer, M.; Schade, W. Off-beam quartz-enhanced photoacoustic spectroscopy with LEDs. Appl. Phys. B 2013, 113, 227–232. [Google Scholar] [CrossRef]
- Ma, Y.; He, Y.; Yu, X.; Chen, C.; Sun, R.; Tittel, F.K. HCl ppb-level detection based on QEPAS sensor using a low resonance frequency quartz tuning fork. Sens. Actuators B Chem. 2016, 233, 388–393. [Google Scholar] [CrossRef] [Green Version]
- Giglio, M.; Elefante, A.; Patimisco, P.; Sampaolo, A.; Sgobba, F.; Rossmadl, H.; Mackowiak, V.; Wu, H.; Tittel, F.K.; Dong, L.; et al. Quartz-enhanced photoacoustic sensor for ethylene detection implementing optimized custom tuning fork-based spectrophone. Opt. Express 2019, 27, 4271–4280. [Google Scholar] [CrossRef] [PubMed]
- Wang, Z.; Geng, J.; Ren, W. Quartz-Enhanced Photoacoustic Spectroscopy (QEPAS) Detection of the ν7 Band of Ethylene at Low Pressure with CO2 Interference Analysis. Appl. Spectrosc. 2017, 71, 1834–1841. [Google Scholar] [CrossRef] [PubMed]
- Harren, F.J.M.; Reuss, J.; Woltering, E.J.; Bicanic, D.D. Photoacoustic Measurements of Agriculturally Interesting Gases and Detection of C2H4 below the PPB Level. Appl. Spectrosc. 1990, 44, 1360–1368. [Google Scholar] [CrossRef]
- Rousseau, R.; Loghmari, Z.; Bahriz, M.; Chamassi, K.; Teissier, R.; Baranov, A.N.; Vicet, A. Off-beam QEPAS sensor using an 11 µm DFB-QCL with an optimized acoustic resonator. Opt. Express 2019, 27, 7435–7446. [Google Scholar] [CrossRef]
Figure 1.
Simplified schematic depiction of the most relevant processes for photoacoustic signal generation. Intensity modulation of radiation excites internal molecular states. Due to non-radiative relaxation processes, part of the photon energy is converted into heat, leading to a local increase in temperature and pressure. Periodic light modulation thus leads to a pressure wave that may be detected using suitable transducer elements.

Figure 2.
A schematic to compare the most basic direct (bottom) and indirect (top) photoacoustic spectroscopy setups. (Top-left) A photoacoustic detector is employed to determine the light intensity. The sensitivity is adjusted via the optical path length l and the detected acoustic signal diminished with an increasing number density of the gas to be detected (top-right). (Bottom-left) The sensitivity may be adjusted via the optical power P0 employed to excite the molecules. The acoustic signal increases with an increasing number density of the target gas (bottom-right).

Figure 3.
Comparison between a nowadays commonly used NDIR setup (top) and the URAS setup (bottom). (Top) Two detectors with different spectral response functions act as a measurement and reference channel, respectively. (Bottom) The URAS detector consists of two chambers filled with the gas to be detected and connected via a membrane. The optical path is divided into a reference part with a fixed gas composition and a measurement part containing the analyte.

Figure 4.
A schematic not-to-scale depiction of various basic setups for photoacoustic spectroscopy with different degrees of complexity. (a) The most basic setup is popular with several commercial manufacturers for its simplicity: A modulated light source generates an intermittent light beam, which in turn generates a photoacoustic signal. The amplitude of the sound wave is measured using a sound transducer, (b) Acoustic resonators are used to enhance the generated acoustic wave, (c) A quartz tuning fork (QTF) may serve as a low-cost narrow bandwidth resonator, (d,e) To increase the available optical power, an optical resonator or multi-pass cells may serve to multiply the photoacoustic signal.


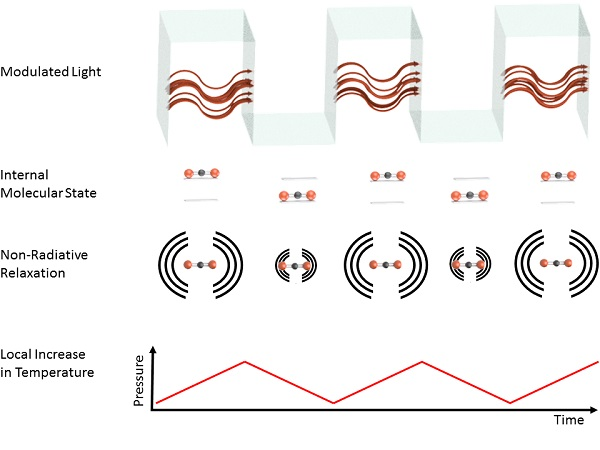
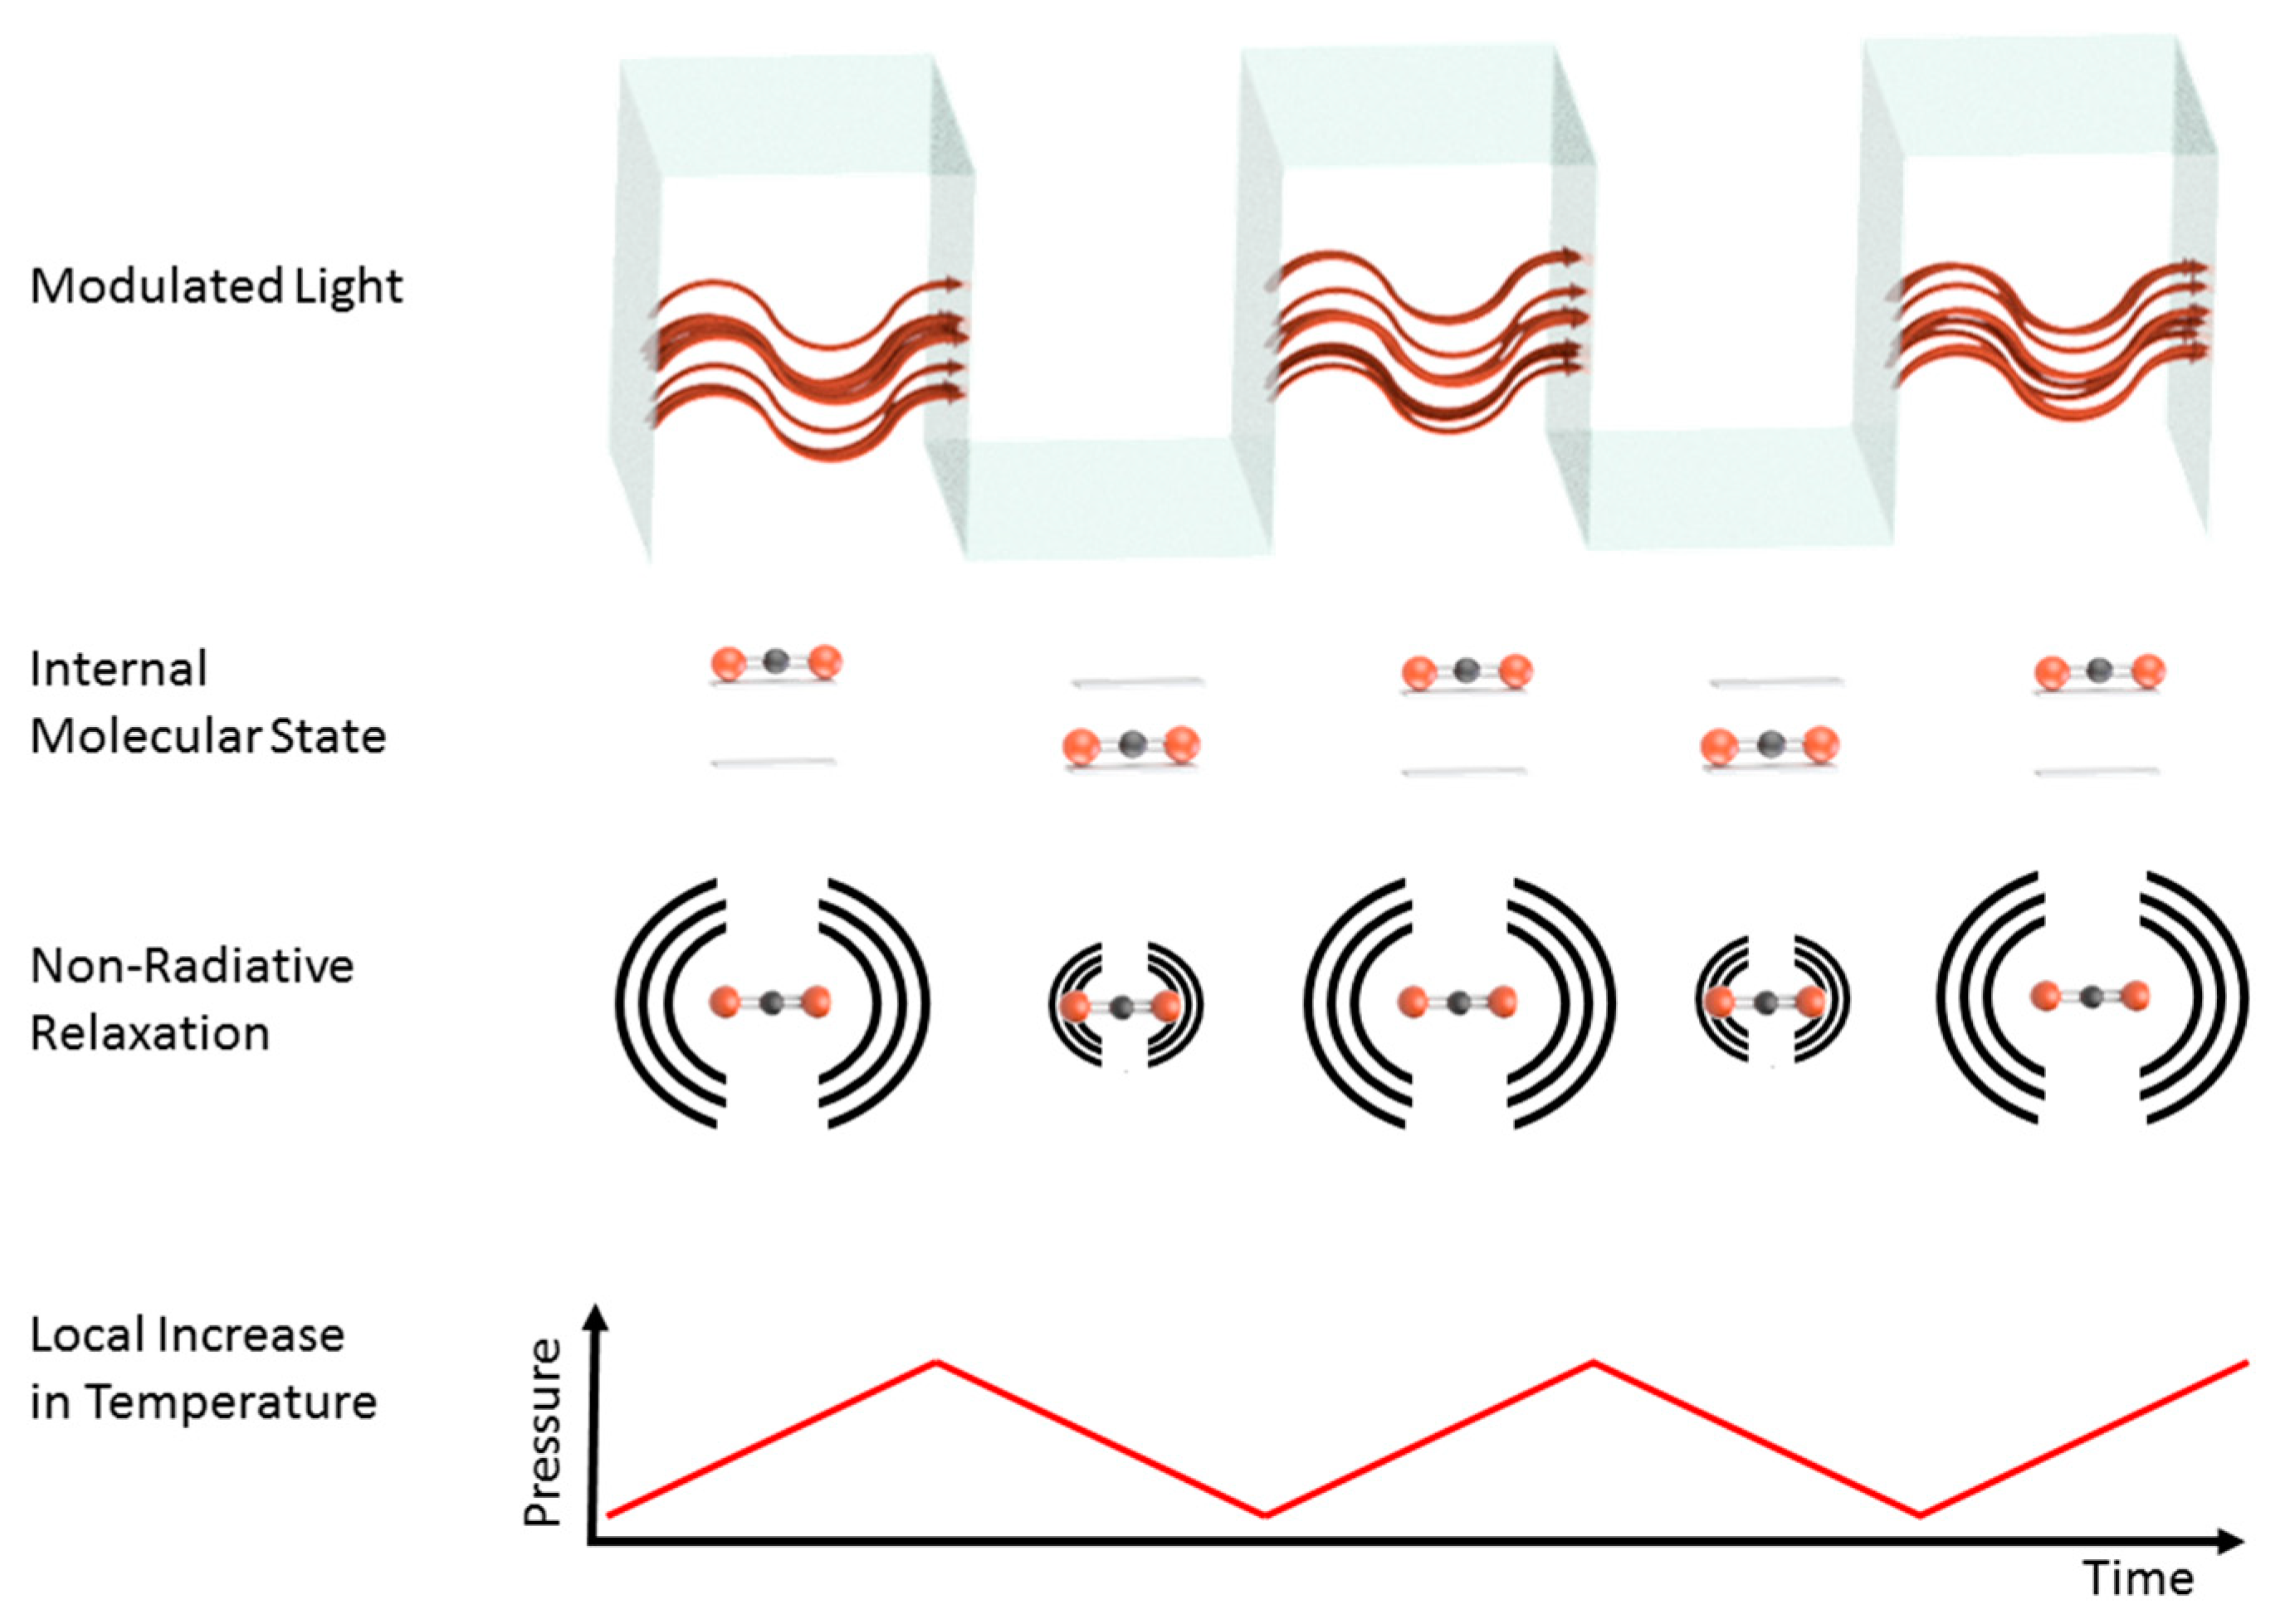
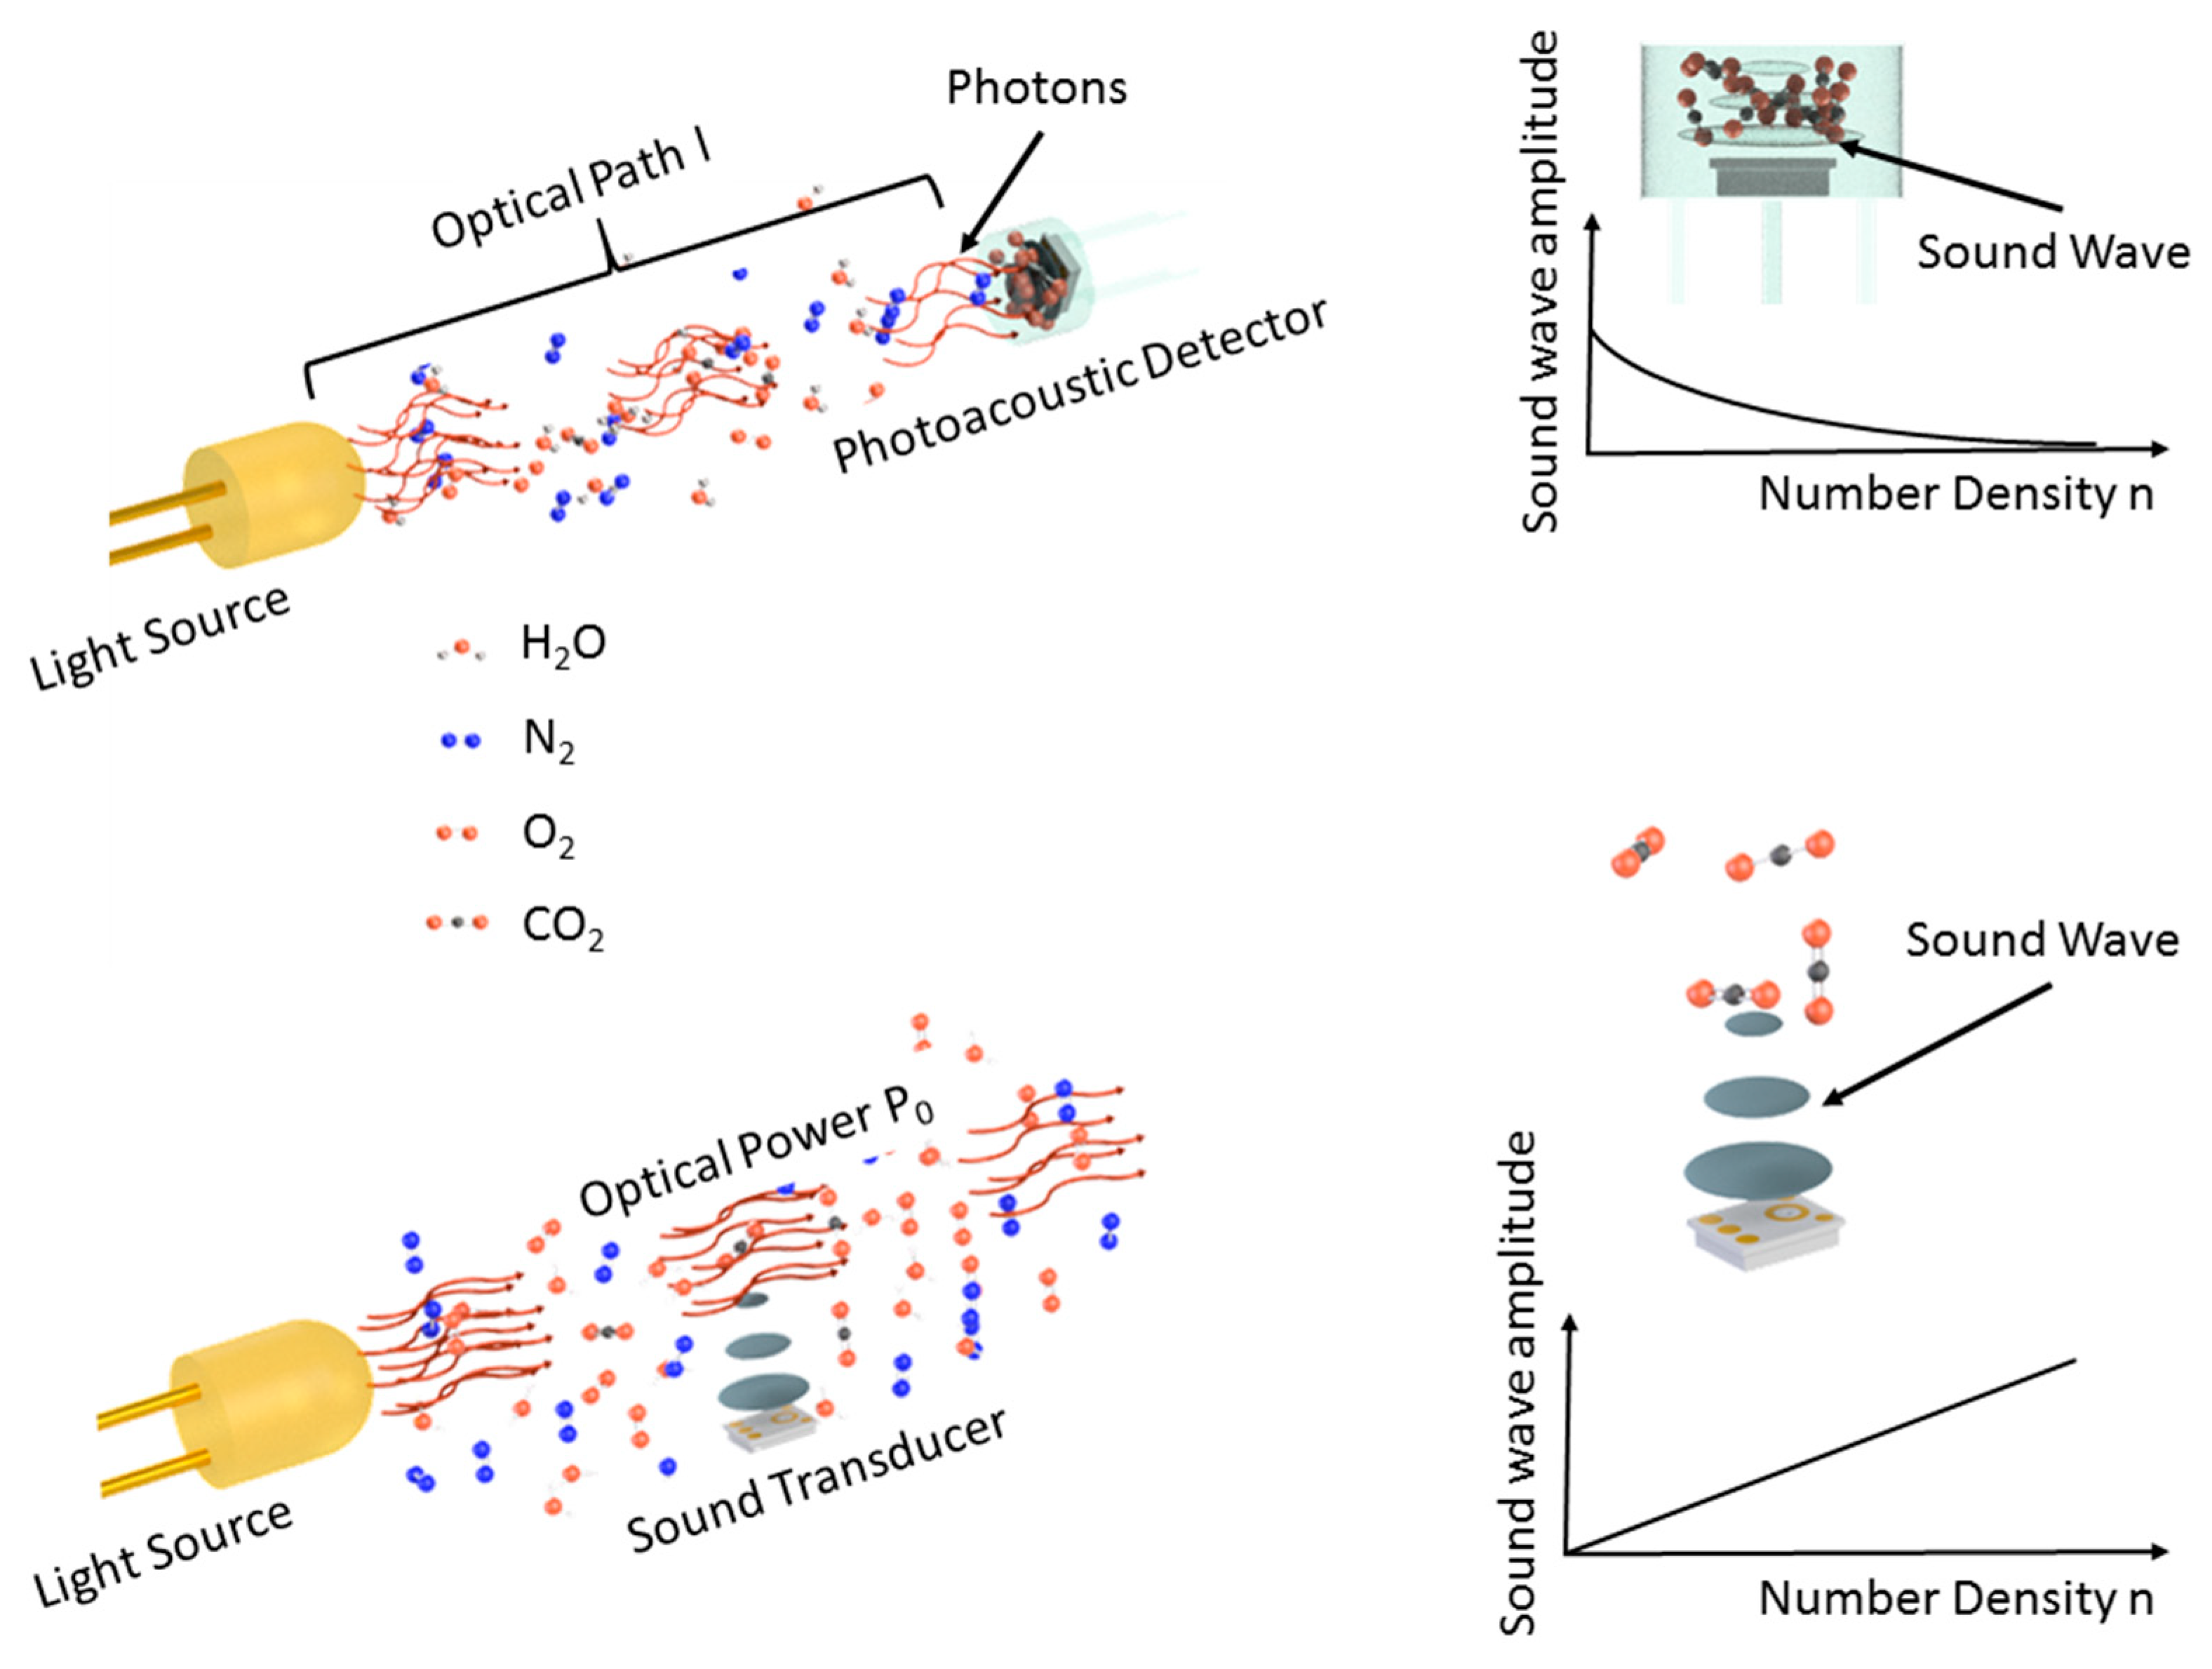
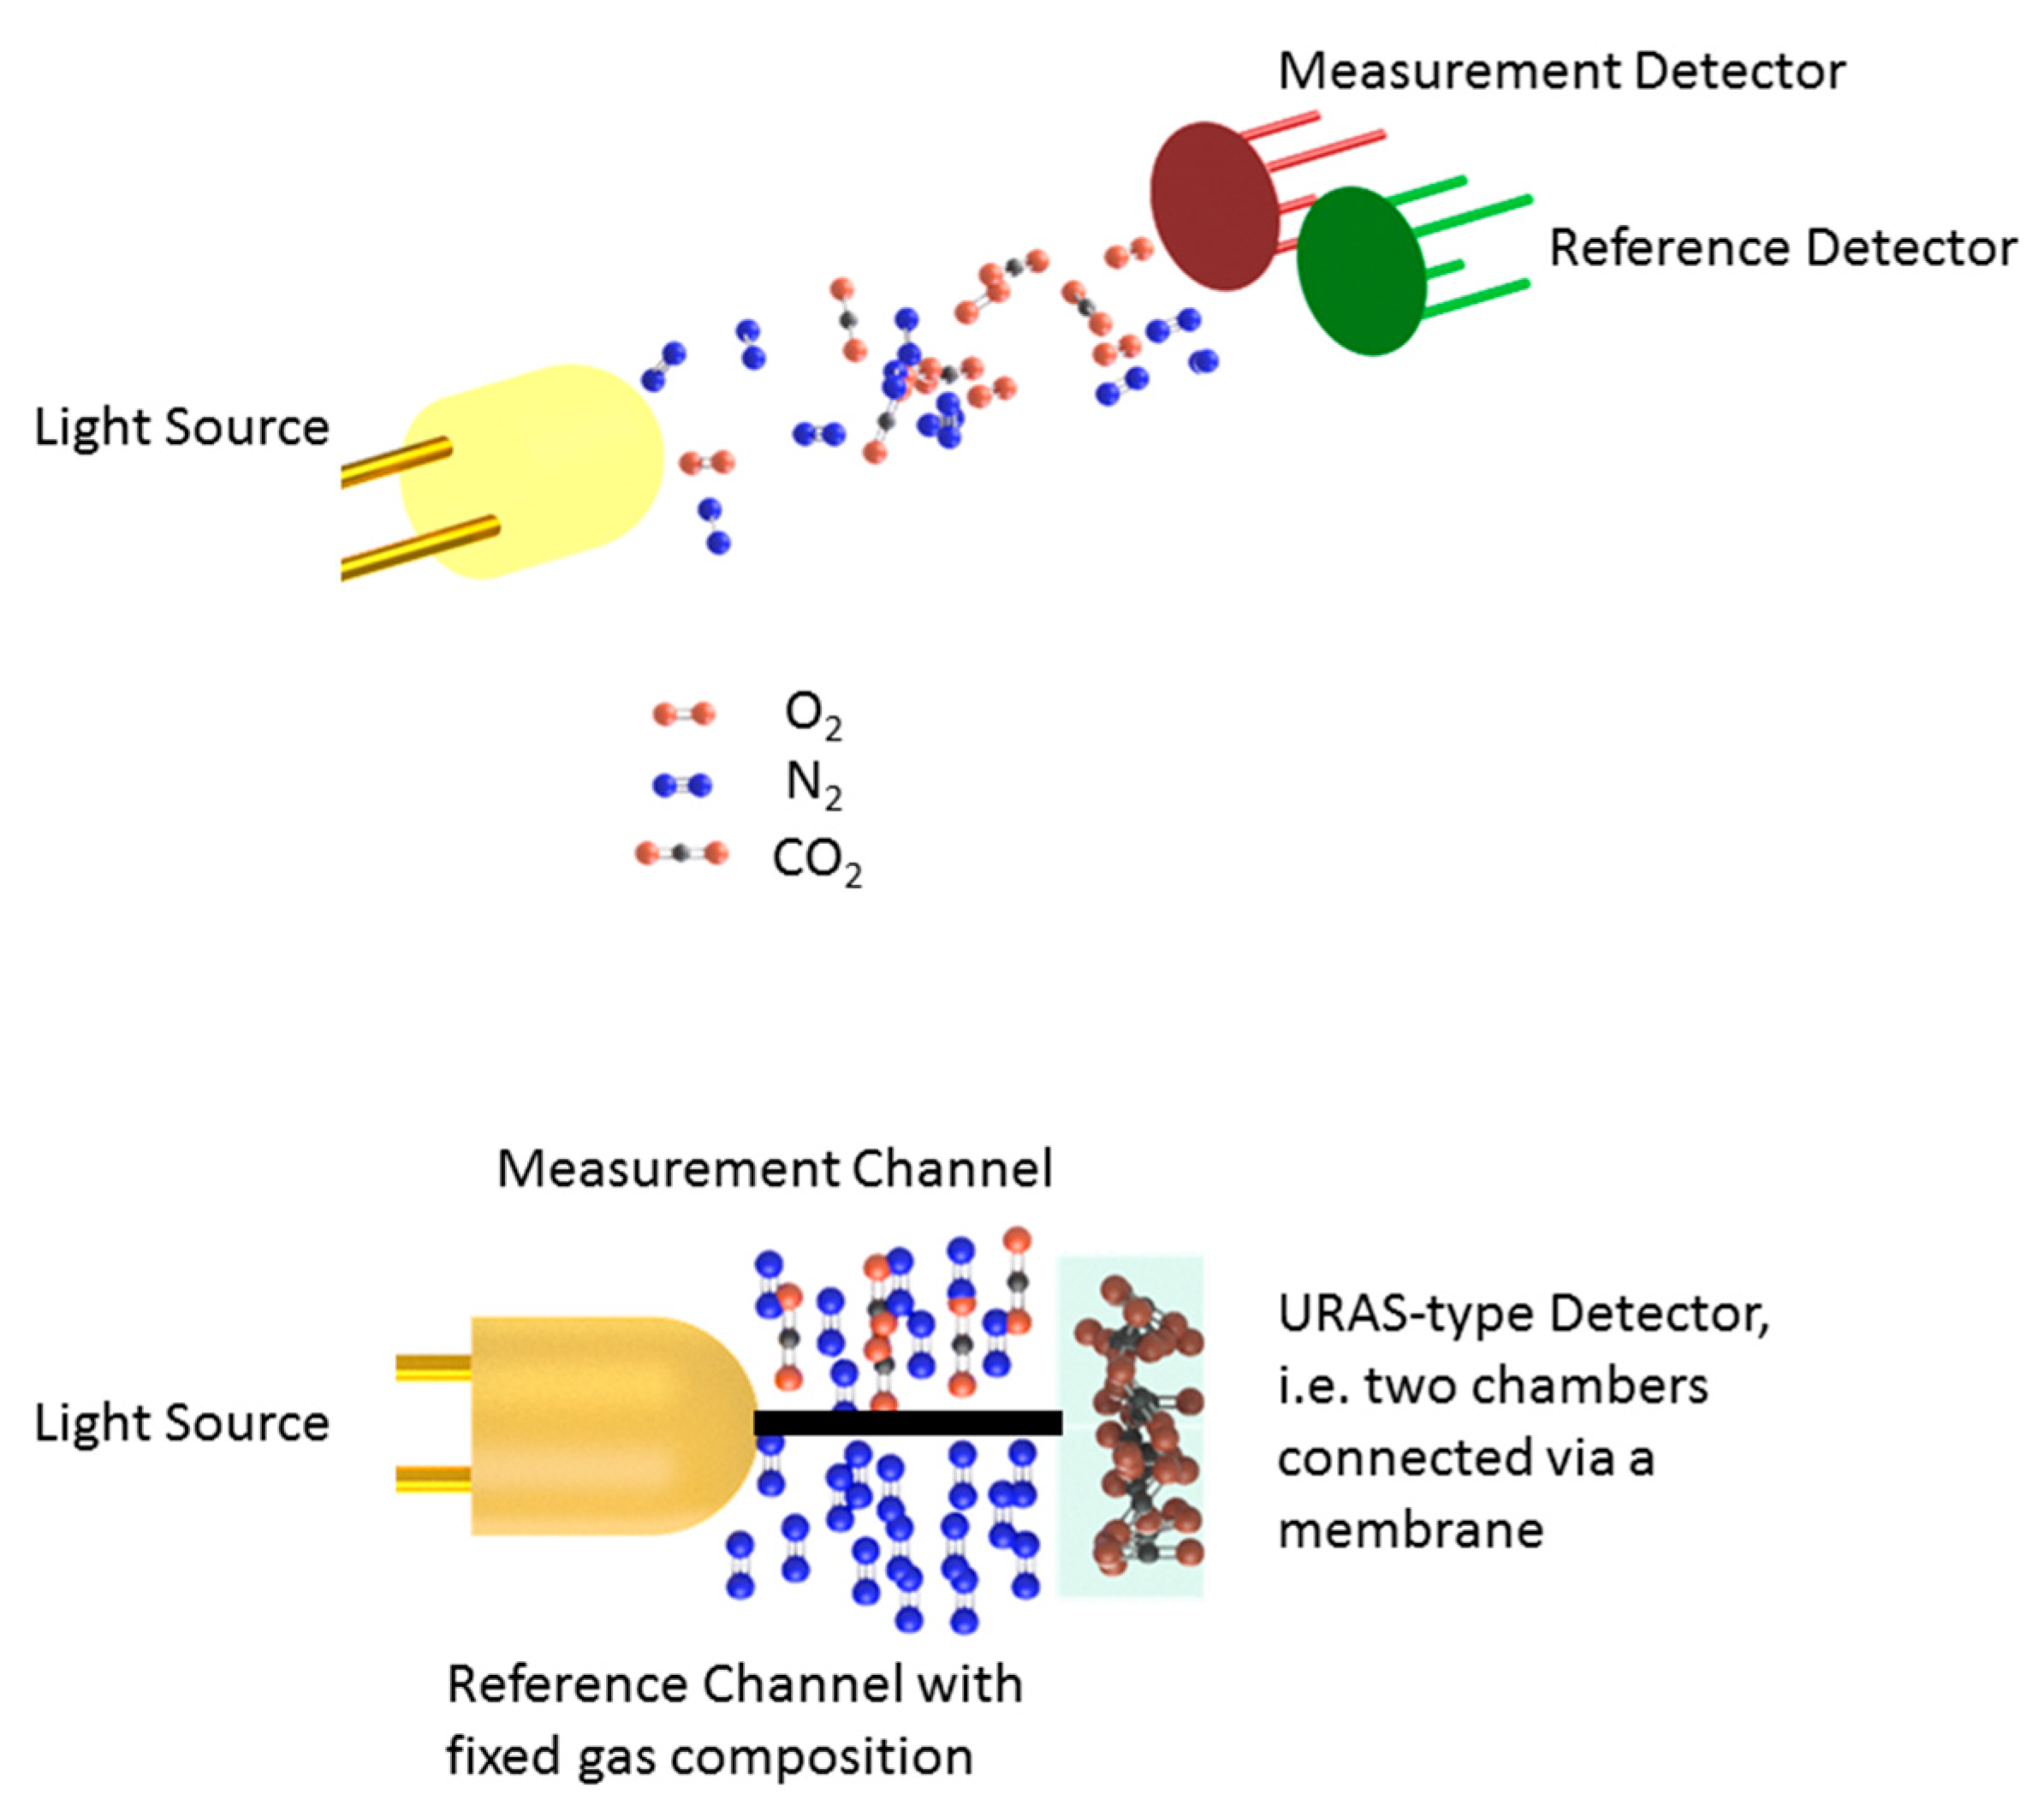
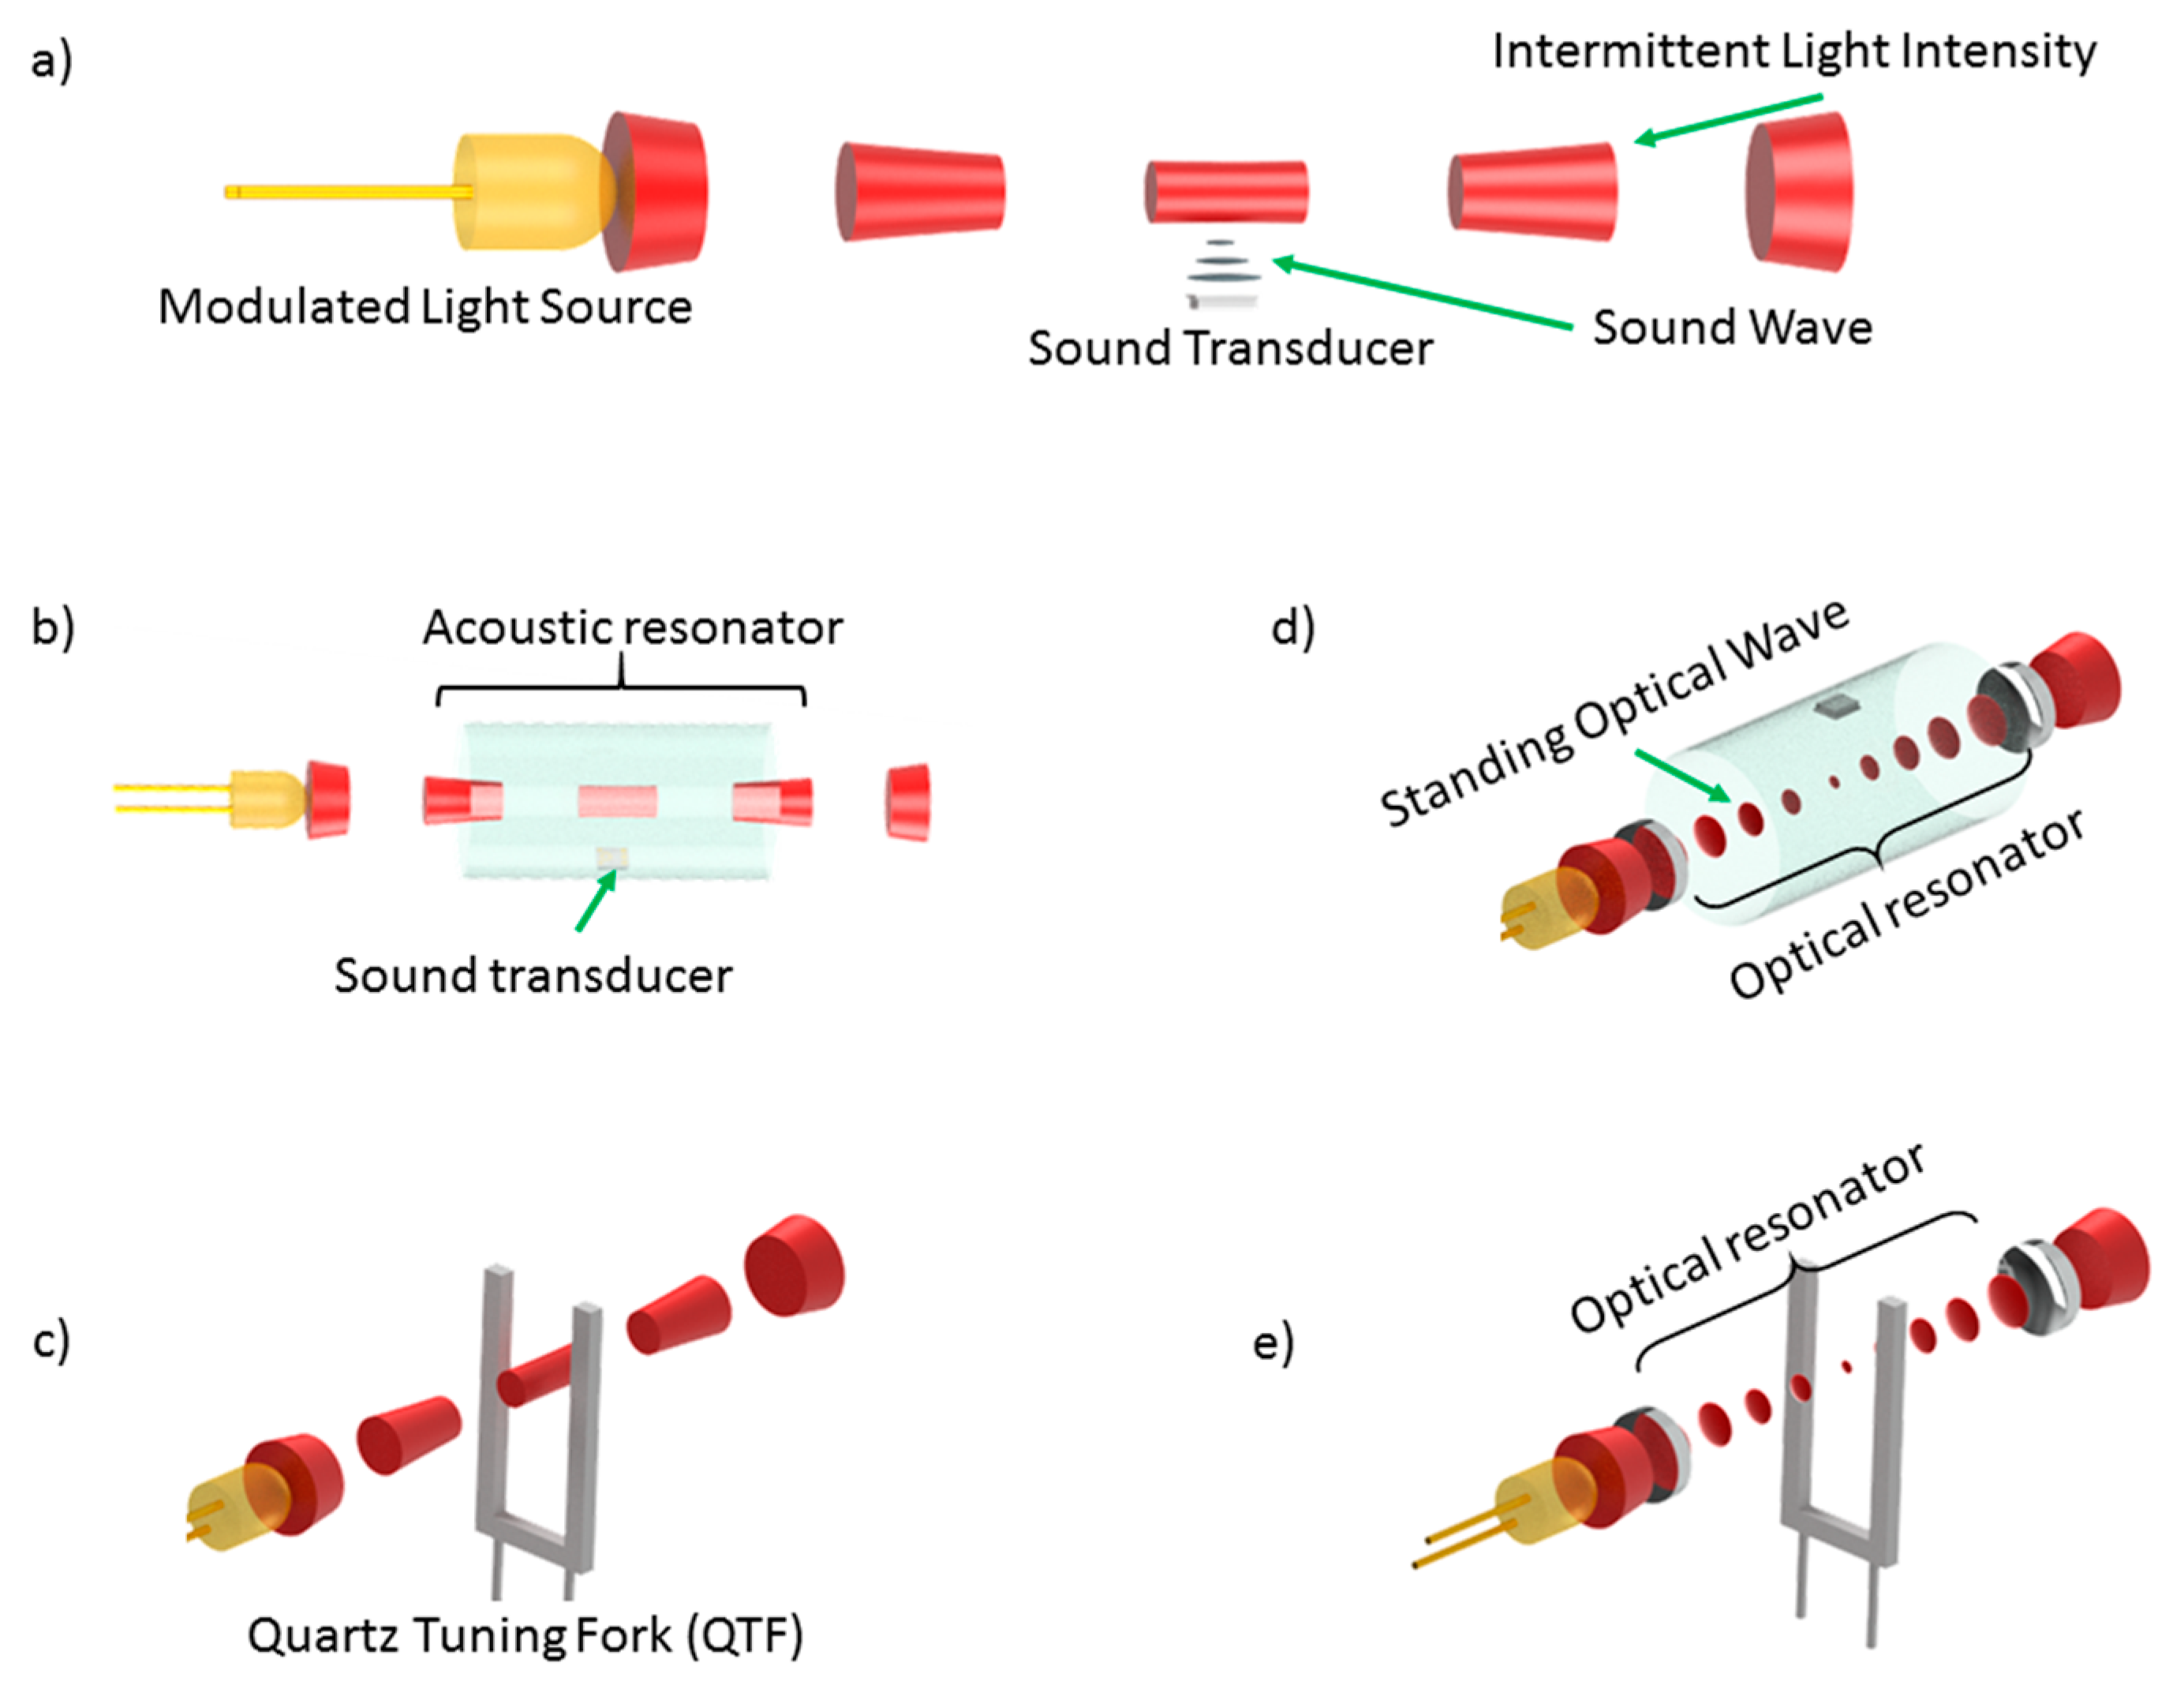
Table 1.
Photoacoustic NDIR demonstrations. Both the concentration range as well as the limit of detection are stated for ambient pressures of 1 bar. The values are stated either in part-per-million (ppm), parts-per-billion (ppb), or percent (%), whichever is most appropriate.
Table 1.
Photoacoustic NDIR demonstrations. Both the concentration range as well as the limit of detection are stated for ambient pressures of 1 bar. The values are stated either in part-per-million (ppm), parts-per-billion (ppb), or percent (%), whichever is most appropriate.
| Light Source | Sound Transducer | Target Gas/Measurement Range | Concentration Range and Limit of Detection (LOD) | Citations |
|---|---|---|---|---|
| Thermal source | Microphone | Carbon dioxide (CO2) | 0 %–100 % LOD not stated | [57] |
| 0 ppm–2500 ppm 8.69 ppm | [58] | |||
| Carbon Monoxide (CO) | 0 ppm–70 ppm LOD not stated | [59] | ||
| 0 ppm–2500 ppm 8.83 ppm | [58] | |||
| Methane (CH4) | 0 %–100 % LOD not stated | [57] | ||
| 0 ppm–2500 ppm 10.29 ppm | [58] | |||
| LED | Microphone | Carbon dioxide (CO2) | 0 ppm–5000 ppm 100 ppm | [52] |
| 0 ppm–7000 ppm 345 ppm | [50] | |||
| 0 ppm–7000 ppm LOD not stated | [60] | |||
| 0 %–100 % 2,053 ppm | [56] | |||
| Methane (CH4) | 0 %–100 % LOD not stated | [61] | ||
| 0 %–100 % 5024 ppm | [56] | |||
| 0 %–6 % 2510 ppm | [51] | |||
| QTF | Carbon dioxide (CO2) | 0 %–100 % LOD not stated | [62] | |
| Methane (CH4) | 0 %–100 % LOD not stated | [62] | ||
| Laser | Microphone | Methane (CH4) | 0 ppm–1100 ppm LOD not stated | [63] |
| Cantilever | Ethylene (C2H4) | 0 ppm–1000 ppm 10 ppb | [64] |
Table 2.
An excerpt of past acoustic resonator-enhanced photoacoustic demonstrations. All references have used a microphone as sound transducer. Abbreviations LD: Laser Diode, QCL: Quantum Cascade Laser, OPO: Optical Parametric Oscillator, LED: Light-Emitting Diode.
Table 2.
An excerpt of past acoustic resonator-enhanced photoacoustic demonstrations. All references have used a microphone as sound transducer. Abbreviations LD: Laser Diode, QCL: Quantum Cascade Laser, OPO: Optical Parametric Oscillator, LED: Light-Emitting Diode.
| Target Gas (es) | Light Source | Reference |
|---|---|---|
| Nitrogen Dioxide (NO2) | LD | [108,109,110,111,112] |
| Multimode LD | [113] | |
| LED | [114,115,116,117,118] | |
| Nitric Oxide (N2O) | QCL | [112,119] |
| OPO | [120] | |
| Nitrogen oxide (NO) | QCL | [121] |
| LD | [122] | |
| Ammonia (NH3) | QCL | [123,124,125] |
| CO2 laser | [126,127] | |
| LD | [128] | |
| Carbon Dioxide (CO2) | QCL | [129] |
| CO2 laser | [130] | |
| LD | [131,132,133,134] | |
| OPO | [135] | |
| Hydrogel Sulfide (H2S) | QCL | [136] |
| CO2 Laser | [130] | |
| LD | [137,138,139] | |
| Water (H2O) | QCL | [125,140] |
| LD | [133,134,141] | |
| LED | [142] | |
| Acetylene (C2H2) | CO2 Laser | [143] |
| LD | [87,144,145] | |
| Methane (CH4) | QCL | [146,147,148] |
| LD | [87,133,146,149] | |
| OPO | [150] | |
| Ozone (O3) | QCL | [151] |
| quadrupled Nd:YAG | [152] | |
| Hydrogen Chloride (HCl) | LD | [149,153] |
| Ethylene (C2H4) | CO2 Laser | [98] |
Table 3.
An excerpt of past QEPAS/cantilever demonstrations.
| Target Gas(es) | Setup | Reference |
|---|---|---|
| Nitrogen Dioxide (NO2) | QTF with acoustic resonator | [172,173] |
| QTF using LED | [174] | |
| Nitrous Oxide (N2O) | QTF with optical cavity | [164,175,176] |
| Nitric oxide (NO) | QTF using laser | [177] |
| Ammonia (NH3) | QTF using laser | [178,179] |
| Carbon Dioxide (CO2) | QTF using laser | [178,180,181,182] |
| QTF with optical cavity | [183] | |
| LED with cantilever | [184] | |
| Laser with cantilever | [185] | |
| Hydrogel Sulfide (H2S) | QTF using laser | [179,186,187,188] |
| Water (H2O) | QTF using laser | [169,189,190] |
| Acetylene (C2H2) | QTF using laser | [191,192,193] |
| Methane (CH4) | QTF using laser | [164,169,175,194] |
| Ozone (O3) | QTF using laser | [195] |
| Hydrogen Chloride (HCl) | QTF using laser | [196] |
| Ethylene (C2H4) | QTF using laser | [197,198,199,200] |
© 2020 by the author. Licensee MDPI, Basel, Switzerland. This article is an open access article distributed under the terms and conditions of the Creative Commons Attribution (CC BY) license (http://creativecommons.org/licenses/by/4.0/).
Share and Cite
MDPI and ACS Style
Palzer, S. Photoacoustic-Based Gas Sensing: A Review. Sensors 2020, 20, 2745. https://0-doi-org.brum.beds.ac.uk/10.3390/s20092745
AMA Style
Palzer S. Photoacoustic-Based Gas Sensing: A Review. Sensors. 2020; 20(9):2745. https://0-doi-org.brum.beds.ac.uk/10.3390/s20092745
Chicago/Turabian StylePalzer, Stefan. 2020. "Photoacoustic-Based Gas Sensing: A Review" Sensors 20, no. 9: 2745. https://0-doi-org.brum.beds.ac.uk/10.3390/s20092745
Note that from the first issue of 2016, this journal uses article numbers instead of page numbers. See further details here.