
Methodology for Addressing Infectious Aerosol Persistence in Real-Time Using Sensor Network

 , , and
Abstract
:1. Introduction
2. Materials and Methods
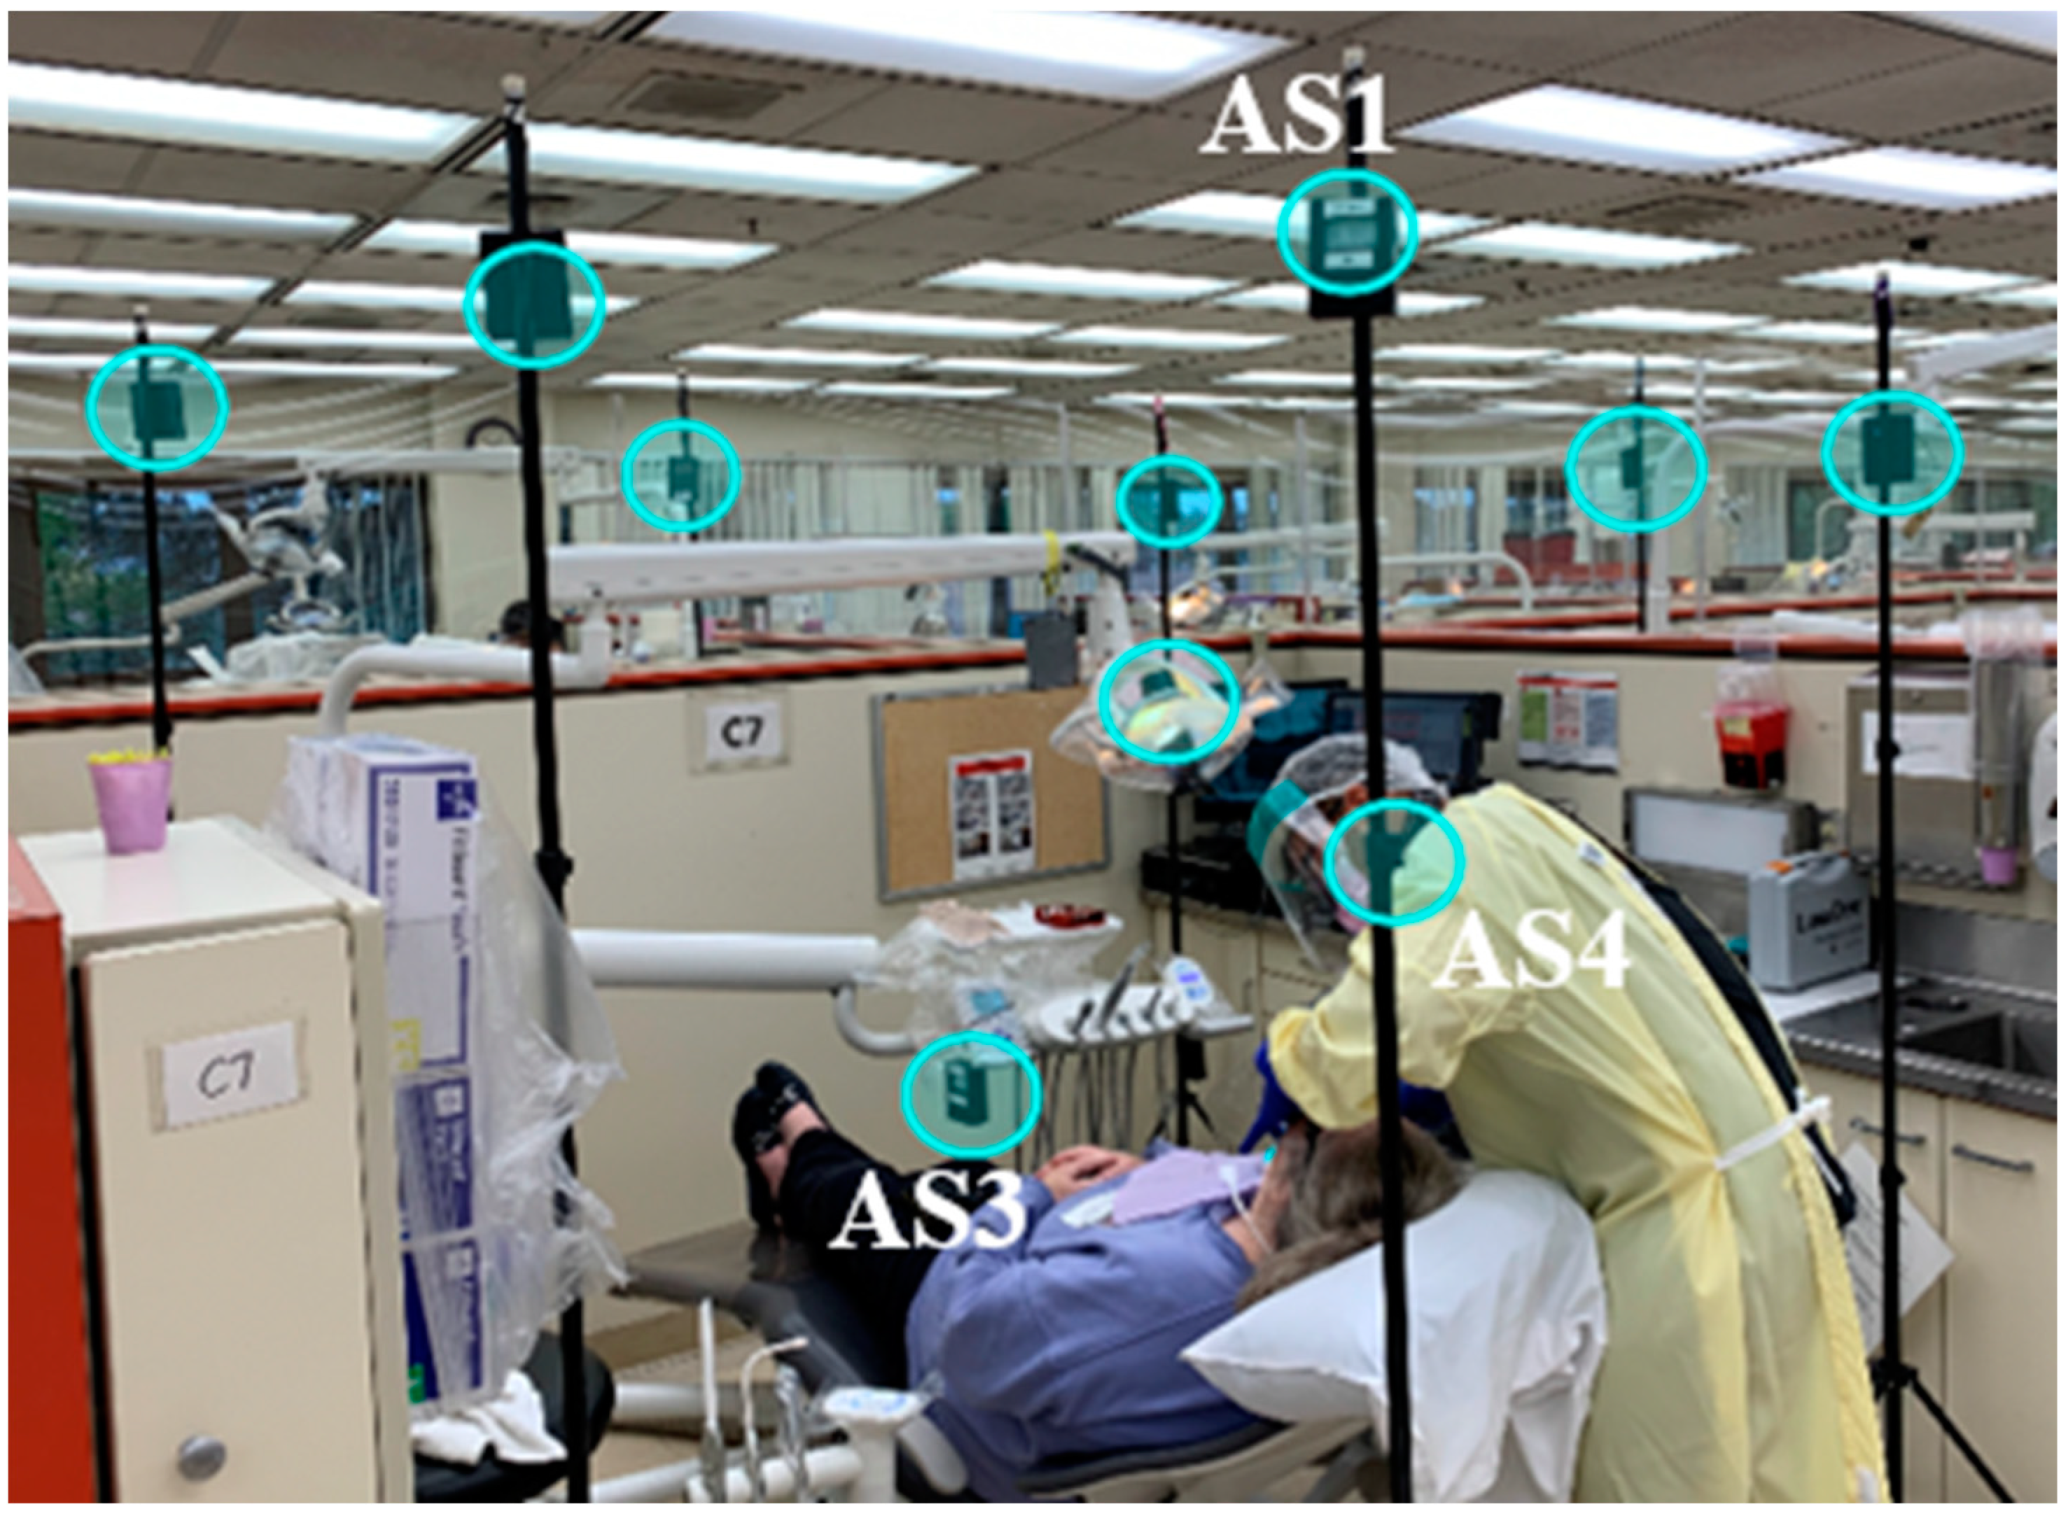
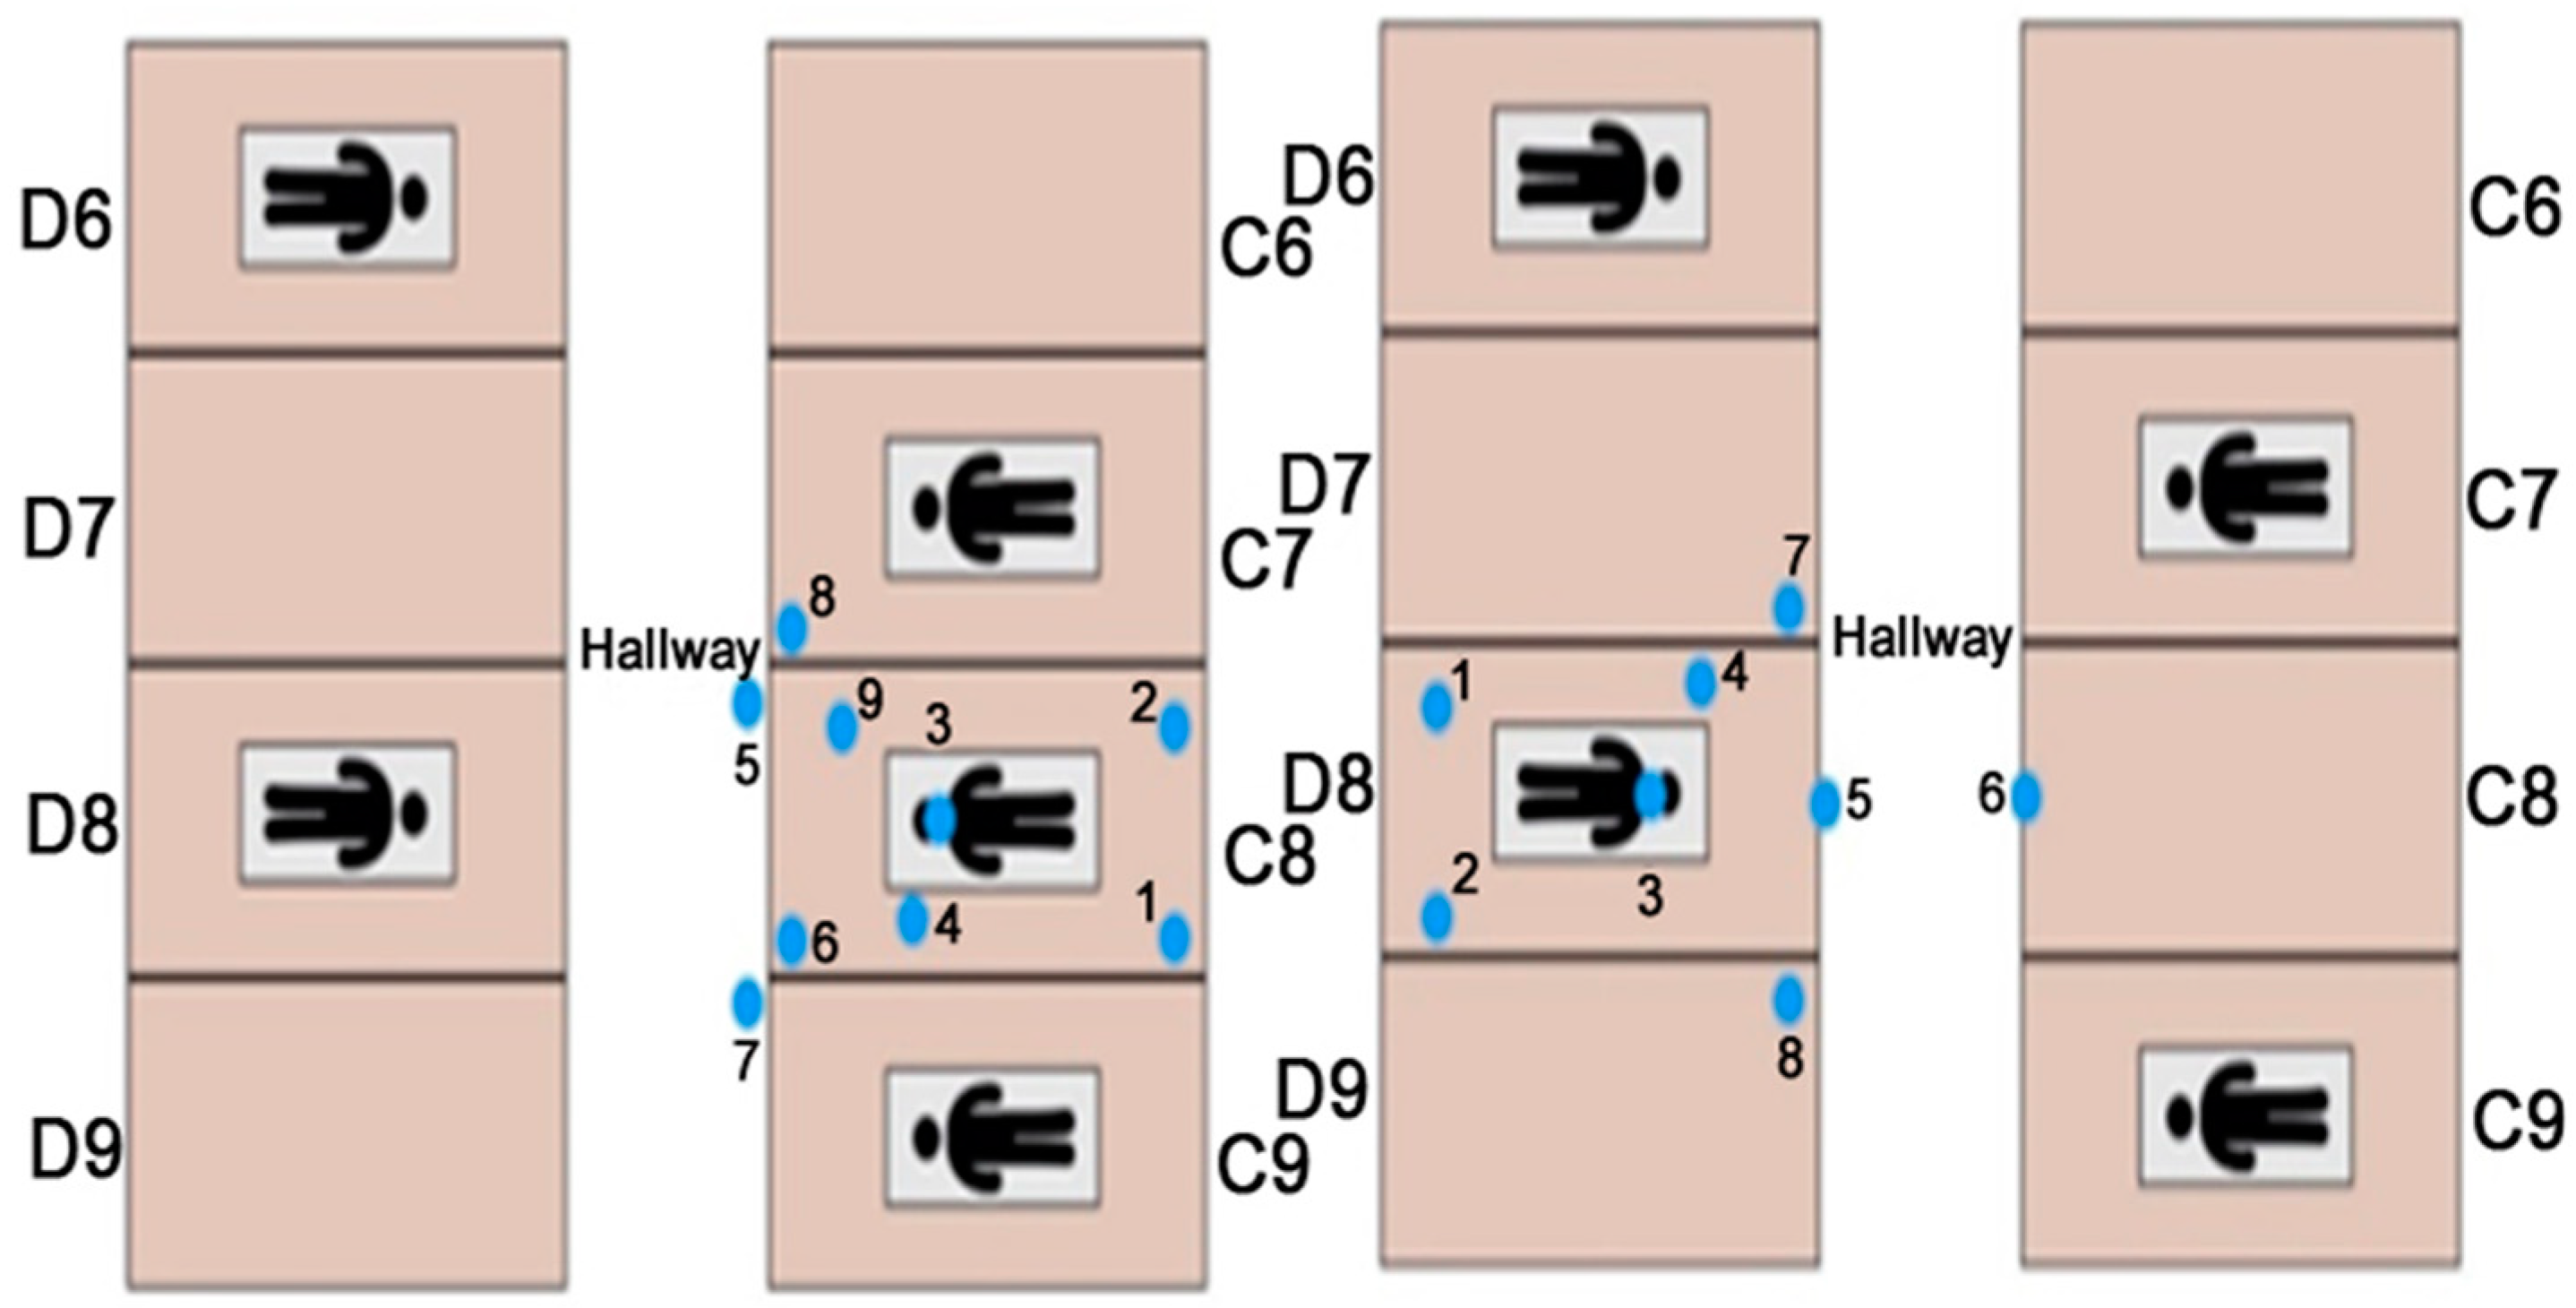
2.1. Experimental Setup
2.1.1. Evaluating Aera Filtration Units
2.1.2. Evaluating EOSD Units
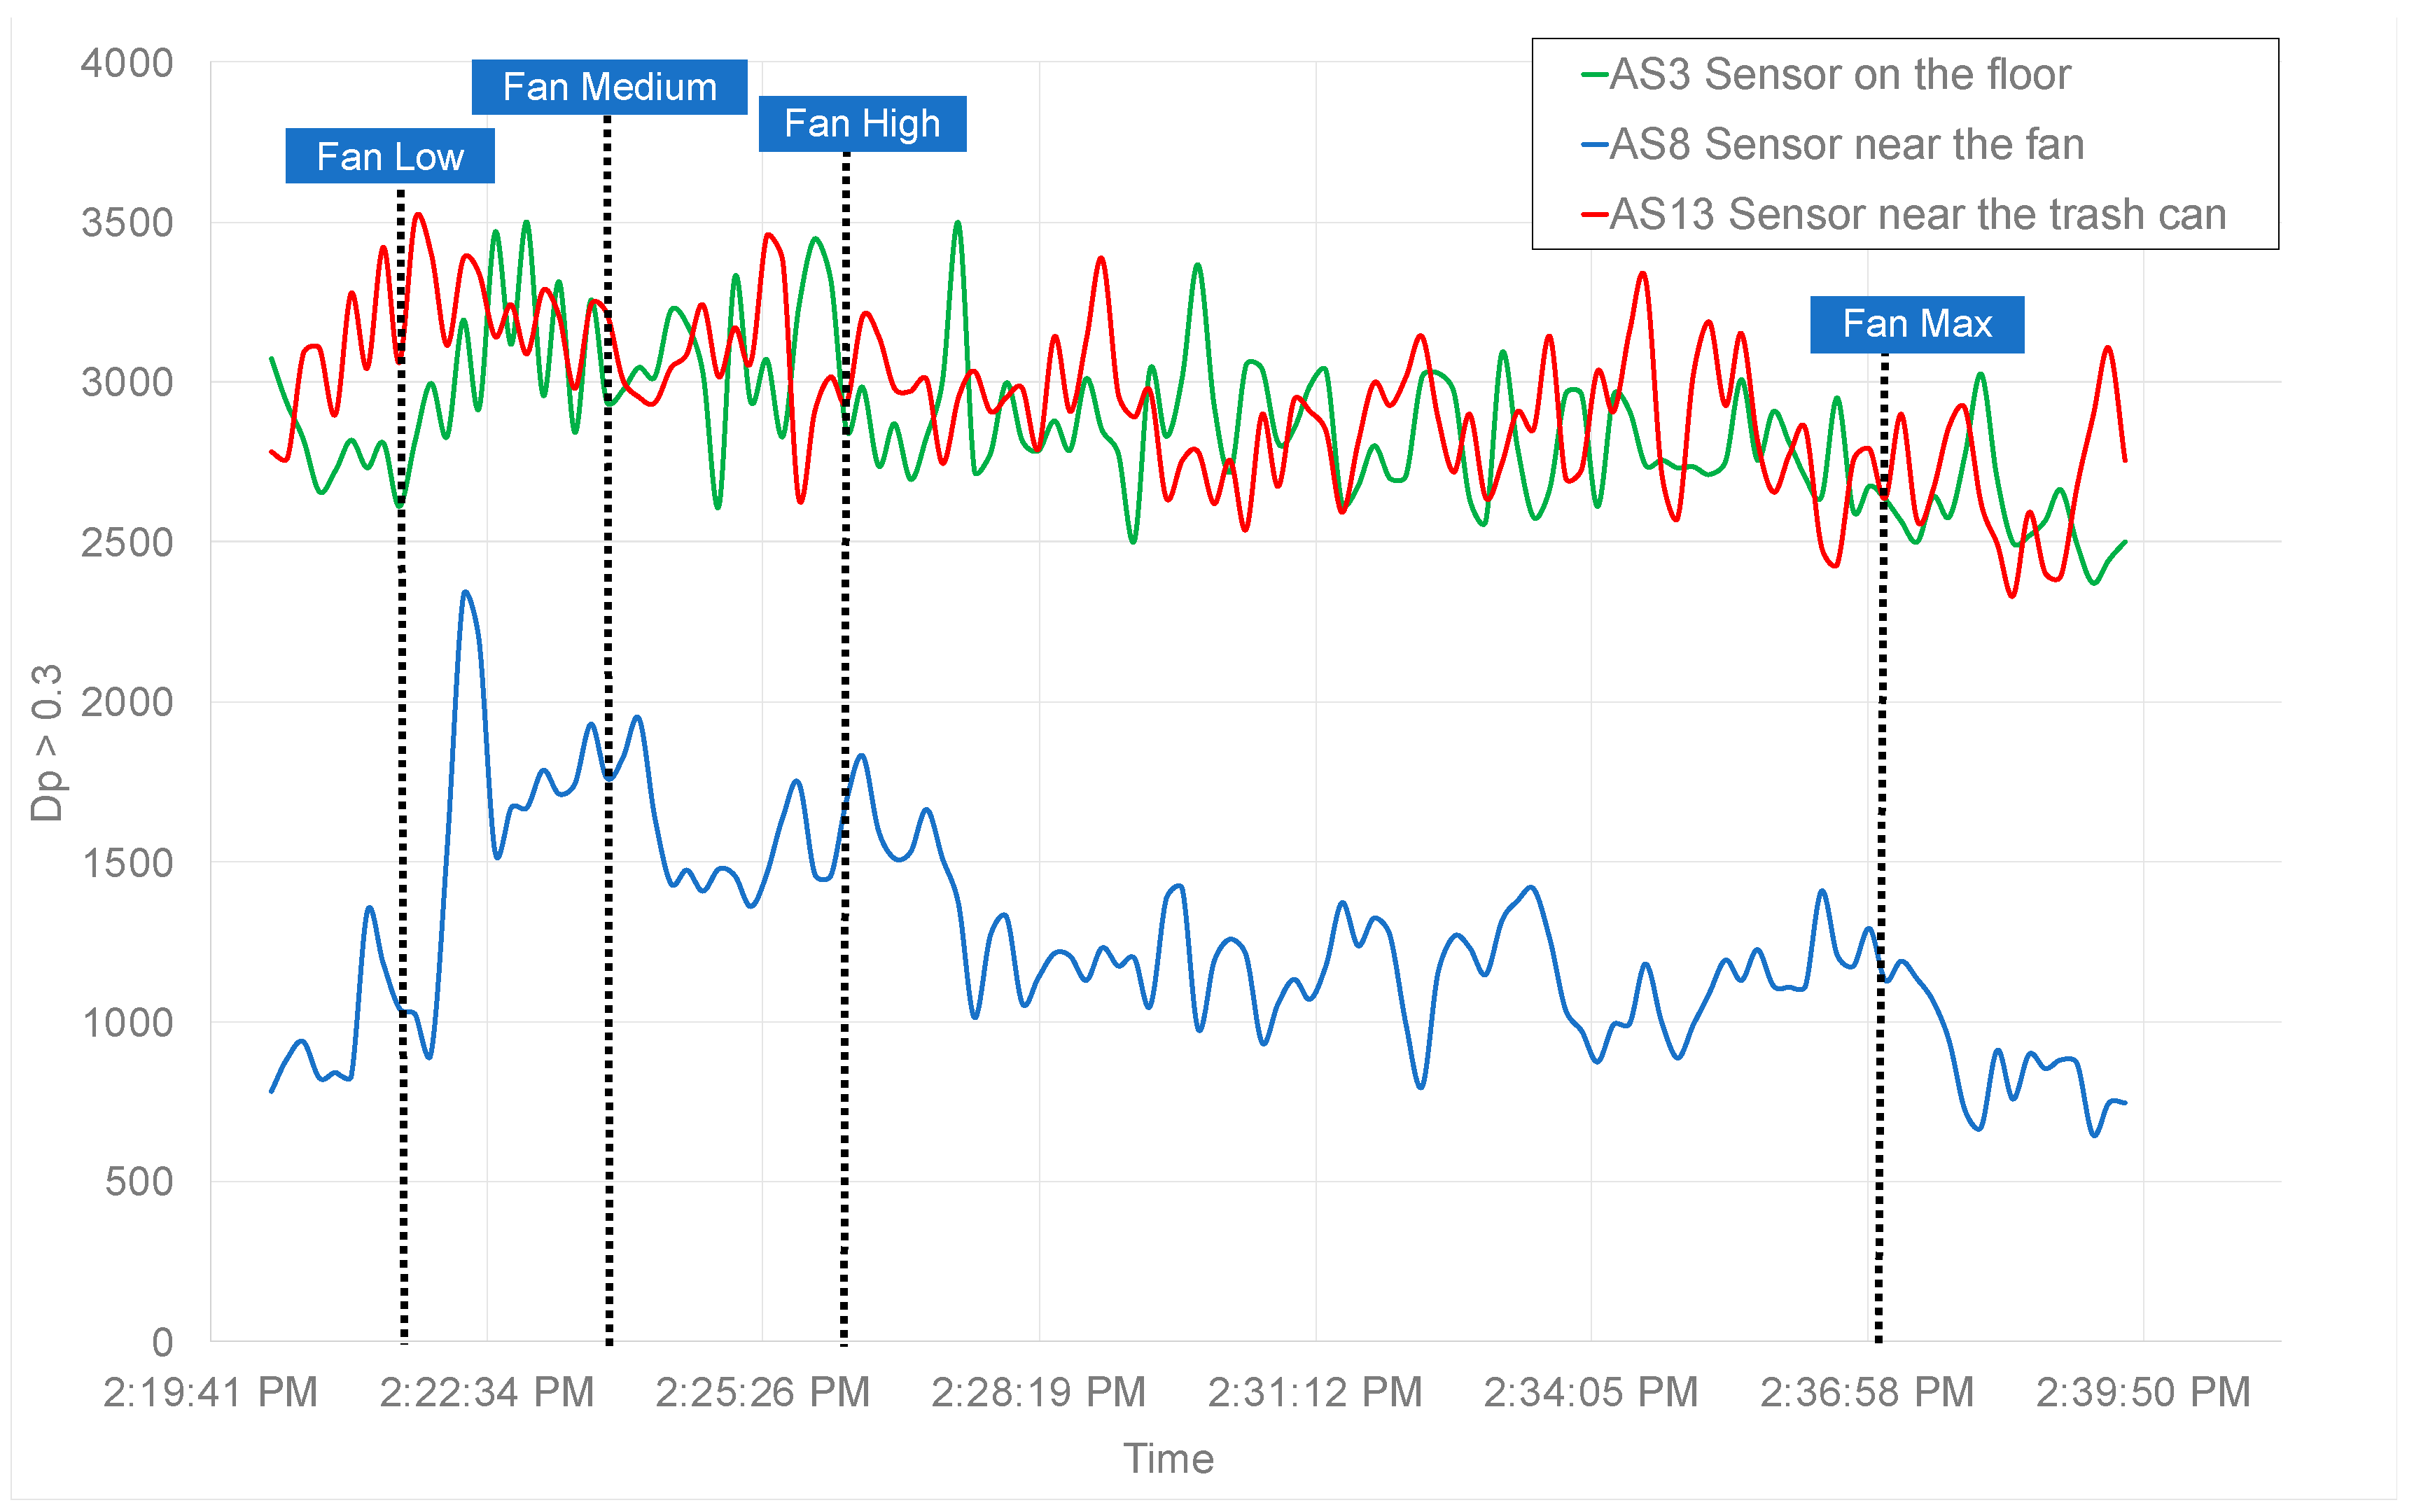
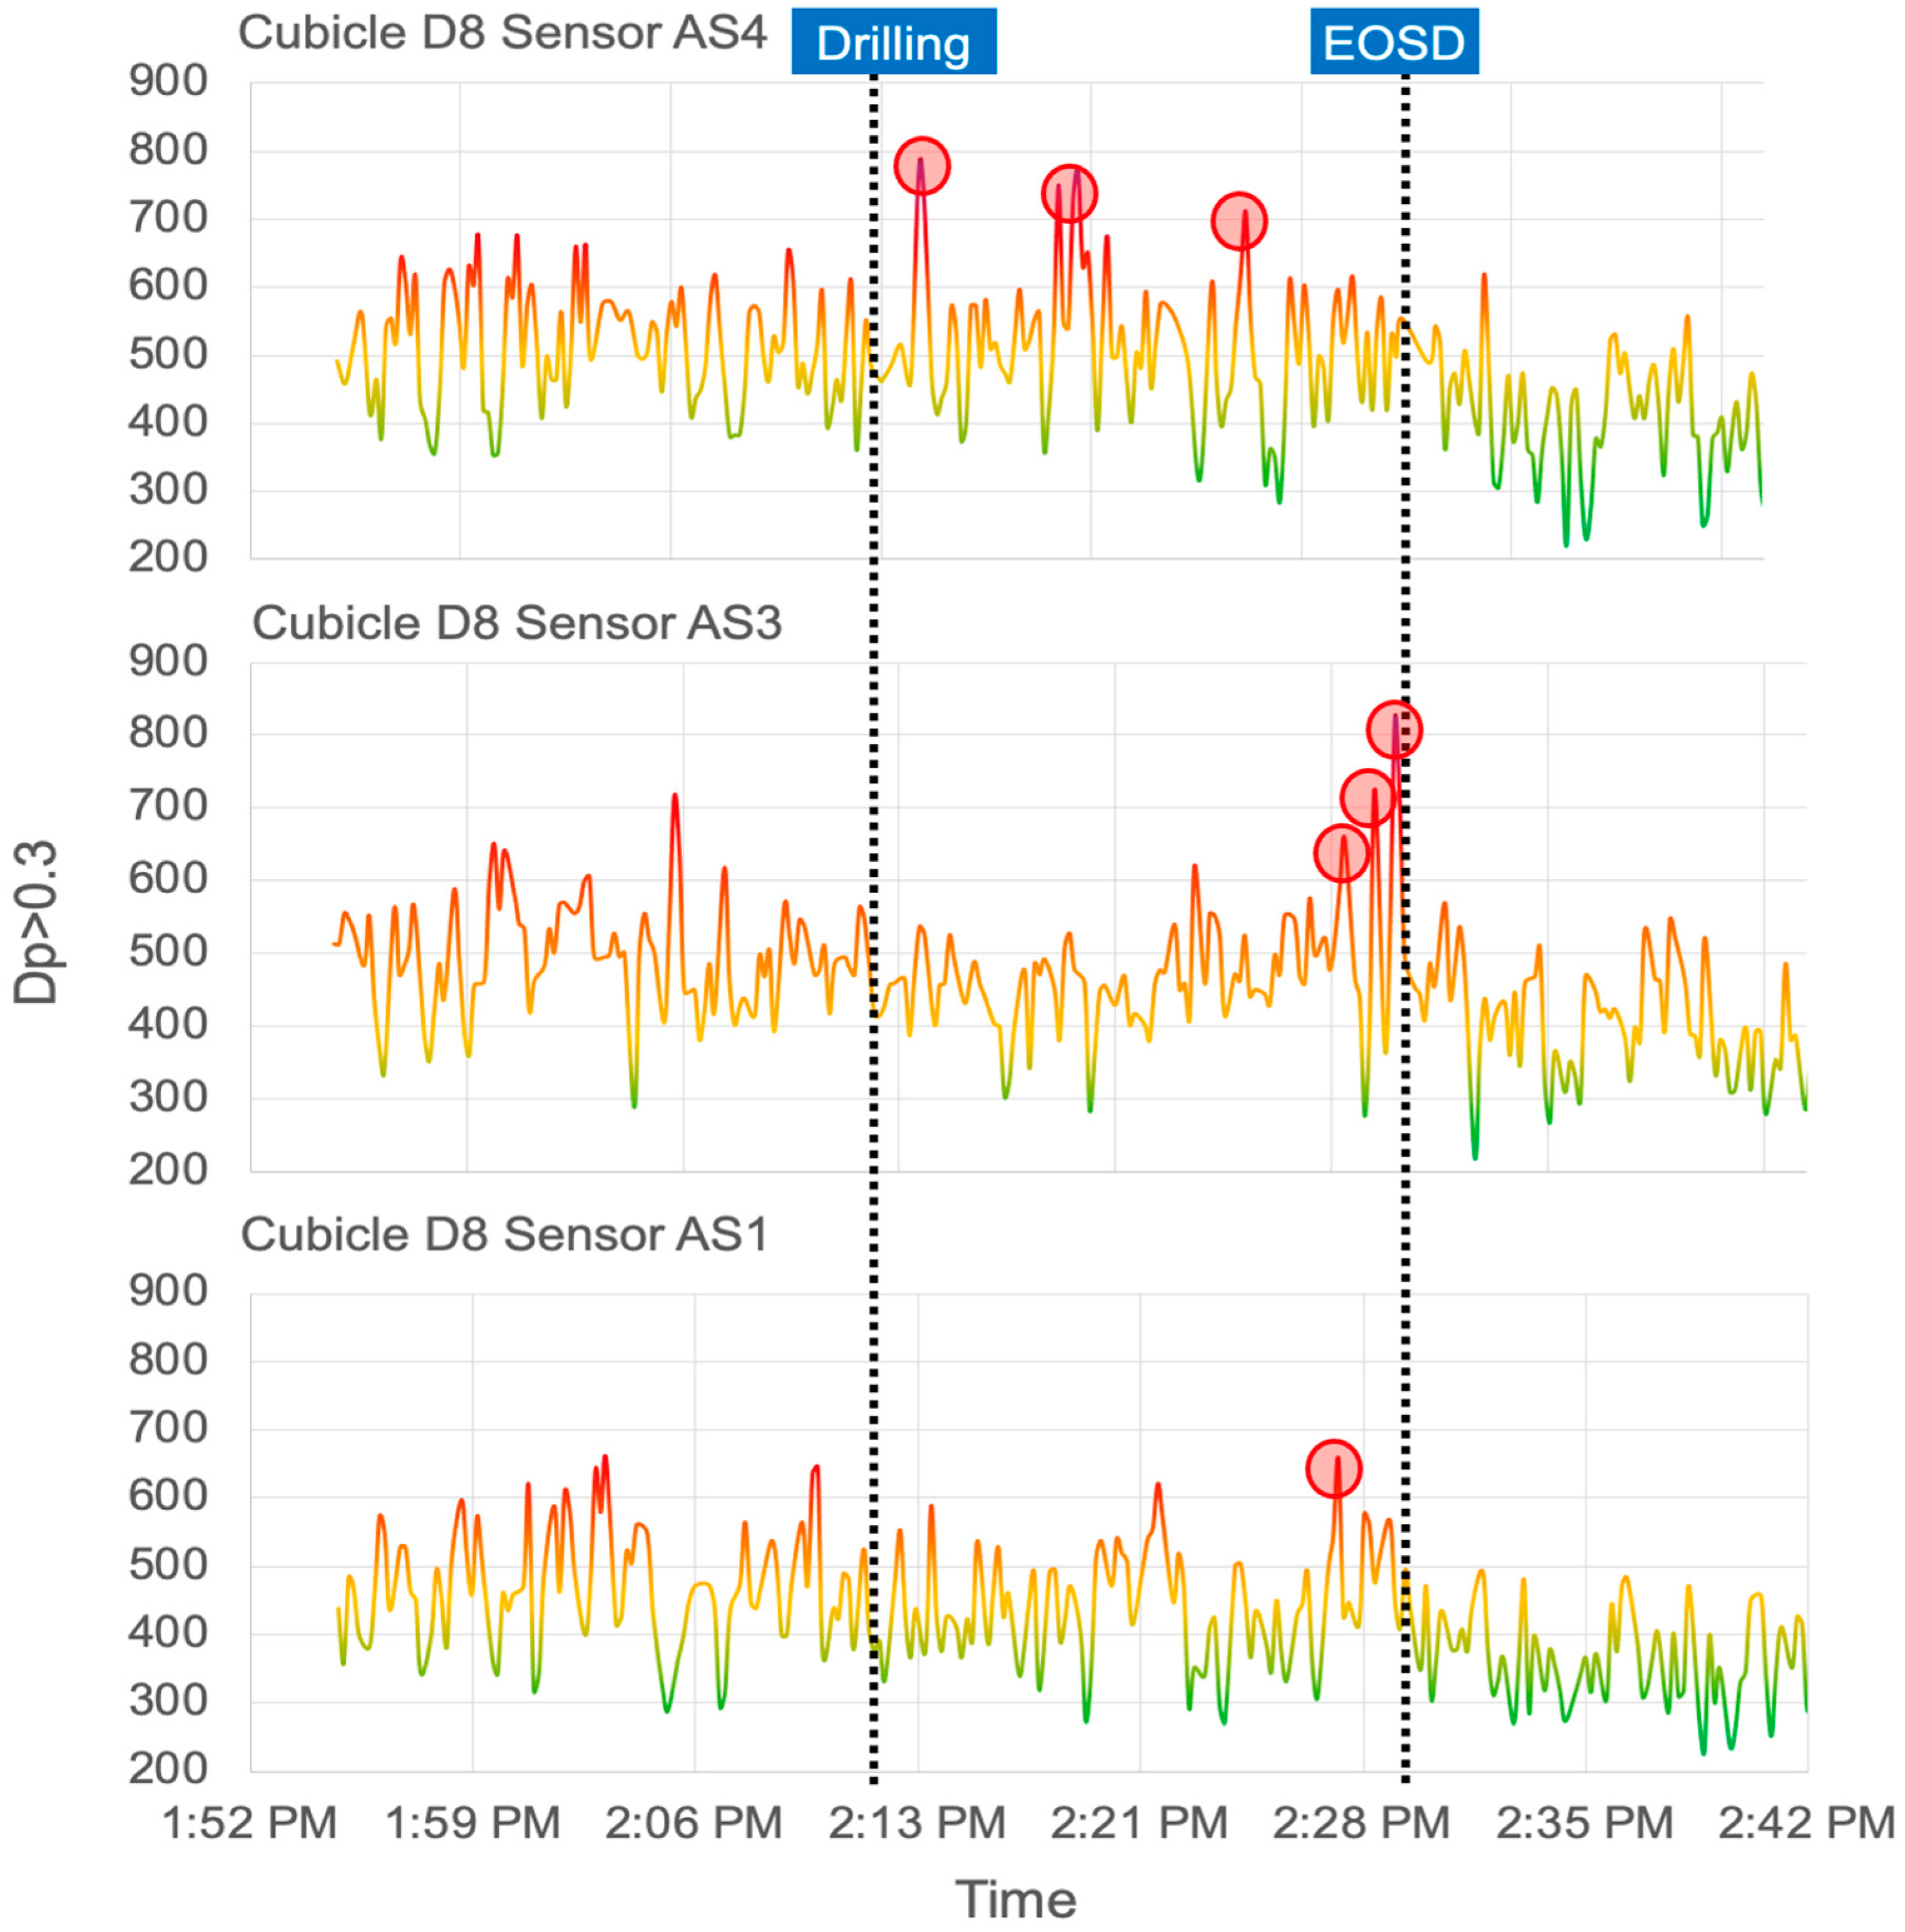
3. Results and Discussion
4. Future Work
5. Conclusions
Supplementary Materials
Author Contributions
Funding
Institutional Review Board Statement
Data Availability Statement
Acknowledgments
Conflicts of Interest
Abbreviations
References
- Summary of ADA Guidance during the COVID-19 Pandemic. Available online: http://www.ada.org/~/media/CPS/Files/COVID/COVID-19_Int_Guidance_Summary.pdf (accessed on 15 February 2021).
- Transmission of SARS-CoV-2: Implications for Infection Prevention Precautions; WHO Brief: Geneva, Switzerland, 2020.
- Limeres Posse, J.; van Harten, M.T.; Mac Giolla Phadraig, C.; Diniz Freitas, M.; Faulks, D.; Dougall, A.; Daly, B.; Diz Dios, P. The Impact of the First Wave of the COVID-19 Pandemic on Providing Special Care Dentistry: A Survey for Dentists. Int. J. Environ. Res. Public Health 2021, 18, 2970. [Google Scholar] [CrossRef]
- Derruau, S.; Bouchet, J.; Nassif, A.; Baudet, A.; Yasukawa, K.; Lorimier, S.; Prêcheur, I.; Bloch-Zupan, A.; Pellat, B.; Chardin, H.; et al. COVID-19 and Dentistry in 72 Questions: An Overview of the Literature. J. Clin. Med. 2021, 10, 779. [Google Scholar] [CrossRef] [PubMed]
- Cocârţă, D.M.; Prodana, M.; Demetrescu, I.; Lungu, P.E.; Didilescu, A.C. Indoor Air Pollution with Fine Particles and Implications for Workers’ Health in Dental Offices: A Brief Review. Sustainability 2021, 13, 599. [Google Scholar] [CrossRef]
- Han, P.; Li, H.; Walsh, L.; Ivanovski, S. Splatters and Aerosols Contamination in Dental Aerosol Generating Procedures. Appl. Sci. 2021, 11, 1914. [Google Scholar] [CrossRef]
- Faridi, S.; Niazi, S.; Sadeghi, K.; Naddafi, K.; Yavarian, J.; Shamsipour, M.; Jandaghi, N.Z.S.; Sadeghniiat, K.; Nabizadeh, R.; Yunesian, M.; et al. A field indoor air measurement of SARS-CoV-2 in the patient rooms of the largest hospital in Iran. Sci. Total Environ. 2020, 725, 138401. [Google Scholar] [CrossRef]
- CDC. Guidance for Dental Settings. CDC. Available online: https://www.cdc.gov/coronavirus/2019-ncov/hcp/dental-settings.html (accessed on 15 February 2021).
- Seto, E.; Austin, E.; Novosselov, I.; Yost, M.G. Use of low-cost particle monitors to calibrate traffic-related air pollutant models in urban areas. In Proceedings of the 7th International Congress on Environmental Modelling and Software, San Diego, CA, USA, 15–19 June 2014. [Google Scholar]
- Liu, X.; Jayaratne, R.; Thai, P.; Kuhn, T.; Zing, I.; Christensen, B.; Lamont, R.; Dunbabin, M.; Zhu, S.; Gao, J.; et al. Low-cost sensors as an alternative for long-term air quality monitoring. Environ. Res. 2020, 185, 109438. [Google Scholar] [CrossRef] [PubMed]
- Kuhn, T.; Jayaratne, R.; Thai, P.K.; Christensen, B.; Liu, X.; Dunbabin, M.; Lamont, R.; Zing, I.; Wainwright, D.; Witte, C.; et al. Air quality during and after the Commonwealth Games 2018 in Australia: Multiple benefits of monitoring. J. Aerosol Sci. 2021, 152, 105707. [Google Scholar] [CrossRef]
- Jiao, W.; Hagler, G.; Williams, R.; Sharpe, R.; Brown, R.; Garver, D.; Judge, R.; Caudill, M.; Rickard, J.; Davis, M.; et al. Community Air Sensor Network (CAIRSENSE) project: Evaluation of low-cost sensor performance in a suburban environment in the southeastern United States. Atmos. Meas. Tech. 2016, 9, 5281–5292. [Google Scholar] [CrossRef] [PubMed] [Green Version]
- Hegde, S.; Min, K.T.; Moore, J.; Lundrigan, P.; Patwari, N.; Collingwood, S.; Balch, A.; Kelly, K.E. Indoor household particulate matter measurements using a network of low-cost sensors. Aerosol Air Qual. Res. 2020, 20, 381–394. [Google Scholar] [CrossRef] [Green Version]
- Duncan, G.E.; Seto, E.; Avery, A.R.; Oie, M.; Carvlin, G.; Austin, E.; Shirai, J.H.; He, J.; Ockerman, B.; Novosselov, I. Usability of a personal air pollution monitor: Design-feedback iterative cycle study. JMIR mHealth uHealth 2018, 6, e12023. [Google Scholar] [CrossRef] [PubMed]
- Cordero, J.M.; Borge, R.; Narros, A. Using statistical methods to carry out in field calibrations of low cost air quality sensors. Sens. Actuators B Chem. 2018, 267, 245–254. [Google Scholar] [CrossRef]
- Feenstra, B.; Papapostolou, V.; Hasheminassab, S.; Zhang, H.; Der Boghossian, B.; Cocker, D.; Polidori, A. Performance evaluation of twelve low-cost PM2.5 sensors at an ambient air monitoring site. Atmos. Environ. 2019, 216, 116946. [Google Scholar] [CrossRef]
- Kelly, K.E.; Whitaker, J.; Petty, A.; Widmer, C.; Dybwad, A.; Sleeth, D.; Martin, R.; Butterfield, A. Ambient and laboratory evaluation of a low-cost particulate matter sensor. Environ. Pollut. 2017, 221, 491–500. [Google Scholar] [CrossRef] [PubMed]
- Sayahi, T.; Butterfield, A.; Kelly, K.E. Long-term field evaluation of the Plantower PMS low-cost particulate matter sensors. Environ. Pollut. 2019, 245, 932–940. [Google Scholar] [CrossRef]
- Tryner, J.; L’Orange, C.; Mehaffy, J.; Miller-Lionberg, D.; Hofstetter, J.C.; Wilson, A.; Volckens, J. Laboratory evaluation of low-cost PurpleAir PM monitors and in-field correction using co-located portable filter samplers. Atmos. Environ. 2020, 220, 117067. [Google Scholar] [CrossRef]
- Wang, Z.; Delp, W.W.; Singer, B.C. Performance of low-cost indoor air quality monitors for PM2.5 and PM10 from residential sources. Build. Environ. 2020, 171, 106654. [Google Scholar] [CrossRef]
- Zusman, M.; Schumacher, C.S.; Gassett, A.J.; Spalt, E.W.; Austin, E.; Larson, T.V.; Carvlin, G.; Seto, E.; Kaufman, J.D.; Sheppard, L. Calibration of low-cost particulate matter sensors: Model development for a multi-city epidemiological study. Environ. Int. 2020, 134, 05329. [Google Scholar] [CrossRef]
- Austin, E.; Novosselov, I.; Seto, E.; Yost, M.G. Laboratory Evaluation of the Shinyei PPD42NS Low-Cost Particulate Matter Sensor. PLoS ONE 2015, 10, e0137789. [Google Scholar] [CrossRef]
- Sousan, S.; Koehler, K.; Thomas, G.; Park, J.H.; Hillman, M.; Halterman, A.; Peters, T.M. Inter-comparison of low-cost sensors for measuring the mass concentration of occupational aerosols. Aerosol Sci. Technol. 2016, 50, 462–473. [Google Scholar] [CrossRef] [PubMed] [Green Version]
- Renard, J.B.; Dulac, F.; Berthet, G.; Lurton, T.; Vignelles, D.; Jégou, F.; Tonnelier, T.; Jeannot, M.; Couté, B.; Akiki, R.; et al. LOAC: A small aerosol optical counter/sizer for ground-based and balloon measurements of the size distribution and nature of atmospheric particles—Part 1: Principle of measurements and instrument evaluation. Atmos. Meas. Tech. 2016, 9, 1721–1742. [Google Scholar] [CrossRef] [Green Version]
- Nagy, A.; Szymanski, W.W.; Gál, P.; Golczewski, A.; Czitrovszky, A. Numerical and experimental study of the performance of the dual wavelength optical particle spectrometer (DWOPS). J. Aerosol Sci. 2007, 38, 467–478. [Google Scholar] [CrossRef]
- Njalsson, T.; Novosselov, I. Design and Optimization of a Compact Low-cost Optical Particle Sizer. J. Aerosol Sci. 2018, 119, 1–12. [Google Scholar] [CrossRef]
- Jayaratne, R.; Liu, X.; Thai, P.; Dunbabin, M.; Morawska, L. The influence of humidity on the performance of a low-cost air particle mass sensor and the effect of atmospheric fog. Atmos. Meas. Tech. 2018, 11, 4883–4890. [Google Scholar] [CrossRef] [Green Version]
- Manikonda, A.; Zíková, N.; Hopke, P.K.; Ferro, A.R. Laboratory assessment of low-cost PM monitors. J. Aerosol Sci. 2016, 102, 29–40. [Google Scholar] [CrossRef]
- Crilley, L.R.; Shaw, M.; Pound, R.; Kramer, L.J.; Price, R.; Young, S.; Lewis, A.C.; Pope, F.D. Evaluation of a low-cost optical particle counter (Alphasense OPC-N2) for ambient air monitoring. Atmos. Meas. Tech. 2018, 11, 709–720. [Google Scholar] [CrossRef] [Green Version]
- Czitrovszky, A. Optical Particle Counter. In Handbook of Solid-State Lasers; Denker, B., Shklovsky, E., Eds.; Woodhead Publishing: Cambridge, UK, 2013. [Google Scholar]
- Kenarkoohi, A.; Noorimotlagh, Z.; Falahi, S.; Amarloei, A.; Mirzaee, S.A.; Pakzad, I.; Bastani, E. Hospital indoor air quality monitoring for the detection of SARS-CoV-2 (COVID-19) virus. Sci. Total Environ. 2020, 748. [Google Scholar] [CrossRef]
- Holloman, J.L.; Mauriello, S.M.; Pimenta, L.; Arnold, R.R. Comparison of suction device with saliva ejector for aerosol and spatter reduction during ultrasonic scaling. J. Am. Dent. Assoc. 2021, 146, 27–33. [Google Scholar] [CrossRef]
- Allison, J.R.; Currie, C.C.; Edwards, D.C.; Bowes, C.; Coulter, J.; Pickering, K.; Kozhevnikova, E.; Durham, J.; Nile, C.J.; Jakubovics, N.; et al. Evaluating aerosol and splatter following dental procedures: Addressing new challenges for oral health care and rehabilitation. J. Oral Rehabil. 2020, 48, 61–72. [Google Scholar] [CrossRef]
- Chavis, S.E.; Hines, S.E.; Dyalram, D.; Cole, M.N.; Dalby, R.N. Can extraoral suction units minimize droplet spatter during a simulated dental procedure? J. Am. Dent. Assoc. 2021, 152, 157–165. [Google Scholar] [CrossRef]
- Polednik, B. Aerosol and bioaerosol particles in a dental office. Sci. Direct 2014, 134, 405–409. [Google Scholar] [CrossRef]
- The World’s Best Indoor Air Purifiers. Available online: https://surgicallycleanair.com/jade/ (accessed on 31 May 2021).
- Agency, E.P. Air Quality Index (AQI). In Air Quality Communication Workshop; San Salvador, El Salvador, 2012. Available online: https://www.epa.gov/sites/production/files/2014-05/documents/zell-aqi.pdf (accessed on 31 May 2021).


| Devices and Terminologies | Definitions |
|---|---|
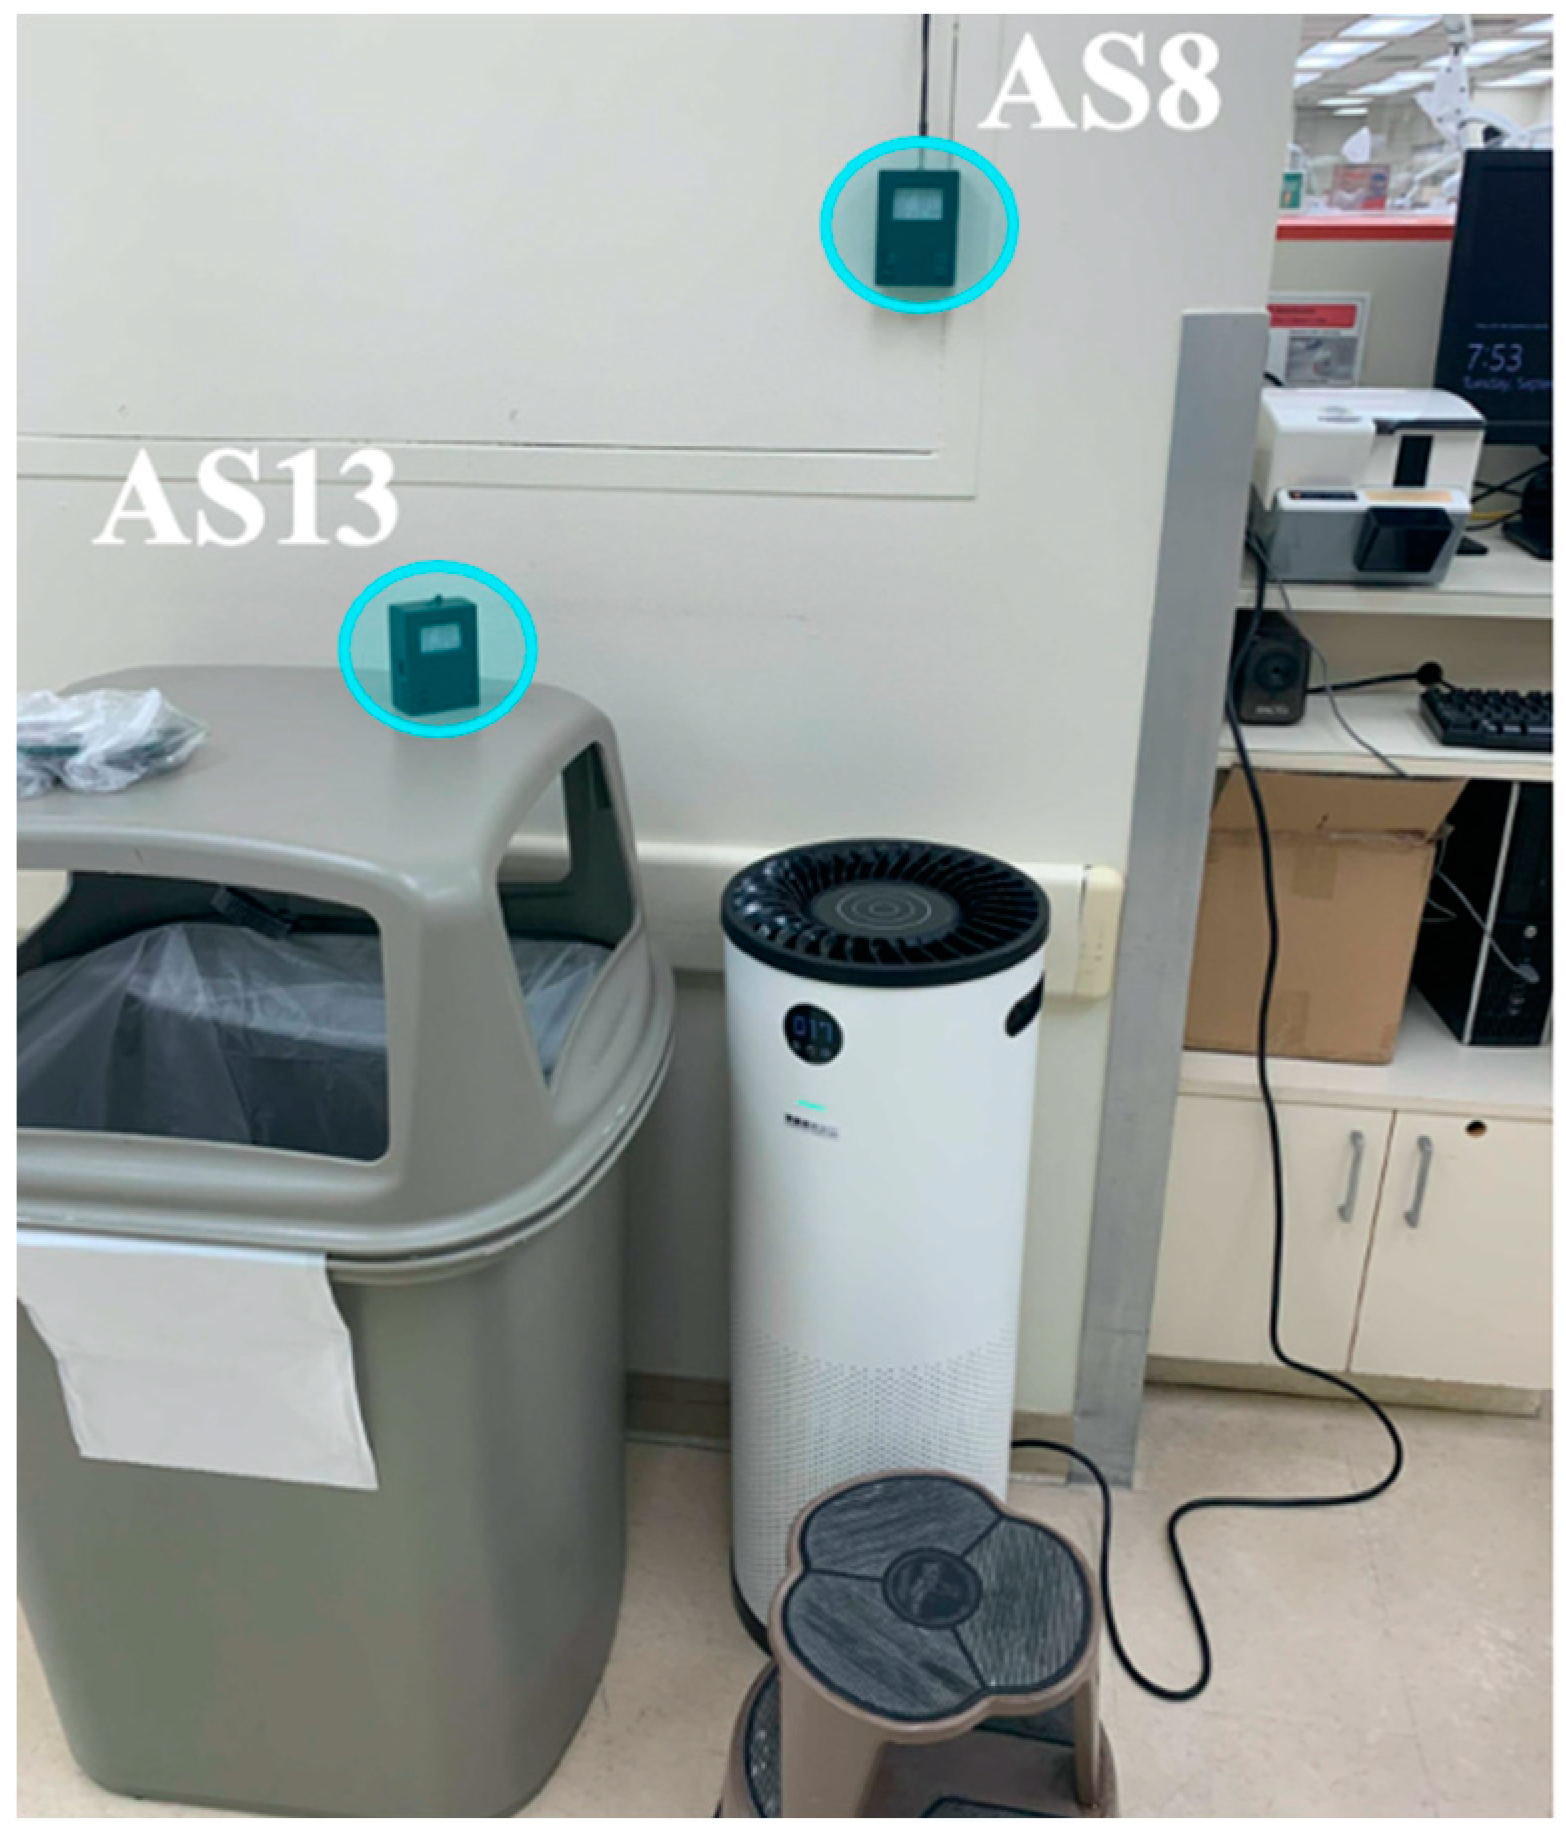
| AS1, AS2, etc. | AeroSpec (AS) sensor number |
| EOSD | Extra-Oral Suction Device used during procedures |
| Surgically Clean Air Jade | Space filtration units used continuously |
| C8, D8 | Dental operatory room numbers |
| Event # | Time | Description |
|---|---|---|
| #1 | 2:01 PM | Cubicle D8 restoration procedure begins; Cubicle C7 has impression procedure underway. |
| #2 (Drilling) | 2:12 PM | Cubicle D8 drilling procedure begins. |
| #3 | 2:19 PM | Cubicle C9 is cutting procedure underway. |
| #3a | 2:31 PM | Lost connection (B17). |
| #4 (EOSD ON) | 2:35 PM | Suction machine #1 turned on in cubicle D8 (on high mode). |
| #5 | 2:37 PM | Cubicle C8 started the examination. |
| #6 | 2:40 PM | Suction machine #1 turned off. |
| #6a | 2:41 PM | Reset Sensor (B17). |
Publisher’s Note: MDPI stays neutral with regard to jurisdictional claims in published maps and institutional affiliations. |
© 2021 by the authors. Licensee MDPI, Basel, Switzerland. This article is an open access article distributed under the terms and conditions of the Creative Commons Attribution (CC BY) license (https://creativecommons.org/licenses/by/4.0/).
Share and Cite
Makhsous, S.; Segovia, J.M.; He, J.; Chan, D.; Lee, L.; Novosselov, I.V.; Mamishev, A.V. Methodology for Addressing Infectious Aerosol Persistence in Real-Time Using Sensor Network. Sensors 2021, 21, 3928. https://0-doi-org.brum.beds.ac.uk/10.3390/s21113928
Makhsous S, Segovia JM, He J, Chan D, Lee L, Novosselov IV, Mamishev AV. Methodology for Addressing Infectious Aerosol Persistence in Real-Time Using Sensor Network. Sensors. 2021; 21(11):3928. https://0-doi-org.brum.beds.ac.uk/10.3390/s21113928
Chicago/Turabian StyleMakhsous, Sepehr, Joelle M. Segovia, Jiayang He, Daniel Chan, Larry Lee, Igor V. Novosselov, and Alexander V. Mamishev. 2021. "Methodology for Addressing Infectious Aerosol Persistence in Real-Time Using Sensor Network" Sensors 21, no. 11: 3928. https://0-doi-org.brum.beds.ac.uk/10.3390/s21113928