
Enhanced Sensitivity and Detection of Near-Infrared Refractive Index Sensor with Plasmonic Multilayers

 , , ,
, , ,
Abstract
:1. Introduction
2. Materials and Methods
3. Results and Discussion

| Optical Structure | RI Range | Wavelength | FOM | Reference |
|---|---|---|---|---|
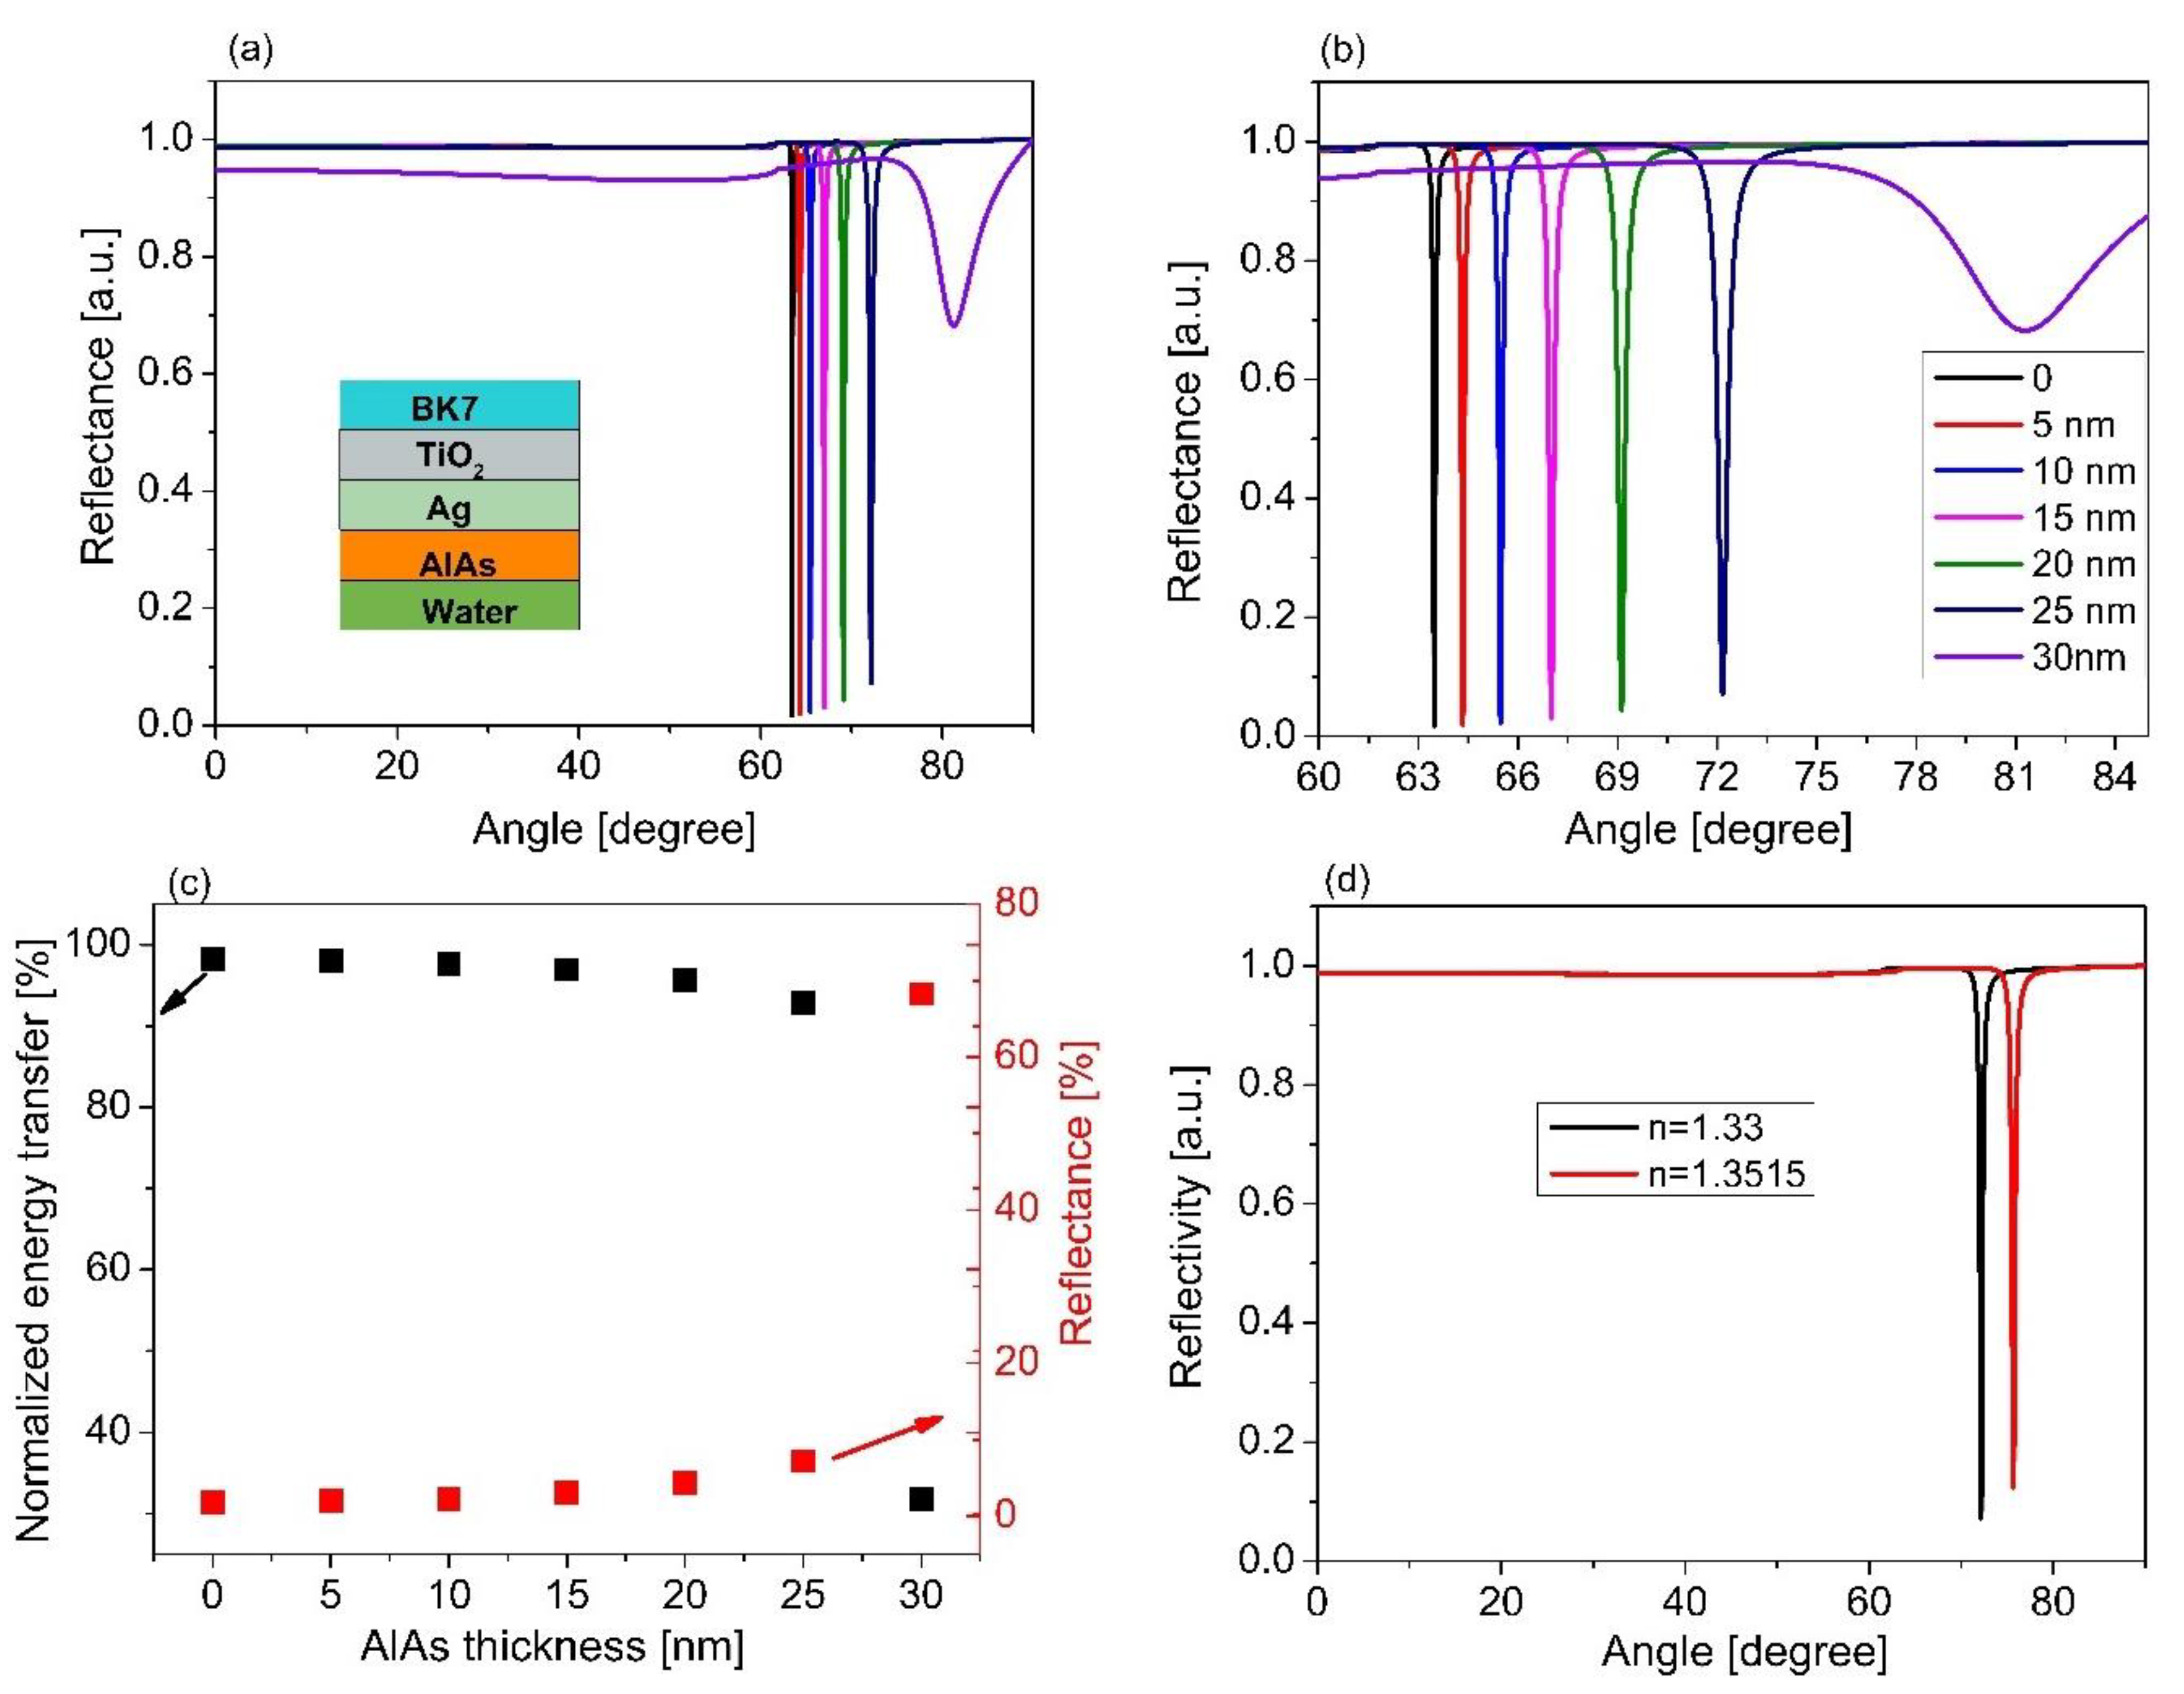
| TiO2/Ag/AlAs-coated prism | 1.33–1.3515 | 1064 nm | ~150 RIU−1 | This work |
| ZnO-coated U-shaped fiber | 1.34–1.42 | 350–600 nm | ~2.4 RIU−1 | [54] |
| Au-coated fiber | 1.3345–1.3592 | 300–800 nm | ~21.2 RIU−1 | [55] |
| Au-coated tapered coreless fiber | 1.33–1.391 | 350–1000 nm | ~12.6 RIU−1 | [56] |
| Au-coated hetero-core structure fiber | 1.333–1385 | 300–1700 nm | ~33.8 RIU−1 | [57] |
| S-tapered fiber | 1.332–1.387 | 1200–1600 nm | ~125.5 RIU−1 | [58] |
| Au-coated fiber | 1.30–1.34 | 300–1700 nm | ~61.2 RIU−1 | [59] |
| Au-coated few-mode fiber | 1.333–1.404 | 300–1100 nm | ~42.2 RIU−1 | [60] |
| Au-coated hetero-core structure fiber | 1.333–1.3836 | 400–800 nm | ~530 RIU−1 | [61] |
| Au-coated fiber | 1.335–1.385 | 360–1700 nm | ~13.9 RIU−1 | [62] |
| S-tapered fiber | 1.336–1.340 | 1520–1580 nm | ~96.1 RIU−1 | [63] |
| Ag/Au/MoS2-coated optical fiber | 1.33–1.37 | 300–700 nm | ~23.29 RIU−1 | [64] |
| Au-coated plastic optical fiber | 1.34–1.42 | 360–2500 nm | ~25.4 RIU−1 | [65] |
4. Conclusions
Author Contributions
Funding
Acknowledgments
Conflicts of Interest
References
- Quinn, J.G.; O’Neill, S.; Doyle, A.; McAtamney, C.; Diamond, D.; MacCraith, B.D.; O’Kennedy, R. Development and application of surface plasmon resonance-based biosensors for the detection of cell–ligand interactions. Anal. Biochem. 2000, 281, 135–143. [Google Scholar] [CrossRef] [Green Version]
- Chiu, M.H.; Shih, C.H.; Chi, M.H. Optimum sensitivity of single-mode D-type optical fiber sensor in the intensity measurement. Sens. Actuators B Chem. 2007, 123, 1120–1124. [Google Scholar] [CrossRef]
- Jang, H.S.; Park, K.N.; Kang, C.D.; Kim, J.P.; Sim, S.J.; Lee, K.S. Optical fiber SPR biosensor with sandwich assay for the detection of prostate specific antigen. Opt. Commun. 2009, 282, 2827–2830. [Google Scholar] [CrossRef]
- Yanase, Y.; Araki, A.; Suzuki, H.; Tsutsui, T.; Kimura, T.; Okamoto, K.; Hide, M. Development of an optical fiber SPR sensor for living cell activation. Biosens. Bioelectron. 2010, 25, 1244–1247. [Google Scholar] [CrossRef] [Green Version]
- Kretschmann, E.; Raether, H. Notizen: Radiative decay of non-radiative surface plasmons excited by light. Z. Nat. A 1968, 23, 2135–2136. [Google Scholar] [CrossRef]
- Wu, S.Y.; Ho, H.P.; Law, W.C.; Lin, C.; Kong, S.K. Highly sensitive differential phase-sensitive surface plasmon resonance biosensor based on the Mach–Zehnder configuration. Opt. Lett. 2004, 29, 2378–2380. [Google Scholar] [CrossRef]
- Telezhnikova, O.; Homola, J. New approach to spectroscopy of surface plasmons. Opt. Lett. 2006, 31, 3339–3341. [Google Scholar] [CrossRef]
- Yuan, W.; Ho, H.P.; Wong, C.L.; Kong, S.K.; Lin, C. Surface plasmon resonance biosensor incorporated in a Michelson interferometer with enhanced sensitivity. IEEE Sens. J. 2007, 7, 70–73. [Google Scholar] [CrossRef]
- Yang, X.; Yuan, Y.; Dai, Z.; Liu, F.; Huang, J. Optical property and adsorption isotherm models of glucose sensitive membrane based on prism SPR sensor. Sens. Actuators B Chem. 2016, 237, 150–158. [Google Scholar] [CrossRef]
- Mitsushio, M.; Miyashita, K.; Higo, M. Sensor properties and surface characterization of the metal-deposited SPR optical fiber sensors with Au, Ag, Cu, and Al. Sens. Actuators A Phys. 2006, 125, 296–303. [Google Scholar] [CrossRef]
- Vema, R.K.; Sharma, A.K.; Gupta, B.D. Surface plasmon resonance based tapered fiber optic sensor with different taper profiles. Opt. Commun. 2008, 281, 1486–1491. [Google Scholar]
- Nguyen, T.T.; Lee, E.C.; Ju, H. Bimetal coated optical fiber sensors based on surface plasmon resonance induced change in birefringence and intensity. Opt. Express 2014, 22, 5590–5598. [Google Scholar] [CrossRef] [PubMed]
- Nguyen, T.T.; Bea, S.O.; Kim, D.M.; Yoon, W.J.; Park, J.W.; An, S.S.A.; Ju, H. A regenerative label-free fiber optic sensor using surface plasmon resonance for clinical diagnosis of fibrinogen. Int. J. Nanomed. 2015, 10, 155. [Google Scholar]
- Zhao, Y.; Lei, M.; Liu, S.X.; Zhao, Q. Smart hydrogel-based optical fiber SPR sensor for pH measurements. Sens. Actuators B Chem. 2018, 261, 226–232. [Google Scholar] [CrossRef]
- Zhou, X.; Li, X.; Cheng, T.; Li, S.; An, G. Graphene enhanced optical fiber SPR sensor for liquid concentration measurement. Opt. Fiber Technol. 2018, 43, 62–66. [Google Scholar] [CrossRef]
- Chung, Y.K.; Reboud, J.; Lee, K.C.; Lim, H.M.; Lim, P.Y.; Wang, K.Y.; Chen, Y. An electrical biosensor for the detection of circulating tumor cells. Biosens. Bioelectron. 2011, 26, 2520–2526. [Google Scholar] [CrossRef]
- Kim, J.; Kim, S.; Nguyen, T.T.; Lee, R.; Li, T.; Yun, C.; Ju, H. Label-free quantitative immunoassay of fibrinogen in alzheimer disease patient plasma using fiber optical surface plasmon resonance. J. Electron. Mater. 2016, 45, 2354–2360. [Google Scholar] [CrossRef]
- Nu, T.T.V.; Tran, N.H.T.; Nam, E.; Nguyen, T.T.; Yoon, W.J.; Cho, S.; Ju, H. Blood-based immunoassay of tau proteins for early diagnosis of Alzheimer’s disease using surface plasmon resonance fiber sensors. RSC Adv. 2018, 8, 7855–7862. [Google Scholar] [CrossRef] [Green Version]
- Souto, D.E.; Volpe, J.; Gonçalves, C.D.C.; Ramos, C.H.; Kubota, L.T. A brief review on the strategy of developing SPR-based biosensors for application to the diagnosis of neglected tropical diseases. Talanta 2019, 205, 120122. [Google Scholar] [CrossRef]
- Srivastava, S.K.; Abdulhalim, I. Spectral interrogation based SPR sensor for blood glucose detection with improved sensitivity and stability. J. Biosens. Bioelectron. 2015, 6, 10–12. [Google Scholar]
- Mudgal, N.; Saharia, A.; Agarwal, A.; Ali, J.; Yupapin, P.; Singh, G. Modeling of highly sensitive surface plasmon resonance (SPR) sensor for urine glucose detection. Opt. Quantum Electron. 2020, 52, 1–14. [Google Scholar] [CrossRef]
- Croci, L.; Delibato, E.; Volpe, G.; De Medici, D.; Palleschi, G. Comparison of PCR, electrochemical enzyme-linked immunosorbent assays, and the standard culture method for detecting Salmonella in meat products. Appl. Environ. Microbiol. 2004, 70, 1393–1396. [Google Scholar] [CrossRef] [PubMed] [Green Version]
- Taylor, A.D.; Ladd, J.; Yu, Q.; Chen, S.; Homola, J.; Jiang, S. Quantitative and simultaneous detection of four foodborne bacterial pathogens with a multi-channel SPR sensor. Biosens. Bioelectron. 2006, 22, 752–758. [Google Scholar] [CrossRef] [PubMed]
- Vaisocherová-Lísalová, H.; Víšová, I.; Ermini, M.L.; Špringer, T.; Song, X.C.; Mrázek, J.; Homola, J. Low-fouling surface plasmon resonance biosensor for multi-step detection of foodborne bacterial pathogens in complex food samples. Biosens. Bioelectron. 2016, 80, 84–90. [Google Scholar] [CrossRef] [PubMed]
- Kabashin, A.V.; Evans, P.; Pastkovsky, S.; Hendren, W.; Wurtz, G.A.; Atkinson, R.; Pollard, V.A.; Podolskiy, R.; Zayats, A.V. Plasmonic nanorod metamaterials for biosensing. Nat. Mater. 2009, 8, 867–871. [Google Scholar] [CrossRef]
- Sreekanth, K.V.; Alapan, Y.; ElKabbash, M.; Ilker, E.; Hinczewski, M.; Gurkan, U.A.; Luca, A.D.; Strangi, G. Extreme sensitivity biosensing platform based on hyperbolic metamaterials. Nat. Mater. 2016, 15, 621–627. [Google Scholar] [CrossRef] [Green Version]
- Garoli, D.; Calandrini, E.; Giovannini, G.; Hubarevich, A.; Caligiuri, V.; De Angelis, F. Nanoporous gold metamaterials for high sensitivity plasmonic sensing. Nanoscale Horiz. 2019, 4, 1153–1157. [Google Scholar] [CrossRef]
- Nguyen, T.T.; Trinh, K.T.L.; Yoon, W.J.; Lee, N.Y.; Ju, H. Integration of a microfluidic polymerase chain reaction device and surface plasmon resonance fiber sensor into an inline all-in-one platform for pathogenic bacteria detection. Sens. Actuators B Chem. 2017, 242, 1–8. [Google Scholar] [CrossRef]
- Jha, R.; Sharma, A.K. High-performance sensor based on surface plasmon resonance with chalcogenide prism and aluminum for detection in infrared. Opt. Lett. 2009, 34, 749–751. [Google Scholar] [CrossRef]
- Pandey, A.K.; Sharma, A.K. Simulation and analysis of plasmonic sensor in NIR with fluoride glass and graphene layer. Photonics Nanostruct. Fundam. Appl. 2018, 28, 94–99. [Google Scholar] [CrossRef]
- Van Sau, N.; Ngo, Q.M.; Phan, T.B.; Tran, N.Q.; Nguyen, T.T. Optical Biosensor Using Near Infrared Laser for Enhancement of Detection Accuracy. J. Electron. Mater. 2020, 49, 7420–7426. [Google Scholar] [CrossRef]
- Liu, C.; Wang, J.; Jin, X.; Wang, F.; Yang, L.; Lv, J.; Fu, G.; Li, X.; Liu, Q.; Sun, T.; et al. Near-infrared surface plasmon resonance sensor based on photonics crystal fiber with big open rings. Optik 2020, 207, 164466. [Google Scholar] [CrossRef]
- Iga, M.; Seki, A.; Watanabe, K. Hetero-core structured fiber optic surface plasmon resonance sensor with silver film. Sens. Actuators B Chem. 2004, 101, 368–372. [Google Scholar] [CrossRef]
- Sharma, A.K.; Gupta, B.D. Fiber optic sensor based on surface plasmon resonance with nanoparticle films. Photonics Nanostruct. Fundam. Appl. 2005, 3, 30–37. [Google Scholar] [CrossRef]
- Zynio, S.A.; Samoylov, A.V.; Surovtseval, E.R.; Mirsky, V.M.; Shirshov, Y.M. Bimetallic layers increase sensitivity of affinity sensors based on surface plasmon resonance. Sensors 2002, 2, 62–70. [Google Scholar] [CrossRef] [Green Version]
- Csete, M.; Kohazi-Kis, A.; Vass, C.S.; Sipos, A.; Szekeres, G.; Deli, M.; Osvay, K.; Bor, Z.S. Atomic force microscopical and surface plasmon resonance spectroscopical investigation of sub-micrometer metal gratings generated by UV laser based two beam interference in Au-Ag bimetallic layers. Appl. Surf. Sci. 2007, 253, 7662–7671. [Google Scholar] [CrossRef]
- Gao, D.; Guan, C.; Wen, Y.; Zhong, X.; Yuan, L. Multi-hole fiber based surface plasmon resonance sensor operated at near-infrared wavelengths. Opt. Commun. 2014, 313, 94–98. [Google Scholar] [CrossRef]
- Shafieyan, A.R.; Ranjbar, M.; Kameli, P. Localized surface plasmon resonance H2 detection by MoO3 colloidal nanoparticles fabricated by the flame synthesis method. Int. J. Hydrog. Energy 2019, 44, 18628–18638. [Google Scholar] [CrossRef]
- Tabassum, R.; Gupta, B.D. Simultaneous tuning of electric field intensity and structural properties of ZnO: Graphene nanostructures for FOSPR based nicotine sensor. Biosens. Bioelectron. 2017, 91, 762–769. [Google Scholar] [CrossRef] [PubMed]
- Passian, A.; Imam, N. Nanosystems, edge computing, and the next generation computing systems. Sensors 2019, 19, 4048. [Google Scholar] [CrossRef] [Green Version]
- Saad, Y.; Selmi, M.; Gazzah, M.H.; Belmabrouk, H. Theoritical evaluation of a fiber-optic SPR biosensor based on a gold layer treated with thiol acid. EPJ Appl. Phys. 2018, 82, 31210. [Google Scholar] [CrossRef]
- Ding, L.; Li, Y.Q.; Liu, X.Y.; Shen, J.H.; Zhang, S.H.; Guo, F.M. Weak light characteristics of potential biosensor unit. Micro Nano Lett. 2013, 8, 594–597. [Google Scholar] [CrossRef]
- Nazemi, E.; Aithal, S.; Hassen, W.M.; Frost, E.H.; Dubowski, J.J. GaAs/AlGaAs heterostructure based photonic biosensor for rapid detection of Escherichia coli in phosphate buffered saline solution. Sens. Actuators B Chem. 2015, 207, 556–562. [Google Scholar] [CrossRef]
- Tang, L.; Chun, I.S.; Wang, Z.; Li, J.; Li, X.; Lu, Y. DNA detection using plasmonic enhanced near-infrared photoluminescence of gallium arsenide. Anal. Chem. 2013, 85, 9522–9527. [Google Scholar] [CrossRef]
- El-Gohary, S.H.; Choi, M.; Kim, Y.L.; Byun, K.M. Dispersion curve engineering of TiO2/silver hybrid substrates for enhanced surface plasmon resonance detection. Sensors 2016, 16, 1442. [Google Scholar] [CrossRef] [PubMed] [Green Version]
- Jin, Z.; Guan, W.; Liu, C.; Xue, T.; Wang, Q.; Zheng, W.; Cui, X. A stable and high resolution optical waveguide biosensor based on dense TiO2/Ag multilayer film. Appl. Surf. Sci. 2016, 377, 207–212. [Google Scholar] [CrossRef]
- Werner, W.S.M.; Glantschnig, K.; Ambrosch-Draxl, C. Optical constants and inelastic electron-scattering data for 17 elemental metals. J. Phys. Chem. Ref. Data 2009, 38, 1013–1092. [Google Scholar] [CrossRef]
- Rakić, A.D.; Majewski, M.L. Modeling the optical dielectric function of GaAs and AlAs: Extension of Adachi’s model. J. Appl. Phys. 1996, 80, 5909–5914. [Google Scholar] [CrossRef] [Green Version]
- DeVore, J.R. Refractive indices of rutile and sphalerite. J. Opt. Soc. Am. 1951, 41, 416–419. [Google Scholar] [CrossRef]
- Aguilar, O.; de Castro, S.; Godoy, M.P.; Dias, M.R.S. Optoelectronic characterization of Zn1−xCdxO thin films as an alternative to photonic crystals in organic solar cells. Opt. Mater. Express 2019, 9, 3638–3648. [Google Scholar] [CrossRef]
- Lajaunie, L.; Boucher, F.; Dessapt, R.; Moreau, P. Strong anisotropic influence of local-field effects on the dielectric response of α-MoO3. Phys. Rev. B 2013, 88, 115141. [Google Scholar] [CrossRef] [Green Version]
- Johnston, K.S.; Karlsen, S.R.; Jung, C.C.; Yee, S.S. New analytical technique for characterization of thin films using surface plasmon resonance. Mater. Chem. Phys. 1995, 42, 242–246. [Google Scholar] [CrossRef]
- Gupta, B.D.; Sharma Anuj, K. Sensitivity evaluation of a multi-layered surface plasmon resonance based fiber optic sensor: A theoretical study. Sens. Actuators B Chem. 2005, 107, 40–46. [Google Scholar] [CrossRef]
- Paliwal, N.; Punjabi, N.; John, J.; Mukherji, S. Design and fabrication of lossy mode resonance based U-shaped fiber optic refractometer utilizing dual sensing phenomenon. J. Lightw. Technol. 2016, 34, 4187–4194. [Google Scholar] [CrossRef]
- Wang, W.; Mai, Z.; Chen, Y.; Wang, J.; Li, L.; Su, Q.; Li, X.; Hong, X. A label-free fiber optic SPR biosensor for specific detection of C-reactive protein. Sci. Rep. 2017, 7, 1–8. [Google Scholar] [CrossRef]
- Ding, Z.W.; Lang, T.T.; Wang, Y.; Zhao, C.L. Surface plasmon resonance refractive index sensor based on tapered coreless optical fiber structure. J. Lightw. Technol. 2017, 35, 4734–4739. [Google Scholar] [CrossRef]
- Liu, Z.; Liu, L.; Zhu, Z.; Zhang, Y.; Wei, Y.; Zhang, Y.; Yang, J.; Yuan, L. Dual-channel surface plasmon resonance refractive index sensor based on modified hetero-core structure fiber. Opt. Commun. 2017, 403, 290–295. [Google Scholar] [CrossRef]
- Chen, C.; Yang, R.; Zhang, X.Y.; Wei, W.H.; Guo, Q.; Zhang, X.; Qin, L.; Ning, Y.Q.; Yu, Y.S. Compact refractive index sensor based on an S-tapered fiber probe. Opt. Mater. Express 2018, 8, 919–925. [Google Scholar] [CrossRef]
- Cao, S.; Shao, Y.; Wang, Y.; Wu, T.; Zhang, L.; Huang, Y.; Zhang, F.; Liao, C.; He, J.; Wang, Y. Highly sensitive surface plasmon resonance biosensor based on a low-index polymer optical fiber. Opt. Express 2018, 26, 3988–3994. [Google Scholar] [CrossRef]
- Dong, J.; Zhang, Y.; Wang, Y.; Yang, F.; Hu, S.; Chen, Y.; Zhu, W.; Qiu, W.; Guan, H.; Lu, H. Side-polished few-mode fiber based surface plasmon resonance biosensor. Opt. Express 2019, 27, 11348–11360. [Google Scholar] [CrossRef] [PubMed]
- Zhang, R.; Pu, S.; Li, X. Gold-film-thickness dependent SPR refractive index and temperature sensing with hetero-core optical fiber structure. Sensors 2019, 19, 4345. [Google Scholar] [CrossRef] [Green Version]
- Cennamo, N.; Arcadio, F.; Minardo, A.; Montemurro, D.; Zeni, L. Experimental characterization of plasmonic sensors based on lab-built tapered plastic optical fibers. Appl. Sci. 2020, 10, 4389. [Google Scholar] [CrossRef]
- Wang, G.; Li, Z.; Wang, J.; Shen, J.; Zhang, M.; Huang, M. Fabrication and sensing characterization of an S-tapered fiber probe. AIP Adv. 2020, 10, 075306. [Google Scholar] [CrossRef]
- Wang, Q.; Jiang, X.; Niu, L.Y.; Fan, X.C. Enhanced sensitivity of bimetallic optical fiber SPR sensor based on MoS2 nanosheets. Opt. Laser Eng. 2020, 128, 105997. [Google Scholar] [CrossRef]
- Liu, L.; Deng, S.; Zheng, J.; Yuan, L.; Deng, H.; Teng, C. An enhanced plastic optical fiber-based surface plasmon resonance sensor with a double-sided polished structure. Sensors 2021, 21, 1516. [Google Scholar] [CrossRef] [PubMed]


| Materials | Wavelength (nm) | Dielectric Constant (εr + iεi) | References |
|---|---|---|---|
| Prism (BK7) | 1064 | 2.28 | [33] |
| Ag | 1064 | −66.26 + 5.83i | [47] |
| AlAs | 1064 | 8.64 | [48] |
| TiO2 | 1064 | 6.15 | [49] |
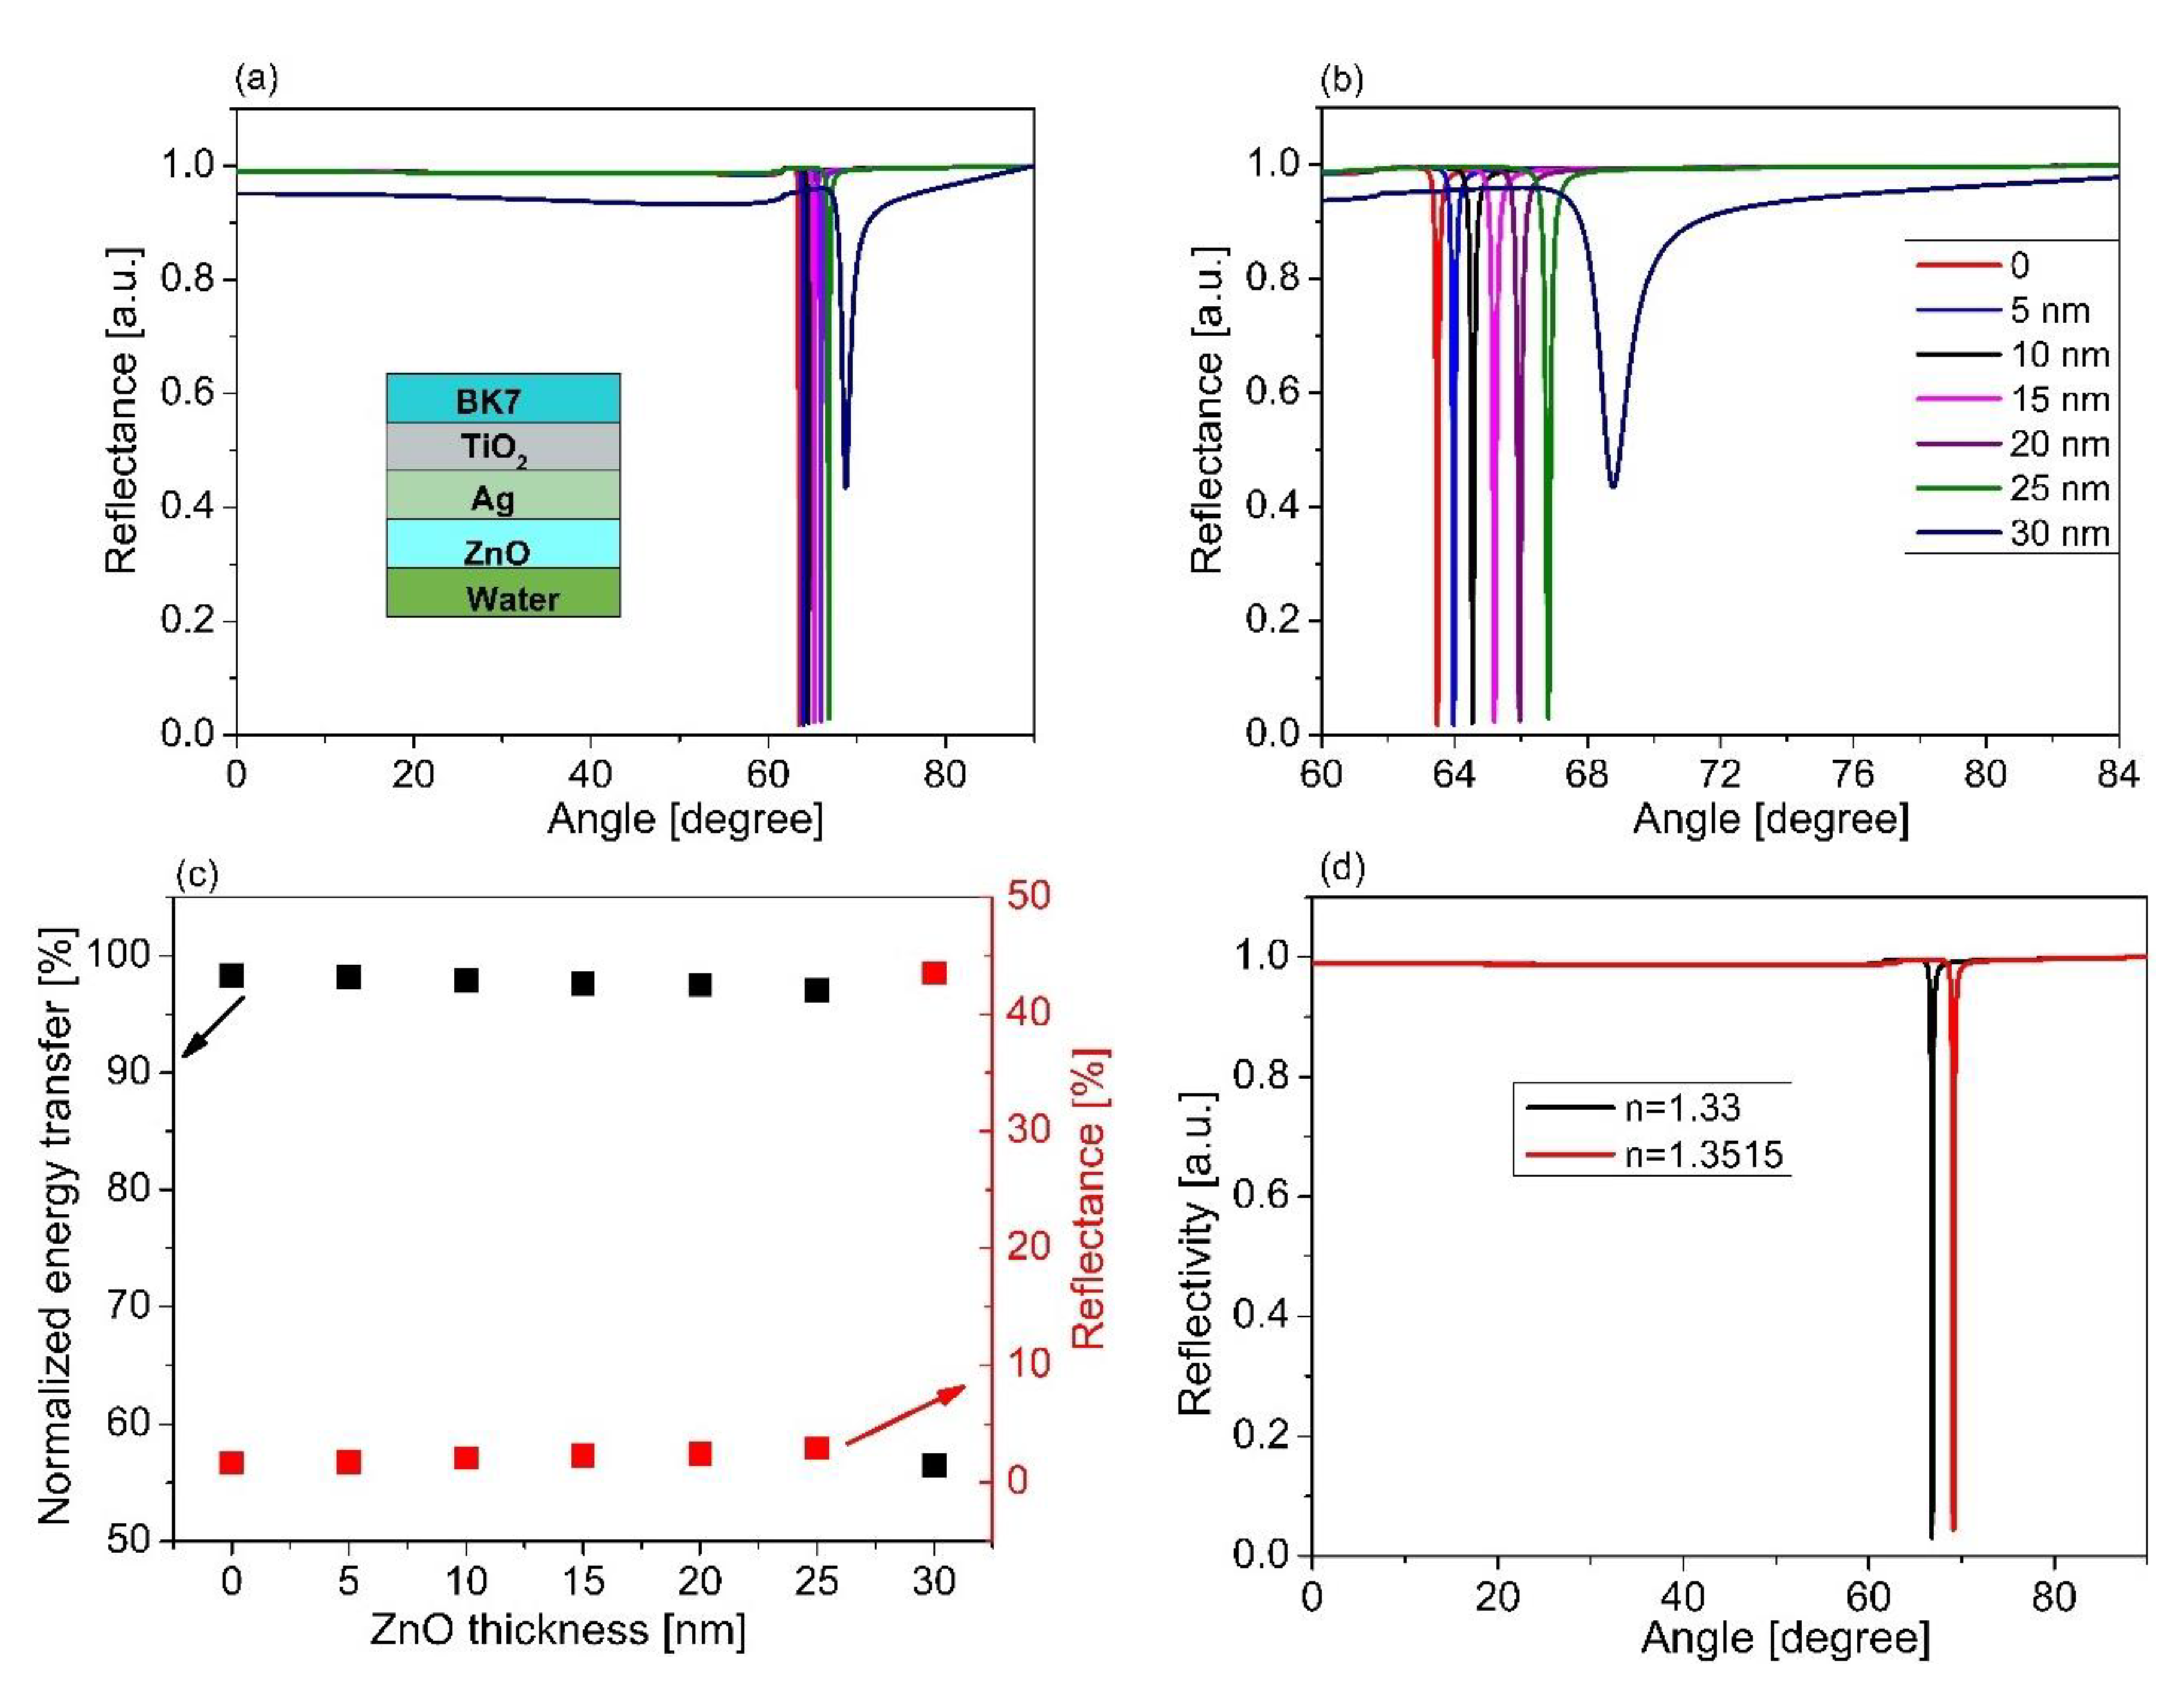
| ZnO | 1064 | 3.76 | [50] |
| MoO3 | 1064 | 4.33 + 0.011i | [51] |
| Wavelength (nm) | Minimum Energy Transfer Eo (a.u.) | Fitting Coefficients | ||
|---|---|---|---|---|
| α | β | R2 | ||
| 1064 nm | 163.22 | −0.06 | 7.91 | 0.89 |
| TiO2 | 80 nm | 100 nm | 120 nm | 140 nm | 160 nm |
|---|---|---|---|---|---|
| Sensor sensitivity (°/RIU) | 92.09 | 92.09 | 92.55 | 92.09 | 92.55 |
| Detection accuracy (/°) | 13.88 | 13.89 | 13.89 | 15.87 | 15.87 |
| Sensor Sensitivity So (°/RIU) | Fitting Coefficients | |||
|---|---|---|---|---|
| a | b | R2 | ||
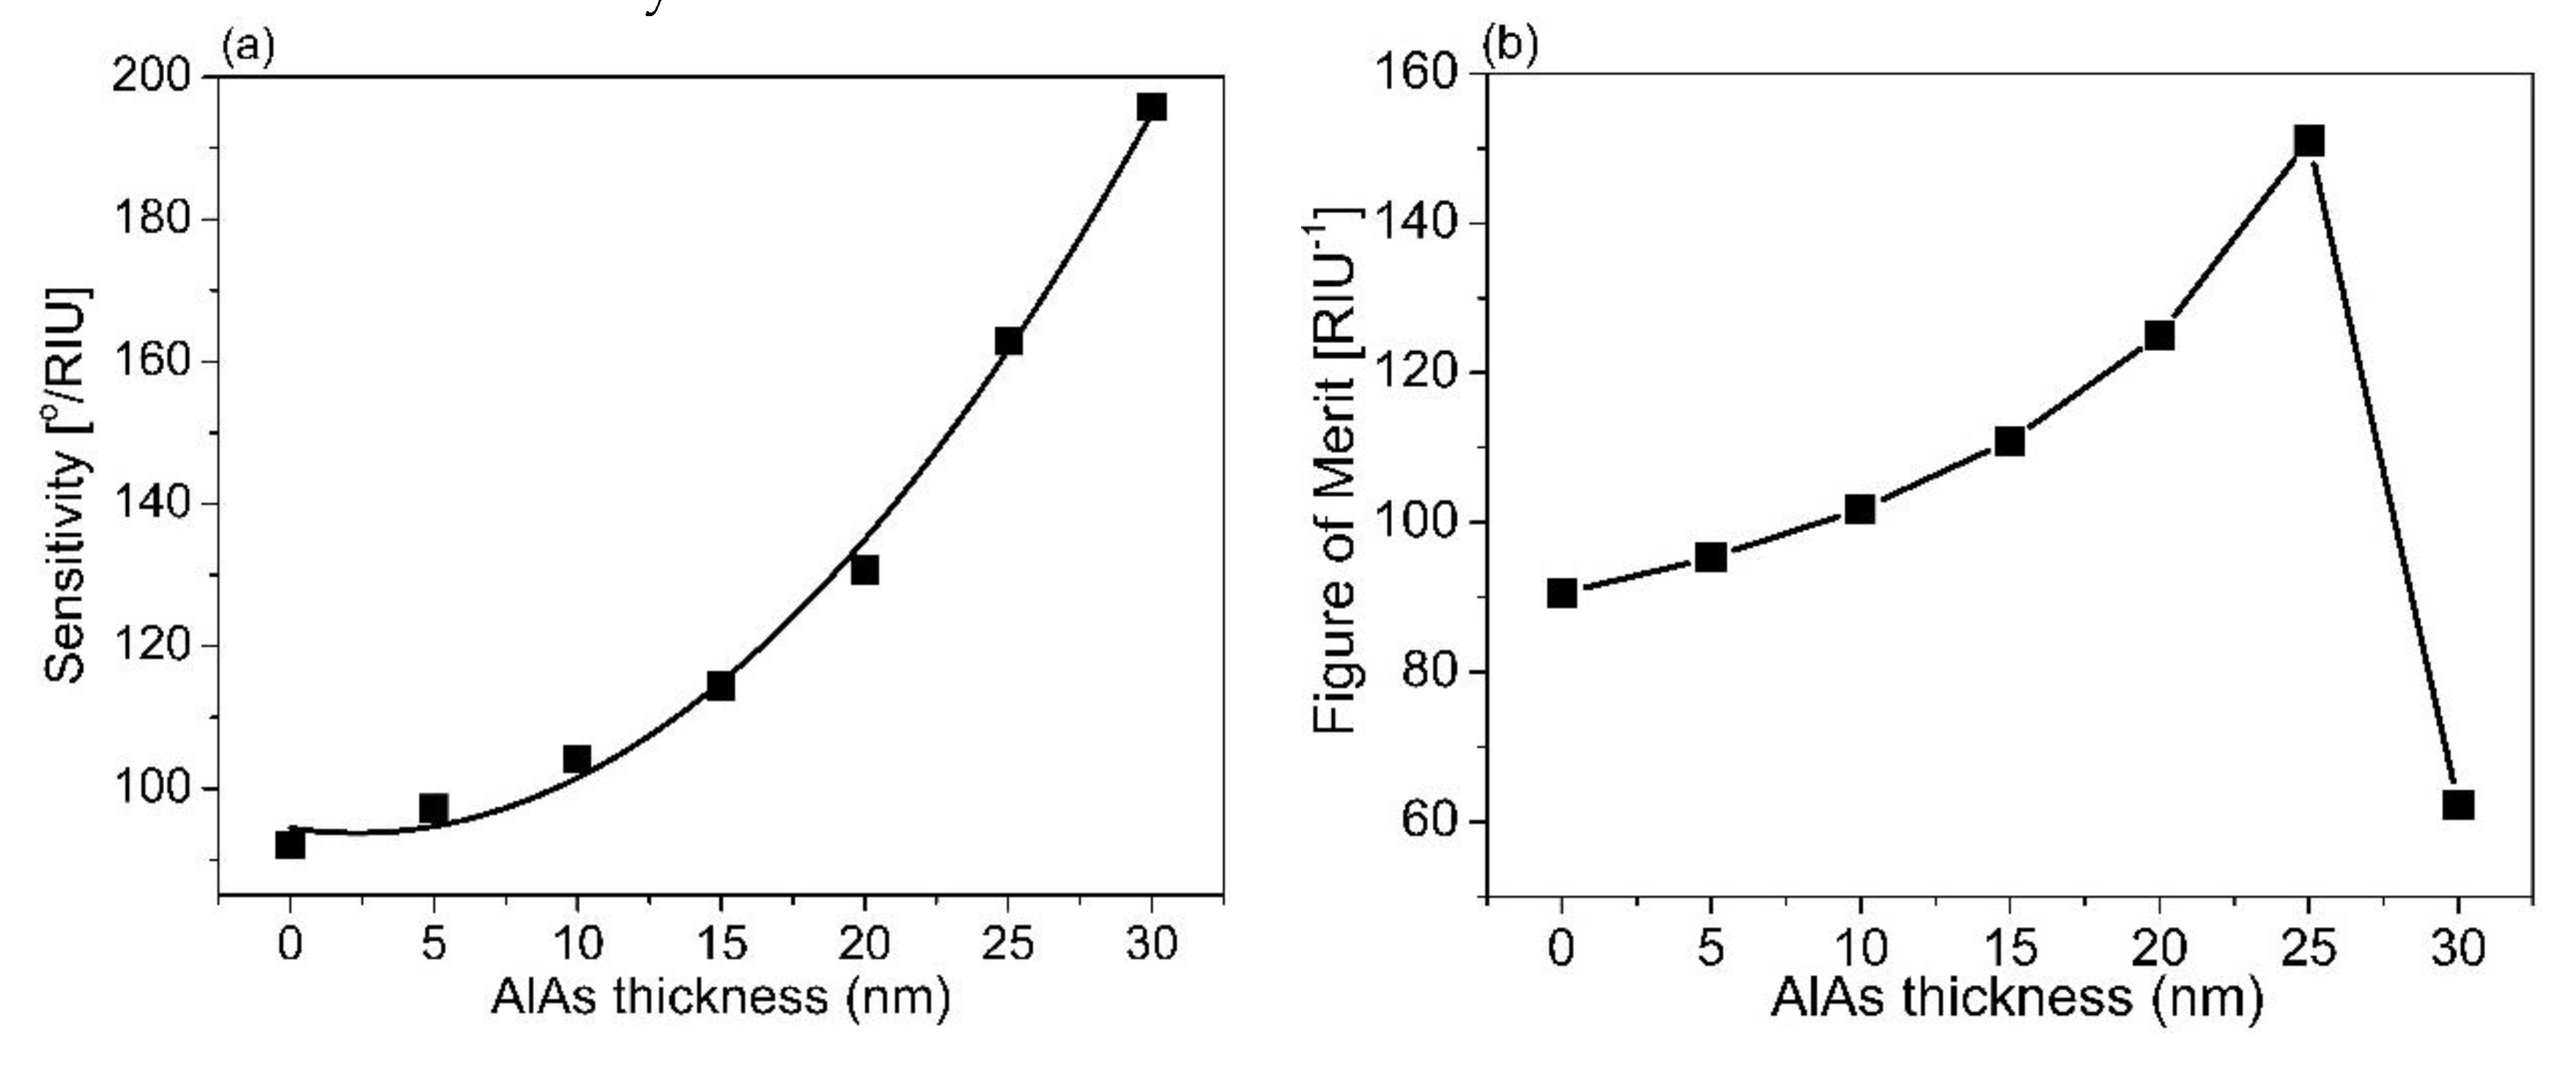
| AlAs | 94.45 | −0.61 | 0.13 | 0.99 |
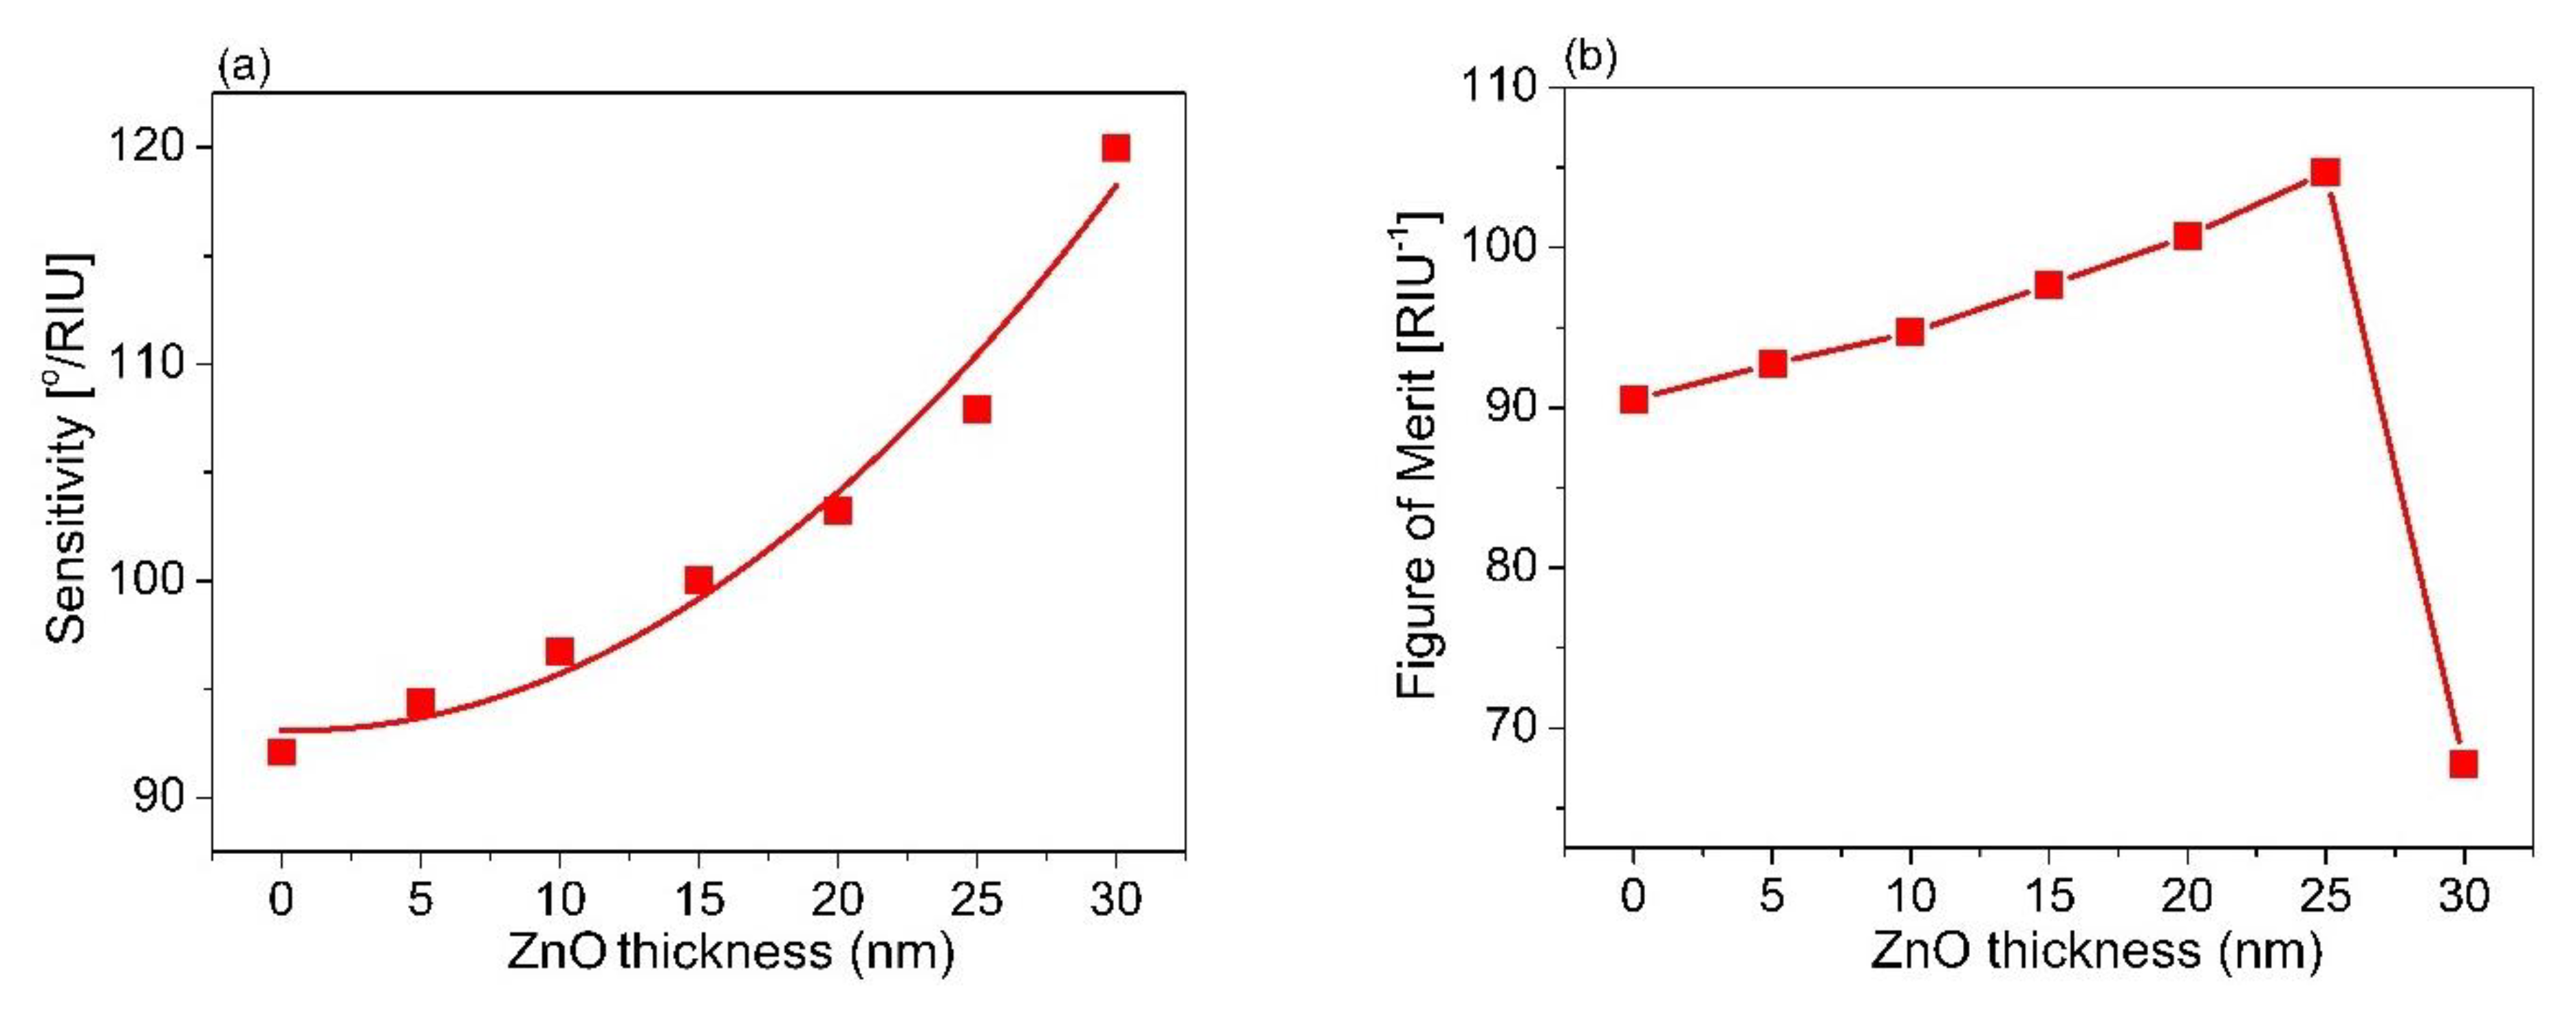
| ZnO | 93.11 | −0.03 | 0.03 | 0.96 |
| MoO3 | 93.55 | −0.14 | 0.04 | 0.96 |
Publisher’s Note: MDPI stays neutral with regard to jurisdictional claims in published maps and institutional affiliations. |
© 2021 by the authors. Licensee MDPI, Basel, Switzerland. This article is an open access article distributed under the terms and conditions of the Creative Commons Attribution (CC BY) license (https://creativecommons.org/licenses/by/4.0/).
Share and Cite
Nguyen, T.T.; Van Sau, N.; Ngo, Q.M.; Eppe, G.; Tran, N.Q.; Thi Phuong Anh, N. Enhanced Sensitivity and Detection of Near-Infrared Refractive Index Sensor with Plasmonic Multilayers. Sensors 2021, 21, 7056. https://0-doi-org.brum.beds.ac.uk/10.3390/s21217056
Nguyen TT, Van Sau N, Ngo QM, Eppe G, Tran NQ, Thi Phuong Anh N. Enhanced Sensitivity and Detection of Near-Infrared Refractive Index Sensor with Plasmonic Multilayers. Sensors. 2021; 21(21):7056. https://0-doi-org.brum.beds.ac.uk/10.3390/s21217056
Chicago/Turabian StyleNguyen, Tan Tai, Nguyen Van Sau, Quang Minh Ngo, Gauthier Eppe, Ngoc Quyen Tran, and Nguyen Thi Phuong Anh. 2021. "Enhanced Sensitivity and Detection of Near-Infrared Refractive Index Sensor with Plasmonic Multilayers" Sensors 21, no. 21: 7056. https://0-doi-org.brum.beds.ac.uk/10.3390/s21217056