
Experimental Detection and Measurement of Crack-Type Damage Features in Composite Thin-Wall Beams Using Modal Analysis


Abstract
:1. Introduction
2. Methodology Overview
2.1. General Metrics
2.1.1. Mode Shape Difference
2.1.2. Curvature of Mode Shapes
2.2. Metrics Used to Assess the Effect of Different Mesh Sizes
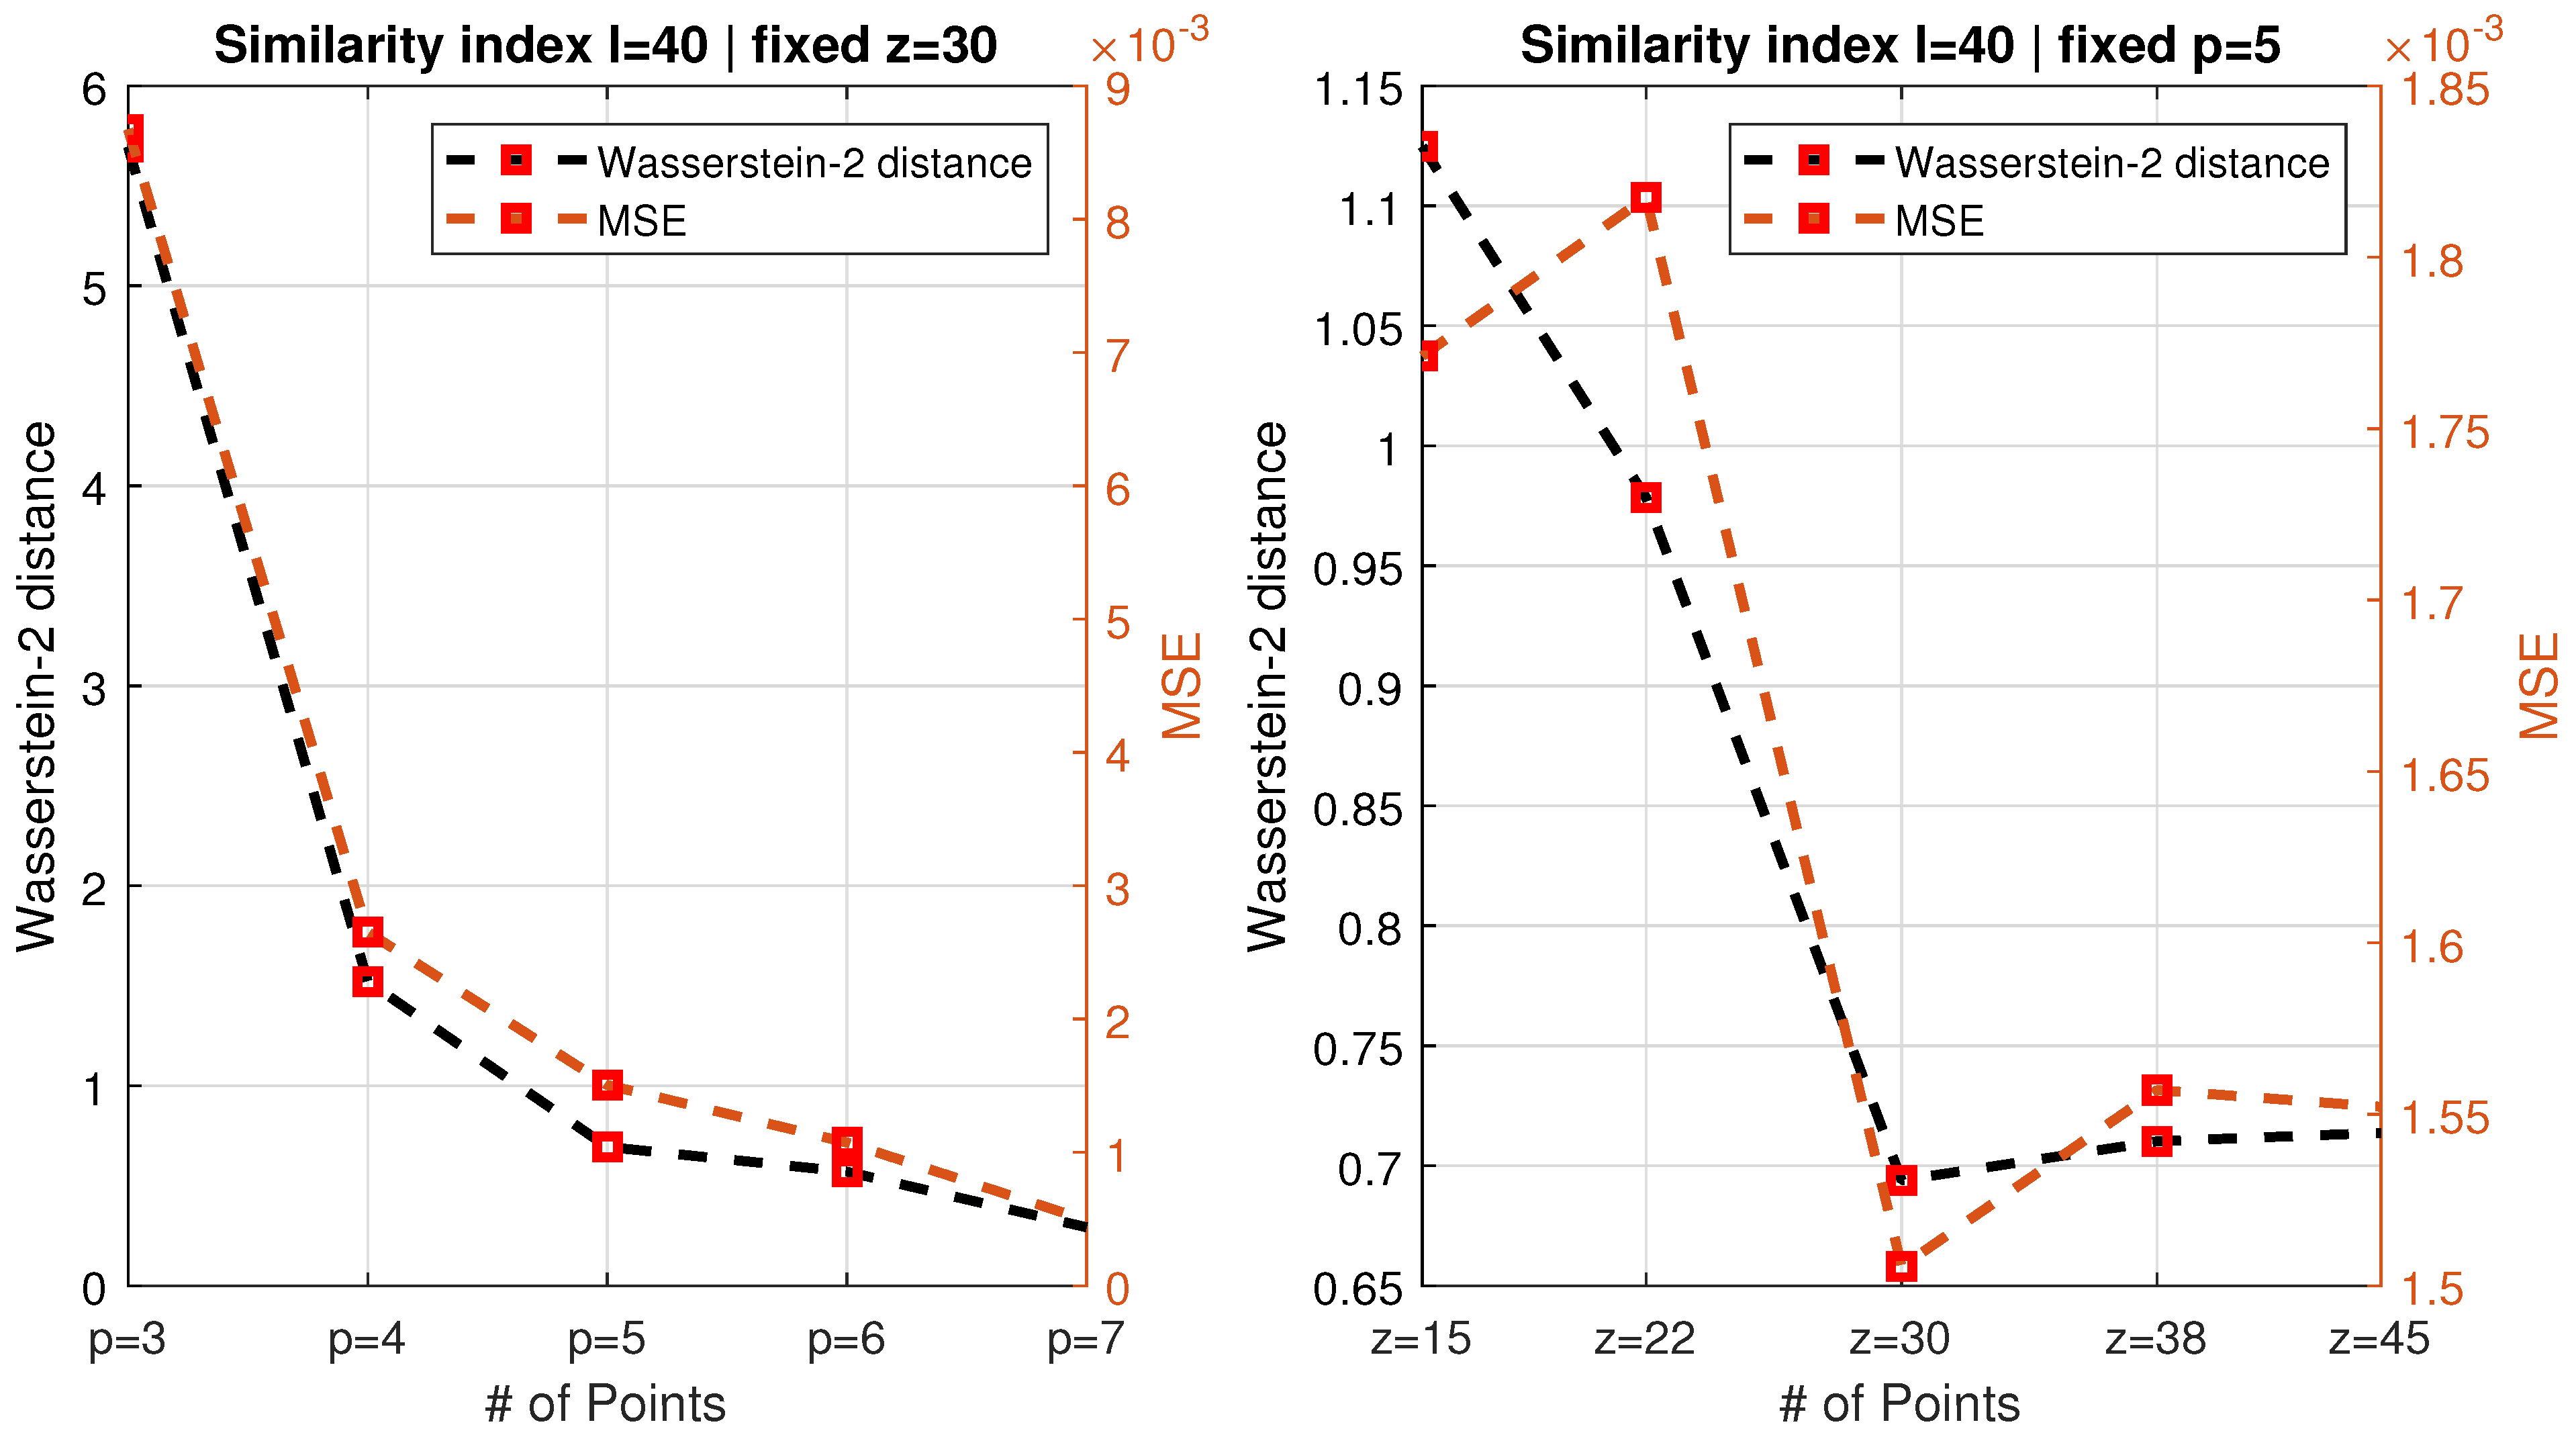
2.3. Fréchet Inception Distance or Wasserstein Metric
2.4. Mean Square Error
2.5. Data Acquisition and Processing
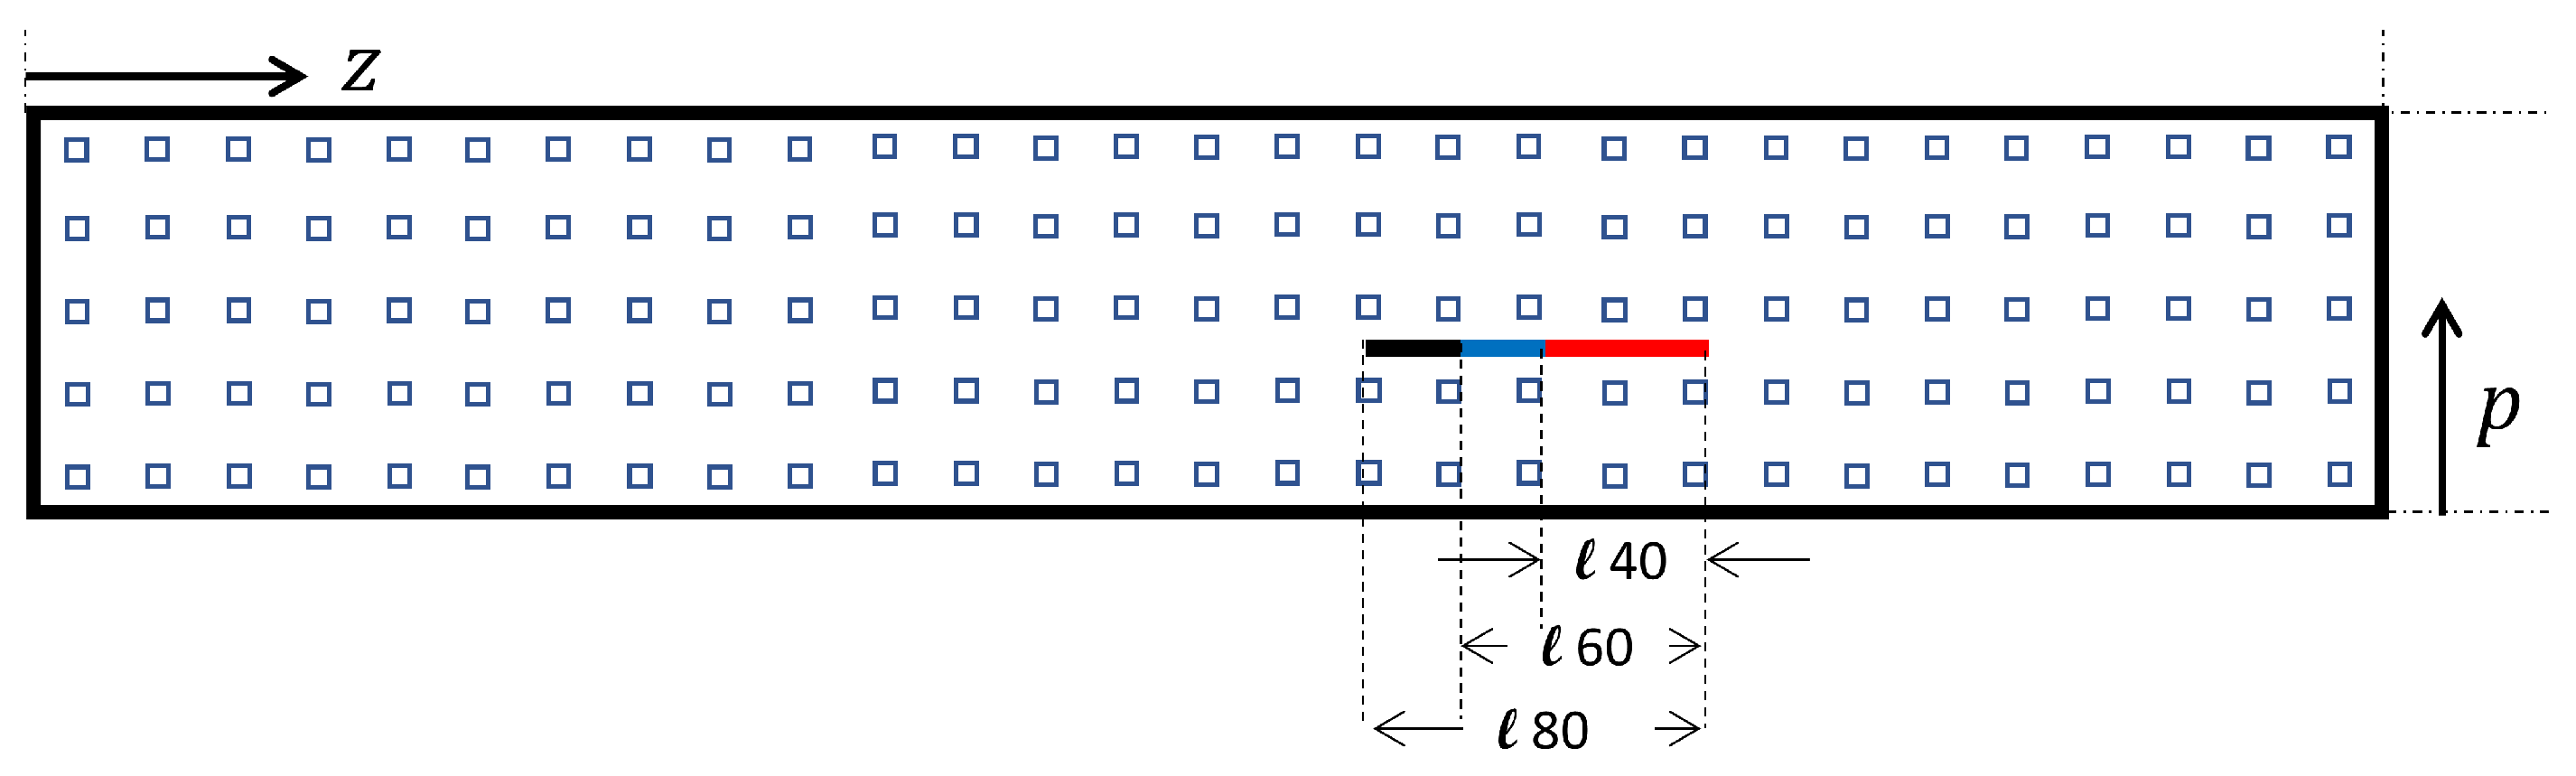
2.6. Sample Geometry and Simulation Setup
3. Determining the Optimal Mesh Size
4. Numerical Study
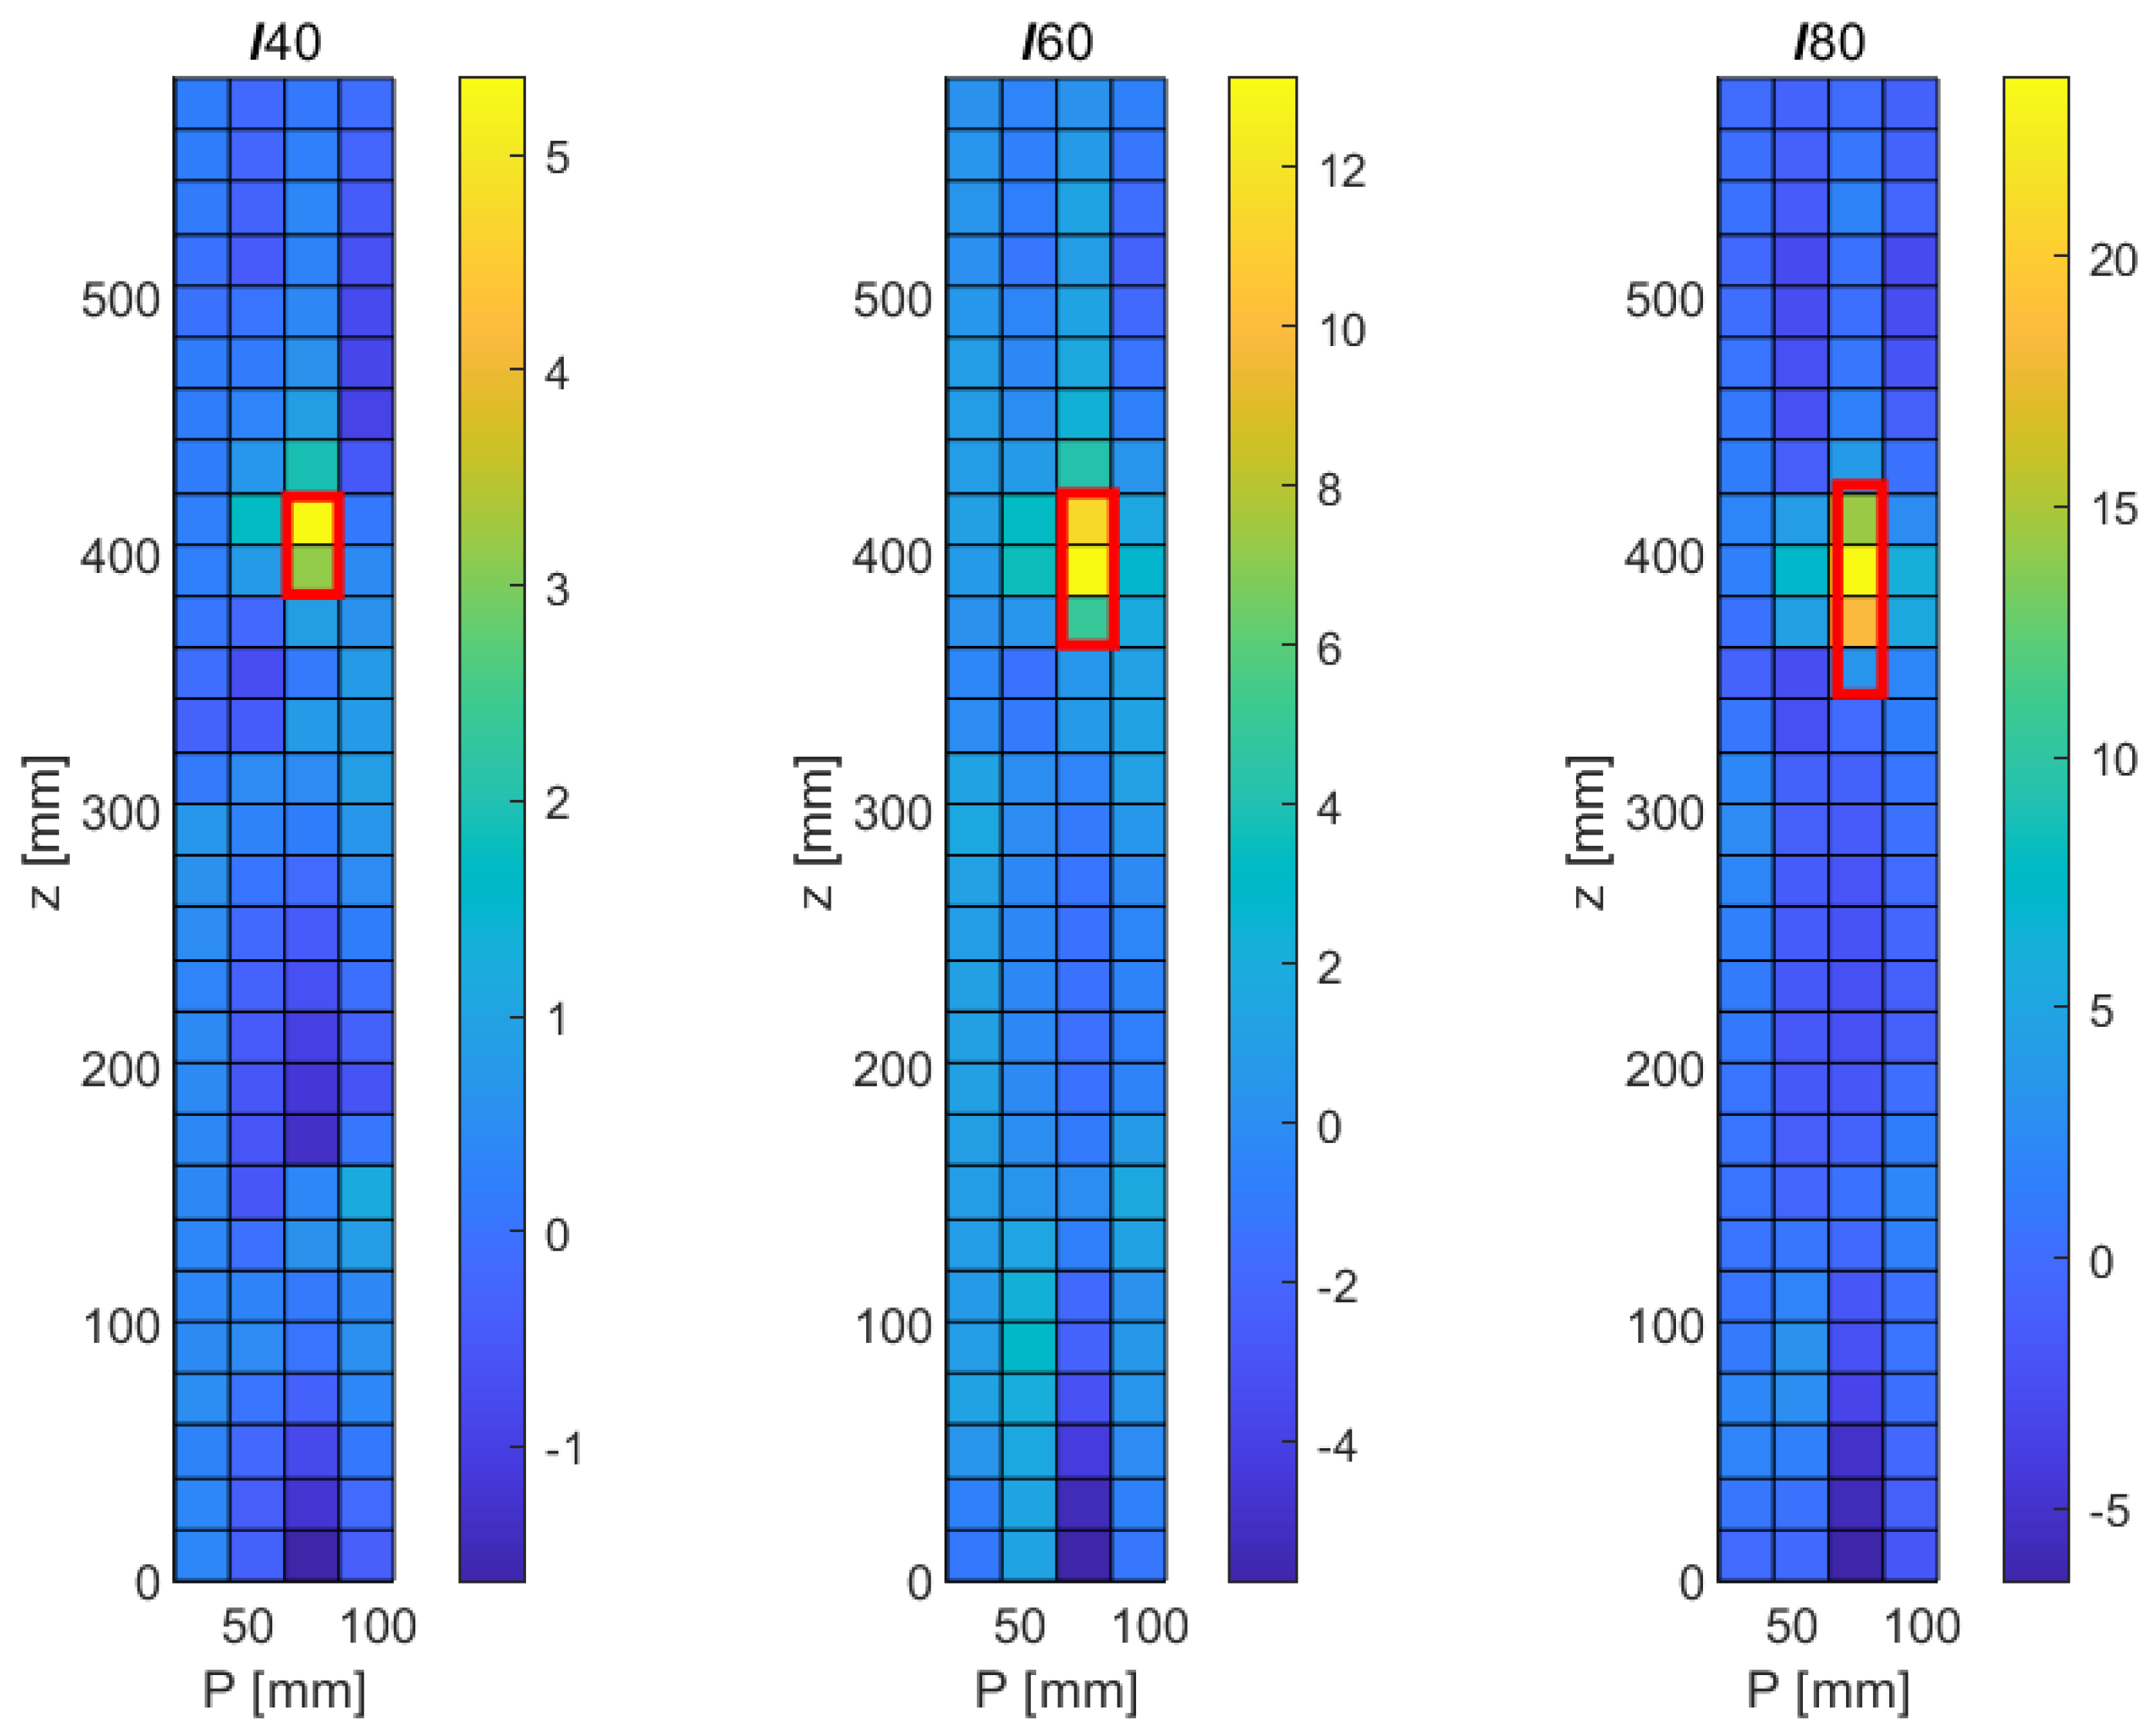
4.1. Numerical Results
5. Laboratory Experiments
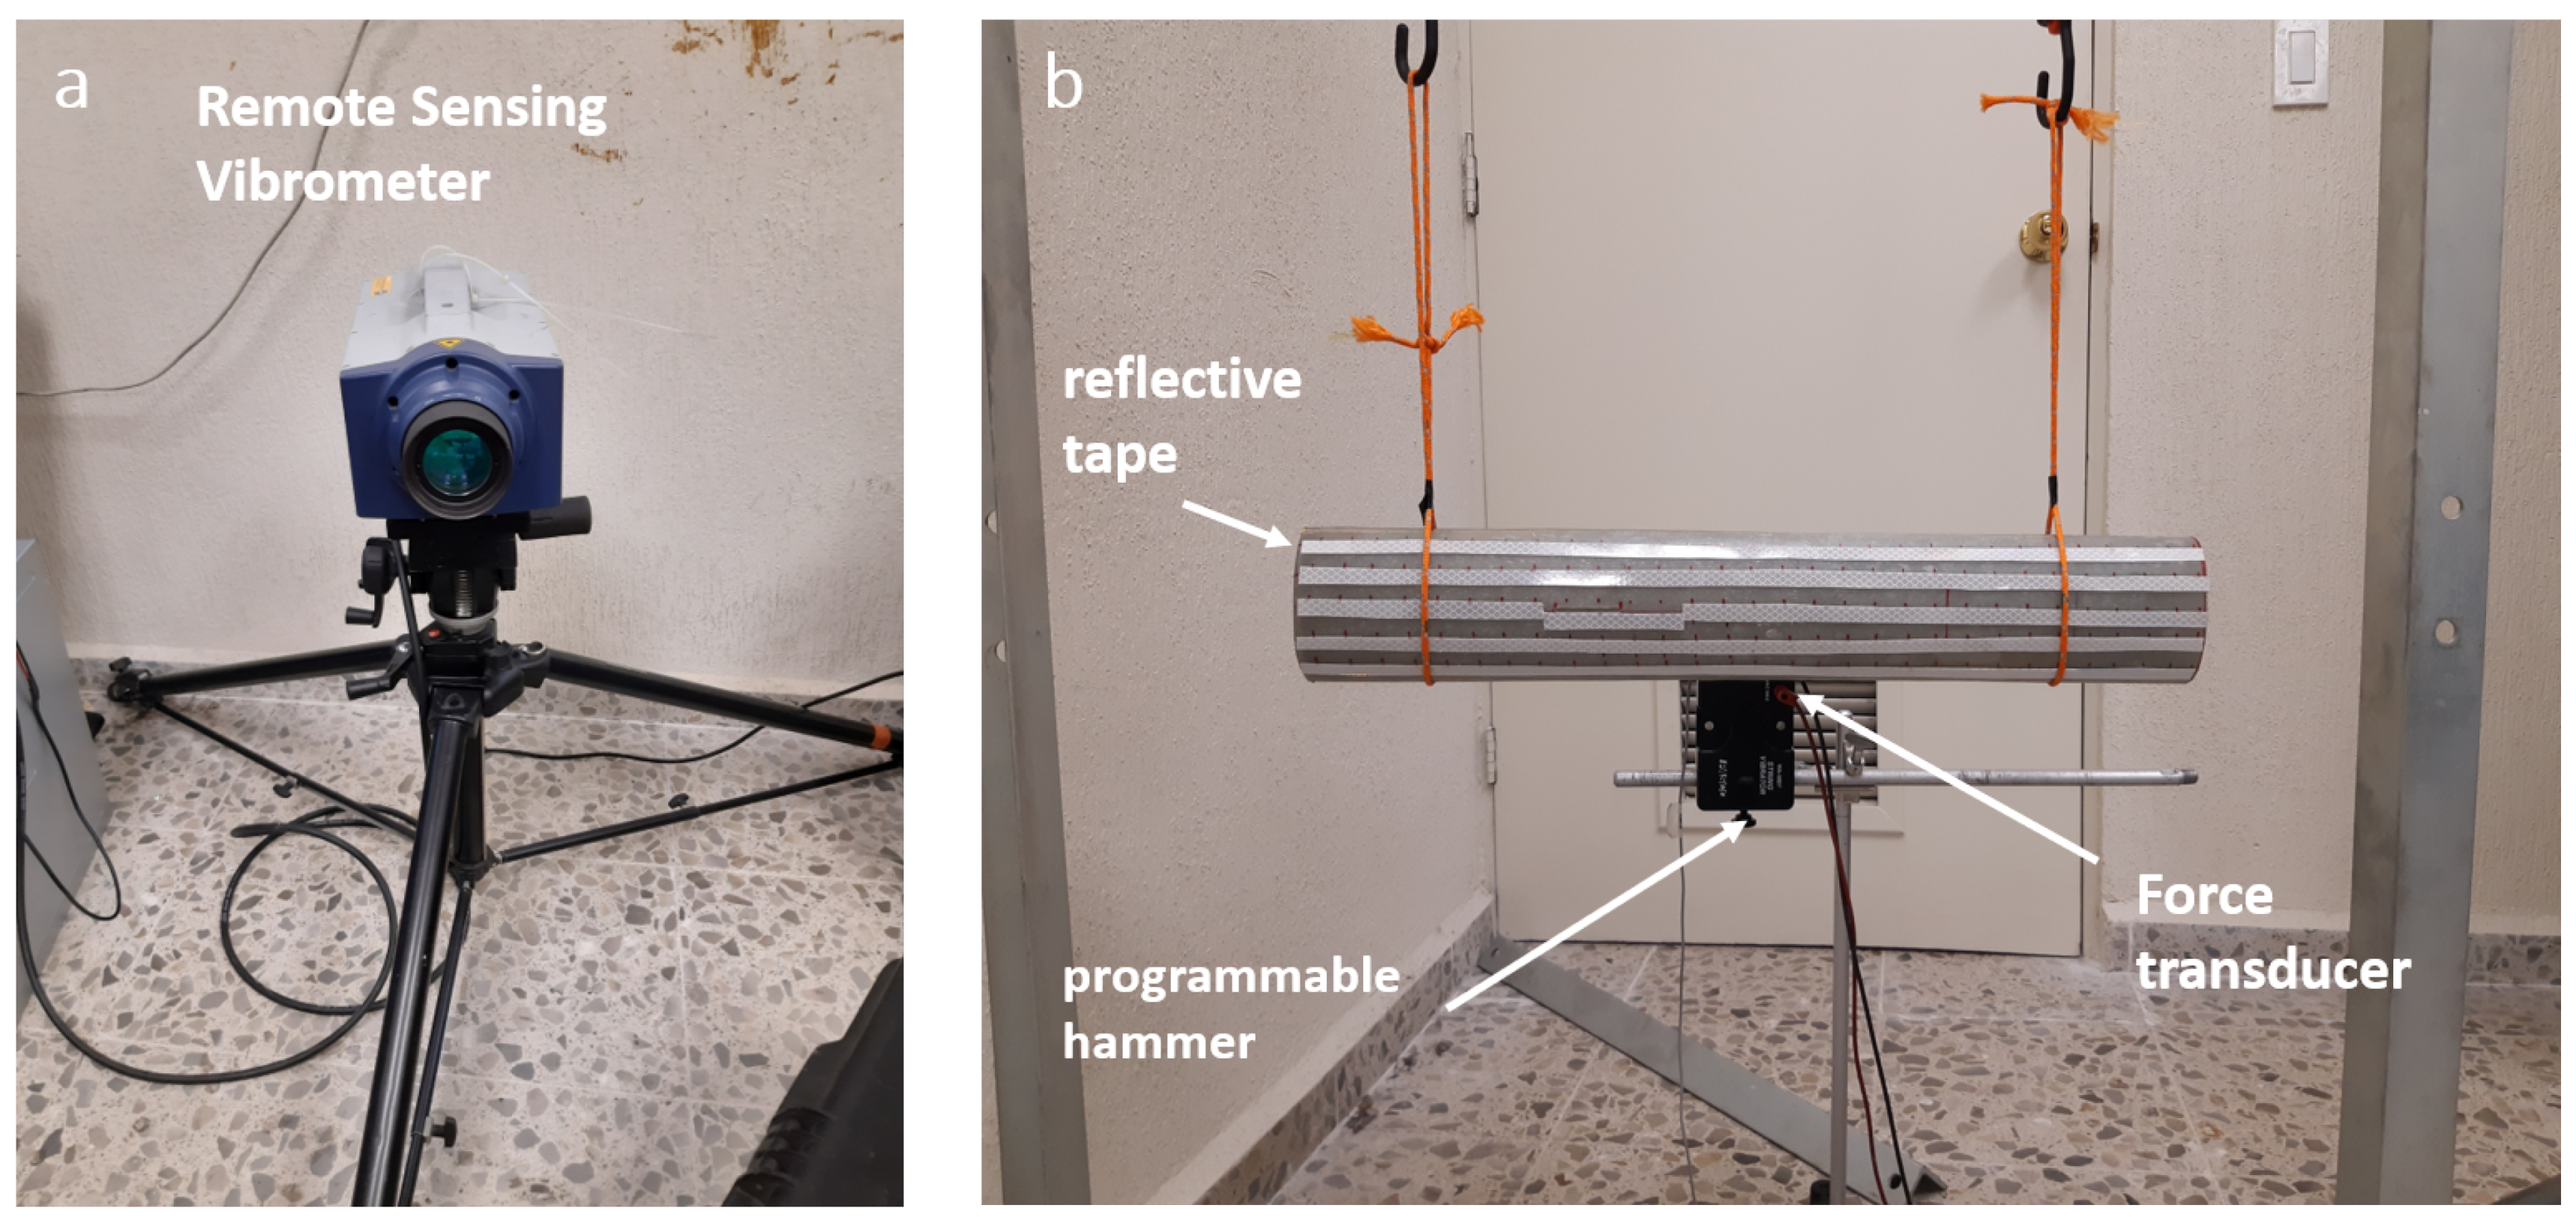
5.1. Experimental Setup
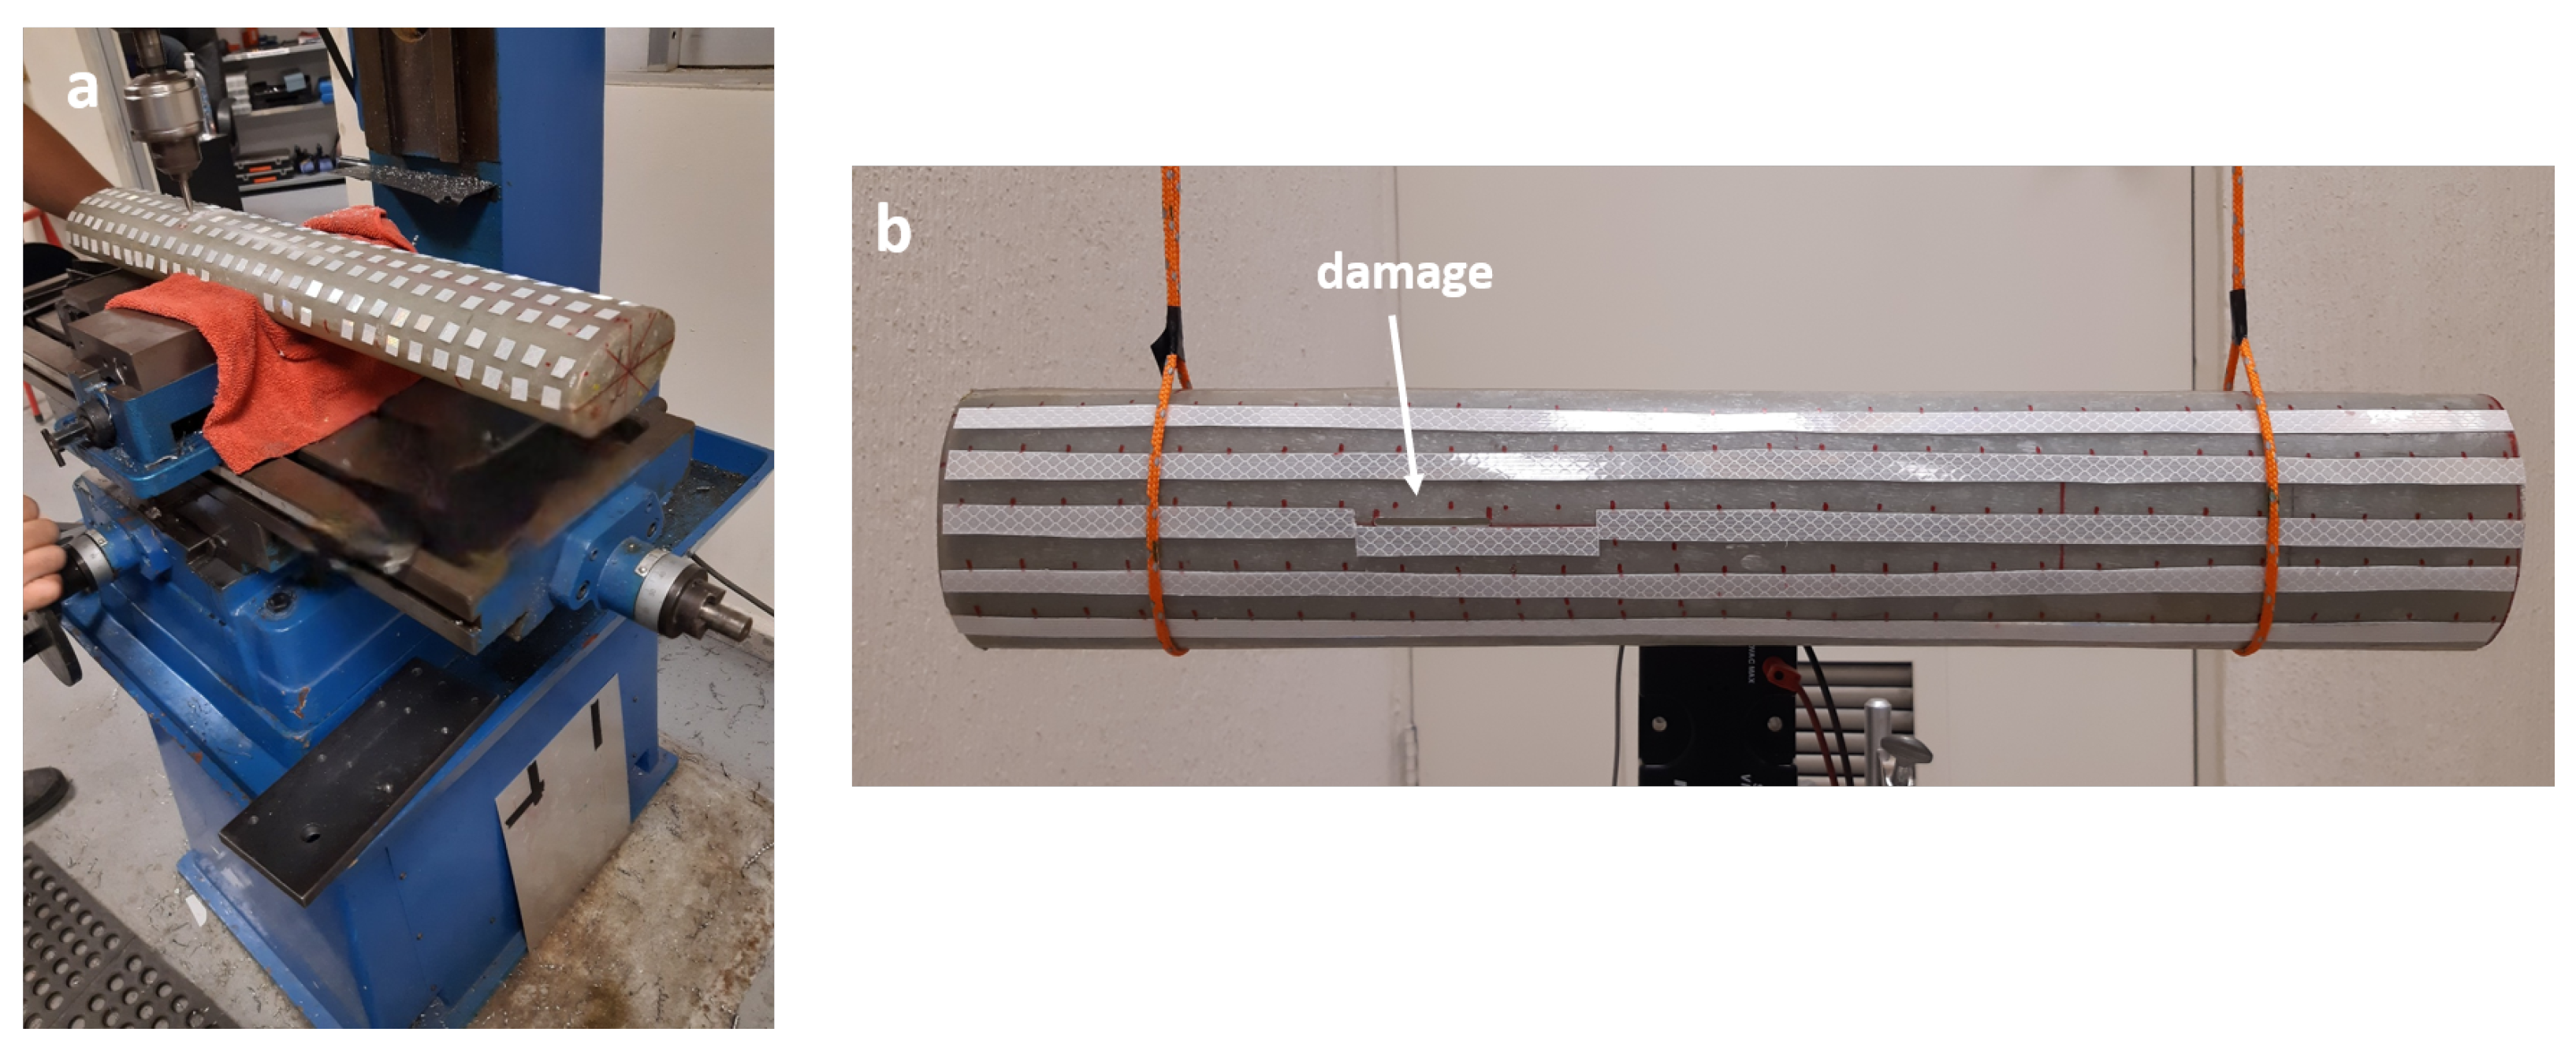
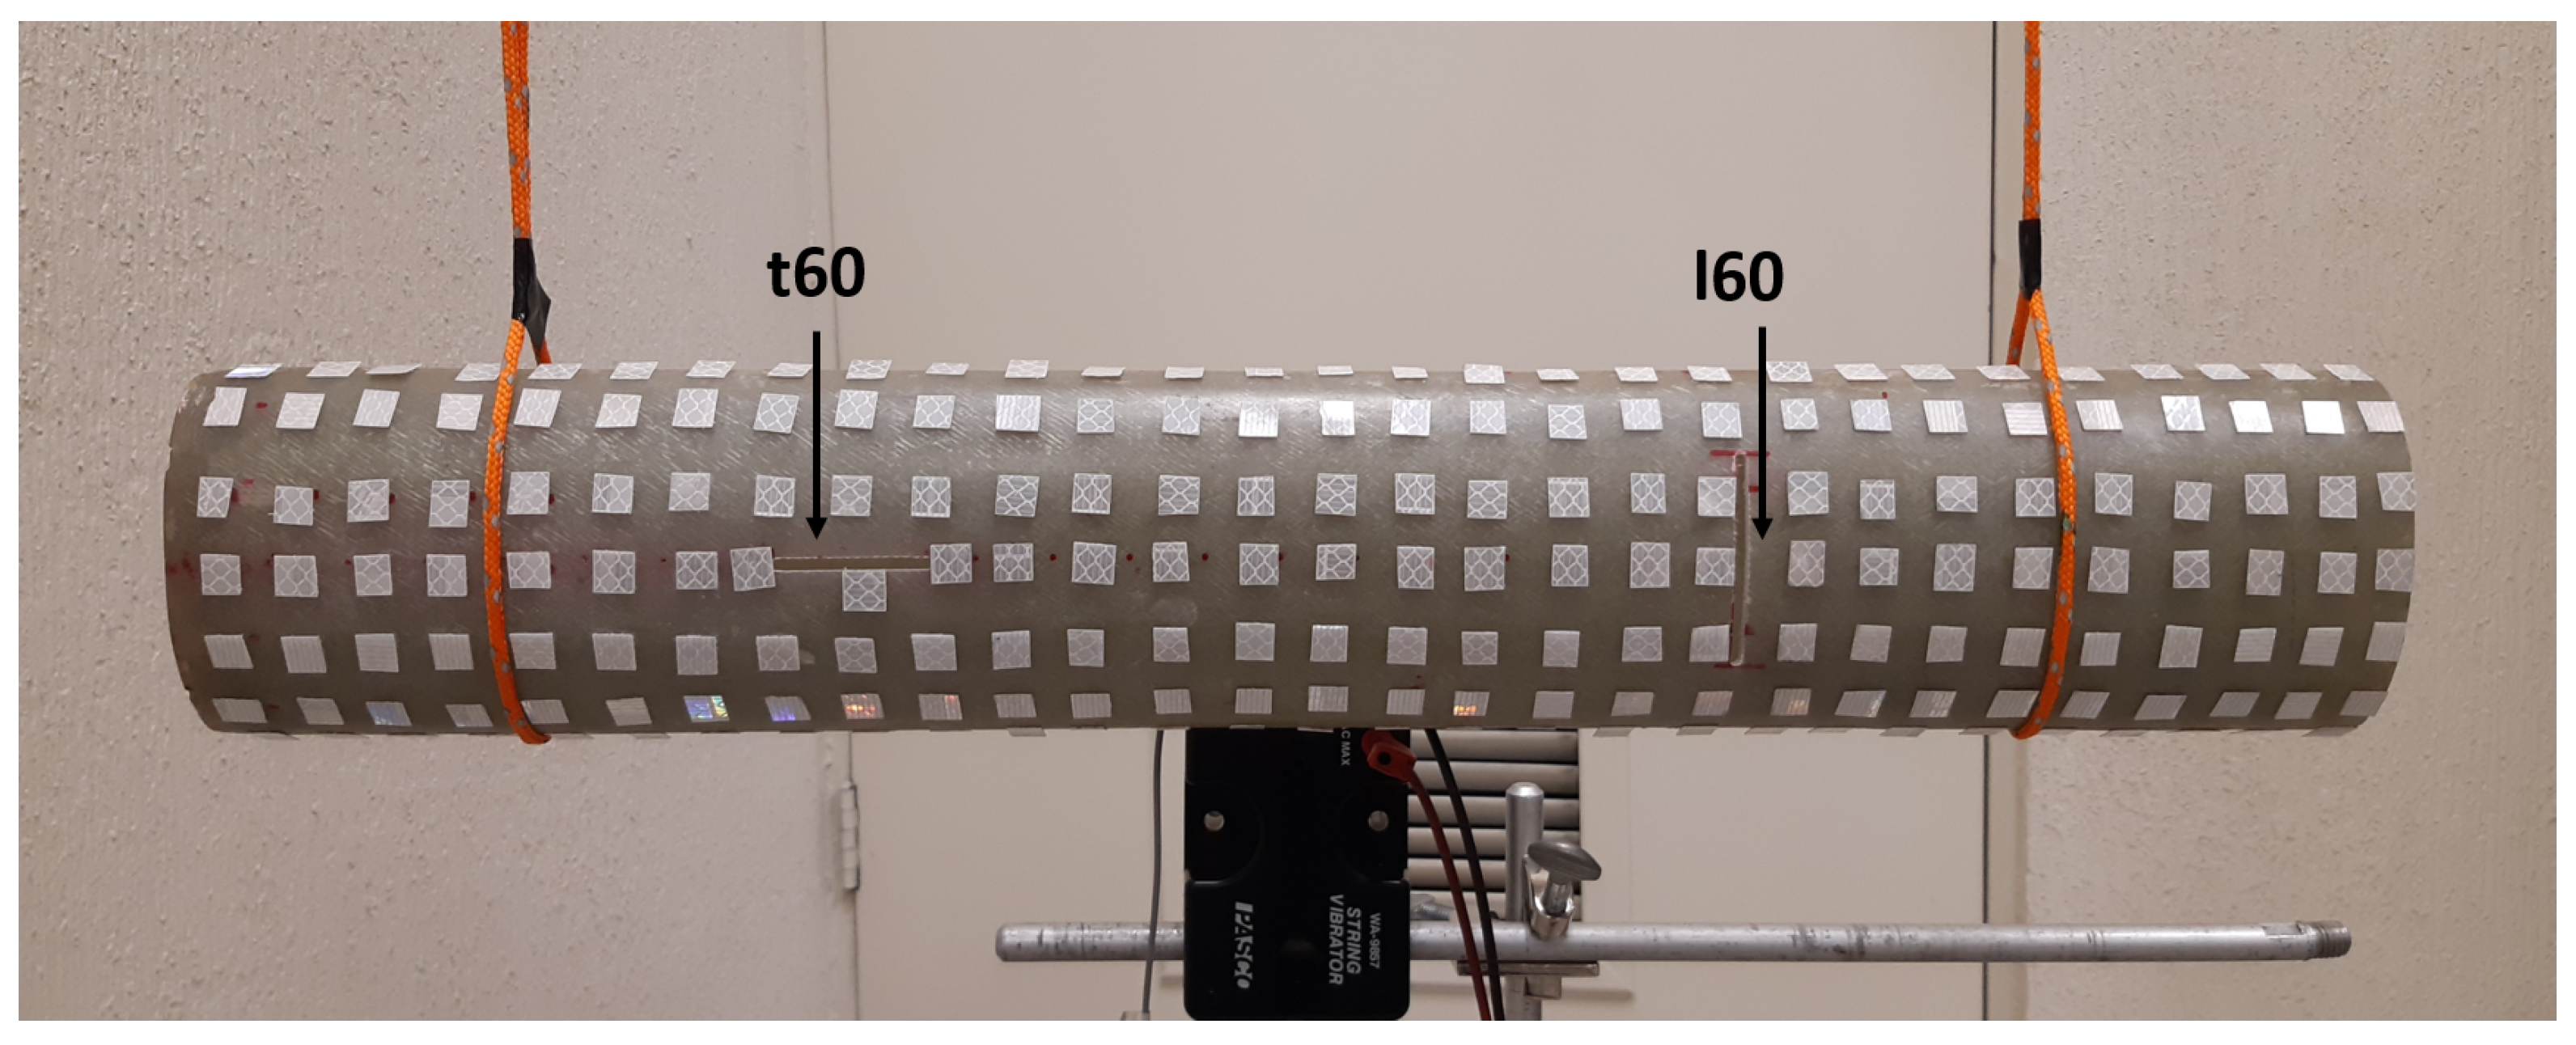
5.2. Sample Preparation
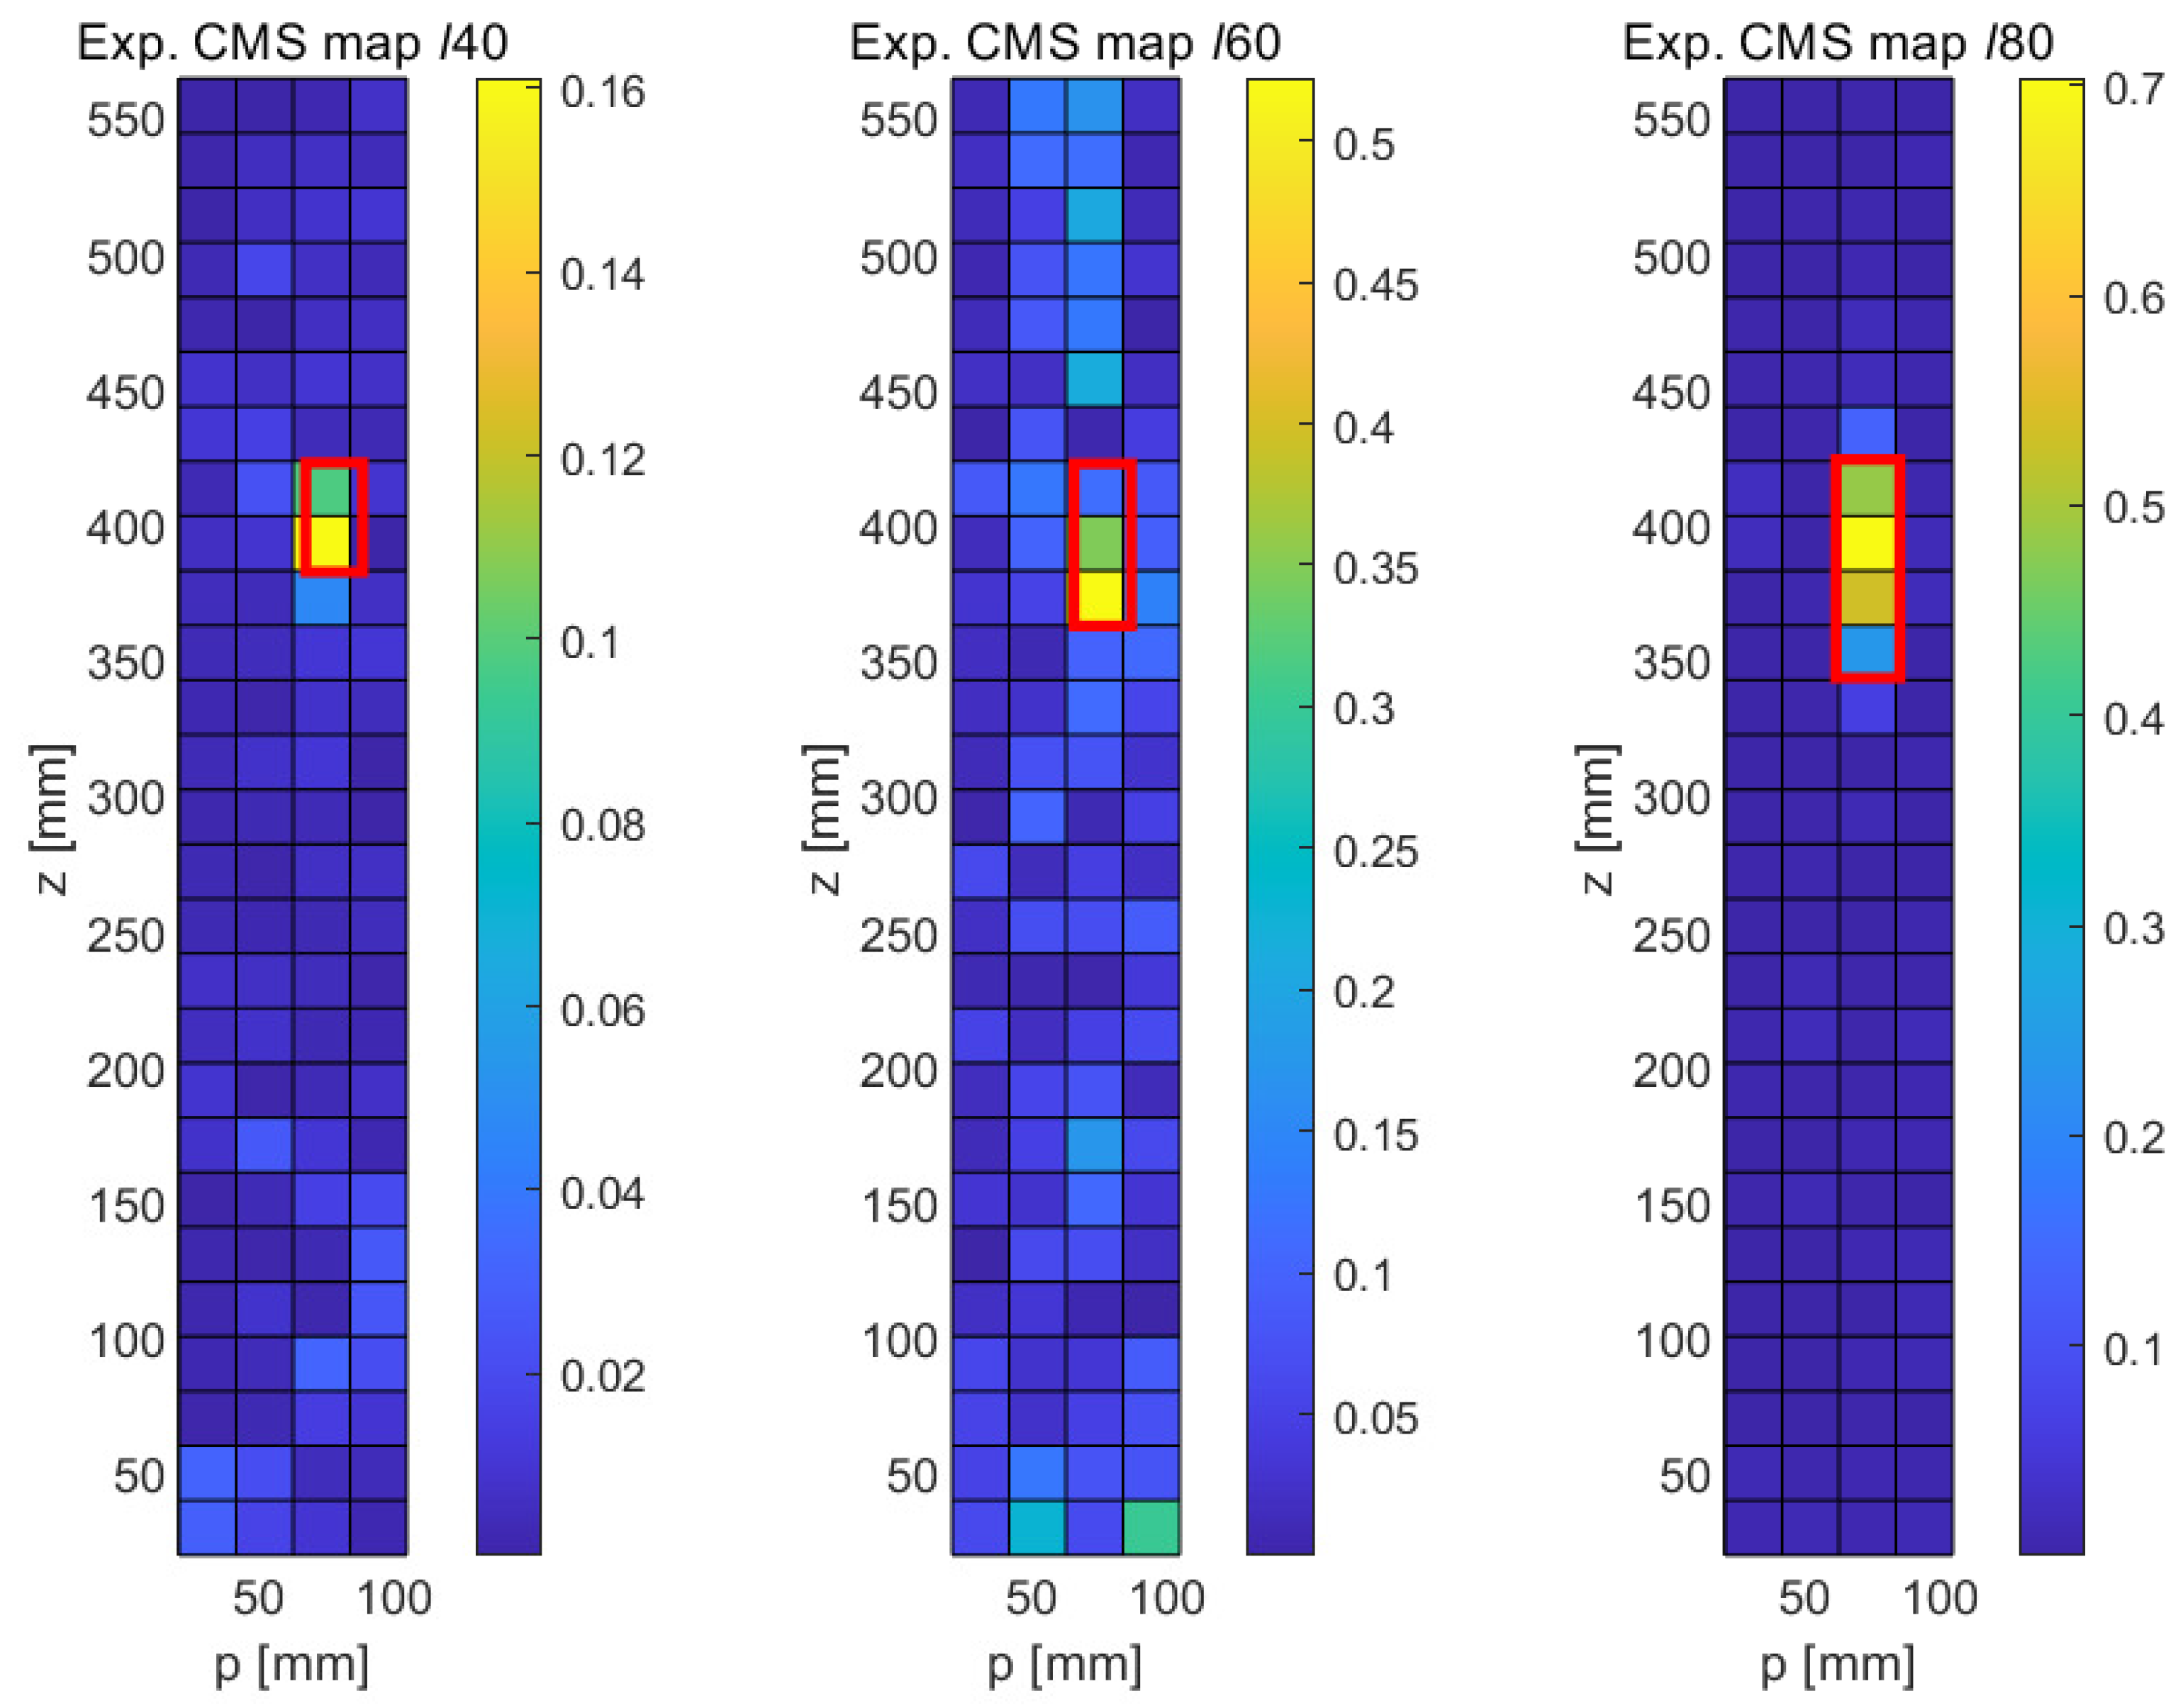
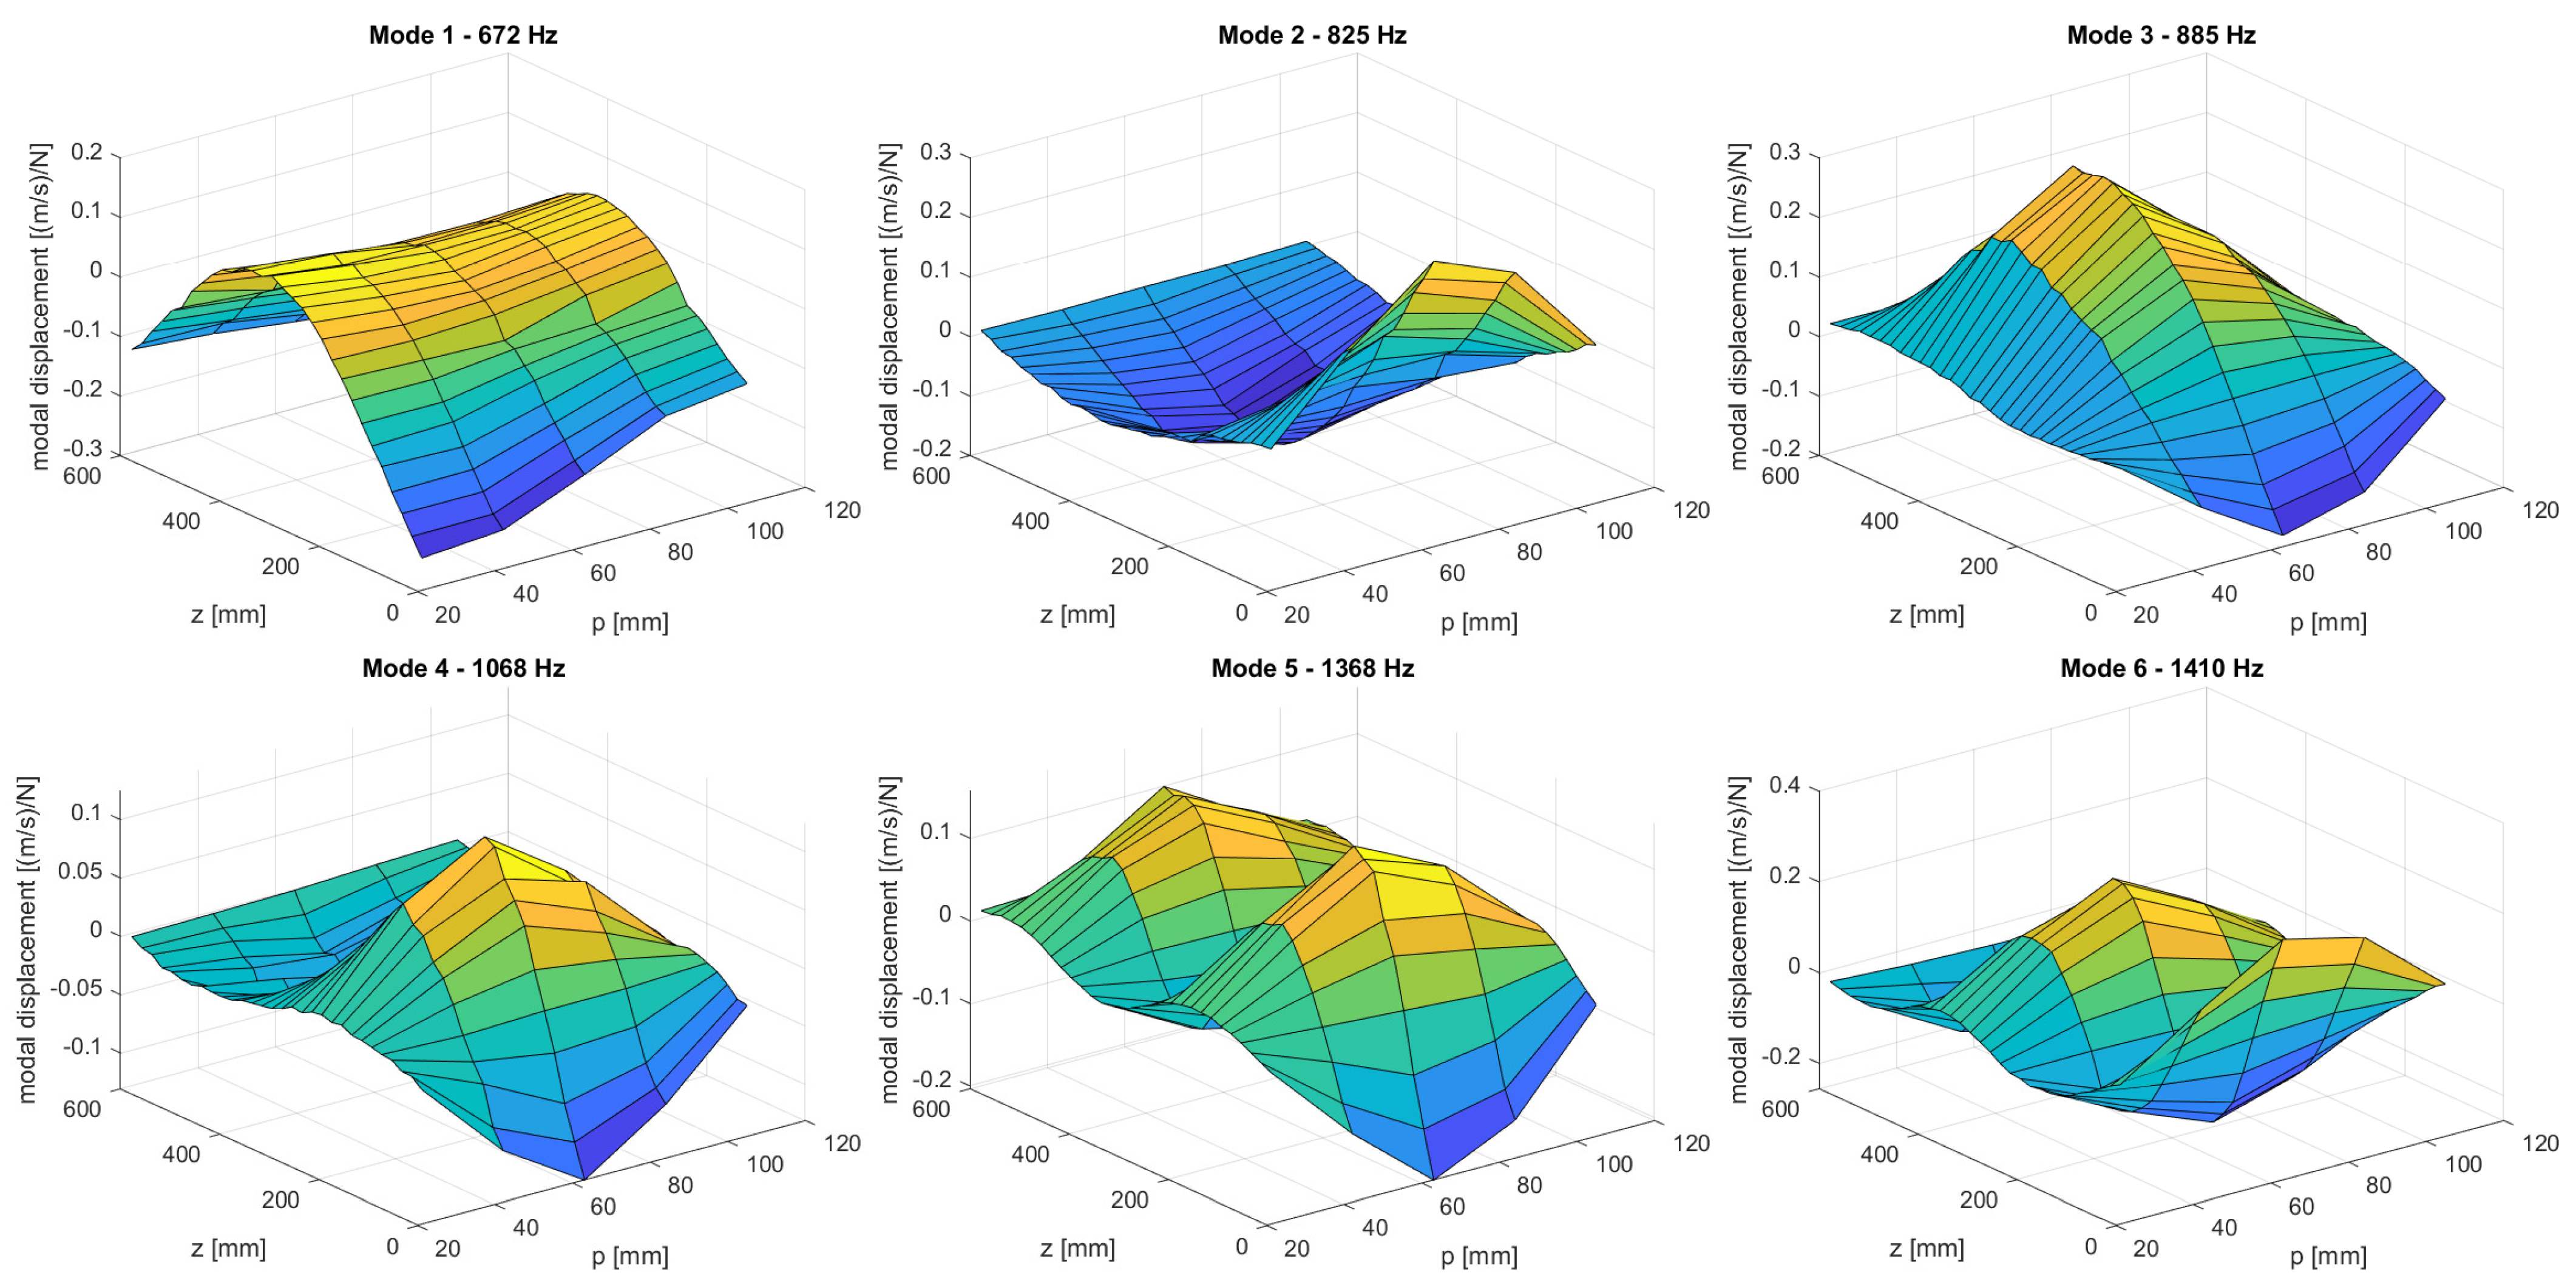
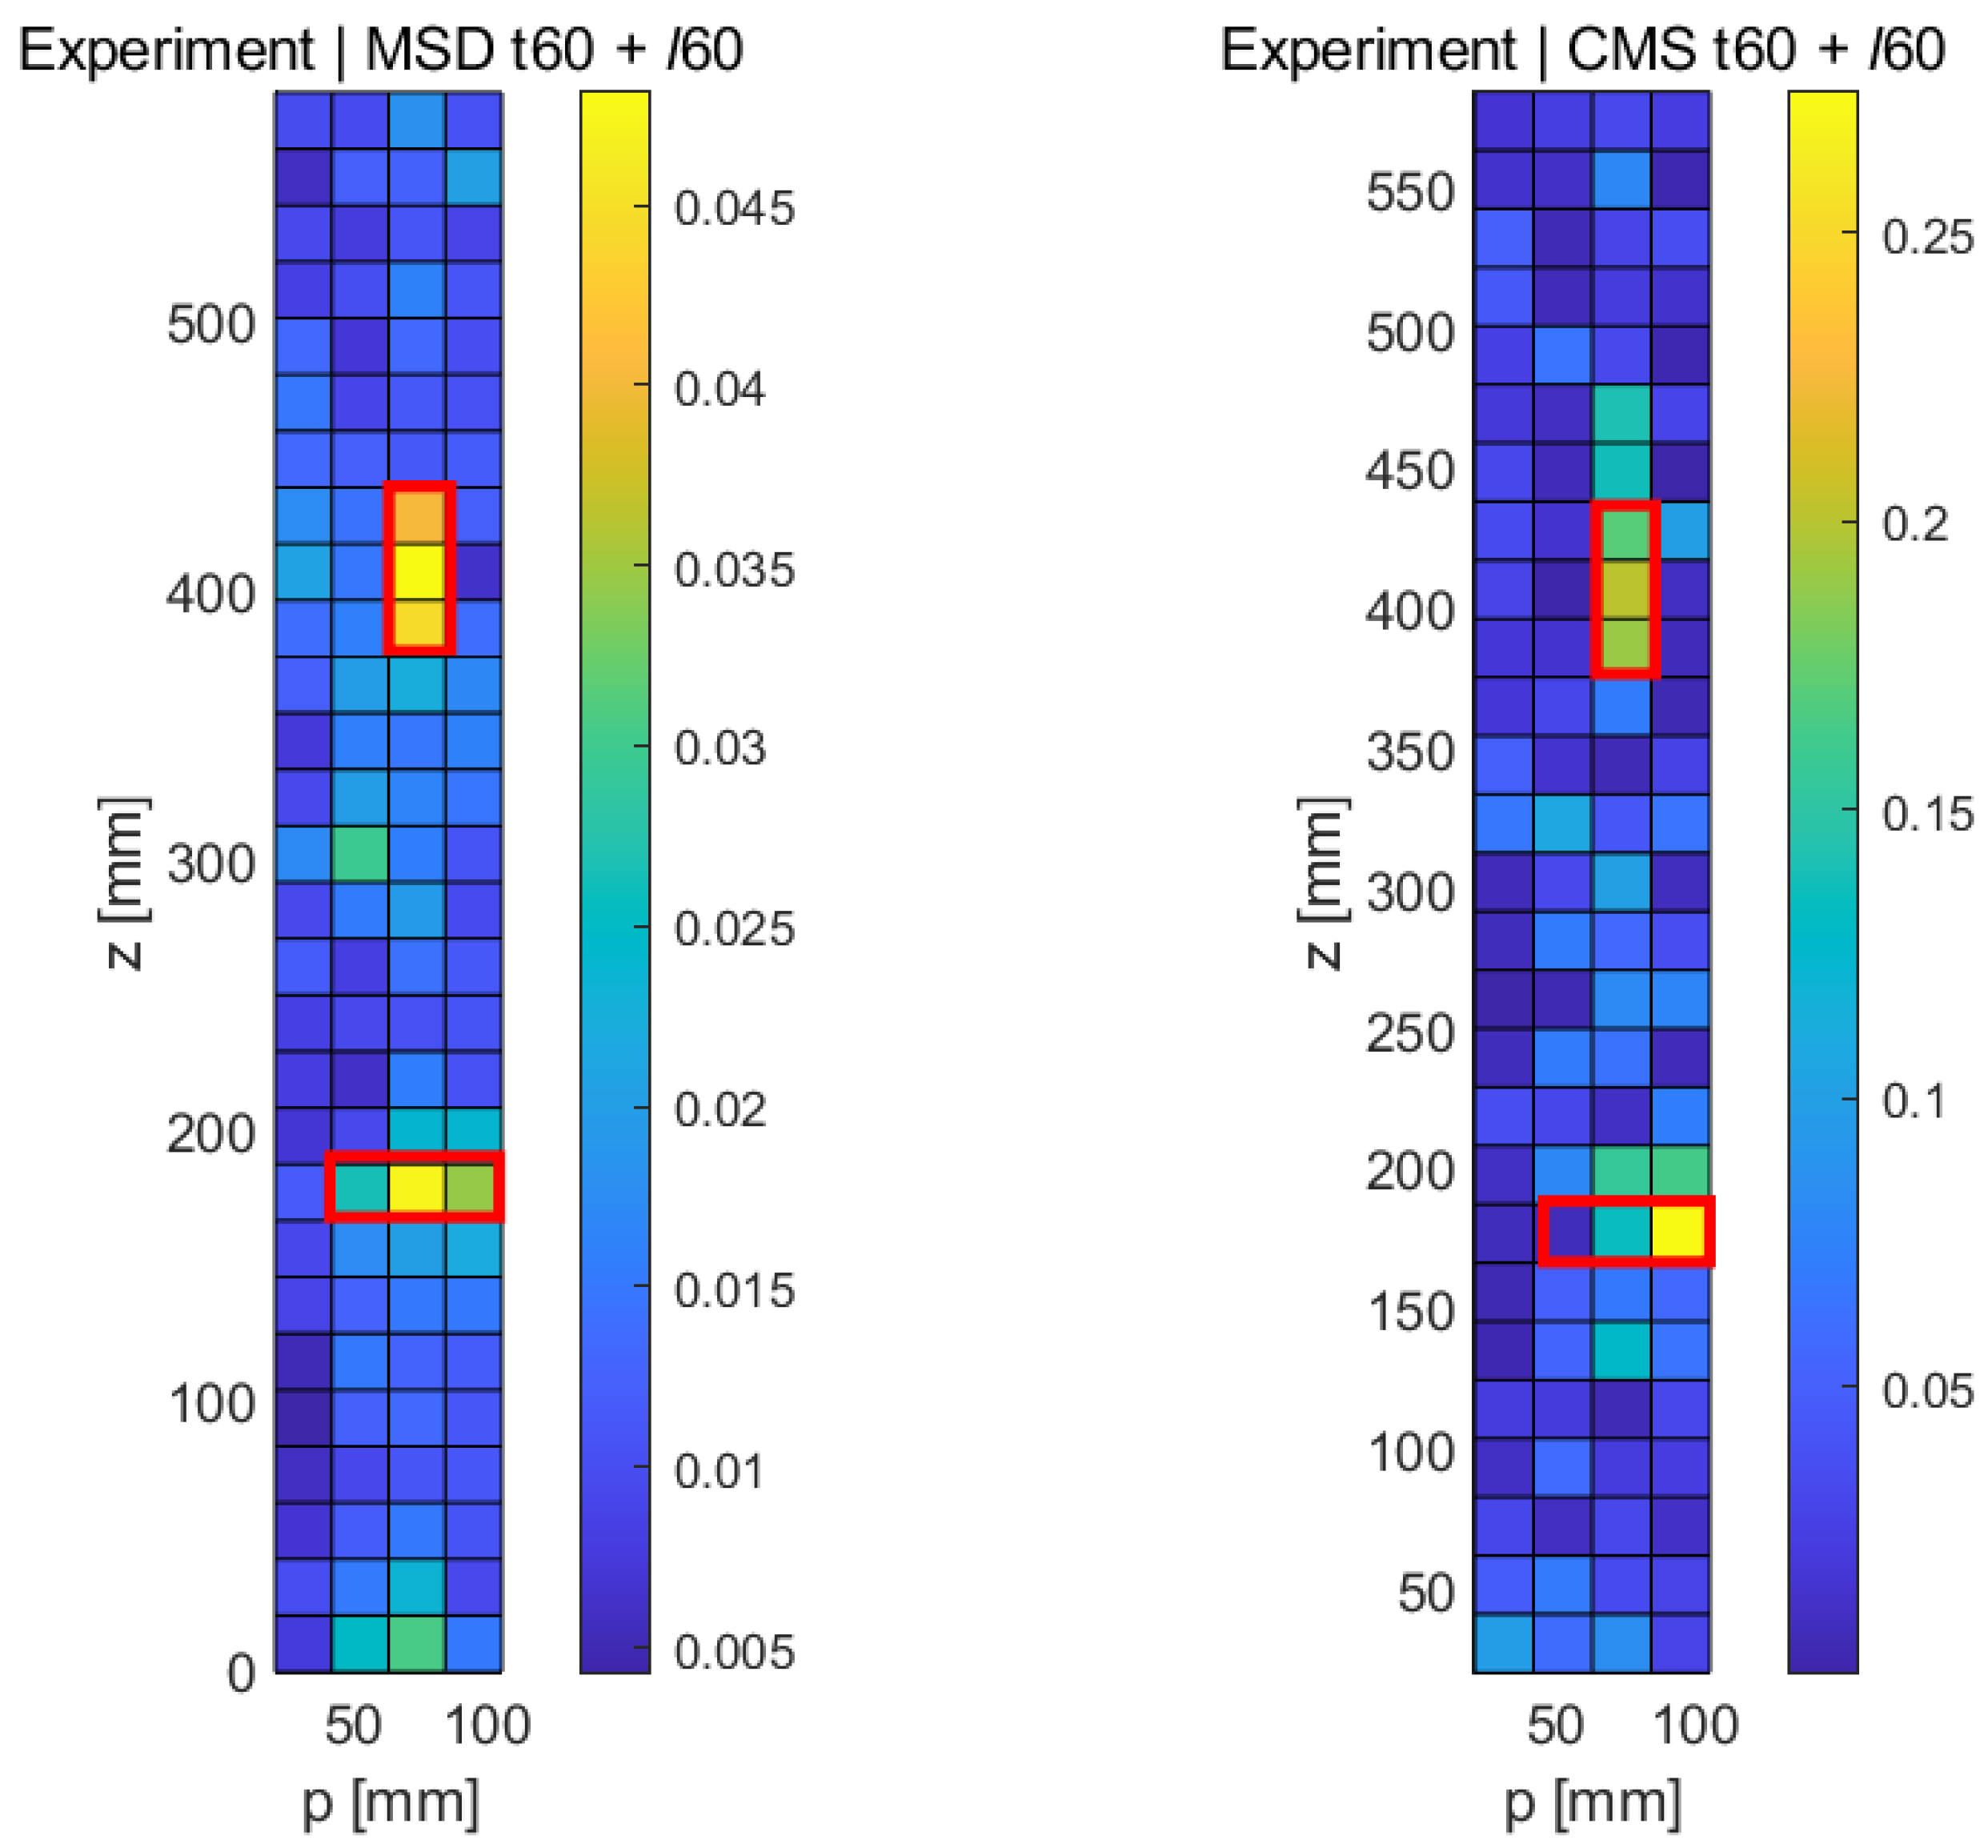
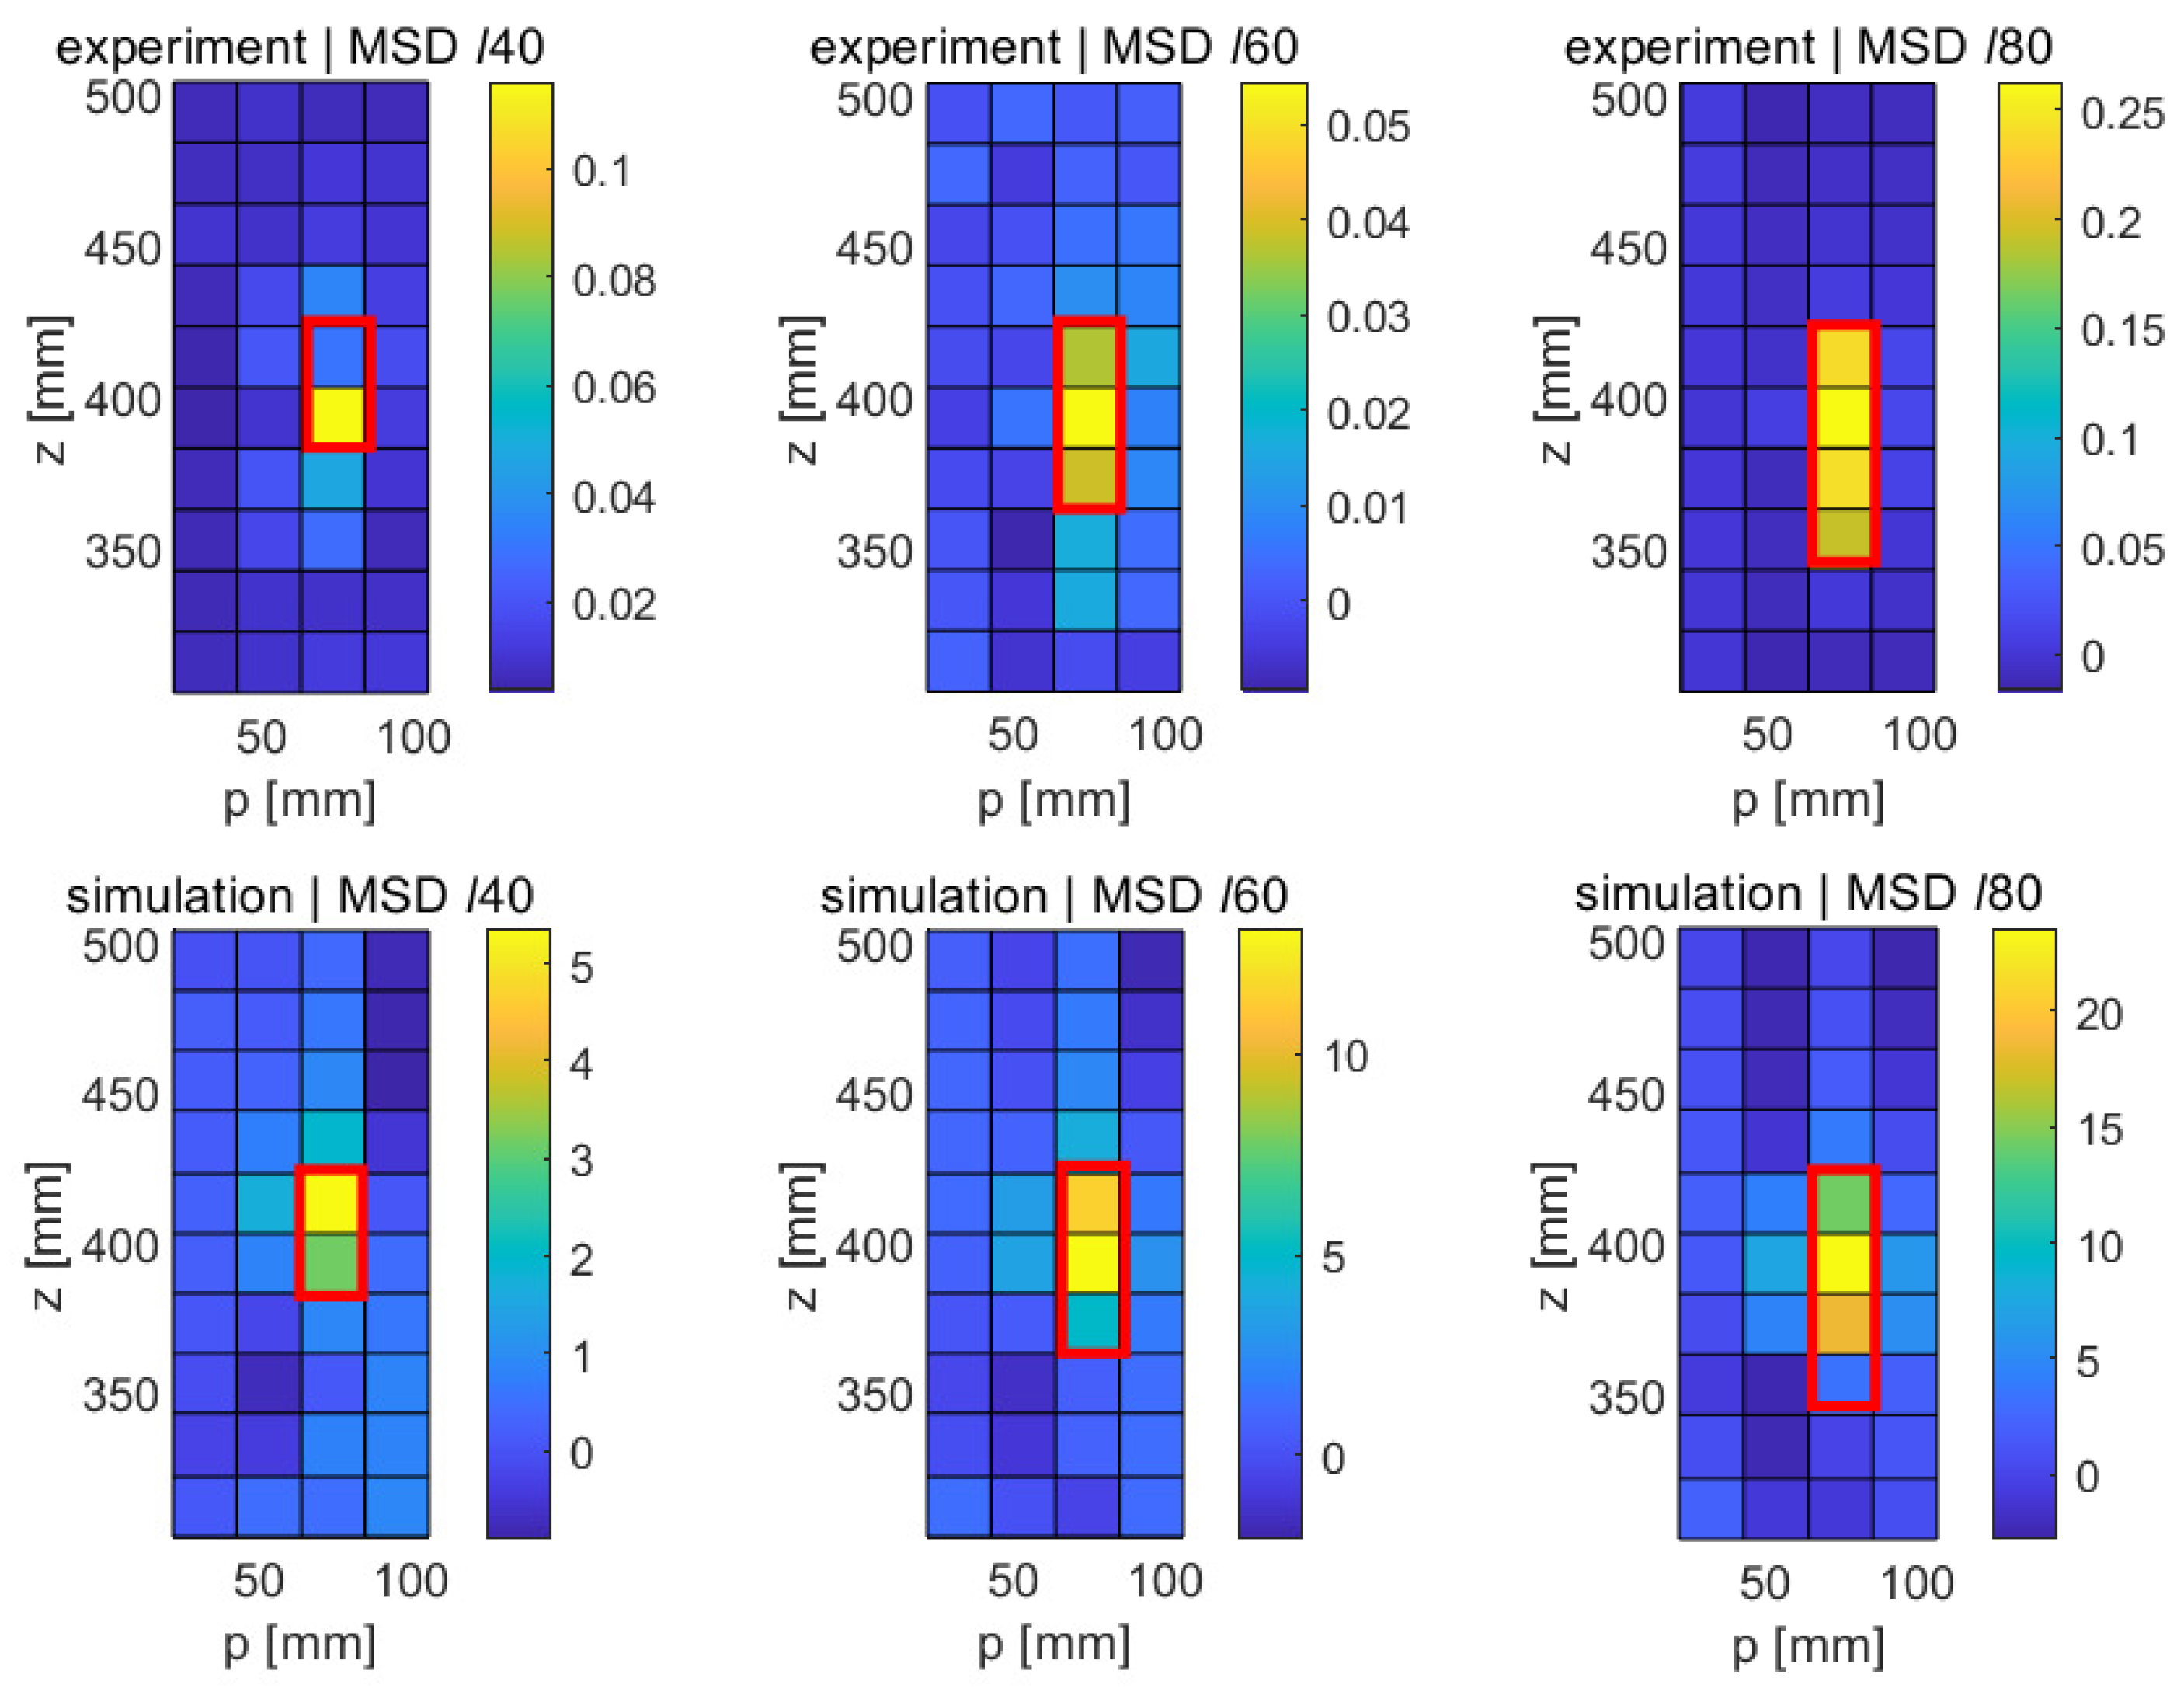
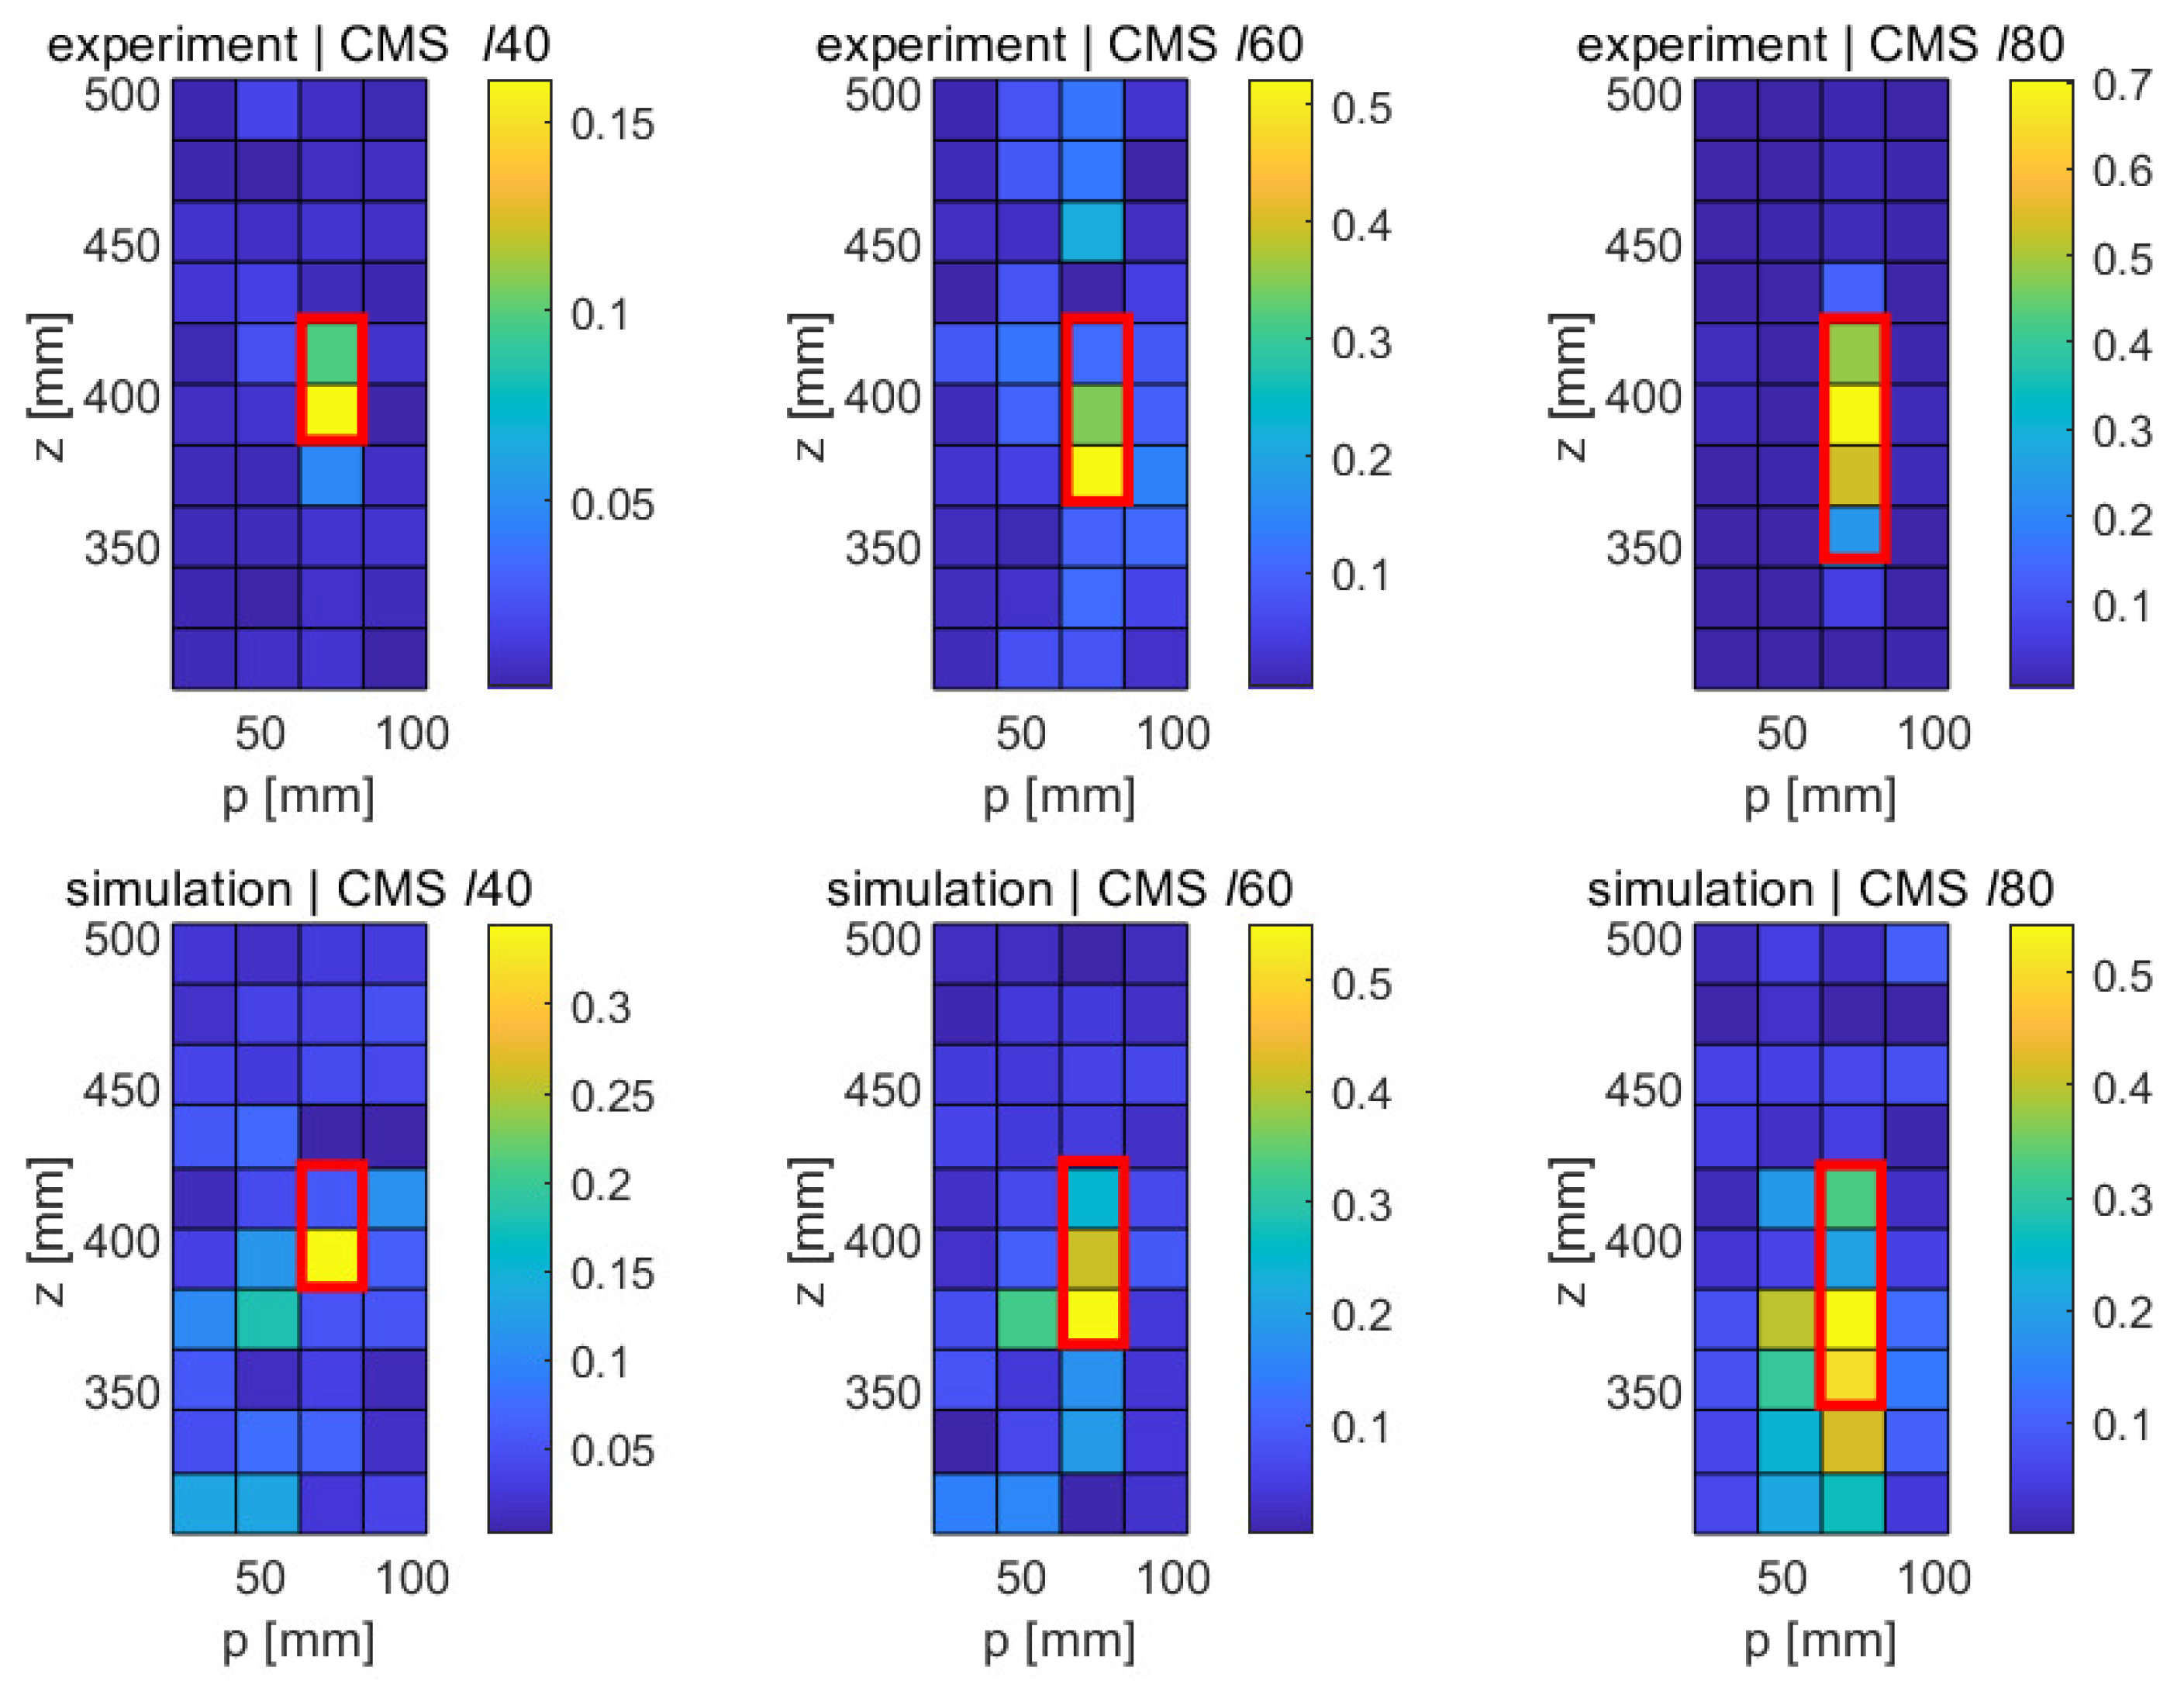
5.3. Experimental Results
6. Discussion
7. Summary and Conclusions
Author Contributions
Funding
Acknowledgments
Conflicts of Interest
Abbreviations
| CSM | Curvature of mode shape |
| CTWB | Composite thin-wall beam |
| FID | Fréchet inception distance |
| LDV | Laser Doppler vibrometer |
| MSD | Mode shape difference |
| SHM | Structural health monitoring |
| SLDV | Scanning laser Doppler vibrometer |
References
- Xu, W.; Zhu, W.; Cao, M.; Wu, H.; Zhu, R. A novel damage index for damage detection and localization of plate-type structures using twist derivatives of laser-measured mode shapes. J. Sound Vib. 2020, 481, 115448. [Google Scholar] [CrossRef]
- Chinka, S.S.B.; Putti, S.R.; Adavi, B.K. Modal testing and evaluation of cracks on cantilever beam using mode shape curvatures and natural frequencies. Structures 2021, 32, 1386–1397. [Google Scholar] [CrossRef]
- Pacheco-Chérrez, J.; Delgado-Gutiérrez, A.; Cárdenas, D.; Probst, O. Reliable damage localization in cantilever beams using an image similarity assessment method applied to wavelet-enhanced modal analysis. Mech. Syst. Signal Process. 2021, 149, 107335. [Google Scholar] [CrossRef]
- Chen, D.M.; Zhu, W.D. Investigation of three-dimensional vibration measurement by three scanning laser Doppler vibrometers in a continuously and synchronously scanning mode. J. Sound Vib. 2021, 498, 115950. [Google Scholar] [CrossRef]
- He, M.; Yang, T.; Du, Y. Nondestructive identification of composite beams damage based on the curvature mode difference. Compos. Struct. 2017, 176, 178–186. [Google Scholar] [CrossRef]
- Yang, Z.B.; Radzienski, M.; Kudela, P.; Ostachowicz, W. Fourier spectral-based modal curvature analysis and its application to damage detection in beams. Mech. Syst. Signal Process. 2017, 84, 763–781. [Google Scholar] [CrossRef]
- Janeliukstis, R.; Rucevskis, S.; Wesolowski, M.; Chate, A. Multiple Damage Identification in Beam Structure Based on Wavelet Transform. Procedia Eng. 2017, 172, 426–432. [Google Scholar] [CrossRef]
- Sha, G.; Radzienski, M.; Soman, R.; Cao, M.; Ostachowicz, W.; Xu, W. Multiple damage detection in laminated composite beams by data fusion of Teager energy operator-wavelet transform mode shapes. Compos. Struct. 2020, 235, 111798. [Google Scholar] [CrossRef]
- Yang, C.; Oyadiji, S.O. Delamination detection in composite laminate plates using 2D wavelet analysis of modal frequency surface. Comput. Struct. 2017, 179, 109–126. [Google Scholar] [CrossRef]
- Pacheco-Chérrez, J.; Cárdenas, D.; Probst, O. Measuring Crack-Type Damage Features In Thin-Walled Composite Beams Using De-Noising Furthermore, A 2d Continuous Wavelet Transform Of Mode Shapes. J. Appl. Comput. Mech. 2021, 7, 355–371. [Google Scholar] [CrossRef]
- Abdulkareem, M.; Bakhary, N.; Vafaei, M.; Noor, N.M.; Mohamed, R.N. Application of two-dimensional wavelet transform to detect damage in steel plate structures. Meas. J. Int. Meas. Confed. 2019, 146, 912–923. [Google Scholar] [CrossRef]
- Govindasamy, M.; Kamalakannan, G.; Kesavan, C.; Meenashisundaram, G.K. Damage detection in glass/epoxy laminated composite plates using modal curvature for structural health monitoring applications. J. Compos. Sci. 2020, 4, 185. [Google Scholar] [CrossRef]
- Xu, Y.; Brownjohn, J.M.; Hester, D. Enhanced sparse component analysis for operational modal identification of real-life bridge structures. Mech. Syst. Signal Process. 2019, 116, 585–605. [Google Scholar] [CrossRef] [Green Version]
- Jeon, J.Y.; Kim, D.; Park, G.; Flynn, E.; Kang, T.; Han, S. 2D-wavelet wavenumber filtering for structural damage detection using full steady-state wavefield laser scanning. NDT E Int. 2020, 116, 102343. [Google Scholar] [CrossRef]
- Xu, Y.F.; Chen, D.M.; Zhu, W.D. Operational modal analysis using lifted continuously scanning laser Doppler vibrometer measurements and its application to baseline-free structural damage identification. JVC/J. Vib. Control 2019, 25, 1341–1364. [Google Scholar] [CrossRef]
- Katunin, A. Identification of structural damage using S-transform from 1D and 2D mode shapes. Meas. J. Int. Meas. Confed. 2021, 173, 108656. [Google Scholar] [CrossRef]
- Dworakowski, Z.; Dziedziech, K.; Zdziebko, P.; Mendrok, K. Damage Detection in Plates with the Use of Laser-Measured Mode Shapes. Shock Vib. 2020, 2020, 8858126. [Google Scholar] [CrossRef]
- Zhang, Z.; Pan, J.; Luo, W.; Ramakrishnan, K.R.; Singh, H.K. Vibration-based delamination detection in curved composite plates. Compos. Part A Appl. Sci. Manuf. 2019, 119, 261–274. [Google Scholar] [CrossRef]
- Xu, W.; Ding, K.; Liu, J.; Cao, M.; Radzien, M. Non-uniform crack identification in plate-like structures using wavelet 2D modal curvature under noisy conditions. Mech. Syst. Signal Process. 2019, 126, 469–489. [Google Scholar] [CrossRef]
- He, J.; Zhou, Y. A novel mode shape reconstruction method for damage diagnosis of cracked beam. Mech. Syst. Signal Process. 2019, 122, 433–447. [Google Scholar] [CrossRef]
- Heusel, M.; Ramsauer, H.; Unterthiner, T.; Nessler, B.; Hochreiter, S. GANs trained by a two time-scale update rule converge to a local Nash equilibrium. In Advances in Neural Information Processing Systems; MIT Press: Cambridge, MA, USA, 2017; pp. 6627–6638. [Google Scholar]
- Fréchet, M. Sur la distance de deux lois de probabilité. Acad. Sci. Paris 1957, 244, 689–692. [Google Scholar]
- Dowson, D.C.; Landau, B.V. The Fréchet distance between multivariate normal distributions. J. Multivar. Anal. 1982, 12, 450–455. [Google Scholar] [CrossRef] [Green Version]
- Gade, S.; Herlufsen, H.; Konstantin-hansen, H. Application Note: How to Determine the Modal Parameters of Simple Structures; Brüel & Kjaer: Naerum, Denmark, 2001. [Google Scholar]


| Ref. | Structure | Structure Dimensions [mm] | Fault Size [mm] | Meas. Equipment | Meas. Points | Method |
|---|---|---|---|---|---|---|
| [19] | aluminum plate | 1000 × 1000 × 4 | cracks of 250 × 2 | PSV-400 | 443 × 443 | wavelet and MC |
| [1] | aluminum plate | 400 × 600 × 3 | notch of 20 × 20 | PSV-400 | 39 × 39 | derivatives MS |
| [14] | composite plate | 150 × 300 × 1 | 10 × 10 | laser scanning | 280 × 560 | 2D wavelet |
| [15] | aluminum cantilever beam | 1000 × 5 | 50 × 1.3 | OFV-353 | 200 | CMS |
| [16] | GFRP plates | 300 × 300 | 50 × 50 | PSV-400 | 64 × 64 | S-transform |
| [17] | metal plate | 150 × 400 | circles with diameters of 10, 20, 30, and 40 | PSC-400-3 | 21 × 11 | local modal filters and wavelet |
| [18] | composite plates | 250 × 250 × 2.12 | 70 × 18 | PSV-500 | 26 × 13 | ANN, SAGA |
| [9] | composite laminate plates | 550 × 550 × 4 | 50 × 50 and 100 × 100 | SIMULATION | FE: 44 × 44 × 6 | 2D CWT |
| [11] | steel plate | 560 × 560 × 3.2 | 80 × 80 | two accelerometers 352C33 (PCB) | 5 × 5 and FE: 28 × 28 | MSD-2D CWT |
| [12] | composite plates | 500 × 250 × 5 | 25, 75, 125 mm | PCB accelerometer | 10 × 5 | MC |
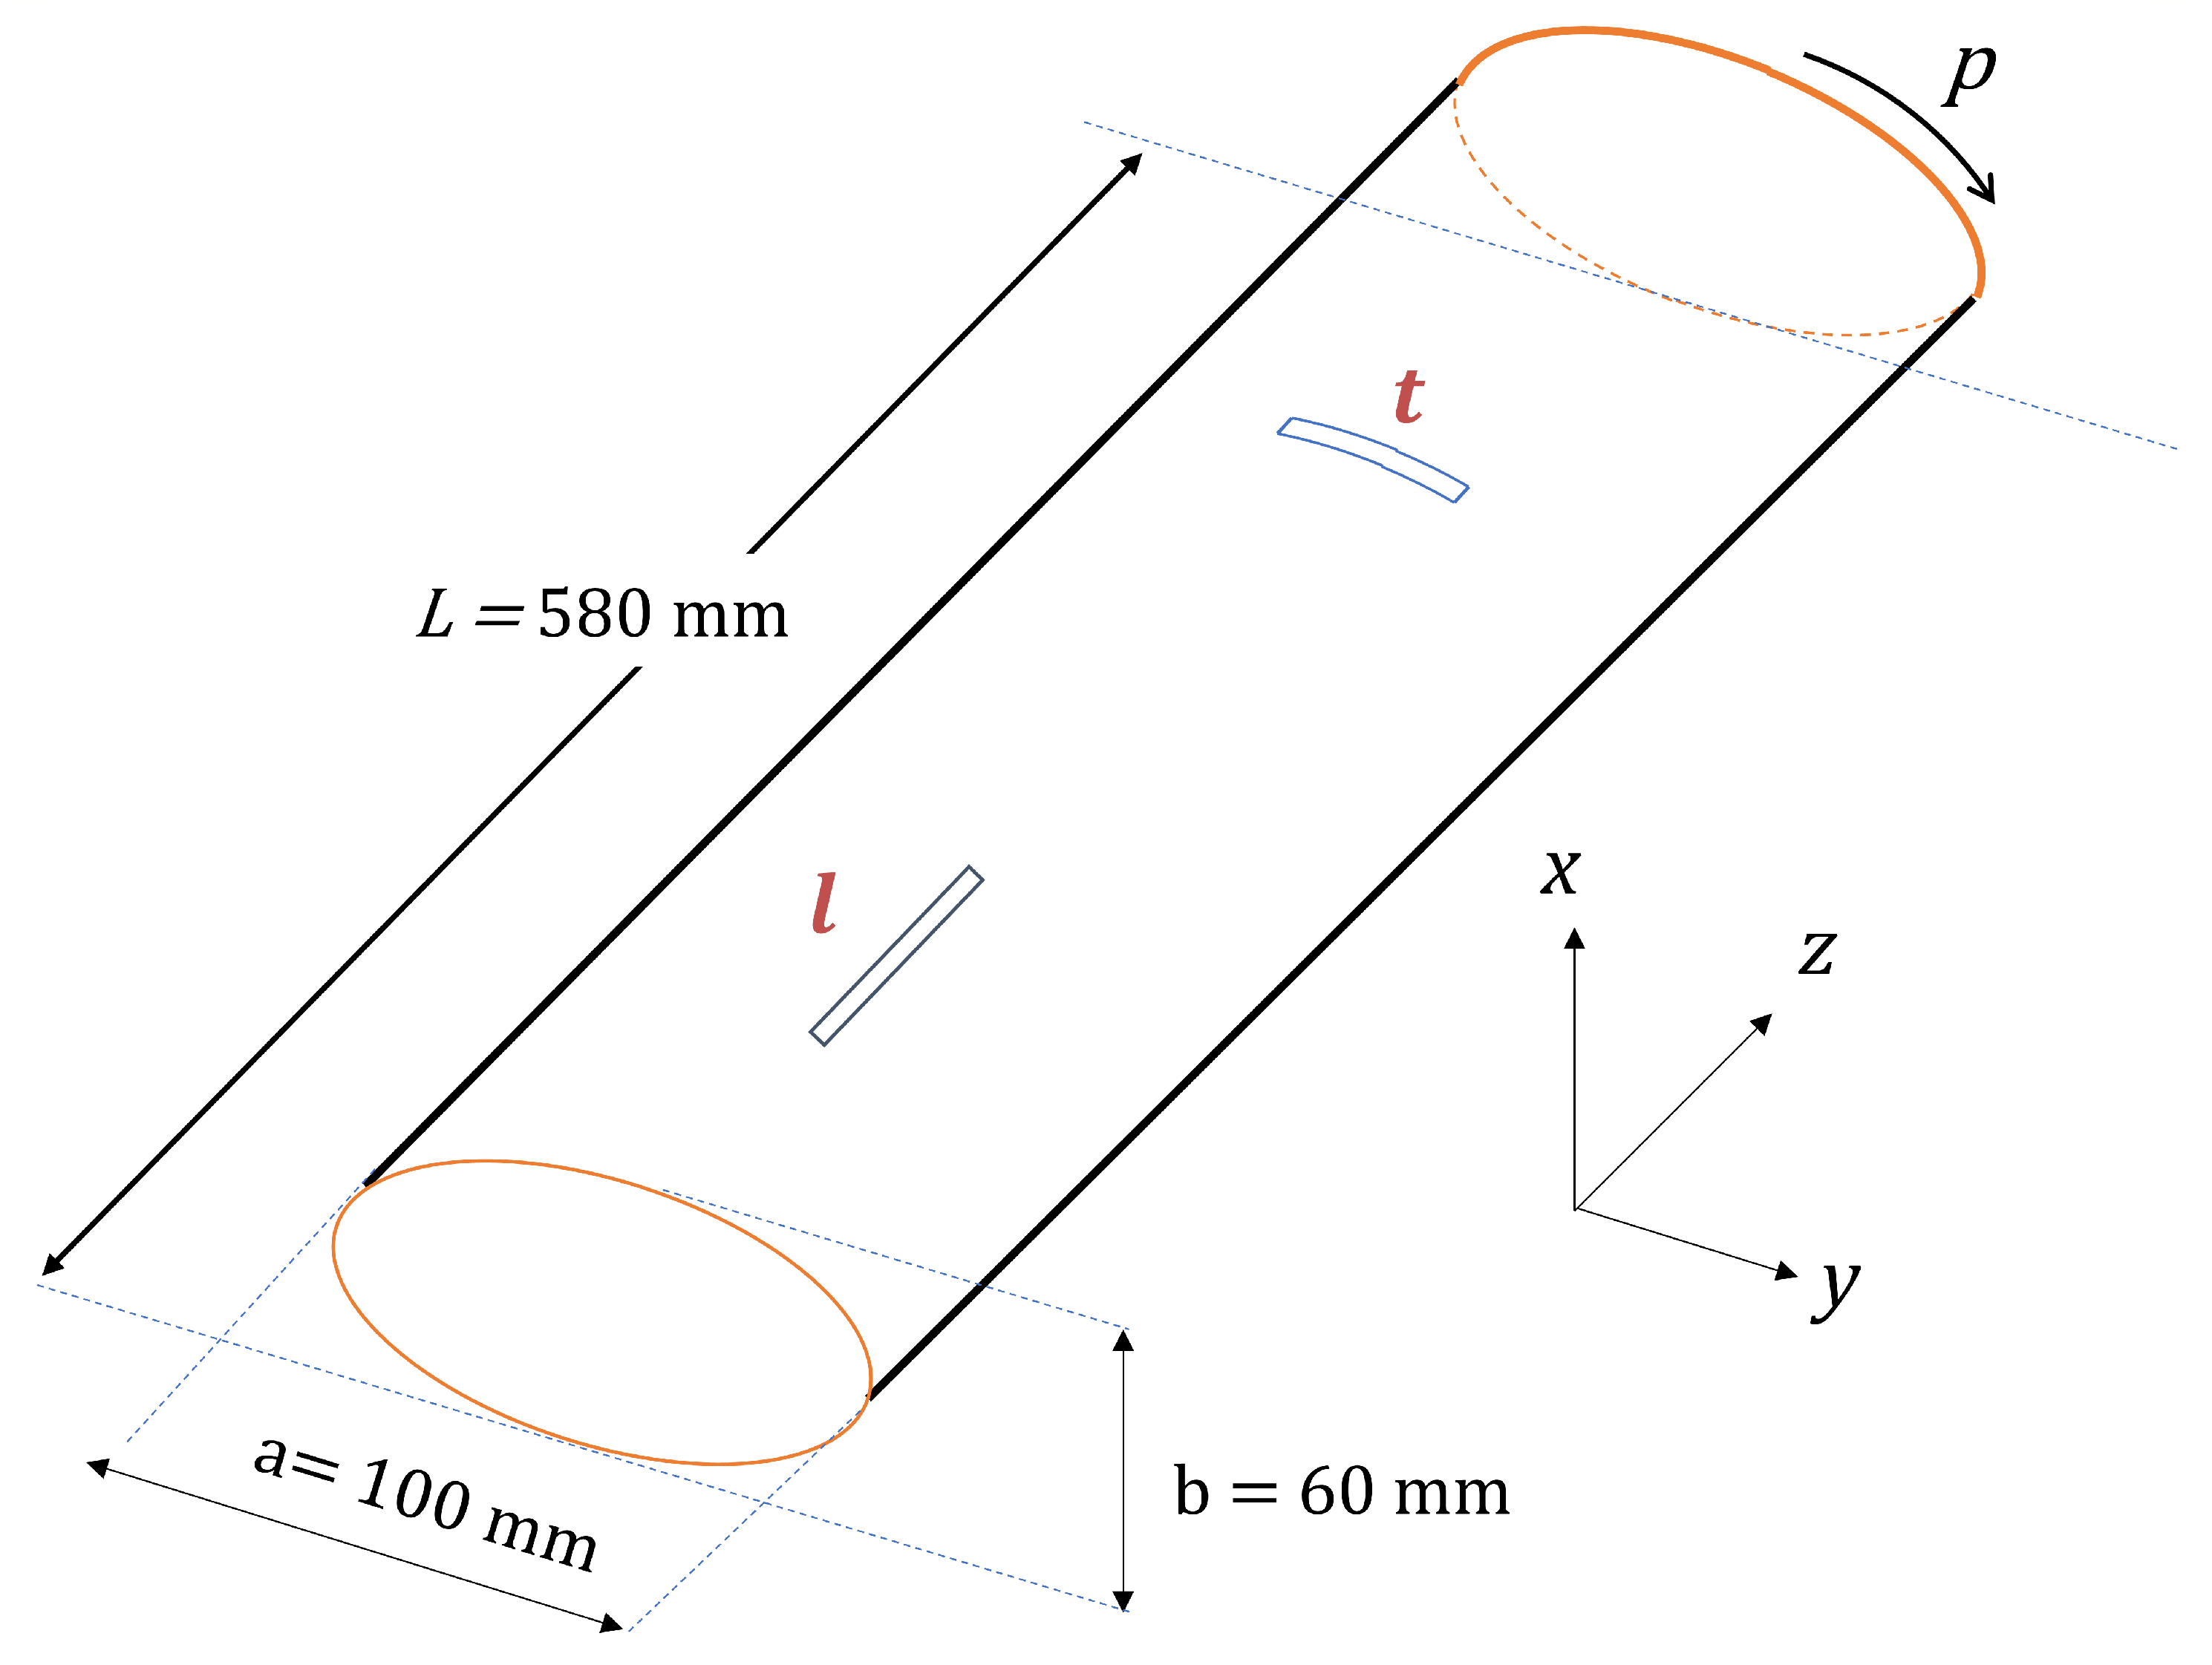
| This work | composite thin-wall beam | major axis:100 mm, minor axis: 60 mm, length = 585 mm | 40, 60, 80 mm | Polytec RSV-150 | 5 × 30 | MSD, CMS |
| Property | Parameters | Value | Unit |
|---|---|---|---|
| Elasticity | E11 | 32.296 | Gpa |
| modulus | E22 = E33 | 13.971 | GPa |
| Shear | G12 | 6.987 | GPa |
| modulus | G13 = G23 | 5.756 | GPa |
| Poisson’s ratio | v12 | 0.262 | - |
| v13 = v23 | 0.312 | - |
| Fault Type | Shortcut | Location (p) [mm] | Location (z) [mm] |
|---|---|---|---|
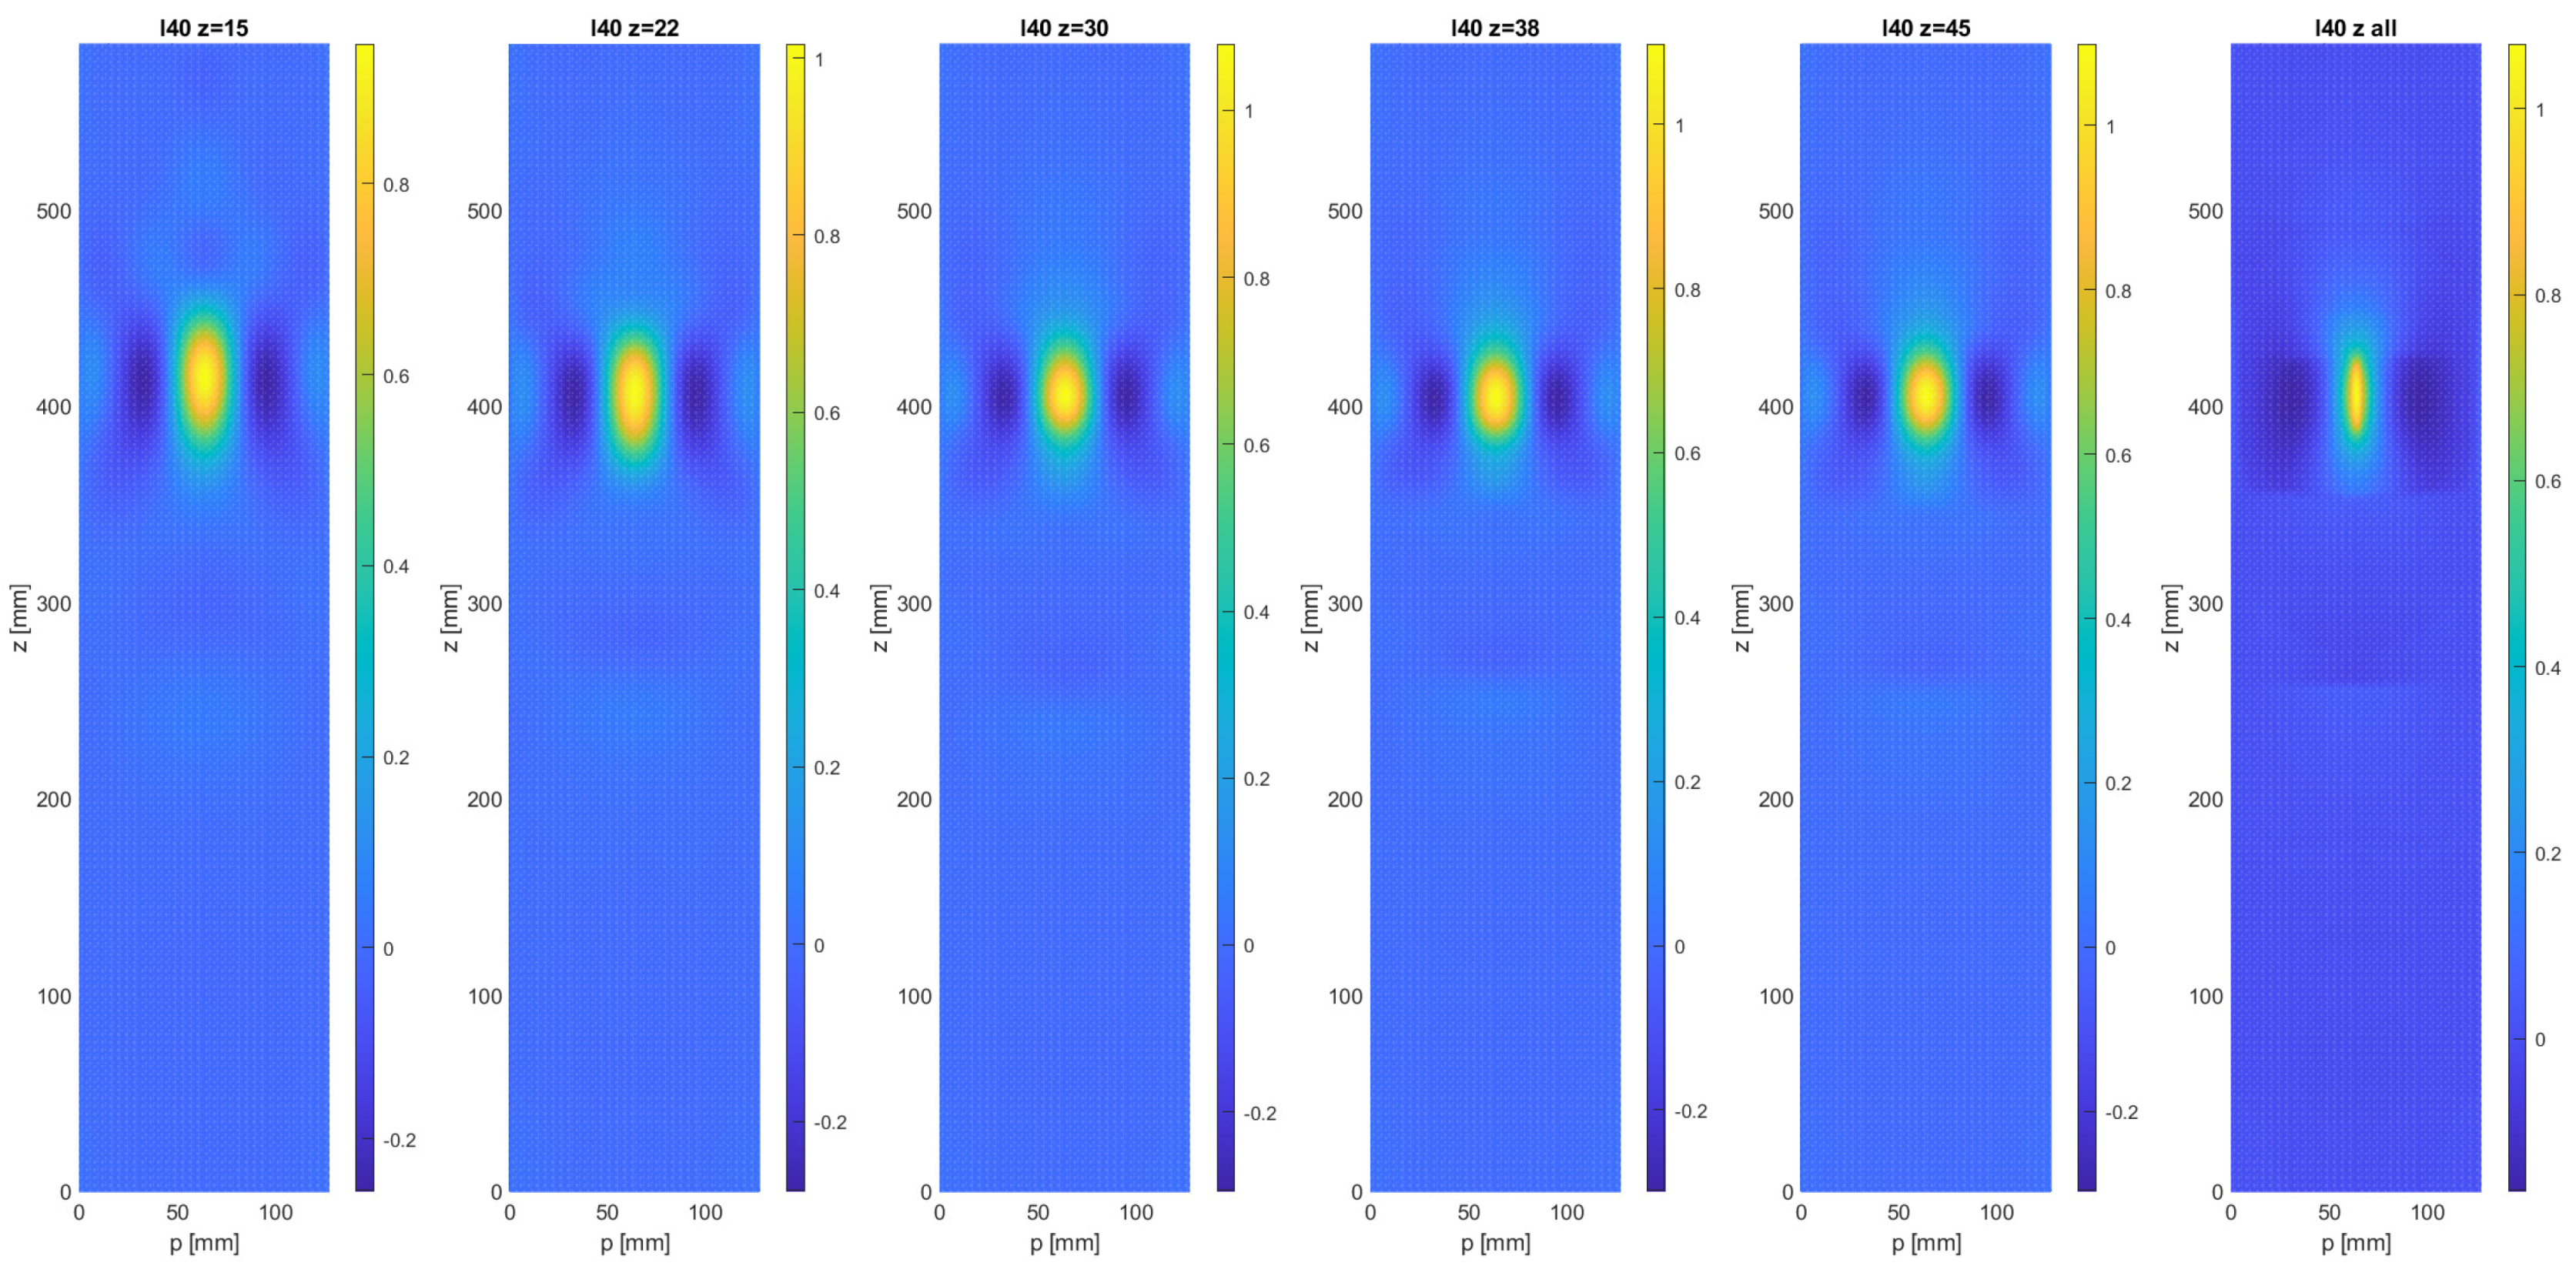
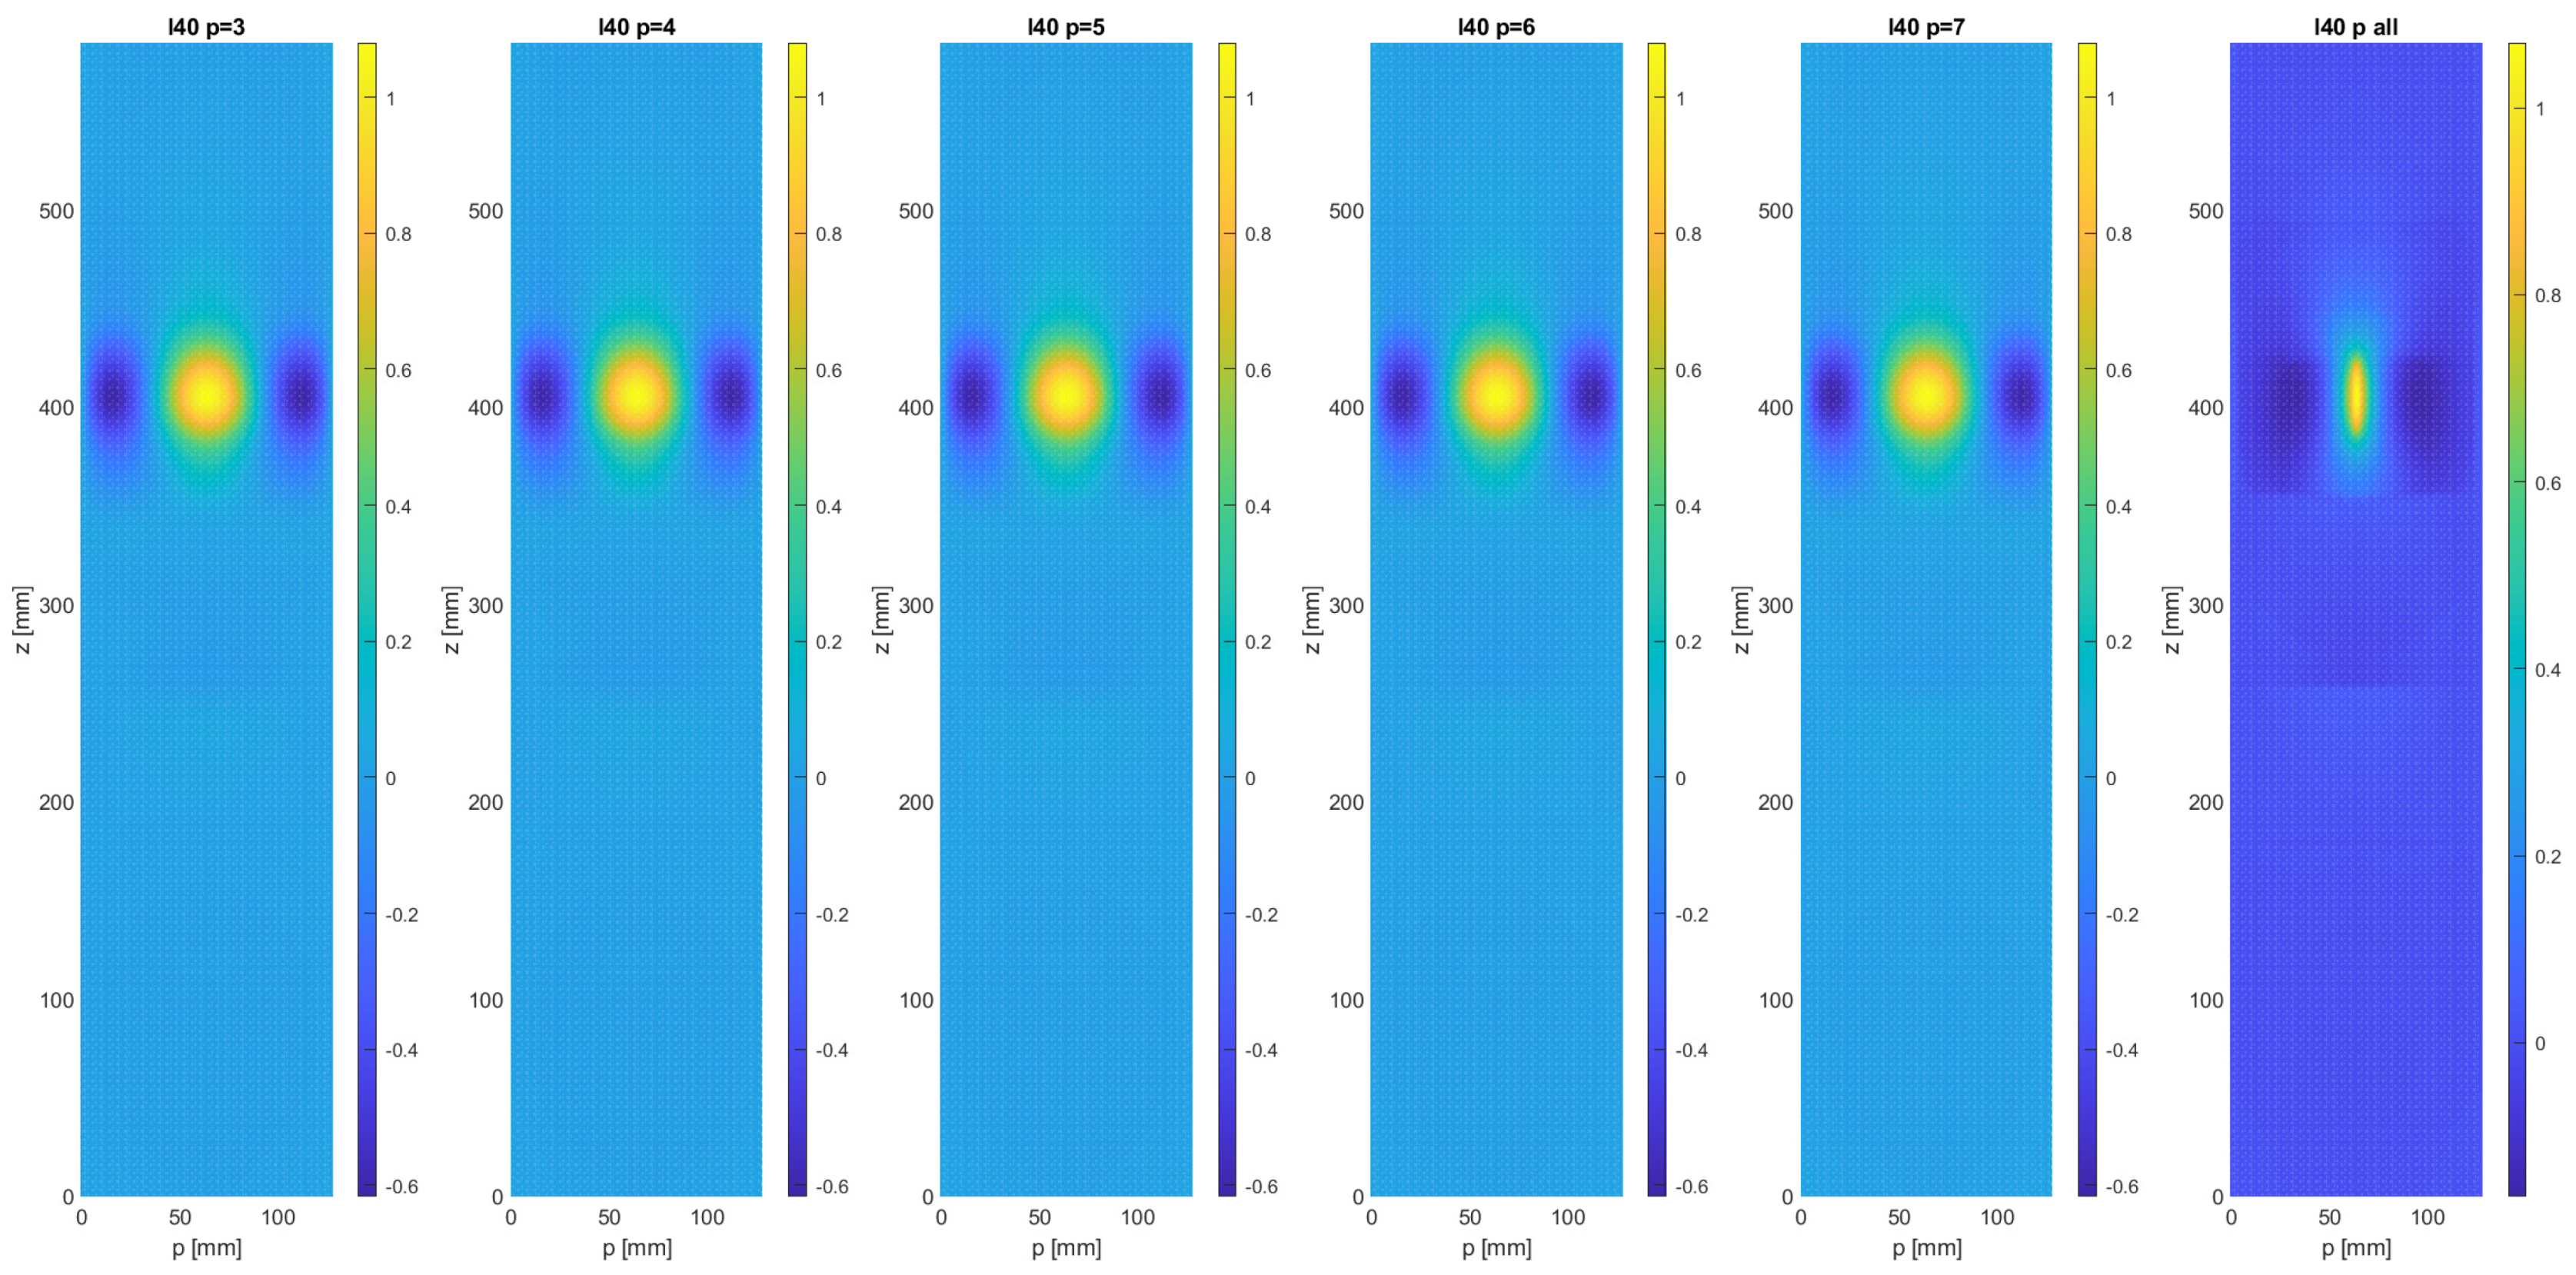
| Longitudinal | ℓ40 | 73 | 380–420 |
| Longitudinal | ℓ60 | 73 | 360–420 |
| Longitudinal | ℓ80 | 73 | 340–420 |
| Transverse | ℓ60 | 180 | 40–100 |
| Undamaged | ℓ40 | ℓ60 | ℓ80 | 2 Faults | |
|---|---|---|---|---|---|
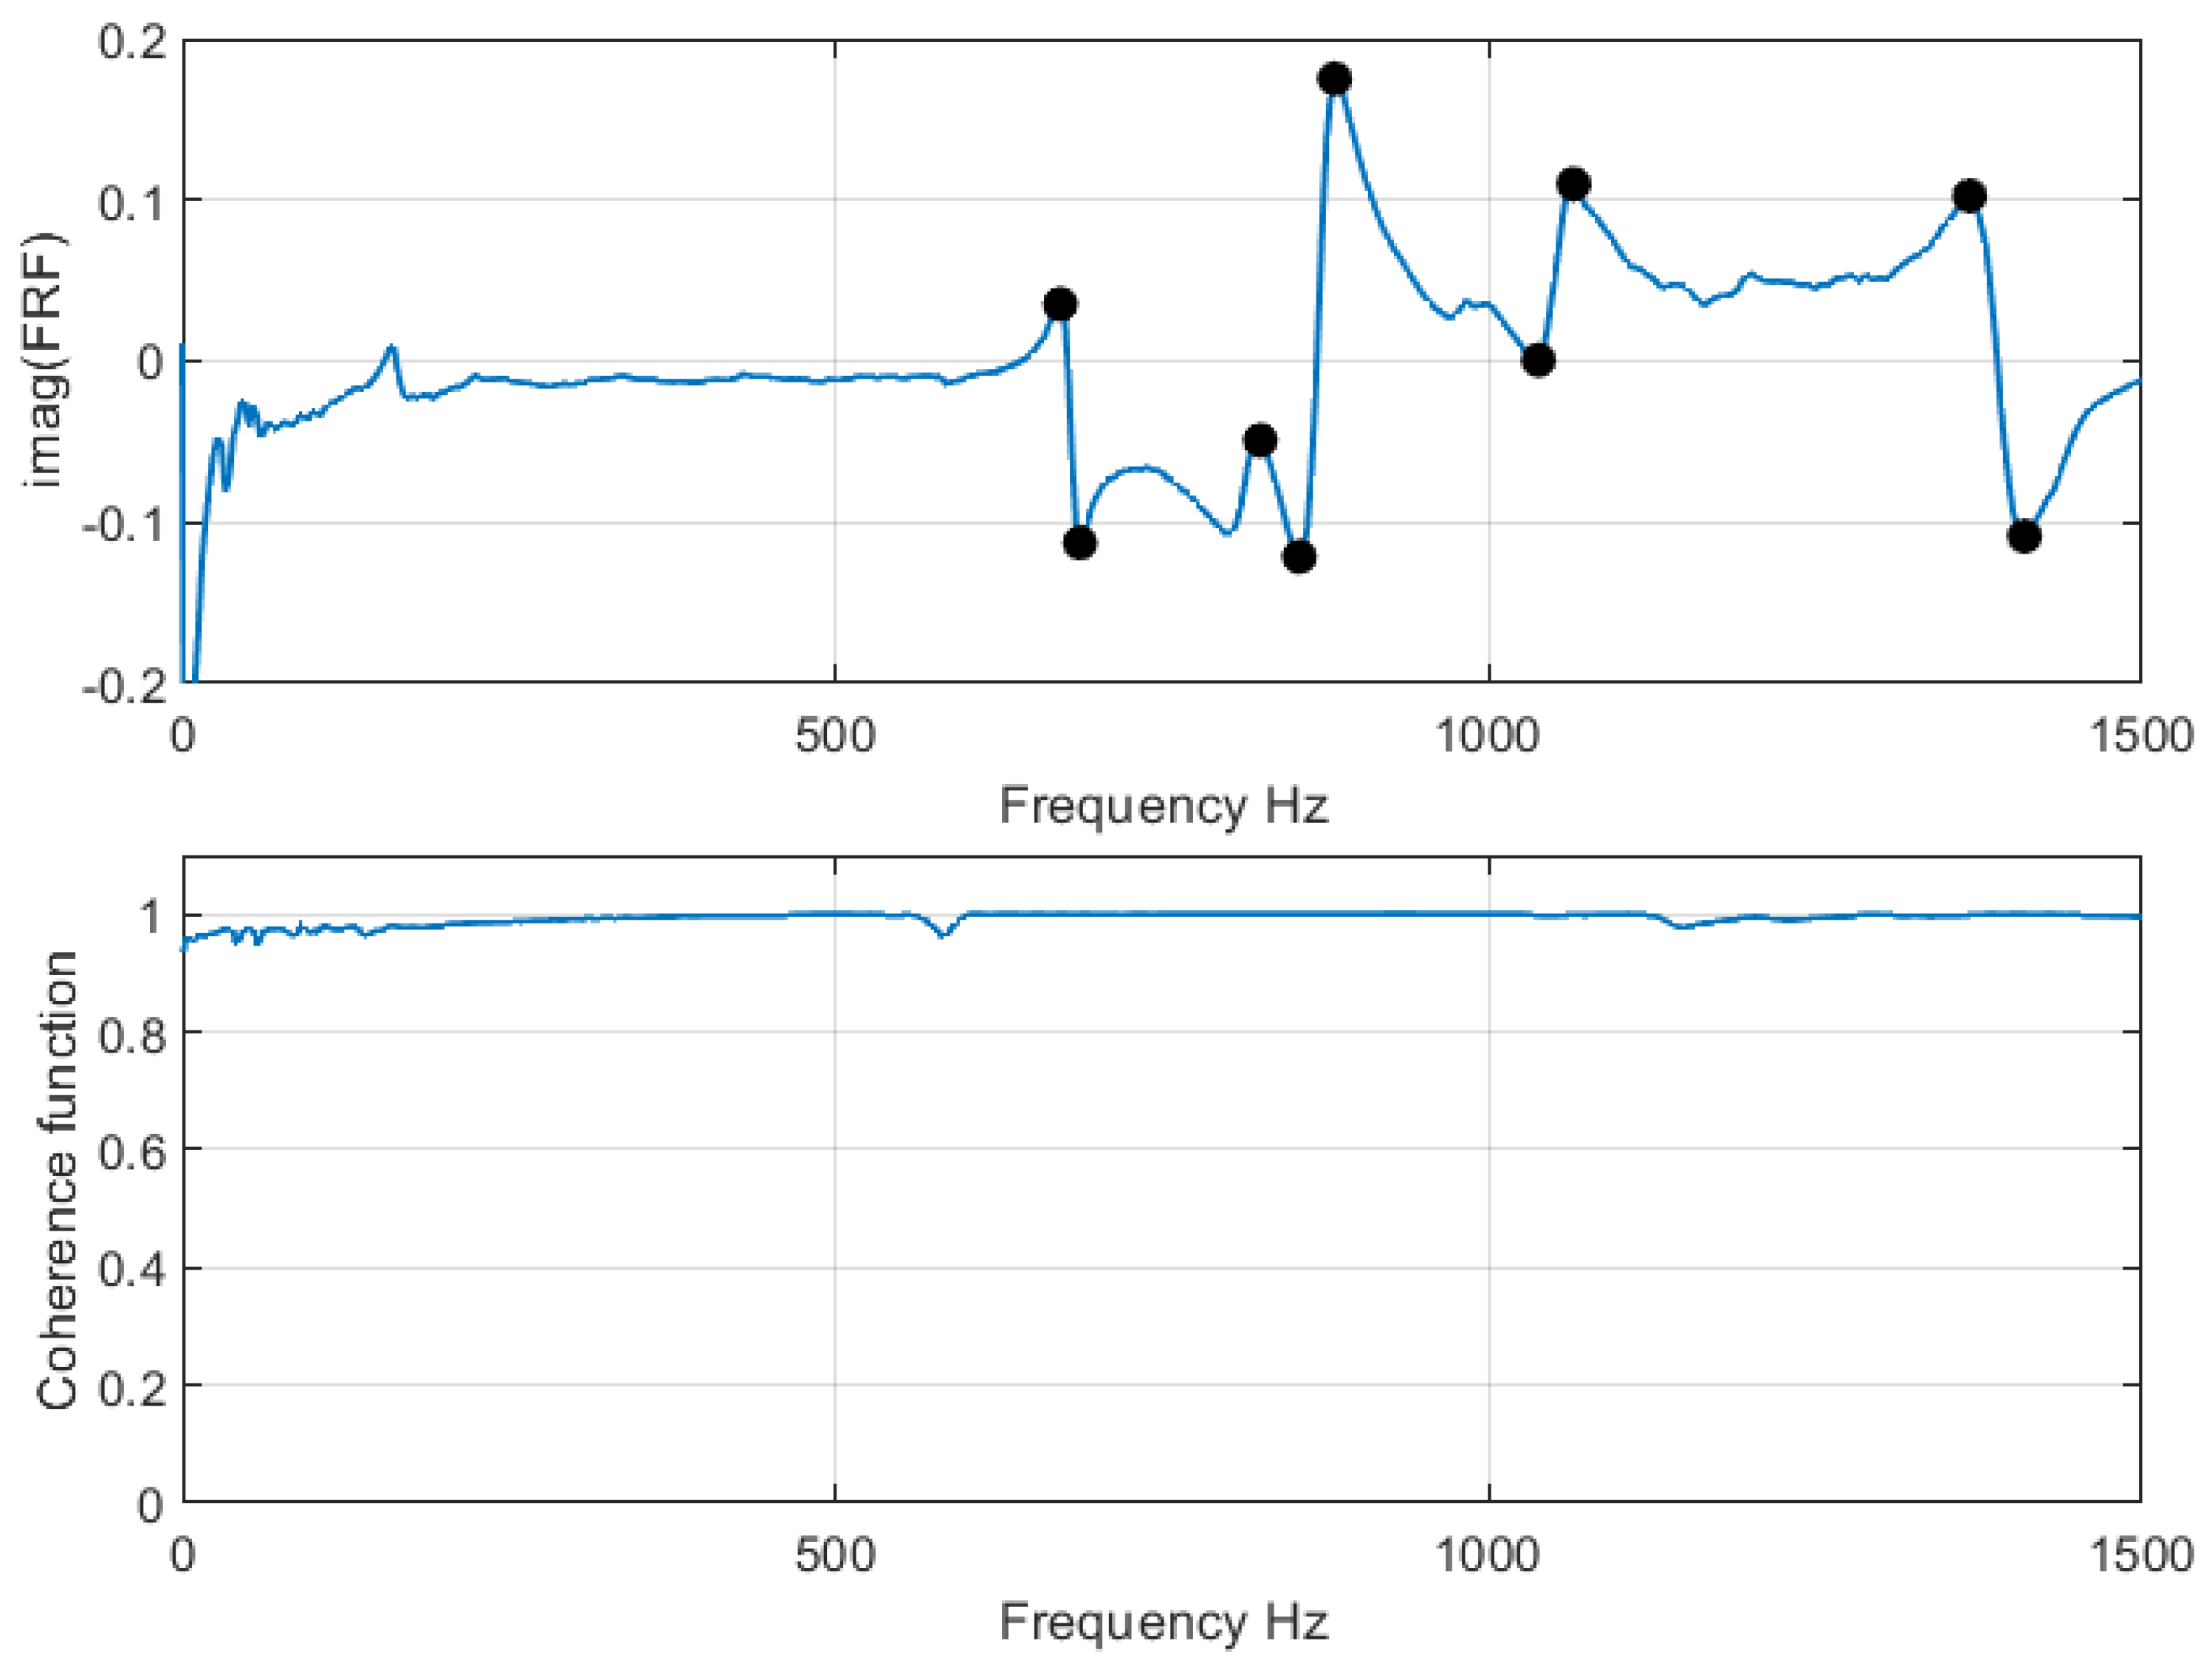
| Mode 1 [Hz] | 672 | 672 | 672 | 672 | 669 |
| Mode 2 [Hz] | 825 | 834 | 831 | 828 | 822 |
| Mode 3 [Hz] | 885 | 876 | 864 | 855 | 849 |
| Mode 4 [Hz] | 1068 | 1065 | 1065 | 1065 | 1059 |
| Mode 5 [Hz] | 1368 | 1374 | 1371 | 1359 | 1350 |
| Mode 6 [Hz] | 1410 | 1410 | 1410 | 1395 | 1386 |
| Ref. | Fault Detected | Damage Location Detected | Comments |
|---|---|---|---|
| [19] | yes | yes | Detected length 20–30% smaller than the true length of the fault. |
| [1] | yes | yes | The detected fault size was approximately correct. |
| [14] | yes | yes | All faults were detected and located correctly. The fault shape was not detected correctly, and the intensity varies significantly. The size of the faults was approximately correct. |
| [16] | yes | yes | The fault was detected in individual mode shapes. In the first mode, the signal is weak and noisy signal. In the two higher modes, the detected fault size was approximately correct. |
| [17] | yes | no | It was not possible to locate or obtain information on the size of the fault. |
| [18] | yes | yes | Comparing the two methods presented, SAGA presented better results than ANN. Lower accuracy in experimental data compared to numerical study. Mean error reported of the methods was 20% or higher. |
| [11] | yes | yes | In some experimental signals, there were features that can be mistaken for (false) damage. The size of the fault was overestimated by approximately 150%. |
| [12] | yes | yes | The size of the fault was approximately correct. |
| This work | yes | yes | Transverse and longitudinal faults are analyzed simultaneously. The size of the different faults analyzed is correctly detected. |
Publisher’s Note: MDPI stays neutral with regard to jurisdictional claims in published maps and institutional affiliations. |
© 2021 by the authors. Licensee MDPI, Basel, Switzerland. This article is an open access article distributed under the terms and conditions of the Creative Commons Attribution (CC BY) license (https://creativecommons.org/licenses/by/4.0/).
Share and Cite
Pacheco-Chérrez, J.; Cárdenas, D.; Probst, O. Experimental Detection and Measurement of Crack-Type Damage Features in Composite Thin-Wall Beams Using Modal Analysis. Sensors 2021, 21, 8102. https://0-doi-org.brum.beds.ac.uk/10.3390/s21238102
Pacheco-Chérrez J, Cárdenas D, Probst O. Experimental Detection and Measurement of Crack-Type Damage Features in Composite Thin-Wall Beams Using Modal Analysis. Sensors. 2021; 21(23):8102. https://0-doi-org.brum.beds.ac.uk/10.3390/s21238102
Chicago/Turabian StylePacheco-Chérrez, Josué, Diego Cárdenas, and Oliver Probst. 2021. "Experimental Detection and Measurement of Crack-Type Damage Features in Composite Thin-Wall Beams Using Modal Analysis" Sensors 21, no. 23: 8102. https://0-doi-org.brum.beds.ac.uk/10.3390/s21238102