
Computational Methods for Liver Vessel Segmentation in Medical Imaging: A Review

Department of Geoinformatics, Faculty of Electronics, Telecommunication and Informatics, Gdańsk University of Technology, 80-233 Gdańsk, Poland
*
Author to whom correspondence should be addressed.
Sensors 2021, 21(6), 2027; https://0-doi-org.brum.beds.ac.uk/10.3390/s21062027
Submission received: 11 February 2021
/
Revised: 7 March 2021
/
Accepted: 9 March 2021
/
Published: 12 March 2021
(This article belongs to the Special Issue Advances in Image Segmentation: Theory and Applications)
Abstract
:The segmentation of liver blood vessels is of major importance as it is essential for formulating diagnoses, planning and delivering treatments, as well as evaluating the results of clinical procedures. Different imaging techniques are available for application in clinical practice, so the segmentation methods should take into account the characteristics of the imaging technique. Based on the literature, this review paper presents the most advanced and effective methods of liver vessel segmentation, as well as their performance according to the metrics used. This paper includes results available for four imaging methods, namely: computed tomography (CT), computed tomography angiography (CTA), magnetic resonance (MR), and ultrasonography (USG). The publicly available datasets used in research are also presented. This paper may help researchers gain better insight into the available materials and methods, making it easier to develop new, more effective solutions, as well as to improve existing approaches. This article analyzes in detail various segmentation methods, which can be divided into three groups: active contours, tracking-based, and machine learning techniques. For each group of methods, their theoretical and practical characteristics are discussed, and the pros and cons are highlighted. The most advanced and promising approaches are also suggested. However, we conclude that liver vasculature segmentation is still an open problem, because of the various deficiencies and constraints researchers need to address and try to eliminate from the solutions used.
1. Introduction
Two parts can be distinguished in the liver vein system: hepatic veins and the portal vein. They have a very complex, tree-like structure. According to anatomy, venous blood flows through the portal vein, into liver, and then flows into the inferior vena cava through the hepatic veins. Hepatocellular carcinoma constitutes one of the most deadly cancers in the world [1]. Computer-assisted liver surgery (e.g., ablation and embolization) allows the clinical treatment of unresected liver tumors. Prior to this treatment, it is very important for physicians to have information about the liver contour and about its venous system. It is used for preoperative planning and intraoperative navigation. Liver vessels that feed neoplasms should be accurately located during liver embolization surgery. Knowing the detailed location of the tumor between liver vessels and information such as the diameter of vessels can determine the outcome of the ablation. New technologies are constantly being introduced into clinical practice to improve the ability to visualize blood vessels, including those of liver. They include: computed tomography (CT), computed tomography angiography (CTA), magnetic resonance (MR), and ultrasonography (USG).
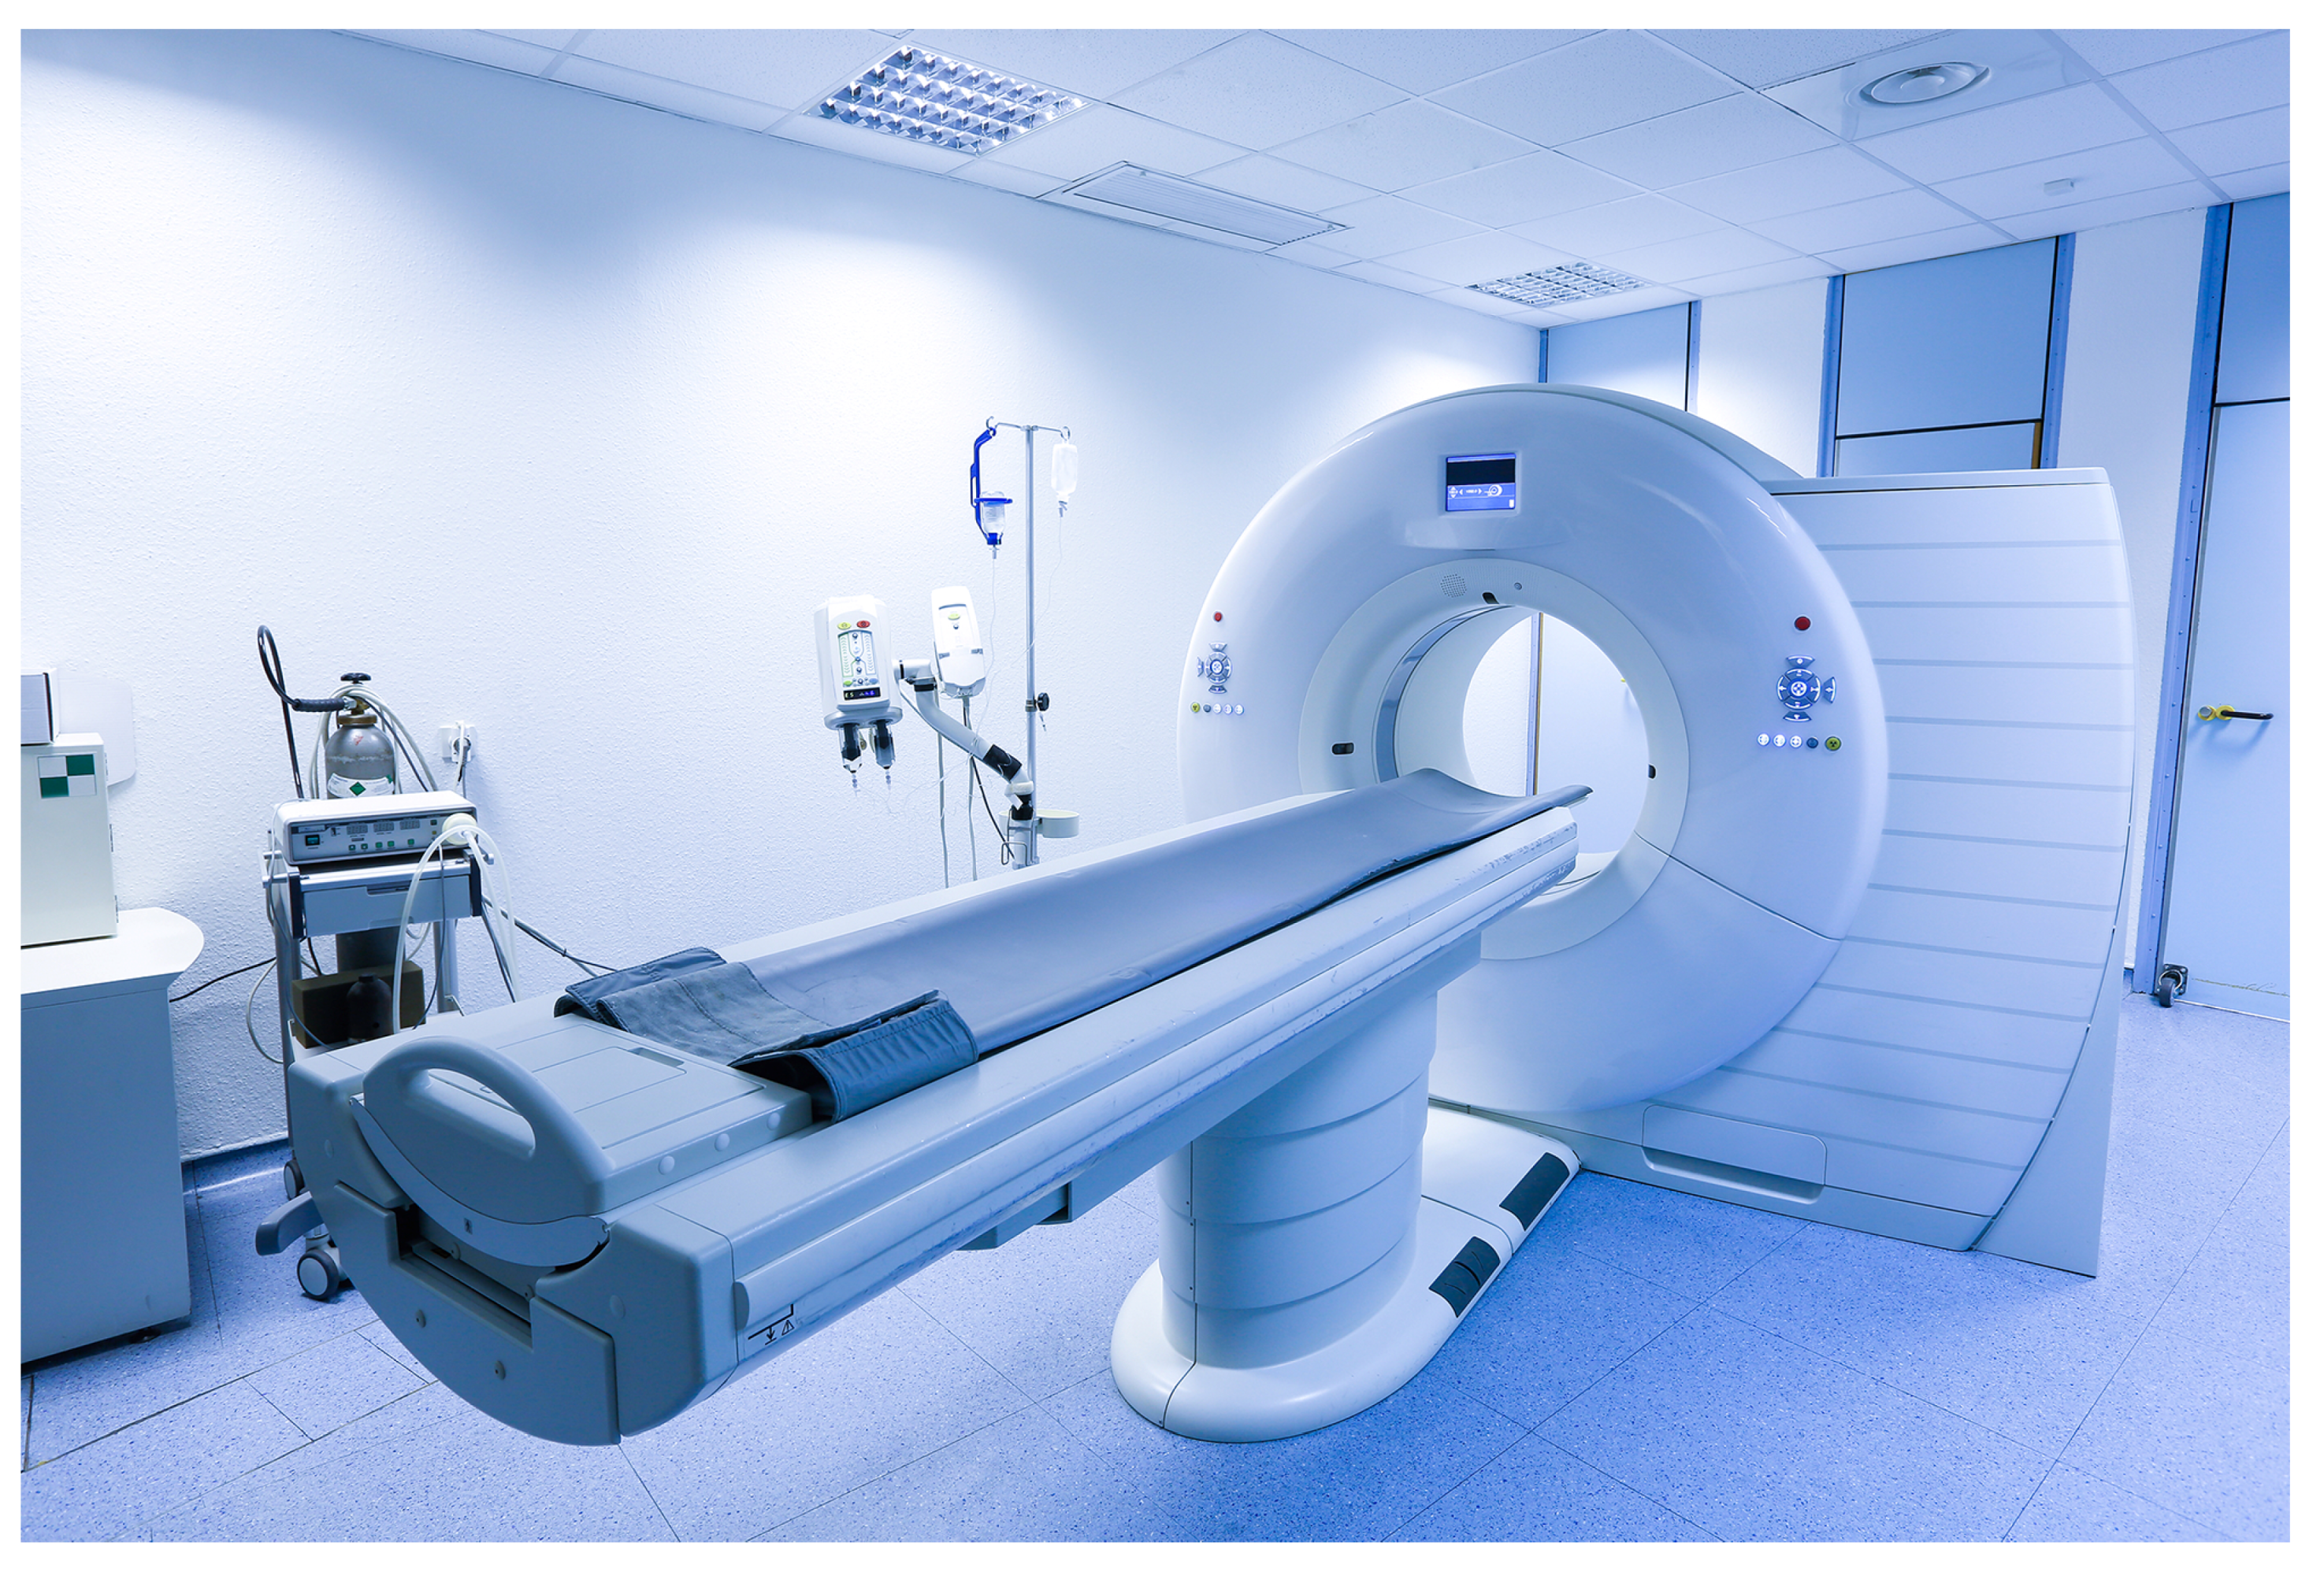
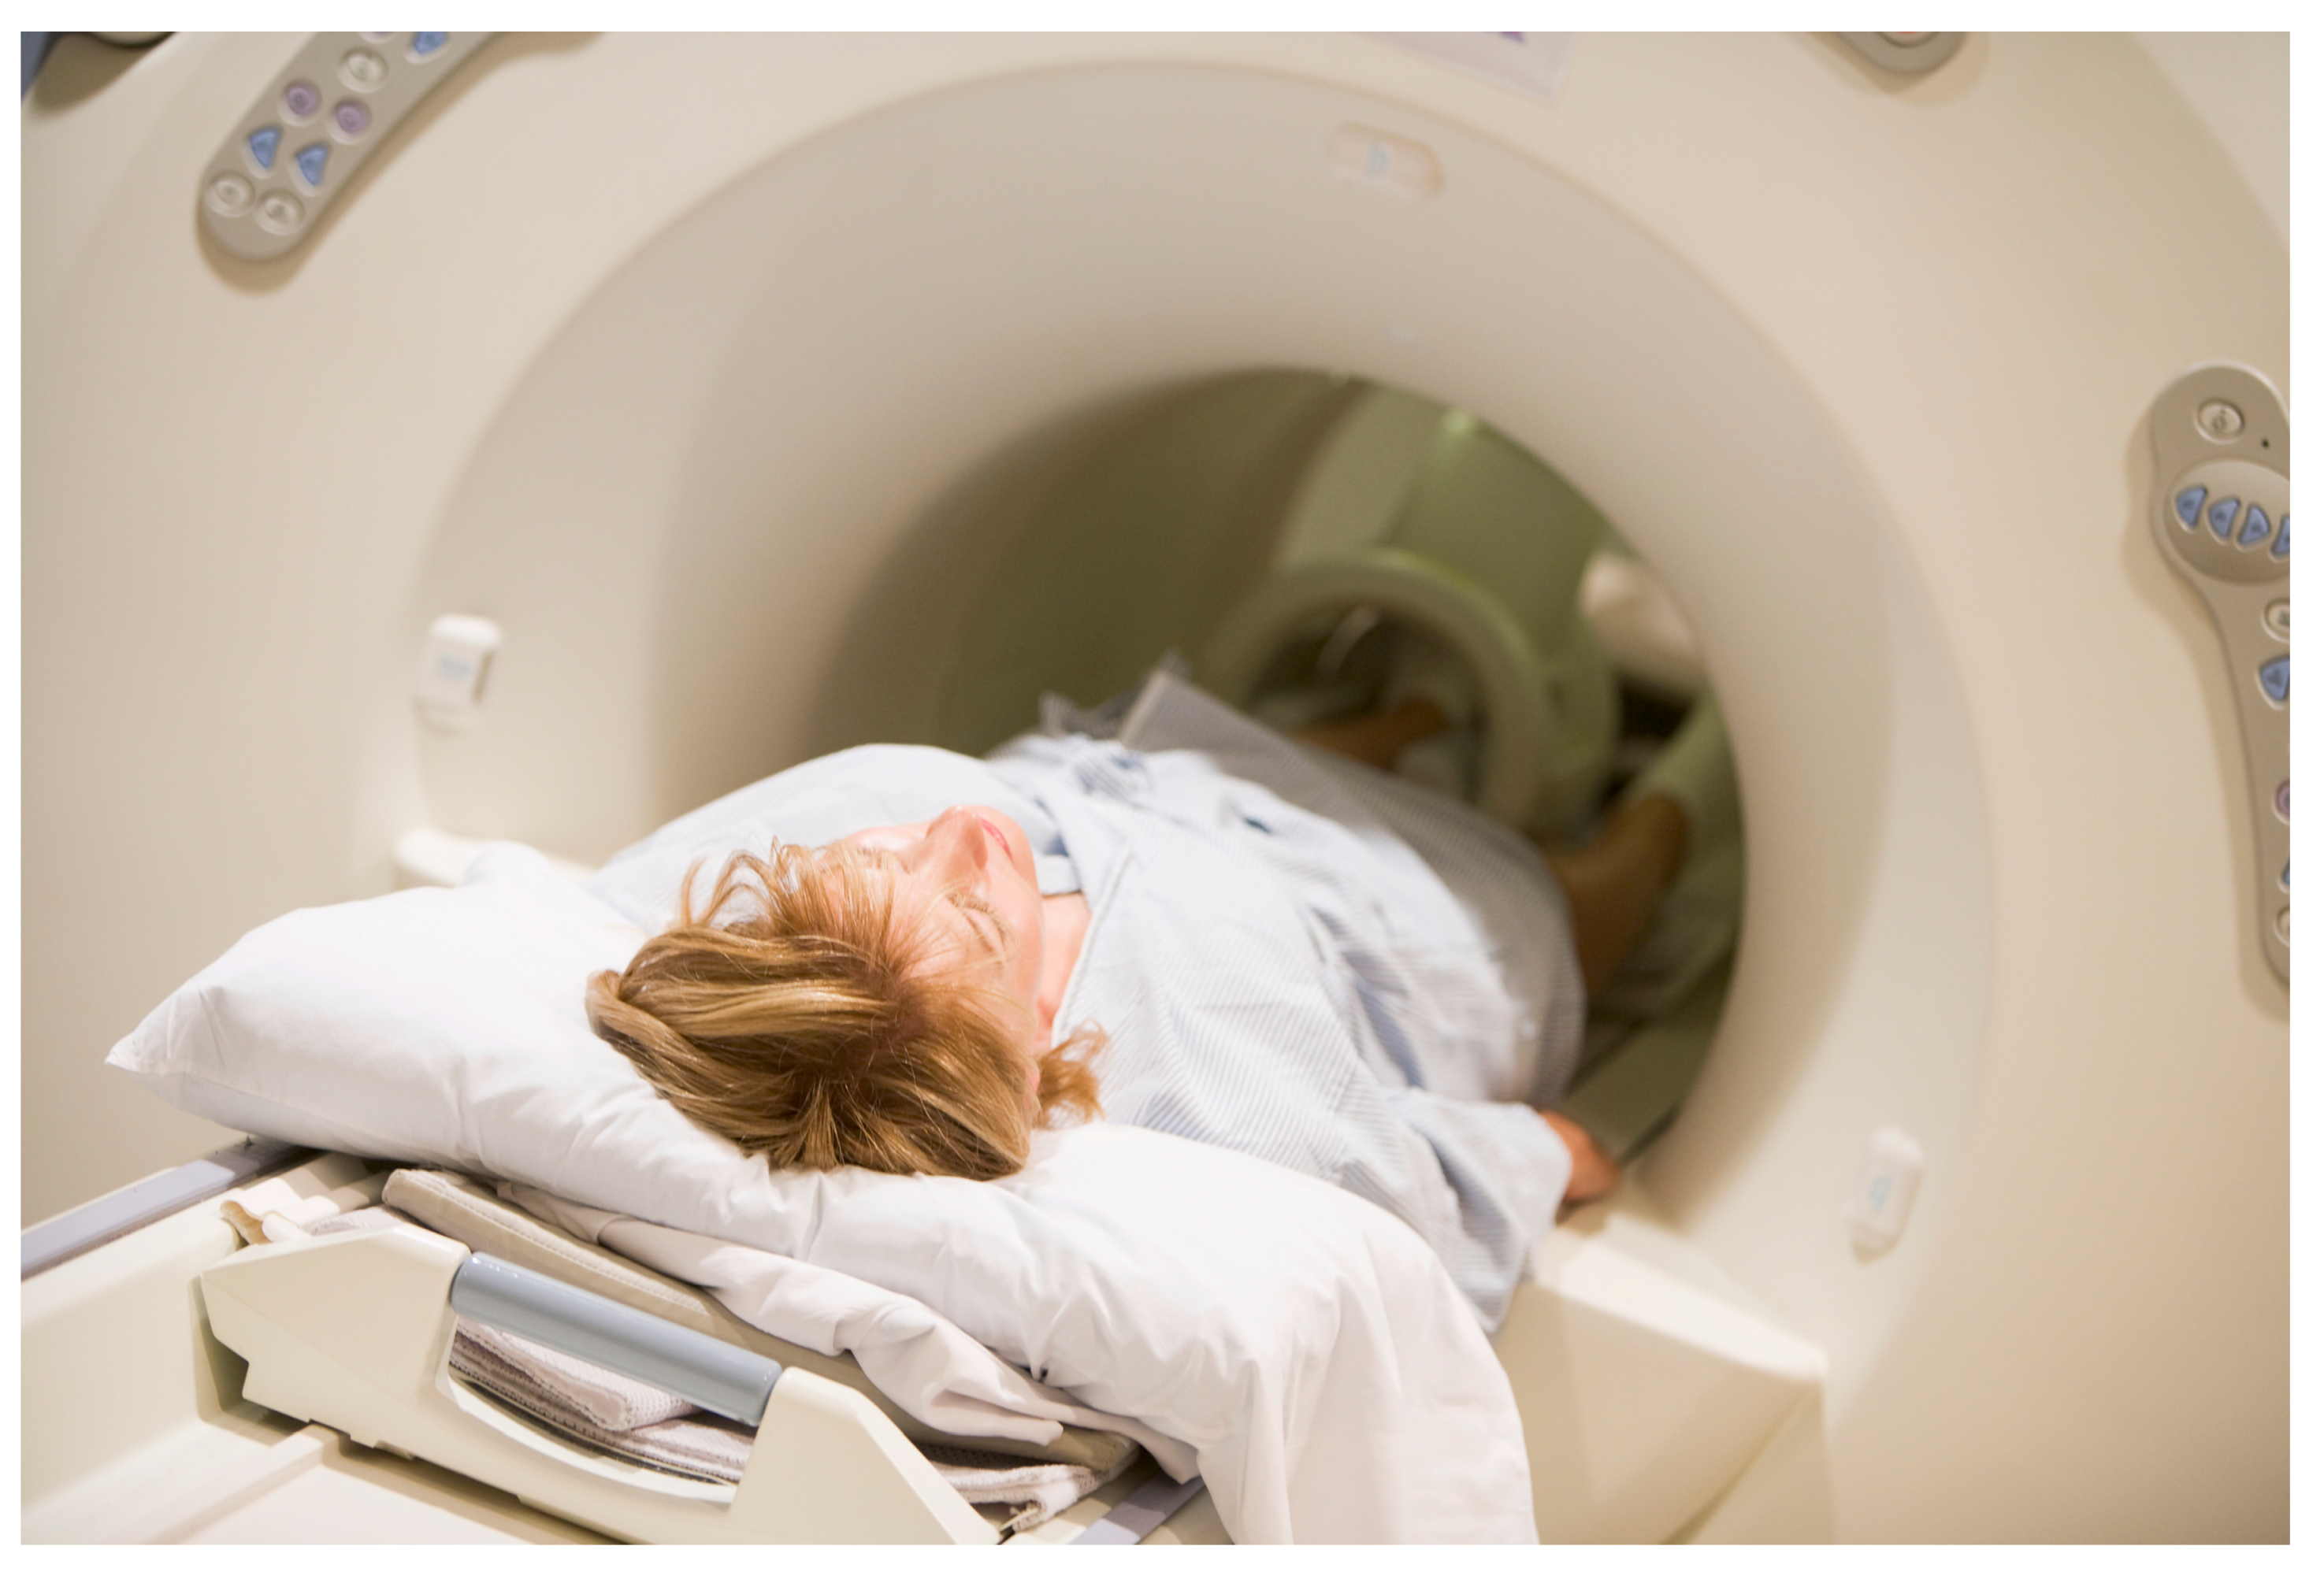
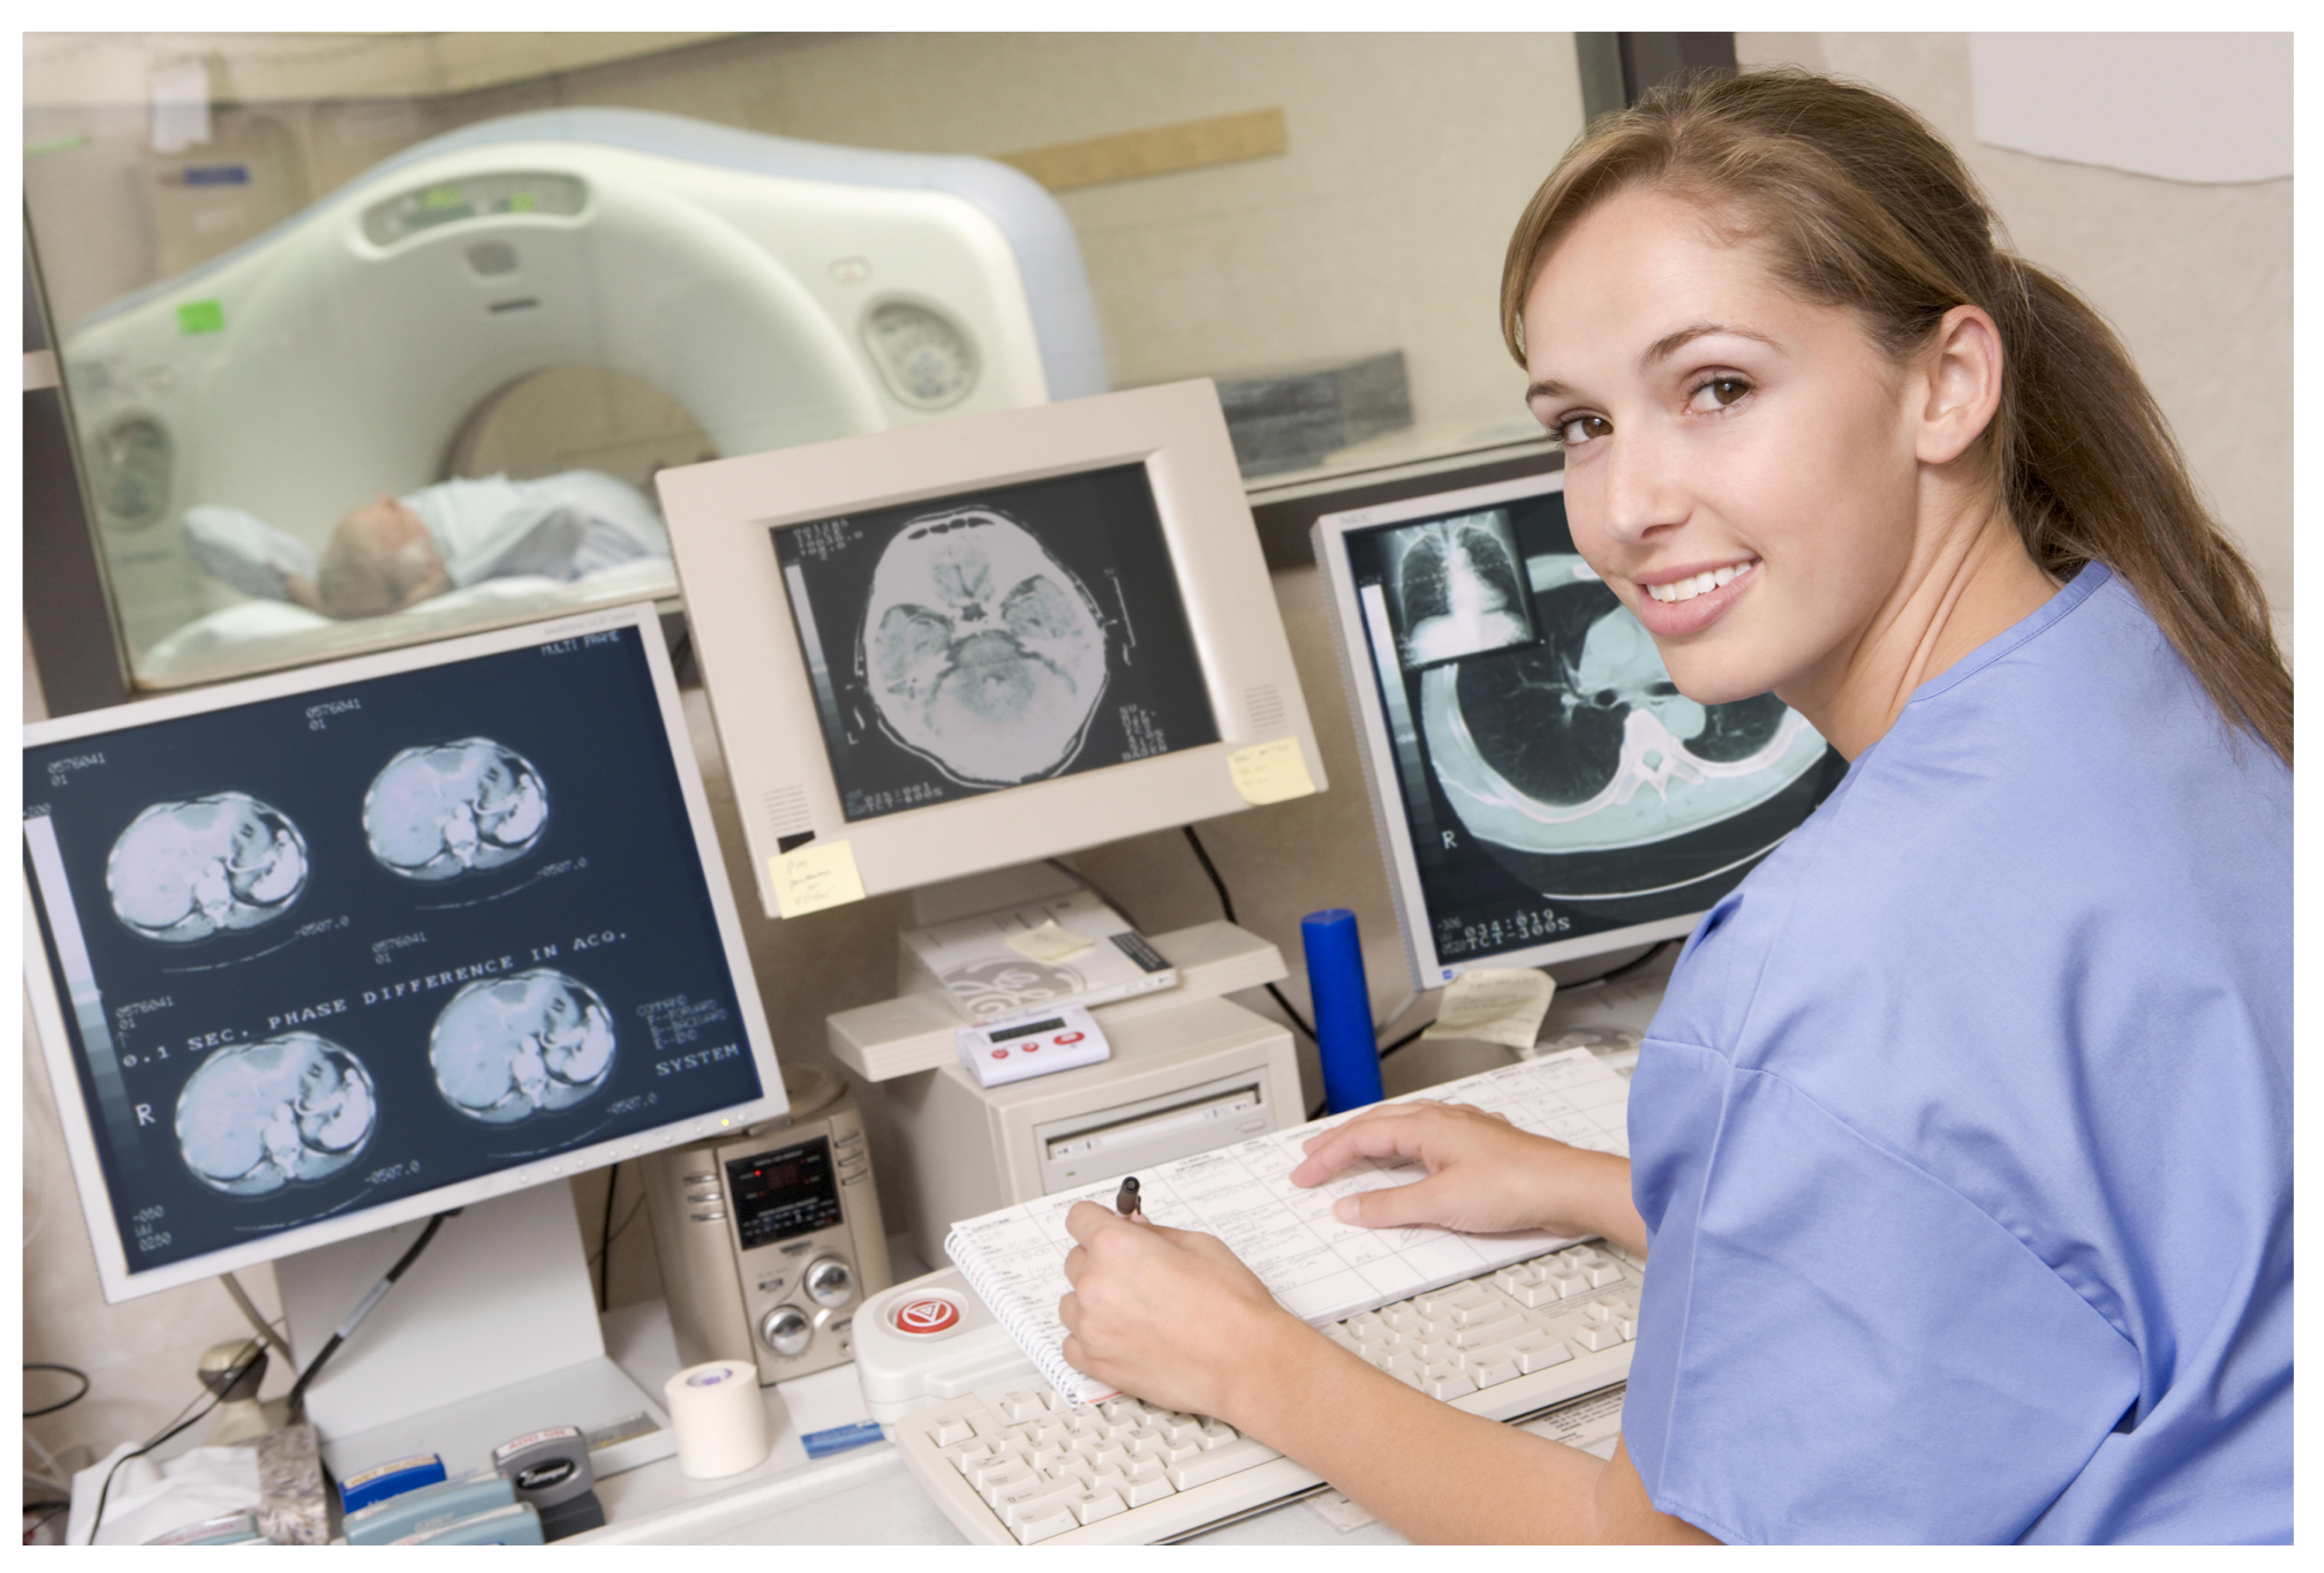
Figure 1 shows an example of a CT scanner, and Figure 2 shows a CT examination of the abdominal cavity and liver. Figure 3 shows a nurse monitoring patient during a CT scan. Figure 4 shows sample CT images of liver and a 3D visualization of its blood vessels.
Manual liver vessel segmentation is time consuming and tedious and often becomes impossible if the number of medical images is high. In addition, its results may vary, as they depend on the operators’ experience and skill.
Automated and semi-automated image processing tools can reduce the number of manual interactions and greatly simplify the work of physicians, which is why they are attracting the increasing attention of researchers, as proven by the large number of articles published on this subject. There are many studies of blood vessel segmentation in the literature, including review papers in this field [2,3,4,5,6]. However, due to the intensive progress in research, new review papers are needed to update the state-of-the-art and examine the results obtained in detail.
This paper is provides a systematic review of current methods of liver vessel segmentation and classification, based on the literature. Each group of methods is briefly presented in terms of its ability to segment images in general and then liver vessels in particular. The pros and cons of the approaches used are also described for each group of methods. What is also presented are the metrics used to evaluate segmentation results and publicly available datasets. The paper also discusses possible future directions of research on liver vessel segmentation. Figure 5 presents the classification of the approaches, based on papers referred to in this review. Table 1, in turn, summarizes articles including the year of publication and the imaging technique.
During the literature review, four databases (Google Scholar, IEEE-Explore, Scopus, Springer) were searched using the following search terms: ((liver vessel segmentation) and (hepatic vessel segmentation) and (liver vessel segmentation deep learning) and (CT or CTA or MR or USG)). The analyzed period covered results from 2010–2021. The following criteria were adopted to reject articles: (a) articles not written in English; (b) articles not developing any segmentation method; (c) research not related to liver vessel segmentation; (d) duplicates of articles from the same research project; (e) articles in which tests and validations of segmentation methods were not conducted. As a result, 31 publications were selected and are shown in Table 1.
The remainder of this paper is organized as follows. Section 2 describes the division of liver vessel segmentation methods into different groups according to the literature review. Section 3 presents measures of segmentation performance, and Section 4 lists publicly available datasets that were used for research. The next three sections describe state-of-the-art approaches based on active contour methods (Section 5), tracking methods (Section 6), and machine learning (Section 7). The last section contains challenges and conclusions.
2. Methods of Segmenting Liver Blood Vessels
At the pre-processing stage, input images are filtered to eliminate noise, enhance contrast, and extract features (Figure 5). Different pre-processing methods are employed because the imaging techniques (i.e., CT, CTA, MR, USG, according to Table 1) and equipment used produce images of different resolution, contrast, and noise in them. A detailed literature review concerning the different pre-processing methods was presented in [39].
Methods for segmenting liver blood vessels can be divided into the following groups:
- -
- Vessel enhancement approaches
- -
- Active contour methods
- -
- Tracking methods
- -
- Machine learning approaches
Vessel enhancement approaches improve the contrast of vessels and make them easier to extract from the background of the image, for example by applying thresholding. However, as Figure 5 shows, vessel contrast enhancement also constitutes the initial stage used by other methods to produce the final segmentation. There are comprehensive reviews of the literature on enhancement methods [3,40,41], so these methods are not described here. The last step in segmentation is post-processing, which has a supporting role and is intended to, e.g., remove noise and minor artifacts that do not correspond to vessels, as well as to connect vessel sections if they are incomplete as a result of the segmentations done.
3. Segmentation Metrics
Evaluating completed segmentations makes it possible to compare the performance of methods and also to improve them and/or develop new, better solutions. This section presents segmentation performance measures implemented in all reviewed studies. Table 2 summarizes segmentation performance measures on the basis of thirty one articles. However, this paper rather rarely deals with the reliability and consistency of the results of individual studies, based on a review of the literature.
4. Publicly Available Evaluation Datasets
Table 3 lists five publicly available datasets containing images for segmenting and producing 3D visualizations of liver blood vessels. Three datasets are used for research according to a current review of the literature, namely:
The dataset called Medical Segmentation Decathlon (MSD) [55] has not been included in research results yet as it has only recently been published, but it contains vascular ground-truths. The second dataset in which vascular ground-truth masks have been made available is 3D-IRCADb [53]. The Combined (CT-MR) Healthy Abdominal Organ Segmentation—CHAOS challenge database [56] is available as a set of CT and MR images of liver and its blood vessels. It has only been published recently and has not yet been used in research.

Table 3.
Publicly available evaluation datasets. SLIVER07, Segmentation of the Liver Competition 2007; 3D-1RCADb, 3D Image Reconstruction for Comparison of Algorithm Database; MSD, Medical Segmentation Decathlon.
Table 3.
Publicly available evaluation datasets. SLIVER07, Segmentation of the Liver Competition 2007; 3D-1RCADb, 3D Image Reconstruction for Comparison of Algorithm Database; MSD, Medical Segmentation Decathlon.
| Name | Number of Images/Volumes |
|---|---|
| SLIVER07 [51] | 30 CT |
| 3D-1RCADb [53] | 22 CT |
| (http://www.ircad.fr/research/3dircadb/) | |
| (accessed on 5 May 2019) | |
| MSD [55] | 443 CT |
| (http://medicaldecathlon.com/) | |
| (accessed on 20 December 2020) | |
| CHAOS [56] | 50 CT and 59 MR |
| (https://chaos.grand-challenge.org/Data/) | |
| (accessed on 20 December 2020) | |
| Vascular Synthesizer [54] | 120 (3D synthetic data) |
Unfortunately, manual segmentation is a tedious and time-consuming task. What is more, it requires much input from experts. Synthetic data, in turn, allow representing certain important characteristics of the vessel tree, such as its thickness, tortuousness, and brightness profile [54]. These characteristics are important for evaluating methods under development. In addition, synthetic data can easily be modified. However, despite these advantages, phantoms cannot replace clinical data, including, e.g., the high variability of vessel shape, which results from patients’ individual traits. This is why some studies use both real medical images and synthetic data for the best possible matching of the necessary parameters and obtaining reliable results. Unfortunately, there is no publicly available dataset for ultrasonographic (USG) images in Table 3. This is because such a dataset does not exist yet.
5. Active Contour Methods
The active contour model (ACM) is a method that allows adapting a deformed curve or curves to detect the boundaries of an object. The models developed include: (a) models with an explicit representation of the curve; (b) models with an implicit representation of the curve.
An example of models with an explicit curve representation are the edge-based methods [57,58]. Edge-based models use local edge information (e.g., gradient) to fit to the boundaries of the approximated shape in the image.
In the case of the implicit representation, the ACM is expressed using the level set method [59,60]. When the level set method is used, the object contour is defined by a zero level set. The contour adapts in successive iterative steps, which are established based on a partial differential equation (PDE) for the defined energy functional. Methods utilizing level sets cope much better with topological changes of contours than methods with an explicit representation of the curve (contour) and support, for example detecting boundaries of multiple objects. This class of methods seems to be suitable for segmenting complex vessel trees, including those with large variations in shape and size. These methods may be useful for segmenting vessels in images from healthy patients, as well as those showing vascular pathologies. However, the use of these methods in real-time applications is limited by their computational cost.
5.1. Edge-Based Method
Reference [10] presented an ACM with shape and size constraints on the cross-section of vessels. The proposed approach starts with the extraction of the vessel axis from the source 3D CTA data. Next, the vessel boundary is delineated on the vessel cross-section from this axis, and then, an ACM is applied to segment vessels under constrained movements.
5.2. Level-Set Method
Zeng et al. [7] used the ACM presented in [61], which utilizes boundary information to obtain the correct location of the blood vessels being approximated and region information to stop the contour from leaking beyond the boundaries of vessels. The ACM was used together with the K-means clustering method [62] to improve thick vessel extraction. The K-means clustering method was used to enable initializing the ACM.
In [8], an active contour method was proposed, which uses image information, namely regional intensity distribution and a calculated map of the probability of the occurrence of blood vessels, to segment both thick and thin vessels. This approach allows segmenting both the portal vein and the hepatic vein in such a way that these veins do not need to be separated from each other. What is more, connections between the portal and hepatic veins do not affect the performance of the method developed.
Lu et al. [9] presented a variational level set method for segmenting liver blood vessels in magnetic resonance (MR) images. This approach uses non-local robust statistics to reduce noise in MR images. The non-local robust statistics that allow vascular features to be represented are adaptively learned based on seed points marked by the user.
Shang et al. [11] developed the vascular active contour model (VAC) for segmenting blood vessel trees. The VAC model uses: data on the intensity distribution in the region of the vessel, as well as the multi-scale vascular vector field and curvatures related to tubular structures. The vascular vector field allows the active contour to evolve along its centerline into thin and weak vessels. The combination of a region-based active contour model with the vascular vector field allows segmenting large vessels and accurately detecting thin vessels at the same time.
A summary of the analyzed active contour methods is presented in Table 4.
6. Tracking Methods
Methods for tracking blood vessels should be initiated using a single seed point or a specified number of them, and then, subsequent points are found based on image-derived data. Seed points can be initiated manually or derived from image pre-processing methods. Vessel tracking algorithms can be useful for segmenting very branched vascular trees for which a certain number of seed points initiated separately for each branch must be used. Among the existing approaches, one can distinguish methods that track vessels according to the vascularization model, as well as minimum cost path methods (MCP), which determine the minimum path between two seed points based on image-derived metrics.
6.1. Model-Based
These methods use certain predefined 3D models, usually tubular. After the model is initialized, a new position is obtained in every subsequent iteration by finding the best match. The match is calculated based on specific image features (e.g., intensity, gradient) that are determined in the neighborhood of the current model position. Unfortunately, these approaches can identify incomplete blood vessels, which may be due to intensity inhomogeneity, noise, and also the presence of pathologies.
The approach described in [22] utilizes a 3D geometrical moment-based detector to determine the vessel center, diameter, and local direction. This step allows automatic tubular structure detection. Then, the detected structures are described as vessel presence probabilities and used as a local constraint in a graph cut segmentation [63]. These methods avoid the shrinking bias on elongated structures, which often appears when the graph cuts algorithm is used.
In [20], an approach was developed in which vessel skeletons are extracted using tubular structures. Segmentation was performed using the graph cuts method [63], which splits the image into two different sets, i.e., the vessel and the background. The proposed solution allows tubular structures to be grouped into complete trees and also interwoven trees to be separated. The use of structural information about tubular trees is also enabled to reduce segmentation errors such as under segmentation or leakage.
Sangsefidi et al. [15], in turn, presented a modified graph cuts algorithm. A conventional graph cuts algorithm uses the image gradient and does not have sufficient data to extract vessel boundaries, especially of vessels that are small and in low contrast regions. This is why the authors of [6] defined a balanced data term of graph cuts to improve the results of segmenting liver blood vessels. In [15], vessel centerlines were used to calculate the expression of a local data term from the image, which can then be used to balance the calculated total energy in regions with low contrast and small vessels.
The approach taken in [14] is to propose an intensity model based on kernel fuzzy C-means to extract intensity features of thick vessels. In addition, a centerline constraint and intensity model were used to determine the position and distance for identifying thin vessels. Then, the centerline constraint and intensity model were integrated into graph cuts to produce the final tree of liver blood vessels.
Guo et al. [12] first pre-processed CT images using a Hessian filter and an anisotropic filter to enhance the contrast of liver vessels and remove noise. In the next step, they used an improved three-dimensional graph cuts algorithm for the initial segmentation of vessels. Subsequently, vessel centerlines were determined using a thinning algorithm, and the connectivity of these lines was ensured. False branches were deleted.
In [13], blood vessels were segmented in several steps. First, the vesselness filter proposed by Sato et al. [64] was used for principal component extraction. This filter was used with three parameters to: (1) select the scale of the structures to be detected, (2) define the appropriate size of tubular structures, and (3) enhance contrast (i.e., remove non-uniform contrast). Then, the 3D model extracts vessels and extends centerlines. In the next step, vessels are connected to each other according to their anatomy. Then, a non-linear operator, called RORPO (ranking the orientation responses of path operators) [65], is applied to the partial vessel skeleton produced in the previous step. The RORPO operator allows the intensity of curvilinear structures to be maintained. In the next step, anisotropic diffusion filtering [66] is used, and the gradient magnitude is calculated. At the end, a three-dimensional vessel reconstruction is performed for each voxel [67].
Yang et al. [16] presented the segmentation of liver vessels, namely the portal vein (PV) and the hepatic vein (HV), based on identified seed points and threshold intervals, using the region growing method implemented in the Insight Toolkit (ITK) environment [68]. The region growing method begins the segmentation from the identified seed points, then finds adjacent voxels and adds them to voxels already identified if the former voxels are within the defined threshold intervals. Connected vessel branches are then identified by the connected component analysis method in ITK [68]. If the PV and HV are interconnected, the user can use a scalable 3D sphere to remove the voxels connecting them.
In [18], a method for extracting the liver venous tree was presented. First, potential vessel intersection points between portal and hepatic venous systems are extracted. Then, every neighborhood of a vessel intersection is modeled using a robust twin-line random sample consensus (RANSAC) shape detector. Yan et al. [18] found that the RANSAC method is insensitive to deformations in vessel masks and noise. The last step is to segment the venous tree based on results produced by the RANSAC method and physical constraints posed by Murray’s law [69], which are determined for the vessel radii at each bifurcation.
Chi et al. [19] proposed a liver vasculature segmentation method, which locally groups voxels into branchings and then globally groups different vessel systems using a multiple feature point voting mechanism. Vessel context-based voting allows blood vessels of liver to be identified and segmented using region-based features. The vessel context defines the context information of a voxel, related to certain vessel properties such as intensity, connectivity, direction, and saliency. Vessel context is updated after each successful grouping operation until all branches are matched.
6.2. Minimum Cost Path
This method allows the shortest path to be found between two selected points ( and ) by minimizing the energy functional, which is influenced by the metric tensor M [70]. M here is defined based on selected image features such as intensity, gradient, or higher order derivatives. The point is the only global minimum of the functional M. Energy is minimized by calculating the minimum action map, which is usually determined using the fast marching method (FMM) [71]. Then, the path between points and is obtained along with decreasing gradient values from the resulting map, where is the starting one.
Zeng et al. [17] used optimal oriented flux and oriented flux antisymmetry [72,73]. They combined these two methods to detect blood vessels. Then, after vessel centerlines were automatically extracted, the FMM method was used together with graph cuts to perform the segmentation. The approach presented in [17], including the extraction of centerlines, allows small, thin, and overlapping vessels to be effectively segmented.
In [21], first the Hessian-based vesselness filter was used to allow vessels of a certain diameter to be enhanced. Then, iterative ridge-oriented region growing, whose implementation was based on the FMM method, was applied. Skeleton-based post-processing was also used to interactively correct vessel segmentation errors.
The approach proposed in [23] is executed in two steps. In the first step, the boundaries of larger vessels are extracted using the graph cuts method. This way, larger vessels are detected globally, based on estimates of certain parameters (e.g., intensity contrast, noise level). Then, smaller vessel branches are segmented by the vessel tracking method based on results obtained using the medialness filter [23]. The medialness filter presented in [23] uses the expected intensity profile and the assumption of the circularity of vessels processed. Smaller vessels are tracked with the minimal path detection method, which is executed on a discrete grid, whereas the costs of graph edges are computed from the results obtained using the medialness filter.
Table 5 summarizes the segmentation results obtained using tracking methods.
7. Machine Learning Methods
Two groups of machine learning methods can be distinguished: supervised and unsupervised. Supervised learning uses a dataset that contains the expected answer. For segmentation, these are ready reference examples that must be provided to train the learning model. In unsupervised learning, on the contrary, no answers are provided, only a dataset. This approach is useful if no public datasets are available that would include, e.g., examples of correct segmentations, or if such data are not used.
7.1. Unsupervised
Unsupervised learning models use certain special characteristics from the statistical distribution, based on input data. These models learn to label every image without knowing ground-truth labels. The lack of available reference segmentations justifies the use of such models. However, the results obtained are generally poorer than from supervised methods. These models conduct the segmentation based on indeterminate image features such as the local intensity and gradient.
Goceri et al. [33] applied k-means clustering to the initial segmentation of blood vessels. Then, certain morphological operations were executed to improve the results. The method used can be adjusted to different brightness distributions in the image by selecting the appropriate morphological operators while using the k-means method, which operates automatically.
The authors of [37] proposed a method of region growing in which pixels are included based on a defined range of intensity values. The extreme values of the interval being determined are obtained by matching with Gaussian functions and using the Gaussian mixture model (GMM). This method can be used to segment liver blood vessels if the pixel brightness distribution in the image is close to Gaussian. The portal and the hepatic veins are separated using certain geometric features such as their size and connectivity.
A combination of four 3D vascular filters, including Sato [64], Frangi [74], offset medialness [75], and strain energy [76], was introduced in [35] to extract vessel features. Then, the extreme learning machine (ELM) method was used to recognize liver vessels and extract them from the background.
Wang et al. [36] presented the application of a multi-scale Hessian-based vesselness filter to enhance vessels of a defined diameter. Then, they used the Bayes classifier to identify the vessels. If there was no connection between vessels, two methods of connecting them were proposed. The first method uses a directional morphological operator to dilate sections of liver blood vessels along their centerline directions. This is to enable restoring connections between separated vessels. The second method checks connections between vessel sections and restores connectivity between them and vessel branches (e.g., to ensure the connection of bifurcations).
The authors of [38] used ant colony optimization, a metaheuristic, to find the best matching liver vessel tree using determined paths representing vessels and belonging to a predetermined graph. The potential paths based on which the liver vessel model is to be generated are produced using a cost path algorithm, which allows a graph to be created. This graph consists of all candidate vessel bifurcation locations as vertices and candidate vessel segments as edges.
Table 6 summarizes the segmentation results obtained using unsupervised learning methods.
7.2. Supervised
To segment blood vessels, certain features (e.g., intensity, gradient) are extracted from training images. Then, the machine learning model is trained using these features and the corresponding labels, which are obtained from ground-truth segmentations. After the training phase, this model can be used to segment liver blood vessels in test images.
The convolutional neural network (CNN) is a synthetic neural network with a feed-forward mechanism, in which the communication between neurones is inspired by the human visual cortex. In liver blood vessel segmentation, a CNN can be used to learn from consistent patterns from a training set consisting of reference images with annotations, and then, the CNN should allow predicting images from a test set. A CNN can also be utilized directly to segment vessels thanks to using fully connected layers. CNNs can model intensity patterns of objects having very different and variable appearance. During the training phase of a CNN, the convolutional layers of the network automatically generate features and combine them into hierarchical predictive models.
Artificial neural networks (ANNs) for deep learning can have 10+ layers or many more. Models that have as many as 100+ layers have been created [77,78]. Deep convolutional networks enable gradual filtering of different parts of training data and can fine-tune features that are important in the discrimination process used to identify or classify patterns.
Ibragimov et al. [34] used CNNs to segment the portal vein in liver CT images. Then, they used Markov random fields (MRF) to improve the results, which included removing isolated regions caused by segmentation errors. The results produced by CNN-MRF-based methods were supplemented with the detection of the PV centerline according to anatomical features of the PV such as its branch composition and tubularity.
The authors of [29] proposed automatic liver vessel segmentation based on a multi-pathway CNN architecture. This architecture combines a number of networks, where each network is to learn different features from the vessel image processed. The learning process was carried out for three planes (sagittal, coronal, and transverse) to fully extract the features.
Kehwani et al. [28] presented a multi-task 3D fully convolutional neural network (3D-FCN) for reconstructing the vessel tree. The proposed approach allows voxels to be detected on vascular centerlines and estimates the boundaries in the reconstructed vessel tree. A metric was defined that includes both inter-class distance and intra-class topological distance between vascular pairs. Vessel trees are then reconstructed using the learned connectivity metric and the shortest path tree algorithm.
In [31], the fuzzy connectedness (FC) method was employed for the three-dimensional segmentation of blood vessels of liver. A modified version of Jerman’s vesselness filter [79] was also used to amplify vessels in source images.
The accuracy of deep learning methods depends on the right selection of training data and the quantity of these data. Liver vessels are very complex and diverse. Unfortunately, the number of available datasets with annotations that can allow segmentation and 3D visualization is limited. What is more, significant discrepancies in the annotations of medical datasets, such as omissions of certain vessels, can be found due to the different clinical experience of annotators. The use of incorrect annotations causes segmentation errors in the supervised learning methods used. For this reason, it is worth trying deep learning methods using, e.g., the 3D U-Net architecture [80]. The 3D U-Net is a dense convolutional network that can perform volumetric segmentation using a small quantity of training data and incomplete annotations. Unfortunately, an unbalanced number of classes can often cause the training process to get stuck at the local minima of the loss function and ultimately produce a prediction error. Consequently, it is necessary to preliminarily calculate weighted parameters of the classes to compensate for their different frequency [80].
Huang et al. [30] chose the 3D-U-Net for extracting liver blood vessels, using several training samples and incomplete annotations. To improve segmentation results in unbalanced classes, the parameters are adjusted based on the number of correctly classified voxels of the foreground and the number of incorrectly classified voxels, based on the Dice loss function. At the same time, the penalty for incorrectly classified voxels is increased to teach the network to recognize vessels with weak boundaries, low contrast, and high noise.
The authors of [26] also employed a deep learning method utilizing the 3D U-Net architecture for the intraoperative segmentation of liver vasculature. Vessels were segmented based on ultrasound images. The 3D U-Net was used to train three different deep learning models for separate segmentation tasks: segmenting the entire vasculature and the hepatic and portal veins separately.
Mishra et al. [32] also segmented vessels in USG images, but they used CNNs. The CNN’s performance is affected by the quantity and complexity of the training data. Unfortunately, ultrasound images showing liver vessels are not generally available. In [32], USG images were divided into overlapping patches. Each patch was classified using the CNN as follows: fully or partially covers the region of the vessel (a positive vessel patch) or does not contain any part of the vessel region (negative non-vessel patch). Then, to perform pixel level segmentation, k-means unsupervised clustering was used with the best results.
Reference [25] presented a deep neural network employing an attention-guided concatenation (AGC) module and allowing an adaptive selection of context features from low-level features guided by high-level features to produce a detailed structure of the liver vessel. It is important that the segmentation extracts continuous liver vessels. Consequently, a multiscale feature fusion block was proposed as a functional block of the U-Net.
In the approach proposed in [27], first, a small number of vessels are annotated and taken to train a sparse dictionary and logistic regressor to allow producing an initial vessel classification. In the next step, a bootstrapping technique is used to train deep neural networks based on noisy liver vessel labels. In the test phase, post-processing based on predictions from the model is used to produce liver blood vessel trees.
Nazir et al. [24] proposed liver vessel segmentation by employing a cascade incremental learning (CIL) model. What is more, a ternary tree-based method to map all the possible liver vessel variants into their respective tree topologies was also used. The reason for using CIL for liver vessel segmentation is that it is difficult to provide a sufficient number of features to cover all variations in the liver vessel structure.
A summary of the analyzed supervised machine learning methods is presented in Table 7.
8. Challenges and Conclusions
Of the 31 articles included in the literature review:
- -
- -
- -
- -
- -
- -
The methods most commonly applied are machine learning ones. They account for a total of 15 articles. Unfortunately, it is difficult to clearly evaluate segmentation results because different datasets (i.e., public or private) were used. In addition, the reported metrics are not consistent. For the few publicly available datasets, there is no information about the experience and knowledge of experts who performed ground-truth segmentation. Obviously, manually segmenting complex liver vessels is very tedious and time-consuming and requires a large workload.
It can be said that image quality still has a very strong impact on segmentation results and that a method that is developed and works well for one dataset may turn out to be unsuitable for other image sets, e.g., containing a different level of noise or produced by other equipment. In addition, the authors of the research papers did not pay much attention to segmenting pathological vessels. The assumptions of a circular cross-section of vessels and their regular linearity will not lead to correct segmentation results if a pathology is present.
In some studies, the authors tried to present vessel segmentation methods for two imaging techniques: CT and MR [13], as well as CT and CTA [24], and this is a very valuable direction of research. However, the two sets analyzed in the publications [13,24] are not publicly available.
Liver vessel segmentation methods that use deep learning are becoming increasingly popular. This is due, among others, to the increasing computing power of computers. Moreover, deep learning allows the best-fit internal representation of the image to be extracted, while in classical machine learning algorithms, it is crucial to extract the right features of the image, which often requires specialist knowledge. The lack of sufficient public datasets led to another trend in deep learning methods. Unsupervised deep learning and semi-supervised learning are becoming more widespread [81,82,83], as are generative networks [84,85,86]. However, these approaches have not yet been used to segment liver vessels.
Recent years have seen an accelerating growth of medical image datasets made publicly available, but they are still limited to certain anatomical areas and also selected imaging methods. The availability of this data is increasing due to the spread of image diagnostics. Consequently, liver vessel segmentation methods that use deep learning will continue to develop as long as organizations publish large and labeled datasets created based on actual knowledge of appropriately experienced physicians. Of course, such datasets must include variations in vessel shape caused by individual characteristics of patients, as well as pathologies. The generalization of knowledge with the use of deep learning methods will certainly improve the ability to use the segmentation of liver blood vessels in practice.
For newly available datasets such as MSD [55] or CHAOS [56], a certain period of time must pass before advanced solutions enabling liver vessel segmentation appear. It is a very valuable initiative to organize competitions [87] as a part of which datasets and the results of experiments are made public and the appropriate metrics properly chosen by experts are used to evaluate segmentation results. This is a very good initiative, which would allow new, better methods to be developed and the results obtained to be standardized to some extent. However, there are still no publicly available USG datasets that would enable liver vessel segmentation. Because of the uneven background and low contrast, USG is an imaging technique in which segmenting liver vessels is the most difficult. Videos can also be recorded of the entire ultrasound examination. Real-time tracking and segmentation of moving objects is a subject well known in computer vision [88,89,90]. However, tracking selected organs during a USG examination (or in recorded videos) may be difficult, although publications on this subject can be found in the literature [91,92].
In order to develop repeatable, reliable, and traceable methods of segmenting liver vessels that could be useful in medical practice, experts in such fields as medicine, software engineering, and statistical analysis must closely cooperate with researchers who develop segmentation methods. In view of this requirement, none of the methods presented has overcome all the challenges found in liver vessel segmentation yet.
Author Contributions
M.C. performed the literature review and wrote the original manuscript draft. M.K. prepared the figures, tables, and drafted the manuscript. All authors read and approved the manuscript.
Funding
This research received no external funding.
Institutional Review Board Statement
Ethical review and approval are not applicable for this review paper.
Informed Consent Statement
An informed consent statement is not applicable.
Data Availability Statement
No new data were created or analyzed in this study. Data sharing is not applicable to this article.
Conflicts of Interest
The authors declare no conflict of interest.
Abbreviations
The following abbreviations are used in this manuscript:
| 3D | Tridimensional |
| Accuracy | |
| ACM | Active contour model |
| AGC | Attention-guided concatenation |
| ANN | Artificial neural network |
| CIL | Cascade incremental learning |
| CNN | Convolutional neural network |
| CT | Computed tomography |
| CTA | Computed tomography angiography |
| Dice similarity coefficient | |
| Distance error | |
| Symmetric distance error | |
| ELM | Extreme learning machine |
| Classification error | |
| FC | Fuzzy Connectedness |
| FCM | Fully Convolutional neural network |
| FMM | Fast Marching method |
| FN | False negative |
| FNR | False negative rate |
| FP | False positive |
| FPR | False positive rate |
| HD | Hausdorff distance |
| HV | Hepatic vein |
| ITK | Insight Toolkit |
| Jaccard similarity coefficient | |
| M | Metric tensor for minimum cost path |
| Minimum cost path | |
| MR | Magnetic resonance |
| MRF | Markov random fields |
| NPV | Negative predictive value |
| Positive predictive value | |
| PV | Portal vein |
| R | Reference |
| RMSE | Root mean standard error |
| RANSAC | Random sample consensus |
| RMSD | Root mean square symmetric surface distance |
| RR | Recognition rate |
| S | Segmentation |
| Sensitivity | |
| Specificity | |
| TP | True positive |
| TN | True negative |
| USG | Ultrasonography |
| VOE | Volumetric overlap error |
References
- Ashtari, S.; Pourhoseingholi, M.A.; Sharifian, A.; Zali, M.R. Hepatocellular carcinoma in Asia: Prevention strategy and planning. World J. Hepatol. 2015, 7, 1708. [Google Scholar] [CrossRef]
- Lesage, D.; Angelini, E.D.; Bloch, I.; Funka-Lea, G. A review of 3D vessel lumen segmentation techniques: Models, features and extraction schemes. Med. Image Anal. 2009, 13, 819–845. [Google Scholar] [CrossRef]
- Fraz, M.M.; Remagnino, P.; Hoppe, A.; Uyyanonvara, B.; Rudnicka, A.R.; Owen, C.G.; Barman, S.A. Blood vessel segmentation methodologies in retinal images–A survey. Comput. Methods Programs Biomed. 2012, 108, 407–433. [Google Scholar] [CrossRef]
- Moghbel, M.; Mashohor, S.; Mahmud, R.; Saripan, M.I.B. Review of liver segmentation and computer assisted detection/diagnosis methods in computed tomography. Artif. Intell. Rev. 2018, 50, 497–537. [Google Scholar] [CrossRef]
- Moccia, S.; De Momi, E.; El Hadji, S.; Mattos, L.S. Blood vessel segmentation algorithms—Review of methods, datasets and evaluation metrics. Comput. Methods Programs Biomed. 2018, 158, 71–91. [Google Scholar] [CrossRef] [PubMed] [Green Version]
- Affane, A.; Lebre, M.A.; Mittal, U.; Vacavant, A. Literature Review of Deep Learning Models for Liver Vessels Reconstruction. In Proceedings of the 2020 Tenth International Conference on Image Processing Theory, Tools and Applications (IPTA), Paris, France, 7–10 July 2020; pp. 1–6. [Google Scholar]
- Zeng, Y.Z.; Liao, S.H.; Tang, P.; Zhao, Y.Q.; Liao, M.; Chen, Y.; Liang, Y.X. Automatic liver vessel segmentation using 3D region growing and hybrid active contour model. Comput. Biol. Med. 2018, 97, 63–73. [Google Scholar] [CrossRef] [PubMed] [Green Version]
- Chung, M.; Lee, J.; Chung, J.W.; Shin, Y.G. Accurate liver vessel segmentation via active contour model with dense vessel candidates. Comput. Methods Programs Biomed. 2018, 166, 61–75. [Google Scholar] [CrossRef]
- Lu, S.; Huang, H.; Liang, P.; Chen, G.; Xiao, L. Hepatic vessel segmentation using variational level set combined with non-local robust statistics. Magn. Reson. Imaging 2017, 36, 180–186. [Google Scholar] [CrossRef]
- Cheng, Y.; Hu, X.; Wang, J.; Wang, Y.; Tamura, S. Accurate vessel segmentation with constrained B-snake. IEEE Trans. Image Process. 2015, 24, 2440–2455. [Google Scholar] [CrossRef] [PubMed]
- Shang, Y.; Deklerck, R.; Nyssen, E.; Markova, A.; de Mey, J.; Yang, X.; Sun, K. Vascular active contour for vessel tree segmentation. IEEE Trans. Biomed. Eng. 2010, 58, 1023–1032. [Google Scholar] [CrossRef] [PubMed]
- Guo, X.; Xiao, R.; Zhang, T.; Chen, C.; Wang, J.; Wang, Z. A novel method to model hepatic vascular network using vessel segmentation, thinning, and completion. Med. Biol. Eng. Comput. 2020, 58, 709–724. [Google Scholar] [CrossRef]
- Lebre, M.A.; Vacavant, A.; Grand-Brochier, M.; Rositi, H.; Abergel, A.; Chabrot, P.; Magnin, B. Automatic segmentation methods for liver and hepatic vessels from CT and MRI volumes, applied to the Couinaud scheme. Comput. Biol. Med. 2019, 110, 42–51. [Google Scholar] [CrossRef]
- Zeng, Y.Z.; Zhao, Y.Q.; Liao, S.H.; Liao, M.; Chen, Y.; Liu, X.Y. Liver vessel segmentation based on centerline constraint and intensity model. Biomed. Signal Process. Control. 2018, 45, 192–201. [Google Scholar] [CrossRef]
- Sangsefidi, N.; Foruzan, A.H.; Dolati, A. Balancing the data term of graph-cuts algorithm to improve segmentation of hepatic vascular structures. Comput. Biol. Med. 2018, 93, 117–126. [Google Scholar] [CrossRef] [PubMed]
- Yang, X.; Do Yang, J.; Hwang, H.P.; Yu, H.C.; Ahn, S.; Kim, B.W.; You, H. Segmentation of liver and vessels from CT images and classification of liver segments for preoperative liver surgical planning in living donor liver transplantation. Comput. Methods Programs Biomed. 2018, 158, 41–52. [Google Scholar] [CrossRef] [PubMed]
- Zeng, Y.Z.; Zhao, Y.Q.; Tang, P.; Liao, M.; Liang, Y.X.; Liao, S.H.; Zou, B.J. Liver vessel segmentation and identification based on oriented flux symmetry and graph cuts. Comput. Methods Programs Biomed. 2017, 150, 31–39. [Google Scholar] [CrossRef] [PubMed]
- Yan, Z.; Chen, F.; Kong, D. Liver Venous Tree Separation via Twin-Line RANSAC and Murray’s Law. IEEE Trans. Med. Imaging 2017, 36, 1887–1900. [Google Scholar] [CrossRef] [PubMed]
- Chi, Y.; Liu, J.; Venkatesh, S.K.; Huang, S.; Zhou, J.; Tian, Q.; Nowinski, W.L. Segmentation of liver vasculature from contrast enhanced CT images using context-based voting. IEEE Trans. Biomed. Eng. 2010, 58, 2144–2153. [Google Scholar]
- Bauer, C.; Pock, T.; Sorantin, E.; Bischof, H.; Beichel, R. Segmentation of interwoven 3d tubular tree structures utilizing shape priors and graph cuts. Med. Image Anal. 2010, 14, 172–184. [Google Scholar] [CrossRef]
- Alhonnoro, T.; Pollari, M.; Lilja, M.; Flanagan, R.; Kainz, B.; Muehl, J.; Mayrhauser, U.; Portugaller, H.; Stiegler, P.; Tscheliessnigg, K. Vessel segmentation for ablation treatment planning and simulation. In Proceedings of the International Conference on Medical Image Computing and Computer-Assisted Intervention, Beijing, China, 20–24 September 2010; pp. 45–52. [Google Scholar]
- Esneault, S.; Lafon, C.; Dillenseger, J.L. Liver vessels segmentation using a hybrid geometrical moments/graph cuts method. IEEE Trans. Biomed. Eng. 2009, 57, 276–283. [Google Scholar] [CrossRef] [Green Version]
- Kaftan, J.N.; Tek, H.; Aach, T. A two-stage approach for fully automatic segmentation of venous vascular structures in liver CT images. In Medical Imaging 2009: Image Processing; International Society for Optics and Photonics: Lake Buena Vista (Orlando Area), FL, USA, 2009; Volume 7259, p. 725911. [Google Scholar]
- Nazir, A.; Cheema, M.N.; Sheng, B.; Li, P.; Kim, J.; Lee, T.Y. Living Donor-Recipient Pair Matching for Liver Transplant via Ternary Tree Representation with Cascade Incremental Learning. IEEE Trans. Biomed. Eng. 2021. [Google Scholar] [CrossRef] [PubMed]
- Yan, Q.; Wang, B.; Zhang, W.; Luo, C.; Xu, W.; Xu, Z.; Zhang, Y.; Shi, Q.; Zhang, L.; You, Z. An Attention-guided Deep Neural Network with Multi-scale Feature Fusion for Liver Vessel Segmentation. IEEE J. Biomed. Health Inf. 2020. [Google Scholar] [CrossRef] [PubMed]
- Thomson, B.R.; Smit, J.N.; Ivashchenko, O.V.; Kok, N.F.; Kuhlmann, K.F.; Ruers, T.J.; Fusaglia, M. MR-to-US Registration Using Multiclass Segmentation of Hepatic Vasculature with a Reduced 3D U-Net. In Proceedings of the International Conference on Medical Image Computing and Computer-Assisted Intervention, Lima, Peru, 4–8 October 2020; pp. 275–284. [Google Scholar]
- Xu, M.; Wang, Y.; Chi, Y.; Hua, X. Training liver vessel segmentation deep neural networks on noisy labels from contrast ct imaging. In Proceedings of the 2020 IEEE 17th International Symposium on Biomedical Imaging (ISBI), Iowa City, IA, USA, 4 April 2020; pp. 1552–1555. [Google Scholar]
- Keshwani, D.; Kitamura, Y.; Ihara, S.; Iizuka, S.; Simo-Serra, E. TopNet: Topology Preserving Metric Learning for Vessel Tree Reconstruction and Labelling. In Proceedings of the International Conference on Medical Image Computing and Computer-Assisted Intervention, Lima, Peru, 4–8 October 2020; pp. 14–23. [Google Scholar]
- Kitrungrotsakul, T.; Han, X.H.; Iwamoto, Y.; Lin, L.; Foruzan, A.H.; Xiong, W.; Chen, Y.W. VesselNet: A deep convolutional neural network with multi pathways for robust hepatic vessel segmentation. Comput. Med. Imaging Graph. 2019, 75, 74–83. [Google Scholar] [CrossRef] [PubMed]
- Huang, Q.; Sun, J.; Ding, H.; Wang, X.; Wang, G. Robust liver vessel extraction using 3D U-Net with variant dice loss function. Comput. Biol. Med. 2018, 101, 153–162. [Google Scholar] [CrossRef]
- Zhang, R.; Zhou, Z.; Wu, W.; Lin, C.C.; Tsui, P.H.; Wu, S. An improved fuzzy connectedness method for automatic three-dimensional liver vessel segmentation in CT images. J. Healthc. Eng. 2018, 2018, 2376317. [Google Scholar] [CrossRef]
- Mishra, D.; Chaudhury, S.; Sarkar, M.; Manohar, S.; Soin, A.S. Segmentation of vascular regions in ultrasound images: A deep learning approach. In Proceedings of the 2018 IEEE International Symposium on Circuits and Systems (ISCAS), Florence, Italy, 27–30 May 2018; pp. 1–5. [Google Scholar]
- Goceri, E.; Shah, Z.K.; Gurcan, M.N. Vessel segmentation from abdominal magnetic resonance images: Adaptive and reconstructive approach. Int. J. Numer. Methods Biomed. Eng. 2017, 33, e2811. [Google Scholar] [CrossRef]
- Ibragimov, B.; Toesca, D.; Chang, D.; Koong, A.; Xing, L. Combining deep learning with anatomical analysis for segmentation of the portal vein for liver SBRT planning. Phys. Med. Biol. 2017, 62, 8943. [Google Scholar] [CrossRef]
- Zeng, Y.Z.; Zhao, Y.Q.; Liao, M.; Zou, B.J.; Wang, X.F.; Wang, W. Liver vessel segmentation based on extreme learning machine. Phys. Med. 2016, 32, 709–716. [Google Scholar] [CrossRef]
- Wang, L.; Schnurr, A.K.; Zidowitz, S.; Georgii, J.; Zhao, Y.; Razavi, M.; Schwier, M.; Hahn, H.K.; Hansen, C. Segmentation of hepatic artery in multi-phase liver CT using directional dilation and connectivity analysis. In Proceedings of the Medical Imaging 2016: Computer-Aided Diagnosis. International Society for Optics and Photonics, San Diego, CA, USA, 24 March 2016; Volume 9785, p. 97851P. [Google Scholar]
- Oliveira, D.A.; Feitosa, R.Q.; Correia, M.M. Segmentation of liver, its vessels and lesions from CT images for surgical planning. Biomed. Eng. Online 2011, 10, 1–23. [Google Scholar] [CrossRef] [Green Version]
- Bruyninckx, P.; Loeckx, D.; Vandermeulen, D.; Suetens, P. Segmentation of liver portal veins by global optimization. In Proceedings of the Medical Imaging 2010: Computer-Aided Diagnosis; International Society for Optics and Photonics: San Diego, CA, USA, 2010; Volume 7624, p. 76241Z. [Google Scholar]
- Krig, S. Computer Vision Metrics; Springer: Berlin/Heidelberg, Germany, 2016. [Google Scholar]
- Luu, H.M.; Klink, C.; Moelker, A.; Niessen, W.; Van Walsum, T. Quantitative evaluation of noise reduction and vesselness filters for liver vessel segmentation on abdominal CTA images. Phys. Med. Biol. 2015, 60, 3905. [Google Scholar] [CrossRef]
- Lamy, J.; Merveille, O.; Kerautret, B.; Passat, N.; Vacavant, A. Vesselness Filters: A Survey with Benchmarks Applied to Liver Imaging. In Proceedings of the International Conference on Pattern Recognition (ICPR), Milan, Italy, 10–15 January 2021. [Google Scholar]
- Metz, C.E. Basic principles of ROC analysis. In Seminars in Nuclear Medicine; Elsevier: Amsterdam, The Netherlands, 1978; Volume 8, pp. 283–298. [Google Scholar]
- Bradley, A.P. The use of the area under the ROC curve in the evaluation of machine learning algorithms. Pattern Recognit. 1997, 30, 1145–1159. [Google Scholar] [CrossRef] [Green Version]
- Heston, T.F. Standardizing predictive values in diagnostic imaging research. J. Magn. Reson. Imaging JMRI 2011, 33, 505. [Google Scholar] [CrossRef] [PubMed]
- Burke, D.S.; Brundage, J.F.; Redfield, R.R.; Damato, J.J.; Schable, C.A.; Putman, P.; Visintine, R.; Kim, H.I. Measurement of the false positive rate in a screening program for human immunodeficiency virus infections. N. Engl. J. Med. 1988, 319, 961–964. [Google Scholar] [CrossRef]
- Dice, L.R. Measures of the amount of ecologic association between species. Ecology 1945, 26, 297–302. [Google Scholar] [CrossRef]
- Jaccard, P. The distribution of the flora in the alpine zone. 1. New Phytol. 1912, 11, 37–50. [Google Scholar] [CrossRef]
- Chen, X.; Udupa, J.K.; Bagci, U.; Zhuge, Y.; Yao, J. Medical image segmentation by combining graph cuts and oriented active appearance models. IEEE Trans. Image Process. 2012, 21, 2035–2046. [Google Scholar] [CrossRef] [Green Version]
- Brejl, M.; Sonka, M. Object localization and border detection criteria design in edge-based image segmentation: Automated learning from examples. IEEE Trans. Med. Imaging 2000, 19, 973–985. [Google Scholar]
- Gass, T.; Szekely, G.; Goksel, O. Simultaneous segmentation and multiresolution nonrigid atlas registration. IEEE Trans. Image Process. 2014, 23, 2931–2943. [Google Scholar] [CrossRef]
- Heimann, T.; Van Ginneken, B.; Styner, M.A.; Arzhaeva, Y.; Aurich, V.; Bauer, C.; Beck, A.; Becker, C.; Beichel, R.; Bekes, G.; et al. Comparison and evaluation of methods for liver segmentation from CT datasets. IEEE Trans. Med. Imaging 2009, 28, 1251–1265. [Google Scholar] [CrossRef] [PubMed]
- Hausdorff, F. Grundzüge der Mengenlehre; B.G. Teubner: Leipzig, Germany, 1914. [Google Scholar]
- Soler, L.; Hostettler, A.; Agnus, V.; Charnoz, A.; Fasquel, J.; Moreau, J.; Osswald, A.; Bouhadjar, M.; Marescaux, J. 3D Image Reconstruction for Comparison of Algorithm Database: A Patient Specific Anatomical and Medical Image Database. 2010. Available online: https://www.google.com/url?sa=t&rct=j&q=&esrc=s&source=web&cd=&ved=2ahUKEwjYqNrnl6fvAhWMJaYKHfHaAAQQFjABegQIAxAD&url=http%3A%2F%2Fwww-sop.inria.fr%2Fgeometrica%2Fevents%2Fwam%2Fabstract-ircad.pdf&usg=AOvVaw2UIANsN3F7Gns6AJFhrDMu (accessed on 5 May 2019).
- Hamarneh, G.; Jassi, P. VascuSynth: Simulating vascular trees for generating volumetric image data with ground-truth segmentation and tree analysis. Comput. Med. Imaging Graph. 2010, 34, 605–616. [Google Scholar] [CrossRef] [PubMed] [Green Version]
- Simpson, A.L.; Antonelli, M.; Bakas, S.; Bilello, M.; Farahani, K.; Van Ginneken, B.; Kopp-Schneider, A.; Landman, B.A.; Litjens, G.; Menze, B.; et al. A large annotated medical image dataset for the development and evaluation of segmentation algorithms. arXiv 2019, arXiv:1902.09063. [Google Scholar]
- Kavur, A.E.; Gezer, N.S.; Barış, M.; Aslan, S.; Conze, P.H.; Groza, V.; Pham, D.D.; Chatterjee, S.; Ernst, P.; Özkan, S.; et al. CHAOS challenge-combined (CT-MR) healthy abdominal organ segmentation. Med. Image Anal. 2020, 34, 605–616. [Google Scholar]
- Kass, M.; Witkin, A.; Terzopoulos, D. Snakes: Active contour models. Int. J. Comput. Vis. 1988, 1, 321–331. [Google Scholar] [CrossRef]
- Pratondo, A.; Chui, C.K.; Ong, S.H. Robust edge-stop functions for edge-based active contour models in medical image segmentation. IEEE Signal Process. Lett. 2015, 23, 222–226. [Google Scholar] [CrossRef]
- Osher, S.; Sethian, J.A. Fronts propagating with curvature-dependent speed: Algorithms based on Hamilton-Jacobi formulations. J. Comput. Phys. 1988, 79, 12–49. [Google Scholar] [CrossRef] [Green Version]
- Sethian, J.A. A fast marching level set method for monotonically advancing fronts. Proc. Natl. Acad. Sci. USA 1996, 93, 1591–1595. [Google Scholar] [CrossRef] [PubMed] [Green Version]
- Zhang, Y.; Matuszewski, B.J.; Shark, L.K.; Moore, C.J. Medical image segmentation using new hybrid level-set method. In Proceedings of the 2008 Fifth International Conference Biomedical Visualization: Information Visualization in Medical and Biomedical Informatics, London UK, 7–11 July 2008; pp. 71–76. [Google Scholar]
- Lee, E.; Schmidt, M.; Wright, J. Improved and simplified inapproximability for k-means. Inf. Process. Lett. 2017, 120, 40–43. [Google Scholar] [CrossRef] [Green Version]
- Boykov, Y.Y.; Jolly, M.P. Interactive graph cuts for optimal boundary & region segmentation of objects in ND images. In Proceedings of the Eighth IEEE International Conference on Computer Vision. ICCV 2001, Vancouver, BC, Canada, 7–14 July 2001; Volume 1, pp. 105–112. [Google Scholar]
- Sato, Y.; Nakajima, S.; Atsumi, H.; Koller, T.; Gerig, G.; Yoshida, S.; Kikinis, R. 3D multi-scale line filter for segmentation and visualization of curvilinear structures in medical images. In CVRMed-MRCAS’97; Springer: Berlin/Heidelberg, Germany, 1997; pp. 213–222. [Google Scholar]
- Merveille, O.; Talbot, H.; Najman, L.; Passat, N. Curvilinear structure analysis by ranking the orientation responses of path operators. IEEE Trans. Pattern Anal. Mach. Intell. 2017, 40, 304–317. [Google Scholar] [CrossRef] [Green Version]
- Whitaker, R.T.; Xue, X. Variable-conductance, level-set curvature for image denoising. In Proceedings of the 2001 International Conference on Image Processing (Cat. No. 01CH37205), Thessaloniki, Greece, 7–10 October 2001; Volume 3, pp. 142–145. [Google Scholar]
- Sethian, J.A. Level Set Methods and Fast Marching Methods: Evolving Interfaces in Computational Geometry, Fluid Mechanics, Computer Vision, and Materials Science; Cambridge University Press: Cambridge, UK, 1999; Volume 3. [Google Scholar]
- Ibanez, L.; Schroeder, W.; Ng, L.; Cates, J. The ITK Software Guide; Kitware Inc.: New York, NY, USA, 2003. [Google Scholar]
- Murray, C.D. The physiological principle of minimum work applied to the angle of branching of arteries. J. Gen. Physiol. 1926, 9, 835–841. [Google Scholar] [CrossRef]
- Cohen, L.D.; Kimmel, R. Global minimum for active contour models: A minimal path approach. Int. J. Comput. Vis. 1997, 24, 57–78. [Google Scholar] [CrossRef]
- Sethian, J.A. Fast marching methods. SIAM Rev. 1999, 41, 199–235. [Google Scholar] [CrossRef]
- Law, M.W.; Chung, A.C. Three dimensional curvilinear structure detection using optimally oriented flux. In European Conference on Computer Vision; Springer: Berlin/Heidelberg, Germany, 2008; pp. 368–382. [Google Scholar]
- Law, M.W.; Chung, A.C. An oriented flux symmetry based active contour model for three dimensional vessel segmentation. In European Conference on Computer Vision; Springer: Berlin/Heidelberg, Germany, 2010; pp. 720–734. [Google Scholar]
- Frangi, A.F.; Niessen, W.J.; Vincken, K.L.; Viergever, M.A. Multiscale vessel enhancement filtering. In International Conference on Medical Image Computing and Computer-Assisted Intervention; Springer: Berlin/Heidelberg, Germany, 1998; pp. 130–137. [Google Scholar]
- Krissian, K.; Malandain, G.; Ayache, N.; Vaillant, R.; Trousset, Y. Model-based detection of tubular structures in 3D images. Comput. Vis. Image Underst. 2000, 80, 130–171. [Google Scholar] [CrossRef] [Green Version]
- Xiao, C.; Staring, M.; Shamonin, D.; Reiber, J.H.; Stolk, J.; Stoel, B.C. A strain energy filter for 3D vessel enhancement with application to pulmonary CT images. Med. Image Anal. 2011, 15, 112–124. [Google Scholar] [CrossRef] [PubMed]
- Jégou, S.; Drozdzal, M.; Vazquez, D.; Romero, A.; Bengio, Y. The one hundred layers tiramisu: Fully convolutional densenets for semantic segmentation. In Proceedings of the IEEE Conference on Computer Vision and Pattern Recognition Workshops, Honolulu, HI, USA, 21–26 July 2017; pp. 11–19. [Google Scholar]
- Chen, L.C.; Papandreou, G.; Kokkinos, I.; Murphy, K.; Yuille, A.L. Deeplab: Semantic image segmentation with deep convolutional nets, atrous convolution, and fully connected crfs. IEEE Trans. Pattern Anal. Mach. Intell. 2017, 40, 834–848. [Google Scholar] [CrossRef] [PubMed]
- Jerman, T.; Pernuš, F.; Likar, B.; Špiclin, Ž. Enhancement of vascular structures in 3D and 2D angiographic images. IEEE Trans. Med. Imaging 2016, 35, 2107–2118. [Google Scholar] [CrossRef]
- Çiçek, Ö.; Abdulkadir, A.; Lienkamp, S.S.; Brox, T.; Ronneberger, O. 3D U-Net: Learning dense volumetric segmentation from sparse annotation. In International Conference on Medical Image Computing and Computer-Assisted Intervention; Springer: Cham, Switzerland, 2016; pp. 424–432. [Google Scholar]
- Weston, J.; Ratle, F.; Mobahi, H.; Collobert, R. Deep learning via semi-supervised embedding. In Neural Networks: Tricks of the Trade; Springer: Berlin/Heidelberg, Germany, 2012; pp. 639–655. [Google Scholar]
- Bengio, Y. Learning Deep Architectures for AI; Now Publishers Inc.: Delft, The Netherlands, 2009. [Google Scholar]
- Chen, D.; Ao, Y.; Liu, S. Semi-Supervised Learning Method of U-Net Deep Learning Network for Blood Vessel Segmentation in Retinal Images. Symmetry 2020, 12, 1067. [Google Scholar] [CrossRef]
- Radford, A.; Metz, L.; Chintala, S. Unsupervised representation learning with deep convolutional generative adversarial networks. arXiv 2015, arXiv:1511.06434. [Google Scholar]
- Kamran, S.A.; Hossain, K.F.; Tavakkoli, A.; Zuckerbrod, S.L. Attention2AngioGAN: Synthesizing Fluorescein Angiography from Retinal Fundus Images using Generative Adversarial Networks. arXiv 2020, arXiv:2007.09191. [Google Scholar]
- Kamran, S.A.; Hossain, K.F.; Tavakkoli, A.; Zuckerbrod, S.L.; Sanders, K.M.; Baker, S.A. RV-GAN: Retinal Vessel Segmentation from Fundus Images using Multi-scale Generative Adversarial Networks. arXiv 2021, arXiv:2101.00535. [Google Scholar]
- Van Ginneken, B.; Kerkstra, S.; Meakin, J. Grand Challenges in Biomedical Image Analysis. 2018. Available online: http:grand-challenge.org (accessed on 20 October 2019).
- Ivanov, Y.; Peleshko, D.; Makoveychuk, O.; Izonin, I.; Malets, I.; Lotoshunska, N.; Batyuk, D. Adaptive moving object segmentation algorithms in cluttered environments. In Proceedings of the Experience of Designing and Application of CAD Systems in Microelectronics, Lviv, Ukraine, 24–27 February 2015; pp. 97–99. [Google Scholar]
- Yang, H.; Qu, S. Real-time vehicle detection and counting in complex traffic scenes using background subtraction model with low-rank decomposition. IET Intell. Transp. Syst. 2017, 12, 75–85. [Google Scholar] [CrossRef]
- Mehta, D.; Sotnychenko, O.; Mueller, F.; Xu, W.; Elgharib, M.; Fua, P.; Seidel, H.P.; Rhodin, H.; Pons-Moll, G.; Theobalt, C. XNect: Real-time multi-person 3D motion capture with a single RGB camera. ACM Trans. Graph. (TOG) 2020, 39, 82:1–82:17. [Google Scholar] [CrossRef]
- Xu, K.; Gábor Csapó, T.; Roussel, P.; Denby, B. A comparative study on the contour tracking algorithms in ultrasound tongue images with automatic re-initialization. J. Acoust. Soc. Am. 2016, 139, EL154–EL160. [Google Scholar] [CrossRef] [PubMed] [Green Version]
- Mozaffari, M.H.; Lee, W.S. Encoder-decoder CNN models for automatic tracking of tongue contours in real-time ultrasound data. Methods 2020, 179, 26–36. [Google Scholar] [CrossRef] [PubMed]
Figure 1.
A CT scanner suitable for imaging the abdominal cavity and liver (courtesy of @ zlikovec/Depositphotos.com).
Figure 1.
A CT scanner suitable for imaging the abdominal cavity and liver (courtesy of @ zlikovec/Depositphotos.com).

Figure 2.
A CT examination of a patient to scan the abdominal cavity and liver (courtesy of @ monkeybusiness/Depositphotos.com).
Figure 2.
A CT examination of a patient to scan the abdominal cavity and liver (courtesy of @ monkeybusiness/Depositphotos.com).

Figure 3.
A nurse during a CT examination with the operating software visible (courtesy of @ monkeybusiness/Depositphotos.com). The monitor on the left displays example slices of the abdominal cavity and liver. Liver slices are shown in more detail in Figure 4.
Figure 3.
A nurse during a CT examination with the operating software visible (courtesy of @ monkeybusiness/Depositphotos.com). The monitor on the left displays example slices of the abdominal cavity and liver. Liver slices are shown in more detail in Figure 4.

Figure 4.
Sample CT images of liver and its blood vessels, taken from two different patients. (a,d) CT liver slices with vessels (axial view). (b,e) Vessel segmentation marked in blue. (c,f) 3D visualization of liver vessel trees.
Figure 4.
Sample CT images of liver and its blood vessels, taken from two different patients. (a,d) CT liver slices with vessels (axial view). (b,e) Vessel segmentation marked in blue. (c,f) 3D visualization of liver vessel trees.

Figure 5.
Diagram showing methods used to segment liver vessels, based on a literature review. These methods are highlighted in yellow. Pre-processing is intended to enhance vessels and is used by segmentation methods (shown with dotted lines). Post-processing improves the segmentation results.
Figure 5.
Diagram showing methods used to segment liver vessels, based on a literature review. These methods are highlighted in yellow. Pre-processing is intended to enhance vessels and is used by segmentation methods (shown with dotted lines). Post-processing improves the segmentation results.

Table 1.
Summary of various imaging techniques and segmentation methods, based on the literature review. CT: computed tomography, CTA: computed tomography angiography, MR: magnetic resonance, USG: ultrasonography.
Table 1.
Summary of various imaging techniques and segmentation methods, based on the literature review. CT: computed tomography, CTA: computed tomography angiography, MR: magnetic resonance, USG: ultrasonography.
| Author | Year | Imaging Technique | Segmentation Method |
|---|---|---|---|
| Zeng et al. [7] | 2018 | CTA | Active contour methods |
| Chung et al. [8] | 2018 | CTA | (Section 5) |
| Lu et al. [9] | 2017 | MR | |
| Cheng et al. [10] | 2015 | CTA | |
| Shang et al. [11] | 2010 | CTA | |
| Guo et al. [12] | 2020 | CT | Tracking methods |
| Lebre et al. [13] | 2019 | CT and MR | (Section 6) |
| Zeng et al. [14] | 2018 | CTA | |
| Sangsefidi et al. [15] | 2018 | CT | |
| Yang et al. [16] | 2018 | CT | |
| Zeng et al. [17] | 2017 | CTA | |
| Yan et al. [18] | 2017 | CTA | |
| Chi et al. [19] | 2010 | CT | |
| Bauer et al. [20] | 2010 | CT | |
| Alhonnoro et al. [21] | 2010 | CT | |
| Esneault et al. [22] | 2009 | CT | |
| Kaftan et al. [23] | 2009 | CT | |
| Nazir et al. [24] | 2021 | CT and CTA | Machine learning methods |
| Yan et al. [25] | 2020 | CT | (Section 7) |
| Thomson et al. [26] | 2020 | USG | |
| Xu et al. [27] | 2020 | CT | |
| Keshwani et al. [28] | 2020 | CT | |
| Kitrungrotsakul et al. [29] | 2019 | CT | |
| Huang et al. [30] | 2018 | CT | |
| Zhang et al. [31] | 2018 | CT | |
| Mishra et al. [32] | 2018 | USG | |
| Gocer et al. [33] | 2017 | MR | |
| Ibragimov et al. [34] | 2017 | CT | |
| Zeng et al. [35] | 2016 | CT | |
| Wang et al. [36] | 2016 | CT | |
| Oliveira et al. [37] | 2011 | CT | |
| Bruyninckx et al. [38] | 2010 | CT |
Table 2.
Performance measures for liver vessel segmentation methods (S), in relation to the reference (R), based on thirty one studies in this review, where true positives () are pixels classified correctly as positive, false positives () are pixels classified incorrectly as positive, true negatives () are pixels classified correctly as not positive, false negatives () are pixels classified incorrectly as not positive. For contours marked R and S: r and s represent points belonging to the corresponding contours, while and are the distances from points s and r to the nearest points of the R and S contours.
| Metrics | Standard Formula | Description |
|---|---|---|
| Sensitivity (Sens); recall; true positive rate (TPR) [42] | Proportion of positives that are correctly identified. | |
| Accuracy (Ac) [43] | Proportion of detected true samples that are actually true. | |
| Specificity (Spec) [42] | Proportion of negatives that are correctly identified. | |
| Precision; positive predictive value (PPV) [44] | Proportion of positive results that are true positives. | |
| Negative predictive value (NPV) [44] | Proportion of negative results that are true negatives. | |
| False positive rate (FPR) [45] | Ratio of the number of negative samples wrongly categorized as positive () to the total number of actual negative samples. | |
| False negative rate (FNR) [45] | Ratio of the number of positive samples wrongly categorized as negative () to the total number of actual positive samples. | |
| Dice similarity coefficient (DSC) [46] | Similarity between two sample sets. | |
| Jaccard similarity coefficient (JSC) [47] | Similarity between finite sample sets. | |
| Volumetric overlap error (VOE) [48] | The indicates segmentation performance; if the is close to 0, this represents a perfect segmentation. | |
| Distance error () [49] | Measure of the average distance calculated from all s points on S to the closest point on R. | |
| Symmetric distance error () [50] | Measure of the average distance calculated from all s points on S to the closest point on R and vice versa. | |
| Root mean standard error (RMSE) [49] | Measure of the average squared difference between the estimated values and the actual value. | |
| Root mean squared symmetric surface distance (RMSD) [51] | The indicates the segmentation performance between two contours S and R; the lower the , the better the segmentation result. | |
| Hausdorff distance (HD) [52] | Overlapping index, which measures the largest Euclidean distance between two contours S and R and vice versa, computed over all pixels of each curve. | |
| Classification error () [18] | Proportion of the incorrectly classified vessel branches to all vessel branches . | |
| Recognition rate (RR) [19] | Proportion of the correctly classified vessel branches to all vessel branches . |
Table 4.
Summary of active contour approaches for liver vessel segmentation (segmentation metrics are given in Table 2). CTA: computed tomography angiography, MR: magnetic resonance.
Table 4.
Summary of active contour approaches for liver vessel segmentation (segmentation metrics are given in Table 2). CTA: computed tomography angiography, MR: magnetic resonance.
| Author | Testing Dataset | Synthetic Data Used | Metrics Results |
|---|---|---|---|
| Zeng et al. [7] | 12 CTA volumes | Yes | |
| mm | |||
| Chung et al. [8] | 50 CTA images | No | |
| Lu et al. [9] | 5 MR volumes | No | |
| Cheng et al. [10] | 3 CTA datasets | Yes | |
| Shang et al. [11] | 20 CTA volumes | Yes |
Table 5.
Summary of tracking methods (segmentation metrics are given in Table 2). CT: computed tomography, CTA: computed tomography angiography, MR: magnetic resonance.
Table 5.
Summary of tracking methods (segmentation metrics are given in Table 2). CT: computed tomography, CTA: computed tomography angiography, MR: magnetic resonance.
| Author | Testing Dataset | Synthetic Data Used | Metrics Results |
|---|---|---|---|
| Guo et al. [12] | 8 CT volumes (3D-IRCADb-01) | No | |
| (http://www.ircad.fr/research/3dircadb/) | |||
| (accessed on 5 May 2019) | |||
| Lebre et al. [13] | 20 CT (3D-IRCADb-01) volumes | Yes | |
| (http://www.ircad.fr/research/3dircadb/) | |||
| (accessed on 5 May 2019) | |||
| and 40 MR volumes from internal dataset | |||
| Zeng et al. [14] | 6 CTA volumes | Yes | |
| Sangsefidi et al. [15] | 50 CT volumes, including | Yes | |
| 20 CT (3D-IRCADb-01) volumes | |||
| (http://www.ircad.fr/research/3dircadb/) | |||
| (accessed on 5 May 2019) | |||
| Yang et al. [16] | 10 CT datasets (SLIVER07 [51]) | No | |
| Zeng et al. [17] | 6 CTA volumes | Yes | |
| Yan et al. [18] | 6 CTA volumes | No | |
| Chi et al. [19] | 10 CT scans | No | |
| Bauer et al. [20] | 15 contrast enhanced CT | Yes | |
| Alhonnoro et al. [21] | CT | No | |
| Esneault et al. [22] | CT | No | |
| Kaftan et al. [23] | 30 CT scans | No |
Table 6.
Summary of liver vessel segmentation approaches using unsupervised learning (segmentation metrics are given in Table 2). CT: computed tomography, MR: magnetic resonance.
Table 6.
Summary of liver vessel segmentation approaches using unsupervised learning (segmentation metrics are given in Table 2). CT: computed tomography, MR: magnetic resonance.
| Author | Testing Dataset | Synthetic Data Used | Metrics Results |
|---|---|---|---|
| Goceri et al. [33] | 14 MR volumes | No | |
| Oliveira et al. [37] | 15 CT datasets (SLIVER07 [51]) | No | |
| Zeng et al. [35] | 6 CT volumes | No | |
| Wang et al. [36] | 18 CT volumes | No | mm |
| Bruyninckx et al. [38] | 5 CT images (3D-IRCADb-01) | No | |
| (http://www.ircad.fr/research/3dircadb/) | |||
| (accessed on 5 May 2019) |
Table 7.
Summary of liver vessel segmentation approaches using supervised learning (segmentation metrics are given in Table 2). CT: computed tomography, MR: magnetic resonance, USG: ultrasonography.
Table 7.
Summary of liver vessel segmentation approaches using supervised learning (segmentation metrics are given in Table 2). CT: computed tomography, MR: magnetic resonance, USG: ultrasonography.
| Author | Testing Dataset | Synthetic Data Used | Metrics Results |
|---|---|---|---|
| Ibragimov et al. [34] | 72 CT images | No | mm |
| Kitrungrotsakul et al. [29] | 1 CT volume (3D-IRCADb-01) | Yes | |
| (http://www.ircad.fr/research/3dircadb/) | |||
| (accessed on 5 May 2019) | |||
| Keshwani et al. [28] | 20 CT volumes from internal dataset | Yes | |
| and 20 CT (3D-IRCADb-01) volumes | |||
| (http://www.ircad.fr/research/3dircadb/) | |||
| (accessed on 5 May 2019) | |||
| Zhang et al. [31] | 20 CT (3D-IRCADb-01) volumes | No | |
| (http://www.ircad.fr/research/3dircadb/) | |||
| (accessed on 5 May 2019) | |||
| 20 CT (SLIVER07) datasets [51] | |||
| Huang et al. [30] | 10 CT volumes from internal dataset and | Yes | |
| 20 CT (SLIVER07) datasets [51] and | |||
| 10 CT (3D-IRCADb-01) volumes | |||
| (http://www.ircad.fr/research/3dircadb/) | |||
| (accessed on 5 May 2019) | |||
| Thomson et al. [26] | 203 USG volumes | No | |
| Mishra et al. [32] | 132 USG images | No | |
| Yan et al. [25] | 10 CT volumes from internal dataset and | No | |
| 20 CT (3D-IRCADb-01) volumes | |||
| (http://www.ircad.fr/research/3dircadb/) | |||
| (accessed on 5 May 2019) | |||
| Xu et al. [27] | 20 CT (3D-IRCADb-01) volumes | No | |
| (http://www.ircad.fr/research/3dircadb/) | |||
| (accessed on 5 May 2019) | |||
| Nazir et al. [24] | 30 CTA internal datasets and | No | up to |
| 10 CT (SLIVER07) datasets [51] | up to |
Publisher’s Note: MDPI stays neutral with regard to jurisdictional claims in published maps and institutional affiliations. |
© 2021 by the authors. Licensee MDPI, Basel, Switzerland. This article is an open access article distributed under the terms and conditions of the Creative Commons Attribution (CC BY) license (http://creativecommons.org/licenses/by/4.0/).
Share and Cite
MDPI and ACS Style
Ciecholewski, M.; Kassjański, M. Computational Methods for Liver Vessel Segmentation in Medical Imaging: A Review. Sensors 2021, 21, 2027. https://0-doi-org.brum.beds.ac.uk/10.3390/s21062027
AMA Style
Ciecholewski M, Kassjański M. Computational Methods for Liver Vessel Segmentation in Medical Imaging: A Review. Sensors. 2021; 21(6):2027. https://0-doi-org.brum.beds.ac.uk/10.3390/s21062027
Chicago/Turabian StyleCiecholewski, Marcin, and Michał Kassjański. 2021. "Computational Methods for Liver Vessel Segmentation in Medical Imaging: A Review" Sensors 21, no. 6: 2027. https://0-doi-org.brum.beds.ac.uk/10.3390/s21062027
Note that from the first issue of 2016, this journal uses article numbers instead of page numbers. See further details here.