
Validity and Reliability of Mobile Applications for Assessing Strength, Power, Velocity, and Change-of-Direction: A Systematic Review

 ,
,  ,
,  ,
,  and
and
Abstract
:1. Introduction
2. Materials and Methods
2.1. Eligibility Criteria
2.2. Information Sources and Search
2.3. Data Extraction
2.4. Data Items
2.5. Methodological Assessment
3. Results
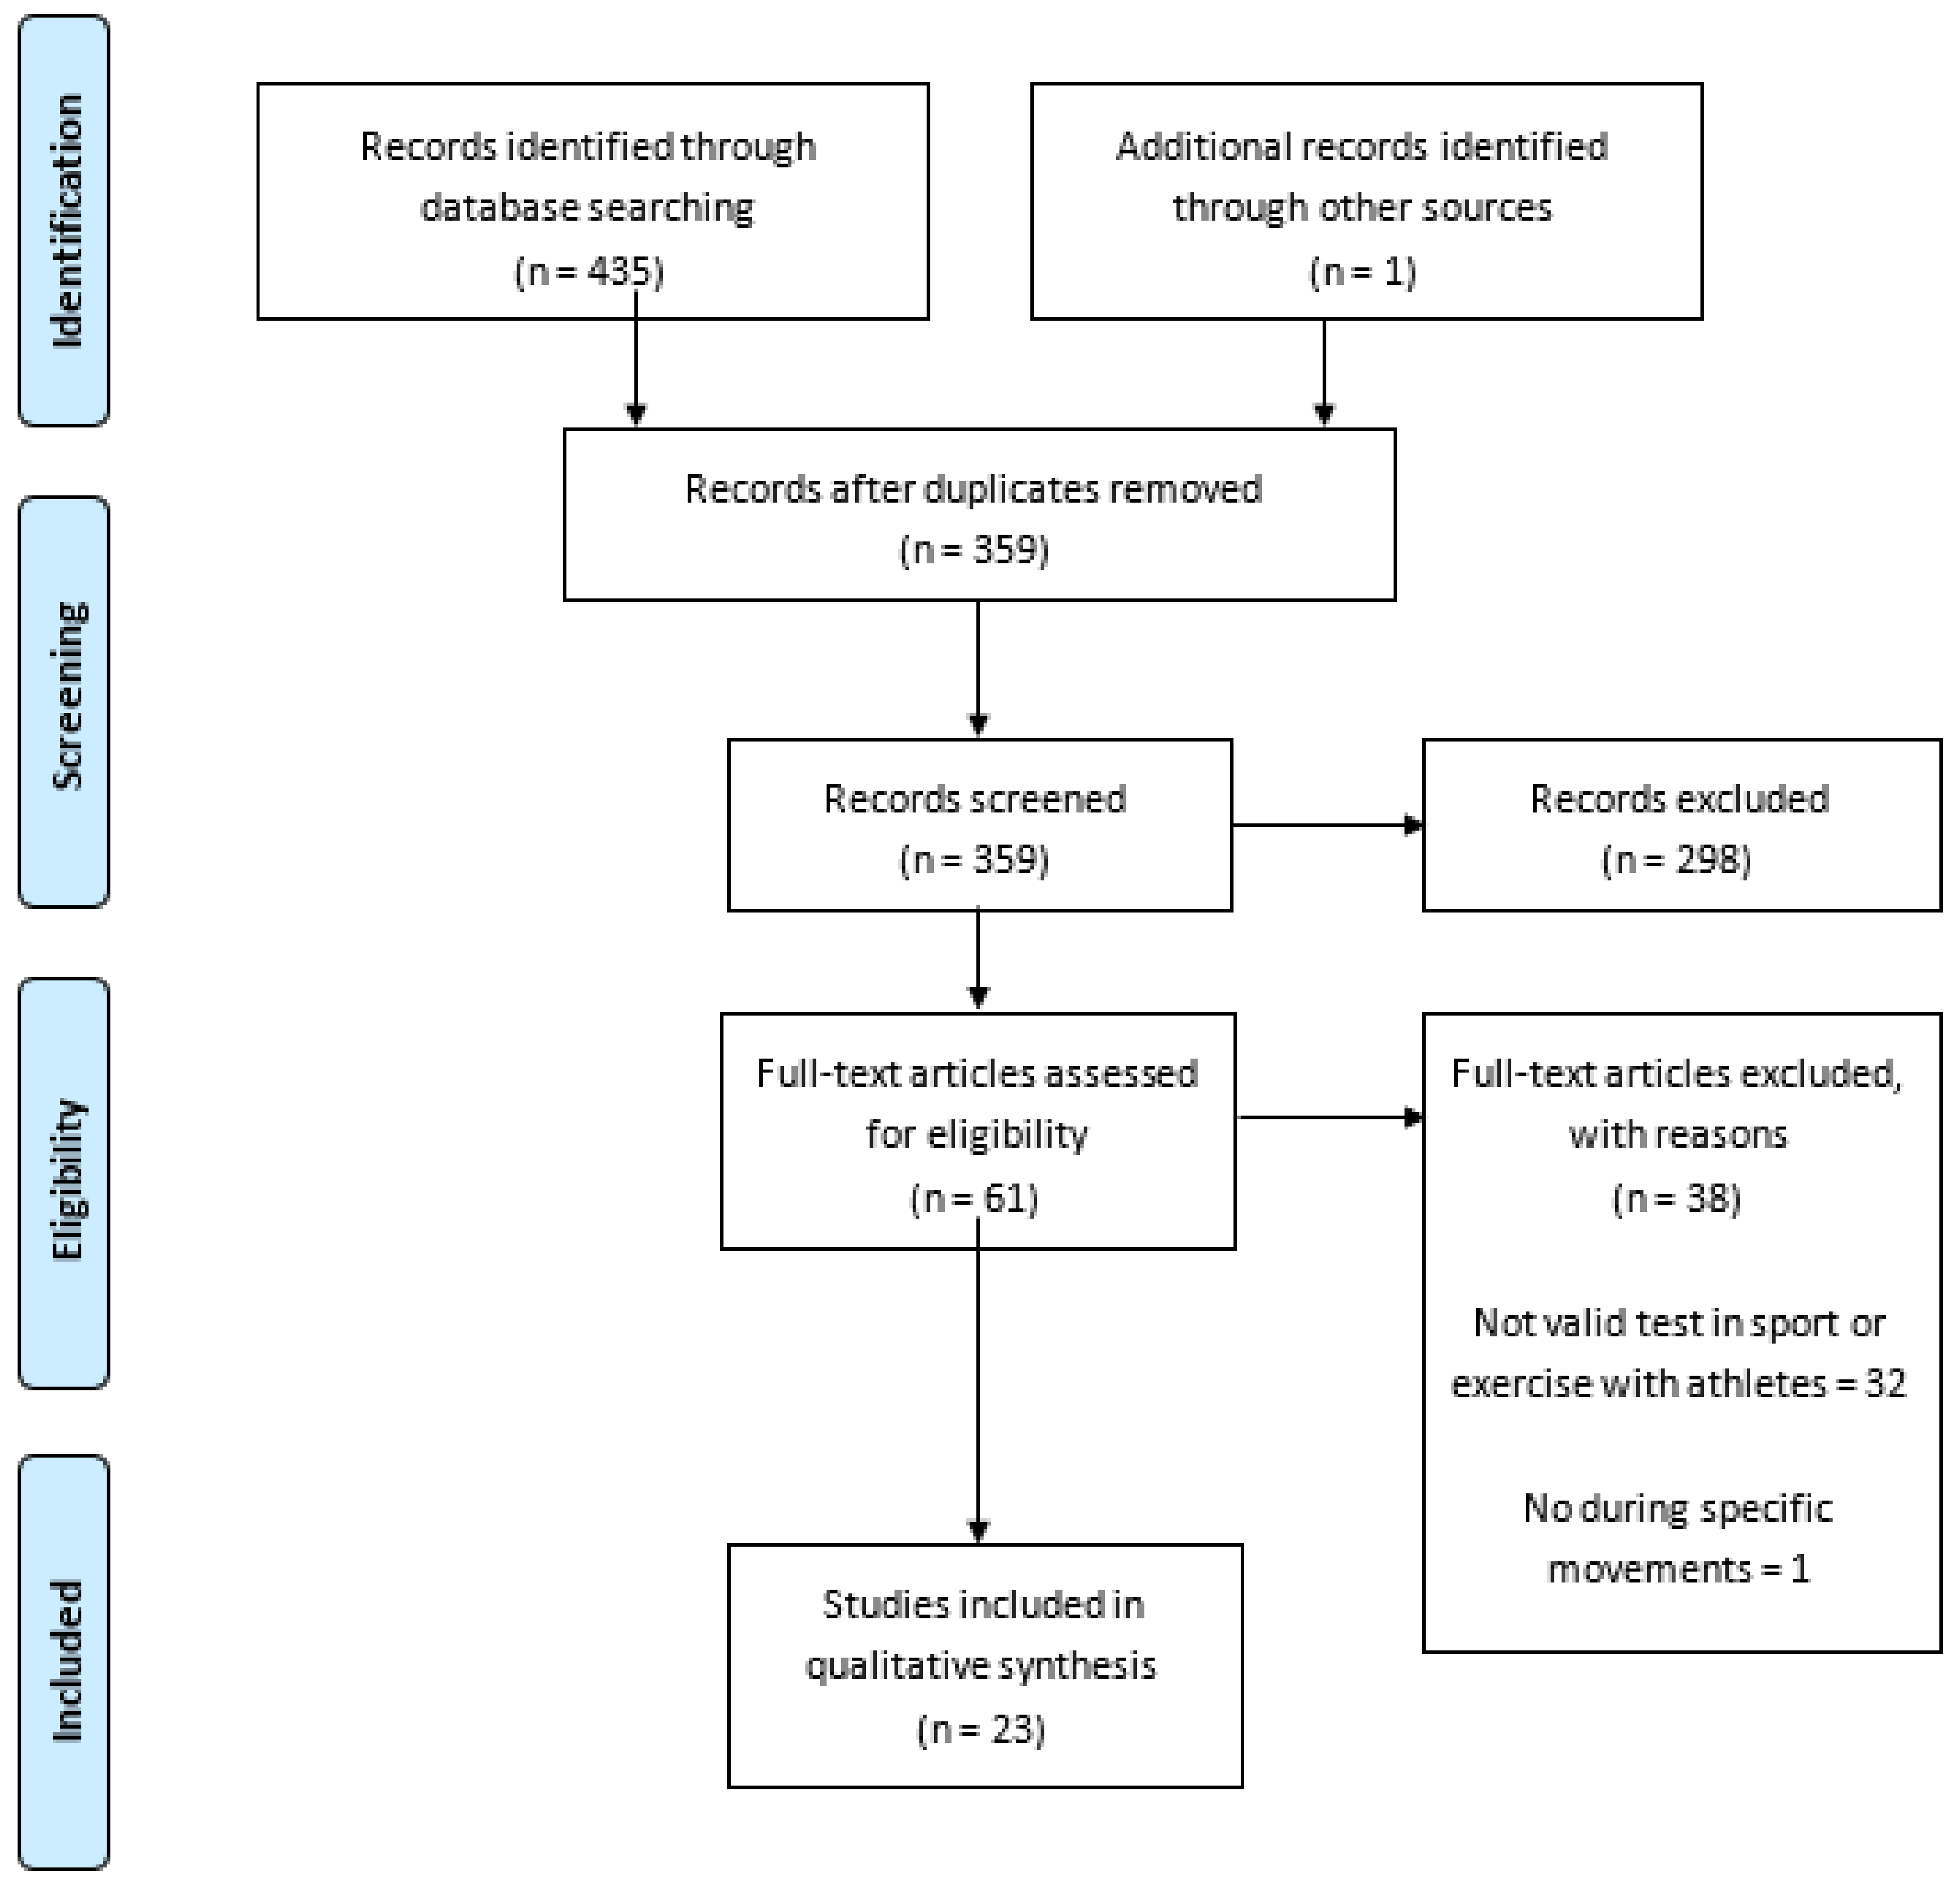
3.1. Study Identification and Selection
3.2. Methodological Quality
3.3. Characteristics of Individual Studies
3.4. Results of Individual Studies: Validity of Mobile Applications
3.5. Results of Individual Studies: Reliability of Mobile Applications
4. Discussion
4.1. Validity of Mobile Applications
4.1.1. Strength Apps
4.1.2. Power Apps
4.1.3. Velocity Apps
4.1.4. Change-of-Direction Apps
4.2. Reliability of Mobile Applications
4.2.1. Strength Apps
4.2.2. Power Apps
4.2.3. Velocity Apps
4.2.4. Change-of-Direction Apps
4.3. Study Limitations, Future Research, and Practical Implications
5. Conclusions
Author Contributions
Funding
Institutional Review Board Statement
Informed Consent Statement
Acknowledgments
Conflicts of Interest
References
- Enright, K.; Morton, J.; Iga, J.; Lothian, D.; Roberts, S.; Drust, B. Reliability of “in-season” fitness assessments in youth elite soccer players: A working model for practitioners and coaches. Sci. Med. Footb. 2018, 2, 177–183. [Google Scholar] [CrossRef]
- Morin, J.-B.; Samozino, P. Interpreting power-force-velocity profiles for individualized and specific training. Int. J. Sports Physiol. Perform. 2016, 11, 267–272. [Google Scholar] [CrossRef] [PubMed]
- Manzi, V.; Castagna, C.; Padua, E.; Lombardo, M.; D’Ottavio, S.; Massaro, M.; Volterrani, M.; Iellamo, F. Dose-response relationship of autonomic nervous system responses to individualized training impulse in marathon runners. Am. J. Physiol. Circ. Physiol. 2009, 296, H1733–H1740. [Google Scholar] [CrossRef] [Green Version]
- Boullosa, D.; Casado, A.; Claudino, J.G.; Jiménez-Reyes, P.; Ravé, G.; Castaño-Zambudio, A.; Lima-Alves, A.; de Oliveira, S.A.; Dupont, G.; Granacher, U.; et al. Do you play or do you train? Insights from individual sports for training load and injury risk management in team sports based on individualization. Front. Physiol. 2020, 11, 995. [Google Scholar] [CrossRef] [PubMed]
- Turner, A.; Walker, S.; Stembridge, M.; Coneyworth, P.; Reed, G.; Birdsey, L.; Barter, P.; Moody, J. A testing battery for the assessment of fitness in soccer players. Strength Cond. J. 2011, 33, 29–39. [Google Scholar] [CrossRef] [Green Version]
- Tabacchi, G.; Lopez Sanchez, G.F.; Sahin, N.F.; Kizilyalli, M.; Genchi, R.; Basile, M.; Kirkar, M.; Silva, C.; Loureiro, N.; Teixeira, E.; et al. Field-based tests for the assessment of physical fitness in children and adolescents practicing sport: A systematic review within the ESA program. Sustainability 2019, 11, 7187. [Google Scholar] [CrossRef] [Green Version]
- D’Isanto, T.; D’Elia, F.; Raiola, G.; Altavilla, G. Assessment of sport performance: Theoretical aspects and practical indications. Sport Mont. 2019, 17, 79–82. [Google Scholar] [CrossRef] [Green Version]
- Chaabene, H.; Negra, Y.; Bouguezzi, R.; Capranica, L.; Franchini, E.; Prieske, O.; Hbacha, H.; Granacher, U. Tests for the assessment of sport-specific performance in olympic combat sports: A systematic review with practical recommendations. Front. Physiol. 2018, 9, 386. [Google Scholar] [CrossRef]
- McGuigan, M.R.; Cormack, S.J.; Gill, N.D. Strength and power profiling of athletes. Strength Cond. J. 2013, 35, 7–14. [Google Scholar] [CrossRef] [Green Version]
- Cronin, J.; Lawton, T.; Harris, N.; Kilding, A.; McMaster, D.T. A brief review of handgrip strength and sport performance. J. Strength Cond. Res. 2017, 31, 3187–3217. [Google Scholar] [CrossRef] [Green Version]
- Banyard, H.G.; Nosaka, K.; Sato, K.; Haff, G.G. Validity of various methods for determining velocity, force, and power in the back squat. Int. J. Sports Physiol. Perform. 2017, 12, 1170–1176. [Google Scholar] [CrossRef]
- Zabaloy, S.; Freitas, T.T.; Carlos-Vivas, J.; Giráldez, J.C.; Loturco, I.; Pareja-Blanco, F.; Gálvez González, J.; Alcaraz, P.E. Estimation of maximum sprinting speed with timing gates: Greater accuracy of 5-m split times compared to 10-m splits. Sport. Biomech. 2021, 18, 1–11. [Google Scholar] [CrossRef]
- Zivkovic, M.Z.; Djuric, S.; Cuk, I.; Suzovic, D.; Jaric, S. A simple method for assessment of muscle force, velocity, and power producing capacities from functional movement tasks. J. Sports Sci. 2017, 35, 1287–1293. [Google Scholar] [CrossRef]
- Castillo-Rodríguez, A.; Fernández-García, J.C.; Chinchilla-Minguet, J.L.; Carnero, E.Á. Relationship between muscular strength and sprints with changes of direction. J. Strength Cond. Res. 2012, 26, 725–732. [Google Scholar] [CrossRef]
- Loturco, I.; Pereira, A.L.; Freitas, T.T.; Alcaraz, E.P.; Zanetti, V.; Bishop, C.; Jeffreys, I. Maximum acceleration performance of professional soccer players in linear sprints: Is there a direct connection with change-of-direction ability? PLoS ONE 2019, 14, e0216806. [Google Scholar] [CrossRef]
- Rahmani, A.; Samozino, P.; Morin, J.-B.; Morel, B. A simple method for assessing upper-limb force-velocity profile in bench press. Int. J. Sports Physiol. Perform. 2018, 13, 200–207. [Google Scholar] [CrossRef]
- Picerno, P.; Iannetta, D.; Comotto, S.; Donati, M.; Pecoraro, F.; Zok, M.; Tollis, G.; Figura, M.; Varalda, C.; Di Muzio, D.; et al. 1RM prediction: A novel methodology based on the force-velocity and load-velocity relationships. Eur. J. Appl. Physiol. 2016, 116, 2035–2043. [Google Scholar] [CrossRef]
- Loturco, I.; Kobal, R.; Moraes, J.E.; Kitamura, K.; Cal Abad, C.C.; Pereira, L.A.; Nakamura, F.Y. Predicting the maximum dynamic strength in bench press. J. Strength Cond. Res. 2017, 31, 1127–1131. [Google Scholar] [CrossRef]
- Van Hooren, B.; Zolotarjova, J. The difference between countermovement and squat jump performances. J. Strength Cond. Res. 2017, 31, 2011–2020. [Google Scholar] [CrossRef] [Green Version]
- Rodríguez-Rosell, D.; Mora-Custodio, R.; Franco-Márquez, F.; Yáñez-García, J.M.; González-Badillo, J.J. Traditional vs. sport-specific vertical jump tests. J. Strength Cond. Res. 2017, 31, 196–206. [Google Scholar] [CrossRef]
- Dobbin, N.; Hunwicks, R.; Jones, B.; Till, K.; Highton, J.; Twist, C. Criterion and construct validity of an isometric midthigh-pull dynamometer for assessing whole-body strength in professional rugby league players. Int. J. Sports Physiol. Perform. 2018, 13, 235–239. [Google Scholar] [CrossRef] [PubMed] [Green Version]
- Romero-Franco, N.; Jiménez-Reyes, P.; Montaño-Munuera, J.A. Validity and reliability of a low-cost digital dynamometer for measuring isometric strength of lower limb. J. Sports Sci. 2017, 35, 2179–2184. [Google Scholar] [CrossRef] [PubMed]
- Pérez-Castilla, A.; Jiménez-Reyes, P.; Haff, G.G.; García-Ramos, A. Assessment of the loaded squat jump and countermovement jump exercises with a linear velocity transducer: Which velocity variable provides the highest reliability? Sport Biomech. 2021, 20, 247–260. [Google Scholar] [CrossRef] [PubMed]
- Pérez-Castilla, A.; Feriche, B.; Jaric, S.; Padial, P.; García-Ramos, A. Validity of a linear velocity transducer for testing maximum vertical jumps. J. Appl. Biomech. 2017, 33, 388–392. [Google Scholar] [CrossRef]
- García-Ramos, A.; Pérez-Castilla, A.; Martín, F. Reliability and concurrent validity of the Velowin optoelectronic system to measure movement velocity during the free-weight back squat. Int. J. Sports Sci. Coach. 2018, 13, 737–742. [Google Scholar] [CrossRef]
- Laza-Cagigas, R.; Goss-Sampson, M.; Larumbe-Zabala, E.; Termkolli, L.; Naclerio, F. Validity and reliability of a novel optoelectronic device to measure movement velocity, force and power during the back squat exercise. J. Sports Sci. 2019, 37, 795–802. [Google Scholar] [CrossRef]
- Peterson-Silveira, R.; Stergiou, P.; Carpes, F.P.; Castro, F.A.d.S.; Katz, L.; Stefanyshyn, D.J. Validity of a portable force platform for assessing biomechanical parameters in three different tasks. Sport Biomech. 2017, 16, 177–186. [Google Scholar] [CrossRef]
- Lake, J.; Mundy, P.; Comfort, P.; McMahon, J.J.; Suchomel, T.J.; Carden, P. Concurrent validity of a portable force plate using vertical jump force-time characteristics. J. Appl. Biomech. 2018, 34, 410–413. [Google Scholar] [CrossRef]
- Giroux, C.; Rabita, G.; Chollet, D.; Guilhem, G. What is the best method for assessing lower limb force-velocity relationship? Int. J. Sports Med. 2014, 36, 143–149. [Google Scholar] [CrossRef]
- Nimphius, S.; Callaghan, S.J.; Bezodis, N.E.; Lockie, R.G. Change of direction and agility tests. Strength Cond. J. 2018, 40, 26–38. [Google Scholar] [CrossRef] [Green Version]
- Bastida Castillo, A.; Gómez Carmona, C.D.; Pino Ortega, J.; de la Cruz Sánchez, E. Validity of an inertial system to measure sprint time and sport task time: A proposal for the integration of photocells in an inertial system. Int. J. Perform. Anal. Sport 2017, 17, 600–608. [Google Scholar] [CrossRef]
- Haugen, T.A.; Tønnessen, E.; Svendsen, I.S.; Seiler, S. Sprint time differences between single- and dual-beam timing systems. J. Strength Cond. Res. 2014, 28, 2376–2379. [Google Scholar] [CrossRef] [Green Version]
- Muntaner-Mas, A.; Martinez-Nicolas, A.; Lavie, C.J.; Blair, S.N.; Ross, R.; Arena, R.; Ortega, F.B. A systematic review of fitness apps and their potential clinical and sports utility for objective and remote assessment of cardiorespiratory fitness. Sport. Med. 2019, 49, 587–600. [Google Scholar] [CrossRef] [Green Version]
- Peart, D.J.; Balsalobre-Fernández, C.; Shaw, M.P. Use of mobile applications to collect data in sport, health, and exercise science. J. Strength Cond. Res. 2019, 33, 1167–1177. [Google Scholar] [CrossRef]
- Rigamonti, L.; Albrecht, U.-V.; Lutter, C.; Tempel, M.; Wolfarth, B.; Back, D.A. Potentials of digitalization in sports medicine. Curr. Sports Med. Rep. 2020, 19, 157–163. [Google Scholar] [CrossRef]
- García-Ramos, A.; Feriche, B.; Pérez-Castilla, A.; Padial, P.; Jaric, S. Assessment of leg muscles mechanical capacities: Which jump, loading, and variable type provide the most reliable outcomes? Eur. J. Sport Sci. 2017, 17, 690–698. [Google Scholar] [CrossRef]
- Haynes, T.; Bishop, C.; Antrobus, M.; Brazier, J. The validity and reliability of the My Jump 2 app for measuring the reactive strength index and drop jump performance. J. Sports Med. Phys. Fitness 2019, 59, 195. [Google Scholar] [CrossRef] [Green Version]
- Balsalobre-Fernández, C.; Agopyan, H.; Morin, J.-B. The validity and reliability of an iPhone app for measuring running mechanics. J. Appl. Biomech. 2017, 33, 222–226. [Google Scholar] [CrossRef]
- Martínez-Cava, A.; Hernández-Belmonte, A.; Courel-Ibáñez, J.; Morán-Navarro, R.; González-Badillo, J.J.; Pallarés, J.G. Reliability of technologies to measure the barbell velocity: Implications for monitoring resistance training. PLoS ONE 2020, 15, e0232465. [Google Scholar] [CrossRef]
- Balsalobre-Fernández, C.; Geiser, G.; Krzyszkowski, J.; Kipp, K. Validity and reliability of a computer-vision-based smartphone app for measuring barbell trajectory during the snatch. J. Sports Sci. 2020, 38, 710–716. [Google Scholar] [CrossRef]
- Balsalobre-Fernández, C.; Glaister, M.; Lockey, R.A. The validity and reliability of an iPhone app for measuring vertical jump performance. J. Sports Sci. 2015, 33, 1574–1579. [Google Scholar] [CrossRef]
- Ferriero, G.; Vercelli, S.; Fundarò, C.; Ronconi, G. Use of mobile applications to collect data in sport, health, and exercise science: A narrative review. J. Strength Cond. Res. 2020, 34, e216. [Google Scholar] [CrossRef]
- Moral-Munoz, J.A.; Esteban-Moreno, B.; Herrera-Viedma, E.; Cobo, M.J.; Pérez, I.J. Smartphone applications to perform body balance assessment: A standardized review. J. Med. Syst. 2018, 42, 8873. [Google Scholar] [CrossRef]
- Adamakis, M. Comparing the validity of a GPS monitor and a smartphone application to measure physical activity. J. Mob. Technol. Med. 2017, 6, 28–38. [Google Scholar] [CrossRef] [Green Version]
- Murphy, J.; Uttamlal, T.; Schmidtke, K.A.; Vlaev, I.; Taylor, D.; Ahmad, M.; Alsters, S.; Purkayastha, P.; Scholtz, S.; Ramezani, R.; et al. Tracking physical activity using smart phone apps: Assessing the ability of a current app and systematically collecting patient recommendations for future development. BMC Med. Inform. Decis. Mak. 2020, 20, 17. [Google Scholar] [CrossRef]
- Pradal-Cano, L.; Lozano-Ruiz, C.; Pereyra-Rodríguez, J.J.; Saigí-Rubió, F.; Bach-Faig, A.; Esquius, L.; Medina, F.X.; Aguilar-Martínez, A. Using mobile applications to increase physical activity: A systematic review. Int. J. Environ. Res. Public Health 2020, 17, 8238. [Google Scholar] [CrossRef]
- Keogh, J.W.L.; Cox, A.; Anderson, S.; Liew, B.; Olsen, A.; Schram, B.; Furness, J. Reliability and validity of clinically accessible smartphone applications to measure joint range of motion: A systematic review. PLoS ONE 2019, 14, e0215806. [Google Scholar] [CrossRef] [Green Version]
- Silva, A.G.; Simões, P.; Queirós, A.; Rodrigues, M.; Rocha, N.P. Mobile apps to quantify aspects of physical activity: A systematic review on its reliability and validity. J. Med. Syst. 2020, 44, 51. [Google Scholar] [CrossRef]
- Bort-Roig, J.; Gilson, N.D.; Puig-Ribera, A.; Contreras, R.S.; Trost, S.G. Measuring and influencing physical activity with smartphone technology: A systematic review. Sport. Med. 2014, 44, 671–686. [Google Scholar] [CrossRef]
- Moher, D.; Liberati, A.; Tetzlaff, J.; Altman, D.G. Preferred reporting items for systematic reviews and meta-analyses: The PRISMA statement. PLoS Med. 2009, 6, e1000097. [Google Scholar] [CrossRef] [Green Version]
- Collaboration, C. Data Extraction Template for Included Studies. Available online: https://cccrg.cochrane.org/sites/cccrg.cochrane.org/files/public/uploads/det_2015_revised_final_june_20_2016_nov_29_revised.doc (accessed on 2 January 2021).
- O’Reilly, M.; Caulfield, B.; Ward, T.; Johnston, W.; Doherty, C. Wearable inertial sensor systems for lower limb exercise detection and evaluation: A systematic review. Sport. Med. 2018, 48, 1221–1246. [Google Scholar] [CrossRef] [PubMed] [Green Version]
- Balsalobre-Fernández, C.; Marchante, D.; Baz-Valle, E.; Alonso-Molero, I.; Jiménez, S.L.; Muñóz-López, M. Analysis of wearable and smartphone-based technologies for the measurement of barbell velocity in different resistance training exercises. Front. Physiol. 2017, 8, 649. [Google Scholar] [CrossRef] [PubMed] [Green Version]
- Balsalobre-Fernández, C.; Marchante, D.; Muñoz-López, M.; Jiménez, S.L. Validity and reliability of a novel iPhone app for the measurement of barbell velocity and 1RM on the bench-press exercise. J. Sports Sci. 2018, 36, 64–70. [Google Scholar] [CrossRef]
- Balsalobre-Fernández, C.; Bishop, C.; Beltrán-Garrido, J.V.; Cecilia-Gallego, P.; Cuenca-Amigó, A.; Romero-Rodríguez, D.; Madruga-Parera, M. The validity and reliability of a novel app for the measurement of change of direction performance. J. Sports Sci. 2019, 37, 2420–2424. [Google Scholar] [CrossRef] [PubMed]
- Peláez-Barrajón, J.; San-Juan, A.F. Validity and reliability of a smartphone accelerometer for measuring lift velocity in bench-press exercises. Sustainability 2020, 12, 2312. [Google Scholar] [CrossRef] [Green Version]
- Brooks, E.R.; Benson, A.C.; Bruce, L.M. Novel technologies found to be valid and reliable for the measurement of vertical jump height with jump-and-reach testing. J. Strength Cond. Res. 2018, 32, 2838–2845. [Google Scholar] [CrossRef] [PubMed]
- Cerezuela-Espejo, V.; Hernández-Belmonte, A.; Courel-Ibáñez, J.; Conesa-Ros, E.; Mora-Rodríguez, R.; Pallarés, J.G. Are we ready to measure running power? Repeatability and concurrent validity of five commercial technologies. Eur. J. Sport Sci. 2020, 56, 1–10. [Google Scholar] [CrossRef] [PubMed]
- Courel-Ibáñez, J.; Martínez-Cava, A.; Morán-Navarro, R.; Escribano-Peñas, P.; Chavarren-Cabrero, J.; González-Badillo, J.J.; Pallarés, J.G. Reproducibility and repeatability of five different technologies for bar velocity measurement in resistance training. Ann. Biomed. Eng. 2019, 47, 1523–1538. [Google Scholar] [CrossRef]
- De Sá, E.C.; Ricarte Medeiros, A.; Santana Ferreira, A.; García Ramos, A.; Janicijevic, D.; Boullosa, D. Validity of the iLOAD ® app for resistance training monitoring. PeerJ 2019, 7, e7372. [Google Scholar] [CrossRef] [Green Version]
- Gallardo-Fuentes, F.; Gallardo-Fuentes, J.; Ramírez-Campillo, R.; Balsalobre-Fernández, C.; Martínez, C.; Caniuqueo, A.; Cañas, R.; Banzer, W.; Loturco, I.; Nakamura, F.Y.; et al. Intersession and intrasession reliability and validity of the My Jump app for measuring different jump actions in trained male and female athletes. J. Strength Cond. Res. 2016, 30, 2049–2056. [Google Scholar] [CrossRef]
- Pérez-Castilla, A.; Piepoli, A.; Garrido-Blanca, G.; Delgado-García, G.; Balsalobre-Fernández, C.; García-Ramos, A. Precision of 7 commercially available devices for predicting bench-press 1-repetition maximum from the individual load-velocity relationship. Int. J. Sports Physiol. Perform. 2019, 14, 1442–1446. [Google Scholar] [CrossRef]
- Pérez-Castilla, A.; Piepoli, A.; Delgado-García, G.; Garrido-Blanca, G.; García-Ramos, A. Reliability and concurrent validity of seven commercially available devices for the assessment of movement velocity at different intensities during the bench press. J. Strength Cond. Res. 2019, 33, 1258–1265. [Google Scholar] [CrossRef]
- Pérez-Castilla, A.; Boullosa, D.; García-Ramos, A. Reliability and validity of the iLOAD application for monitoring the mean set velocity during the back squat and bench press exercises performed against different loads. J. Strength Cond. Res. 2020. [Google Scholar] [CrossRef]
- Romero-Franco, N.; Jiménez-Reyes, P.; Castaño-Zambudio, A.; Capelo-Ramírez, F.; Rodríguez-Juan, J.J.; González-Hernández, J.; Toscano-Bendala, F.J.; Cuadrado-Peñafiel, V.; Balsalobre-Fernández, C. Sprint performance and mechanical outputs computed with an iPhone app: Comparison with existing reference methods. Eur. J. Sport Sci. 2017, 17, 386–392. [Google Scholar] [CrossRef]
- Stanton, R.; Wintour, S.-A.; Kean, C.O. Validity and intra-rater reliability of MyJump app on iPhone 6s in jump performance. J. Sci. Med. Sport 2017, 20, 518–523. [Google Scholar] [CrossRef]
- Stanton, R.; Hayman, M.; Humphris, N.; Borgelt, H.; Fox, J.; Del Vecchio, L.; Humphries, B. Validity of a smartphone-based application for determining sprinting performance. J. Sports Med. 2016, 2016, 1–5. [Google Scholar] [CrossRef] [Green Version]
- Thompson, S.W.; Rogerson, D.; Dorrell, H.F.; Ruddock, A.; Barnes, A. The reliability and validity of current technologies for measuring barbell velocity in the free-weight back squat and power clean. Sports 2020, 8, 94. [Google Scholar] [CrossRef]
- Viecelli, C.; Graf, D.; Aguayo, D.; Hafen, E.; Füchslin, R.M. Using smartphone accelerometer data to obtain scientific mechanical-biological descriptors of resistance exercise training. PLoS ONE 2020, 15, e0235156. [Google Scholar] [CrossRef]
- Yang, L.; Grooten, W.J.A.; Forsman, M. An iPhone application for upper arm posture and movement measurements. Appl. Ergon. 2017, 65, 492–500. [Google Scholar] [CrossRef]
- Yingling, V.R.; Castro, D.A.; Duong, J.T.; Malpartida, F.J.; Usher, J.R.; Jenny, O. The reliability of vertical jump tests between the Vertec and My Jump phone application. PeerJ 2018, 6, e4669. [Google Scholar] [CrossRef] [Green Version]
- Alonso-Aubin, D.A.; Chulvi-Medrano, I.; Cortell-Tormo, J.M.; Picón-Martínez, M.; Rial Rebullido, T.; Faigenbaum, A.D. Squat and bench press force-velocity profiling in male and female adolescent rugby players. J. Strength Cond. Res. 2019, 35, 1–7. [Google Scholar] [CrossRef] [PubMed]
- Samozino, P.; Rabita, G.; Dorel, S.; Slawinski, J.; Peyrot, N.; Saez de Villarreal, E.; Morin, J.B. A simple method for measuring power, force, velocity properties, and mechanical effectiveness in sprint running. Scand. J. Med. Sci. Sport. 2016, 26, 648–658. [Google Scholar] [CrossRef] [PubMed]


| Inclusion Criteria | Exclusion Criteria |
|---|---|
| Test of a mobile application in sport and exercise | Instruments other than mobile applications (e.g., computer software) |
| Tests were conducted in healthy athletes or recreationally healthy active adults for strength (e.g., resistance training exercises/movements), power (e.g., jumping, lifting movements), velocity (e.g., linear sprinting), and change-of-direction | The tests were not conducted in athletes (e.g., pregnant, elderly) or in healthy active adults (i.e., injury) for strength, power, velocity, and change-of-direction related movements (e.g., assessment of instruments without human action involved) |
| Estimation of movement velocity, movement time (e.g., a difference of time to complete a movement), and movement displacement (e.g., jump height) | Estimation of other outcomes than movement velocity, movement time, and movement displacement |
In the case of validity, the apps were compared to the recognized gold standard:
| For validity, the apps were not compared with recognized gold standard methods or were compared with other apps |
| In the case of validity, one of the following measures were included: (i) typical error; (ii) mean absolute error; (iii) correlation coefficient; and (iv) standard error of the estimate | For validity, outcomes presented are not typical error, mean absolute error, correlation coefficient or standard error of estimate. |
| In the case of reliability, one of the following measures were included: (i) intraclass correlation test; (ii) coefficient of variation; (iii) standardized typical error; and (iv) standard error of measurement. | For reliability, outcomes presented are not (i) intraclass correlation test; (ii) coefficient of variation; (iii) standardized typical error; and (iv) standard error of measurement. |
| Only original and full-text studies written in English | Written in language other than English. Other article types than original (e.g., reviews, letters to editors, trial registrations, proposals for protocols, editorials, book chapters and conference abstracts). |
| Study | 1 | 2 | 3 | 4 | 5 | 6 | 7 | 8 | 9 | 10 | Quality |
|---|---|---|---|---|---|---|---|---|---|---|---|
| Balsalobre-Fernández et al. [40] | 1 | 0 | 1 | 1 | 1 | 1 | 1 | 1 | 0 | 0 | Low |
| Balsalobre-Fernández et al. [53] | 1 | 0 | 1 | 1 | 1 | 1 | 1 | 0 | 0 | 0 | Low |
| Balsalobre-Fernández et al. [54] | 1 | 1 | 1 | 1 | 1 | 1 | 1 | 0 | 1 | 0 | High |
| Balsalobre-Fernández et al. [55] | 1 | 1 | 1 | 1 | 1 | 1 | 1 | 1 | 1 | 0 | High |
| Balsalobre-Fernández et al. [41] | 1 | 0 | 0 | 1 | 1 | 1 | 1 | 1 | 0 | 0 | Low |
| Barrajón & Juan [56] | 1 | 1 | 1 | 1 | 1 | 1 | 1 | 1 | 1 | 1 | High |
| Brooks et al. [57] | 1 | 1 | 1 | 1 | 1 | 1 | 1 | 0 | 1 | 1 | High |
| Cerezuela-Espejo et al. [58] | 1 | 1 | 1 | 1 | 1 | 1 | 1 | 1 | 0 | 1 | High |
| Courel-Ibáñez et al. [59] | 1 | 0 | 1 | 1 | 1 | 1 | 1 | 1 | 1 | 0 | High |
| de Sá et al. [60] | 1 | 1 | 1 | 1 | 1 | 1 | 1 | 1 | 1 | 1 | High |
| Gallardo-Fuentes et al. [61] | 1 | 1 | 1 | 1 | 1 | 1 | 1 | 1 | 1 | 1 | High |
| Haynes et al. [37] | 1 | 1 | 1 | 1 | 1 | 1 | 1 | 1 | 1 | 1 | High |
| Martínez-Cava et al. [39] | 1 | 0 | 1 | 1 | 1 | 1 | 1 | 1 | 0 | 1 | High |
| Pérez-Castilla et al. [62] | 1 | 1 | 0 | 1 | 1 | 1 | 1 | 0 | 0 | 1 | Low |
| Pérez-Castilla et al. [63] | 1 | 1 | 1 | 1 | 1 | 1 | 1 | 1 | 1 | 1 | High |
| Pérez-Castilla et al. [64] | 1 | 1 | 1 | 1 | 1 | 1 | 1 | 1 | 1 | 1 | High |
| Romero-Franco et al. [65] | 1 | 0 | 1 | 1 | 1 | 1 | 1 | 1 | 0 | 0 | Low |
| Stanton et al. [66] | 1 | 0 | 1 | 1 | 1 | 1 | 1 | 1 | 1 | 1 | High |
| Stanton et al. [67] | 1 | 0 | 1 | 1 | 1 | 1 | 1 | 1 | 1 | 1 | High |
| Thompson et al. [68] | 1 | 1 | 1 | 1 | 1 | 1 | 1 | 1 | 1 | 1 | High |
| Viecelli et al. [69] | 1 | 1 | 1 | 1 | 1 | 1 | 1 | 1 | 1 | 1 | High |
| Yang et al. [70] | 1 | 0 | 1 | 1 | 1 | 1 | 1 | 1 | 0 | 0 | Low |
| Yingling et al. [71] | 1 | 1 | 0 | 1 | 1 | 1 | 1 | 1 | 1 | 1 | High |
| Study | Outcome Tested | Tested Validity | Tested Reliability | App | App Characteristics | Comparator Characteristics | N/Population | Sex | Age | Experimental Protocol | Test or Movement | Validity Outcomes | Reliability Outcomes |
|---|---|---|---|---|---|---|---|---|---|---|---|---|---|
| Balsalobre-Fernández et al. [40] | Peak forward displacement; Peak backward displacement; Peak vertical velocity | Yes | Yes | My Lift App | Designed to automatically detect barbell trajectory | Vicon 3D motion capture system at 100 Hz (T-Series Cameras, Vicon Denver, Centennial, CO, USA). | 10 Collegiate NCAA division I athletes | Male | 20.9 ± 1.6 y.o. | Two repetitions with 40, 50, 60, 70 & 80% of their snatch 1-RM | Snatch | SEE; Cross Correlation coefficients Bland-Altman plots | ICC |
| Balsalobre-Fernández et al. [53] | Peak vertical Velocity | Yes | Yes | PowerLift App | Measure barbell velocity by video-recording thanks to the high-speed camera | Beast Sensor 3-axis accelerometer, gyroscope and magnetometer that measures velocity at a sampling rate of 50 Hz. | 10 powerlifters | Male | 26.1 ± 3.9 y.o. | Two repetitions with the five initial sets (which corresponded approximately to 50, 60, 70, 80, and 90% of the 1-RM) | Bench Press Hip Thrust Full squat | r-Pearson Bland-Altman plots | ICC |
| Balsalobre-Fernández et al. [54] | Peak vertical Velocity | Yes | Yes | PowerLift App | Measure barbell velocity by video-recording thanks to the high-speed camera | Smartcoach Power Encoder (Smartcoach Europe, Stockholm, Sweden) at 1000 Hz. | 10 resistance trained athletes | Male | 26.5 ± 6.5 y.o. | 5 sets on the bench-press exercise with loads ranging 75–100% of 1RM. | Bench Press | SEE | ICC, Alpha Cronbach; Paired Sample t-test and Bland-Altman plots |
| Balsalobre-Fernández et al. [55] | Agility | Yes | Yes | CODtimer App | Record frequency of 240 frames per second (fps) at a quality of FullHD (1920 × 1080 pixels). | Witty gate, Microgate, Bolzano, Italy (with a 150 m range and a precision of ±0.4 ms). | 20 adolescent soccer players | Male | 13.85 ± 1.34 y.o. | 6 trials (3 trials with COD executed with the right lower limb and 3 trials with COD executed with the left lower limb). | 5 + 5 COD test measurement | Linear Regression; r-Pearson SEE | ICC Sample paired t-test and Bland-Altman plots. |
| Balsalobre-Fernández et al. [41] | Vertical Jump | Yes | Yes | My Jump App | A videorecord (240 frames per second): Includes a 120 Hz high-speed camera). | Force platform: recorded data at a sampling frequency of 1000 Hz. | 20 recreationally students | Male | 22.1 ± 3.6 y.o. | Each participant performed five CMJs. | Countermovement Jump | Bivariate Pearson ICC | ICC Cronbach’s alpha and CV |
| Barrajón & Juan [56] | Peak vertical Velocity | Yes | Yes | Smartphone with Mobile Basic Program Acelerometer | lis3dh tri-axial accelerometer (STMicroelectronics, Geneva, Switzerland) at 50 Hz. | Speed4Lifts Linear Transducer (Madrid, Spain). | 10 young and healthy person | Male | 23.1 ± 2.5 y.o. | Three sets of one repetition with a load of 70% 1RM. Three sets of one. repetition at 90% 1RM. 1RM attempt. | Bench Press | r-Pearson | ICC and Cronbach’s Alpha |
| Brooks et al. [57] | Vertical Jump | Yes | Yes | My Jump 2 App | Videorecord (240 frames per second): Includes a 120 Hz high-speed camera). | AMTI AccuPower force platform (Advanced Mechanical Technology Inc., MA, USA) at 400 Hz. | 26 subjects | 14 Male and 12 Female | 23.2 ± 3.4 y.o. | 3 jumps per participant. | Jump and Reach vertical jump test | r-Pearson Standardized mean bias | Standardized typical error ICC |
| Cerezuela-Espejo et al. [58] | Running Power | Yes | Yes | Styrd App | Pedometer (Stryd Summit Powermeter, firmware 1.2; Stryd, Inc., Boulder, CO, USA. | RunScribe(RunScribe Plus V3, Scribe Labs, Inc., Half Moon Bay, CA, USA). Garmin Running Power(v1.6, Olathe, Kansas, USA). Polar Vantage V (firmware 3.1.7, Polar, OY, Kempele, Finland) | 12 endurance-trained athletes | Male | 25.7 ± 7.9 y.o | 3 min of work and 4 min of rest (3:4 ratio)—9 km·h−1 with 1 km·h−1 increments; 10 km·h−1, with weighted vest; 10 km·h−1, with treadmill inclination modified: −6%, −3%, 1%, +3% and +6%. | Running | SEM Repeated-Measures ANOVA | ICC Linear Regression r-Pearson SEE |
| Courel-Ibáñez et al. [59] | Peak Vertical Velocity | Yes | Yes | PowerLiftApp | Mean Velocity by video-recording the lift at slow motion (240 fps, 1080p): 240 Hz | T-Force Dynamic Measurement SystemTM (Ergotech Consulting, Murcia, Spain): 1000 Hz. ChronojumpTM (Chronojump, Bar- celona, Spain): 500 Hz VelowinTM: 500 Hz PushTM Band (PUSH Inc., Toronto, Canada):200 Hz | 17 resistance-trained | males | 26.0 ± 3.6 y.o | Two repetitions against fixed loads of 20, 30, 40, 50, 60, 70 and 80 kg. | Bench Press | ICC | CCC SEM |
| de Sá et al. [60] | Peak vertical Velocity | Yes | No | iLoad App | Record mean velocity (v 1.0; ILoad Solutions, Brasilia, Brazil) | Linear Encoder (Chronojump, Barcelona, Spain): displacement-time data at 1000 Hz. | 16 young individuals | 4 Female 12 Male | 29.5 ± 7.2 y.o. | 1st session—10 repetition maximum (RM) load. 2nd session—3 sets of 10 repetitions 10RM load. | Half Squat | Independent Sample t-test; ES; r-Pearson and Bland Altman | N.D. |
| Gallardo-Fuentes et al. [61] | Vertical Jump | Yes | Yes | My Jump App | A videorecord (240 frames per second): Includes a 120 Hz high-speed camera). | Contact Platform (Ergotester, Globus, Cologne, Italy): high speed video camera (300 frames per second). | 21 athletes | 14 male and 7 female | 22.1 ± 3.6 y.o. | Five squat jumps, five countermovement jumps and five 40 cm drop jumps | Squat Jump Countermovement jump Drop Jump | r-Pearson Cronbach Alpha; ICC and Bland-Altman plots | ICC |
| Haynes et al. [37] | Reactive Strength Index | Yes | Yes | My Jump 2 App | A videorecord (240 frames per second): Includes a 120 Hz high-speed camera). | Force Platform (FP8, Hurlab, Finland): force platform, with a sampling frequency of 1200 Hz, | 14 athletes | Male | 29.5 ± 9.9 y.o. | Three DJ onto a force platform. Drop heigh of 20 cm and 40 cm was used. | Drop Jump | r-Pearson; Cronbach alpha; CV | ICC Bland-Altman plots |
| Martínez-Cava et al. [39] | Peak vertical Velocity | No | Yes | My Lift App | Peak vertical and horizontal displacement, peak and mean vertical velocity, instantaneous velocity and time (60 Hz). | T-Force Dynamic Measurement System (Ergotech Consulting, Murcia, Spain): 1000 Hz; Speed4Lifts (v2.0, Speed4Lifts, Madrid, Spain): 100 Hz STT (STT system, Basque Country, Spain): 100 Hz. | 15 individuals | Male | 27.0 ± 3.8 y.o. | One repetition against eight fixed loads (25, 35, 45, 55, 65, 75, 85 and 95 kg) at maximal intended velocity. | Bench Press Full Squat | ICC CCC SEE r-Pearson SEM | |
| Pérez-Castilla et al. [62] | Load Velocity | Yes | Yes | PowerLiftApp | Mean Velocity by video-recording the lift at slow motion (240 fps, 1080 p): 240 Hz | Linear velocity transducer (T-Force [v.2.28, T-Force System, Ergotech, Murcia, Spain]: 1000 Hz; Chronojump [v.1.6.2, Chronojump Boscosystem?, Barcelona, Spain]; Speed4Lift [v.4.1, Speed4Lift, Madrid, Spain]: 1000 Hz; Velowin [v.1.6.314, Velowin, DeporTeC, Murcia, Spain]: 500 Hz; PUSH band [v1.1.26, PUSHTH band, PUSH Inc., Toronto, Canada]: 200 Hz; Beast sensor [v.2.3.7, Beast sensor, Beast Technologies Srl., Brescia, Italy]): 50 Hz | 11 individuals | Male | 22.5 ± 1.9 y.o. | 1st session: load was incremented by 10 to 1 kg until the 1RM load was reached. 2nd session: 3 repetitions against 5 incremental loads (45–55–65–75–85%1RM), followed by 1RM. | Bench Press | ES SEE Two-way repeated-measured ANOVA | r-Pearson SEE |
| Pérez-Castilla et al. [63] | Peak Vertical Velocity | Yes | Yes | PowerLift App | Mean Velocity by video-recording the lift at slow motion (240 fps, 1080 p): 240 Hz | Trio-OptiTrack (V120:Trio; OptiTrack, Natu- ralPoint, Inc.):120 Hz Linear velocity transducer (T-Force [v.2.28, T-Force System, Ergotech, Murcia, Spain]: 1000 Hz; Chronojump [v.1.6.2, Chronojump Boscosystem?, Barcelona, Spain]; Speed4Lift [v.4.1, Speed4Lift, Madrid, Spain]: 1000 Hz; Velowin [v.1.6.314, Velowin, DeporTeC, Murcia, Spain]: 500 Hz; PUSH band [v1.1.26, PUSHTH band, PUSH Inc., Toronto, Canada]: 200 Hz; Beast sensor [v.2.3.7, Beast sensor, Beast Technologies Srl., Brescia, Italy]): 50 Hz. | 14 individuals | Male | 22.96 ± 1.6 y.o. | 1st session: One 1RM in the bench press exercise. 2nd session: 3 repetitions against 5 loads (45, 55, 65, 75, and 85% of 1RM | Bench Press | Bland-Altman r-Pearson | CV ICC |
| Pérez-Castilla et al. [64] | Velocity | Yes | Yes | iLoad App | Record Linear velocity | T-Force system; Ergotech, Muscia, Spain) calculated at a sampling rate of 1000 Hz. | 20 Students | Male | 23.0 ± 2.6 y.o. | 2 Sessions: 10 repetitions against four loads (25–40–55–70% of the 1RM. | Back Squat Bench Press | Samples t-test Hedge’sES SEE r-Pearson | SEM Hedge’s ES CV |
| Romero-Franco et al. [65] | Sprint Performance | Yes | Yes | MySprint App | 240 fps high-speed camera at a quality of 720p | Radar gun (Stalker ATS ProII; Applied Concepts, Plano, TX, USA): sampling rate of 46.875 Hz. Timing photocells (Microgate, Bolzano, Italy) | 12 Sprinters | Male | 21.4 ± 3.9 y.o. | 6 maximal effort 40-m sprints, with 5-min rest between trials, on a synthetic outdoor track. | 40 m Sprints | r-Pearson SEE | ICC Bland-Altman plots CV |
| Stanton et al. [66] | Vertical Jump | Yes | Yes | MyJump App | A videorecord (240 frames per second): Includes a 120 Hz high-speed camera). | AMTI BP400 800–2000 force plate (Advanced Mechanical Technology Inc, Watertown, MA) collected at 1000 Hz. | 29 adults | 19 Female 10 male | 26.41 ± 5.36 | Two attempts with a two minute passive rest between attempts. | Countermovement Jump Drop Jump | r-Pearson ICC | Bland and Altman plots ICC |
| Stanton et al. [67] | Sprint Performance | Yes | No | Speedclock App | Records video at 60 frames per second | Smart-Speed Pro timing lights (Fusion Sport, Coopers Plains, Australia) | 24 active individuals | female | >18 y.o. | Four maximal effort 20m sprints. | 20 m Sprint | Independent t-test; ICC Bland Altman plots | |
| Thompson et al. [68] | Peack Vertical Velocity | Yes | Yes | MyLift App | Manual frame-by-frame inspection of slow-motion video. 240 Hz (720 p video quality) | 3D motion capture (Raptor, Motion Analysis Cooperation, Rohnert Park, CA, USA) sampling at 250 Hz. Push Band (inertial measurement unit)—3 axis accelerometer at 1000 Hz | 10 weightlifters | Male | 25.0 ± 5.6 y.o. | Incremental load from 40‒100% 1RM (10% increments) 3 repetitions for light loads (≤60%), 2 repetitions for moderate loads (70‒80%), and 1 repetition for heavy loads (≥90%), | Back Squat Power Clean | Least Products Regression | Typical Error CV |
| Viecelli et al. [69] | Resistance exercise | Yes | Yes | Smartphone | 3-axis accelerometer BMI160 (Robert Bosch GmbH, Stuttgart, Germany: 400 Hz) | Sony HDR-CX900E (Sony, Tokio, Japan): 400 Hz vs. 50 Hz. | 22 participants | Two sets of ten repetitions of their 60% one repetition maximum | Adductor, Abductor, Chest Press, Leg Curl, Leg Extension, Leg Press, Lower Back, Total Abdominal and Vertical Traction | Bland-Altman plots r-Pearson | ICC | ||
| Yang et al. [70] | Arm posture and movement | Yes | Yes | ErgoArmMeter | Three-dimensional data from the built-in accelerometer and gyroscope (20 Hz) | Optical tracking system (OTS) (Elite, 2002; version 2.8.4380; BTS, Milano, Italy) with a sampling frequency of 100 Hz. | 10 subjects | 3 female 7 male | Median age: 24.5 y.o. | (1) static arm postures at three inclination angles in two different planes; (2) dynamic arm swings in the sagittal plane at three different rates; and (3) two simulated work tasks: mail sorting, and hair drying with a blow dryer. | Static posture Dynamic arm swing Dynamic work tasks | r-Pearson Bland-Altman plot | RMSD |
| Yingling et al. [71] | Peak Power | No | Yes | MyJump App | A videorecord (240 frames per second): Includes a 120 Hz high-speed camera). | Vertec (JUMPUSA.com, Sunnyvale, CA, USA) | 135 subjects | 94 males 41 females | 18–39 y.o. | Three maximal Sargent VJ with countermovement | Countermovement Jump | ICC |
| Study | App | SEE | Typical Error | Absolute Mean Error | Correlation Coefficient | Evidence |
|---|---|---|---|---|---|---|
| Balsalobre-Fernández et al. [40] | My Lift app | PVD: 0.056 m·s−1 PFD: 0.029 m·s−1 PBD: 0.048 m·s−1 PVV: 0.124 m·s−1 | PVD: 0.053 ± 0.044 0.019 PFD: 0.030 ± 0.022 0.008 PBD: 0.044 ± 0.034 0.012 PVV: 0.113 ± 0.086 | r = 0.729–0.902, p < 0.001 | Authors claim the validity of the app. | |
| Balsalobre-Fernández et al. [53] | PowerLift App | Full Squat: 0.04 m·s−1 Bench Press: 0.05 m·s−1 Hip Thrust: 0.03 m·s−1 | Full Squat: 0.005 ± 0.04 Bench Press: 0.01 ± 0.05 Hip Thrust: 0.02 ± 0.04 | Full Squat (r = 0.986, p < 0.005) Bench Press (r = 0.973, p < 0.005) Hip Thrust (r = 0.982, p < 0.005) | Authors claim the validity of the app. | |
| Balsalobre-Fernández et al. [54] | PowerLift App | 0.03 s.; p < 0.001 | r = 0.964, p < 0.001 | Authors claim the validity of the app. | ||
| Balsalobre-Fernández et al. [55] | CODtimer App | 0.03 s.; p < 0.001 | r = 0.998; p < 0.001 | Authors claim the validity of the Iphone app. | ||
| Balsalobre-Fernández et al. [41] | My Jump App | 1.1 ± 0.5 cm; 1.3 ± 0.5 cm | r = 0.995, p < 0.001 | Authors claim the accuracy of the app. | ||
| Barrajón & Juan [56] | Smartphone with Mobile Basic Program Acelerometer | 0.13 m/s = 0.83 | r = 0.54, p < 0.001 | Authors claim the validity for mean propulsive velocities but not in lower velocity ranges. | ||
| Brooks et al. [57] | My Jump 2 App | T.E = 0.18 | Platforce platform = 0.96 Yardstick = 0.23 cm | Platform force: r = 0.98 Yardstick: r = 0.94 | Authors claim acceptable validity compared with both the force platform and yardstick. | |
| Cerezuela-Espejo et al. [58] | Styrd App | SEE < 7.3% | r = 0.911 | Authors claim the validity of the app. | ||
| Courel-Ibáñez et al. [59] | PowerLift App | +=0.08 m.s−1 | >27.7% 1RM | Authors did not recommend the app given their substantial errors and uncertainty of the measurements | ||
| de Sá et al. [60] | iLoad App | ≤0.003 m s−1 | Total Work: r = 0.997, p < 0.005 Mean Velocity: r = 0.987, p < 0.005. | Authors claim the validity of the app. | ||
| Gallardo-Fuentes et al. [61] | My Jump App | SJ: 0.1 ± 1.1 cm CMJ: 0.1 ± 1.0 cm DJ: −0.1 ± 0.7 cm | SJ (r = 2 0.96–0.99, p < 0.001) CMJ (r = 0.97–0.99, p < 0.001) DJ (r = 0.97–0.99, p < 0.001) | Authors claim the validity of the app. | ||
| Haynes et al. [37] | My Jump 2 App | RSI 20 cm: r = 0.938, p < 0.001. RSI 40 cm: r = 0.969, p < 0.001. Jump Height 20 cm: r = 0.812, p < 0.001. Jump Height 40 cm: r = 0.959, p < 0.001. Contact Time 20 cm: r = 0.963, p < 0.001. Contact Time 40 cm: r = 0.981, p < 0.001. Mean Power 20 cm: r = 0.655, p < 0.001. Mean Power 40 cm: r = 0.571, p < 0.001. | Authors claim the validity of the app. | |||
| Martínez-Cava et al. [39] | My Lift App | Bench Press: 0.10 + −0.97 Full Squat: -0.14 ± 0.10 m·s−1 | My Lift app showed the worst result with errors well above the acceptable levels. | |||
| Pérez-Castilla et al. [62] | PowerLift App | ≤4.46 kg | 5.77 ± 3.58 | r ≥ 0.94, p < 0.05 | Authors claim the acceptable and comparValid accuracy of the app. | |
| Pérez-Castilla et al. [63] | PowerLift App | −0.04 ± 0.02 m.s−1 | r = 0.994, p < 0.05 | Authors claim that smartphone application could be used to obtain accurate velocity measurements for restricted linear movements. | ||
| Pérez-Castilla et al. [64] | iLoad App | Back Squat: ≤0.04 m.s−1 Bench Press: 0.06 m.s−1 | Back Squat: r = 0.98, p < 0.001 Bench Press: r = 0.98, p < 0.001 | Authors claim that the app can be confidently used to quantify mean velocity. | ||
| Romero-Franco et al. [65] | MySprint App | 0.007–0.015 s | r = 0.989-0.999, p < 0.001 | Authors claim the validity of the app. | ||
| Stanton et al. [66] | MyJump app | 1.0 cm | r > 0.99, p < 0.001 | Authors claim the validity of the app. | ||
| Stanton et al. [67] | Speedclock App | 0.13 s | r = 0.93, p < 0.05 | Authors claim the valid tool for the assessment of mean 10m sprint velocity. | ||
| Thompson et al. [68] | MyLift App | Mean Velocity: 0.05 m·s−1 | r ≥ 0.88, p < 0.05 | Authors claim that smartphone applications could be used to obtain velocity-based data, but inertial measurements units demonstrate poorer validity. | ||
| Viecelli et al. [69] | Smartphone Accelerometer | 0.16% | r > 0.93, p < 0.05 | Authors claim that data from smartphone accelerometer- derived resistance exercise can be used to validly extract | ||
| Yang et al. [70] | ErgoArmMeter | <9.5º/s | r = 0.999 | Authors claim that application is a valid method to measure upper arm elevation under static and dynamic conditions. | ||
| Yingling et al. [71] | MyJump App | Peak Power: r = 0.926 Vertical jump height: r = 0.813 | Authors recommend the use of the APP during repeated measures within-subject testing of individuals or groups. |
| Study | App | Intraclass Correlation Coefficient [ICC] | Typical Error of Measurement [TEM] (%) | Coefficient of Variation [CV] (%) | Standard Error of Measurement [SEM] | Evidence |
|---|---|---|---|---|---|---|
| Balsalobre-Fernández et al. [40] | My Lift app | ICC = 0.760–0.941 | Authors claim the reliability of the app. | |||
| Balsalobre-Fernández et al. [53] | PowerLift App | ICC = 0.928–0.989 | Authors claim the reliability and accuracy of the app. | |||
| Balsalobre-Fernández et al. [54] | PowerLift App | ICC = 0.965 | Authors claim the reliability of the app. | |||
| Balsalobre-Fernández et al. [55] | CODtimer App | ICC = 0.671–0.840 | CV = 2.2–3.2% | Authors claim the reliability of the Iphone app. | ||
| Balsalobre-Fernández et al. [41] | My Jump App | ICC = 0.999 | Observer 1: CV = 3.4%; Observer 2: CV = 3.6% | Authors claim the reliability of the app. | ||
| Barrajón & Juan [56] | Smartphone with Mobile Basic Program Acelerometer | ICC = 0.634 | Authors claim the reliability for mean propulsive velocities but not in lower velocity ranges. | |||
| Brooks et al. [57] | My Jump 2 App | ICC = 0.99 | 0.02 (90% CI: 0.02–0.02; trivial) | Platform force: CV = 6.7% Yardstick: CV = 12% | Authors claim acceptable reliability compared with both the force platform and yardstick. | |
| Cerezuela-Espejo et al. [58] | Styrd App | ICC ≥ 0.980 | CV ≥ 4.3% | SEM = 12.5W | Authors claim the reliability of the app. | |
| Courel-Ibáñez et al. [59] | PowerLift App | ICC = 0.973 | CV = 10.4% | SEM = 0.08 m.s−1 | Authors did not recommend the app given the substantial errors and uncertainty of the measurements | |
| de Sá et al. [60] | iLoad App | ICC = 0.941 | Authors did not analyze the reliability of the app. | |||
| Gallardo-Fuentes et al. [61] | My Jump App | ICC = 11 0.97–0.99) | CV = 3.8–7.6% | Authors claim the validity and reliability of the app. | ||
| Haynes et al. [37] | My Jump 2 App | 20 cm for RSI (ICC = 0.95 40 cm for RSI (ICC = 0.98) jump height (ICC = 0.96) 20 cm for jump height (ICC = 0.80) | RSI at 20 cm (CV = 6.71%) and at 40cm (CV = 10.32%). CV value for the 40cm jump was unacceptable | Authors claim the reliability of the app measuring the DJ on 20 cm. | ||
| Martínez-Cava et al. [39] | My Lift App | Full Squat: ICC = 0.993 Bench Press: ICC = 0.972 | Full Squat: CV = 5.02% Bench Press: CV = 7.04% | Full Squat: SEM = 0.08 m.s−1 Bench Press: SEM = 0.08 m.s−1 | My Lift app showed the worst result, with errors well above the acceptable levels. | |
| Pérez-Castilla et al. [62] | PowerLift App | ICC = 0.73 | CV = 3.97% | No reliability test was performed in the study | ||
| Pérez-Castilla et al. [63] | PowerLift App | ICC = 0.70 | CV = 3.97% | Authors claim that smartphone application could be used to obtain accurate velocity measurements for restricted linear movements. | ||
| Pérez-Castilla et al. [64] | iLoad App | CV Range: 5.61–9.79% | Authors claim that the app can be confidently used to quantify mean velocity. | |||
| Romero-Franco et al. [65] | MySprint App | ICC = 1.0 | CV = 0.027–0.14% | Authors claim the valid and reliValid using the app. | ||
| Stanton et al. [66] | My Jump app | ICC values range from 0.997 for CMJ to 0.998 for DJ | Authors claim the valid and highly reliValid tool using the app. | |||
| Stanton et al. [67] | Speedclock App | ICC = 0.93 | Authors did not analyze the reliability of the app. | |||
| Thompson et al. [68] | MyLift App | TEM = 0.05 m.s−1 | CV = 9.7 m.s−1 | Authors claim that smartphone applications could be used to obtain velocity-based data, but inertial measurement units demonstrate poorer reliability and validity. | ||
| Viecelli et al. [69] | Smartphone Accelerometer | ICC > 0.99 | Authors claim that data from smartphone accelerometer derived resistance exercise can be used to validly and reliably extract | |||
| Yang et al. [70] | ErgoArmMeter | SEM < 13.1º/s | Authors claim that application is a valid method to measure upper arm elevation under static and dynamic conditions. | |||
| Yingling et al. [71] | MyJump App | Peak Power: males (ICC = 0.747) females (ICC = 0.748) Vertical jump height: males (ICC = 0.492) females (ICC = 0.469) | Authors recommend the use of the APP during repeated measures within-subject testing of individuals or groups. |
| MyLift App | PowerLift App | CODtimer App | My Jump App | My Jump 2 App | Styrd App | Smartphone with Mobile Basic Program Accelerometer | Ergo Arm Meter | iLoad App | MySprint App | Speedclock App | |
|---|---|---|---|---|---|---|---|---|---|---|---|
| Validity | |||||||||||
| Movement velocity | Valid | Valid | Not valid | Not valid | Not valid | Not valid | Valid | Not valid | Valid | Valid | Valid |
| Movement time | Not valid | Not valid | Valid | Not valid | Not valid | Not valid | Not valid | Not valid | Not valid | Valid | Valid |
| Movement displacement | Not valid | Not valid | Valid | Valid | Valid | Valid | Not valid | Valid | Not valid | Not valid | Not valid |
| Power output | Not valid | Not valid | Not valid | Not valid | Not valid | Valid | Not valid | Not valid | Not valid | Valid | Not valid |
| Workload | Not valid | Not valid | Not valid | Not valid | Not valid | Valid | Not valid | Not valid | Valid | Not valid | Not valid |
| MyLift App | PowerLift App | CODtimer App | My Jump App | My Jump 2 App | Styrd App | Smartphone with Mobile Basic Program Acelerometer | Ergo Arm Meter | iLoad App | MySprint App | SpeedClock App | |
|---|---|---|---|---|---|---|---|---|---|---|---|
| Reliability | |||||||||||
| Movement velocity | Reliable | Reliable | Not reliable | Not reliable | Not reliable | Not reliable | Reliable | Not reliable | Reliable | Reliable | Not tested |
| Movement time | Not reliable | Not reliable | Reliable | Not reliable | Not reliable | Not reliable | Not reliable | Not reliable | Reliable | Reliable | Not tested |
| Movement displacement | Not reliable | Not reliable | Reliable | Reliable | Reliable | Reliable | Not reliable | Reliable | Not reliable | Not reliable | Not tested |
| Power output | Not reliable | Not reliable | Not reliable | Not reliable | Not reliable | Reliable | Not reliable | Not reliable | Not reliable | Reliable | Not tested |
| Workload | Not reliable | Not reliable | Not reliable | Not reliable | Not reliable | Reliable | Not reliable | Not reliable | Reliable | Not reliable | Not tested |
Publisher’s Note: MDPI stays neutral with regard to jurisdictional claims in published maps and institutional affiliations. |
© 2021 by the authors. Licensee MDPI, Basel, Switzerland. This article is an open access article distributed under the terms and conditions of the Creative Commons Attribution (CC BY) license (https://creativecommons.org/licenses/by/4.0/).
Share and Cite
Silva, R.; Rico-González, M.; Lima, R.; Akyildiz, Z.; Pino-Ortega, J.; Clemente, F.M. Validity and Reliability of Mobile Applications for Assessing Strength, Power, Velocity, and Change-of-Direction: A Systematic Review. Sensors 2021, 21, 2623. https://0-doi-org.brum.beds.ac.uk/10.3390/s21082623
Silva R, Rico-González M, Lima R, Akyildiz Z, Pino-Ortega J, Clemente FM. Validity and Reliability of Mobile Applications for Assessing Strength, Power, Velocity, and Change-of-Direction: A Systematic Review. Sensors. 2021; 21(8):2623. https://0-doi-org.brum.beds.ac.uk/10.3390/s21082623
Chicago/Turabian StyleSilva, Rui, Markel Rico-González, Ricardo Lima, Zeki Akyildiz, José Pino-Ortega, and Filipe Manuel Clemente. 2021. "Validity and Reliability of Mobile Applications for Assessing Strength, Power, Velocity, and Change-of-Direction: A Systematic Review" Sensors 21, no. 8: 2623. https://0-doi-org.brum.beds.ac.uk/10.3390/s21082623