3.1. Density
Density (
) was the most measured property in this review, with a total of five studies reporting density measurements of healthy breast and tumour tissue. The study by Johns and Yaffe [
37] is the only one to report data on the density of each tissue considered: glandular, adipose, and tumour. For tumour, they reported density for both IDC and fibroadenoma (benign breast lumps), which are very similar. Hammerstein et al. [
30] reported data on the mammary gland and adipose tissue within the breast. Studies by Woodard and White [
31] and Erdmann and Gos [
24] only gave data on the density of glandular tissue. Finally, the study by Robinson et al. [
57] provided the measured density of fatty breast tissue.
The study by Hammerstein et al. [
30] focused on the determination of radiation doses in mammography, but the densities of tissue found in the breast were also calculated, together with the tissue elemental compositions. A distinction between tissue types in the breast was considered for the data collection. Tissue specimens for both glandular and fatty breast tissue were obtained from mastectomy surgeries. The densities were measured by the water displacement method, where the water displaced by a known mass of tissue was measured to find the volume and, hence, the density. Five glandular and eight adipose samples were measured, and an average measurement for each tissue type was obtained, which are presented in
Table 3 and
Table 4.
Woodard and White [
31] reported the values of density (along with water content and elemental composition) of various human tissues, but in particular of glandular breast tissue. The authors distinguished this tissue as being distinct from the adipose tissue found in the breast, but also that the glandular tissue itself varied in lipid content. The measurements on the glandular tissue were carried out on seven samples derived from postmenopausal women. The densities were calculated from the mass proportions of the components of the tissue (water, lipid, protein, and ash) and the mass densities of each of the components. Since more than five sets of measured data were obtained, the authors categorised the tissue properties into three groups based on the standard deviation of their data. One group contained the averaged measured values
M, while the other two groups considered the standard deviations
for all reported properties and quantities. The three categories considered are therefore mammary gland 1 (
), mammary gland 2 (
M), and mammary gland 3 (
).
The study by Johns and Yaffe [
37] was not directly related to obtaining thermal properties of breast tissue, but rather attenuation measurements when being irradiated with X-rays. The densities of fibrous and fat tissue within the breast along with those of IDC and fibroadenoma are here summarised. Healthy fat and fibrous tissue samples were obtained from 14 patients either undergoing surgery or autopsies. The IDC density was measured from samples obtained from 12 mastectomy or lumpectomy patients, while the fibroadenoma measurements were carried out on samples from two patients who underwent a lumpectomy. For most of the specimens, the tissue was stored frozen for a period of time and then cut into blocks of the required dimensions for the attenuation measurements. Once thawed, attenuation measurements were carried out and the tissue was then refrozen. The density was determined once the tissue had been thawed and excised once again, through measurements of buoyancy in phosphate-buffered saline. The processes of freezing and thawing the tissue samples twice before calculating the density most likely led to some hydration loss and, therefore, the loss of some mass, altering the final density measurement. At least five buoyancy measurements were taken on each tissue specimen and averaged. The overall error for this measurement technique was 7
/
.
The study by Erdmann and Gos [
24] focused on the density of various trunk tissues, which included measurements of glandular breast tissue. Tissue samples were obtained from ten cadavers of both sexes, but the authors did not disclose how many were male or female, nor did they report the number of samples collected per tissue. The tissues obtained from autopsies were stored at 4
. Around three to six hours later, the tissues were placed at room temperature, and after at least one hour, the densities were measured. The weight of each sample was obtained using a laboratory scale of accuracy ±
g, while the volume was obtained by placing the sample in a 25
pycnometer filled with water. Seven measurements of mass and volume were obtained for each sample, where the lowest and highest calculated densities were omitted from the results to obtain an average of the remaining five calculations. A relative error of less than 0.5% was reported for the averaged values.
Robinson et al. [
57] investigated tissue-mimicking phantoms for hyperthermia applications, but also conducted thermal measurements of breast fat and breast tumour tissue. Tissues in this study were obtained from biopsies, and the measurements were conducted on one sample for each tissue type. The sample for breast fat was attached to a fibrosis from a 63-year-old female, which was also measured. The breast adenocarcinoma sample was obtained from a 76-year-old male. The samples were stored at 4
in airtight containers and measured at most 24 h after excision. The tissue density of the breast fat was found using Archimedes’ method of water displacement [
63].
3.3. Thermal Conductivity
There are four studies that provide measurements for the thermal conductivity (
k) of breast tissue and tumour. Gautherie [
32] performed a large-scale study on the thermal conductivity of healthy and tumour tissues, giving values for in vivo and in vitro measurements. Bowman [
35] measured the thermal conductivity of breast tissue and two types of breast cancers (scirrhous and mucinous), but provided no indication of the adipose content of the “normal atrophic tissue”. Valvano et al. [
62] devised a method for measuring the thermal conductivity using a self-heated thermistor. They obtained linear regression models for the thermal conductivity of various tissues including breast adenocarcinoma. Finally, Hamilton’s Ph.D. thesis [
60] reports thermal conductivity measurements of fatty breast tissue using the method devised in [
62].
Gautherie [
32] conducted in vivo and in vitro measurements of the thermal conductivity of breast tissues and breast tumours. The measurements were carried out using fine-needle thermoelectric probes (
in diameter) and a fluvograph on 147 patients. The methods and apparatus were described in a previous paper by the author and colleagues [
67], but a version of this paper could not be found. The in vivo measurements were carried out under local anaesthesia, where a probe was inserted into the tumour within the cancerous breast and another probe was inserted simultaneously into the contralateral healthy breast at approximately the same location. Measurements were taken starting from a maximum depth of
(the length of the needle) and while extracting the needle at intervals of 5
. The in vitro measurements on healthy tissue were taken on postoperative samples from mastectomies or benign growth excisions. The healthy breast tissue was classified into either glandular, fibrous, or fat tissue, depending on the tissue appearance.
The author notes that the differences in the thermal conductivity for in vivo and in vitro samples are due to heat removal from the blood perfusion of in vivo tissue. In healthy tissue, the thermal conductivity is higher in the in vivo scenario by approximately
/
/
. This thermal conductivity increase for in vivo measurements (compared to in vitro values) amounts to a 14.9%, 12.2%, 42.5%, and 82.5% increase for the glandular, fibrous, fatty, and tumour tissue, respectively, as considered in this study. The difference between these values is a function of the blood perfusion levels in the tissue. In fact, tumours require significant perfusion levels to feed their high metabolic demands, which is in line with the significant thermal conductivity changes in perfused vs. unperfused (in vitro) tumour tissue. On the other hand, fibrous tissue is among the least-perfused tissues, which is also represented in the smallest thermal conductivity increase due to perfusion among the analysed tissues, assuming that the connective heat flow is isotropic, as established in mathematical models [
68]. A difference in the blood perfusion of 1500 mL/min/kg gives a change of
/
/
in the thermal conductivity.
While there is a notable difference in the thermal conductivity for in vivo tumour tissue compared to healthy tissue, the measured thermal conductivity for excised tumour compared to excised healthy tissue is not so distinct. An indication of this is the standard deviation, which is presented in
Table 5. The measured thermal conductivity of in vitro tumour tissue ranged from approximately 0.10 to
/
/
within the study. This clearly shows the thermal conductivity dependence on perfusion status, hinting that the measurement of the other physical properties is also dependent on blood perfusion.
The study carried out by Bowman [
35] presents measured values of the thermal conductivities of various tissues, specifically breast tissue and breast tumours. The fat content of the healthy tissue was not distinguished, and there was no mention of the samples being fibroglandular or fatty in nature. The measurement for breast tissue was obtained from one in vitro sample at 37
. The study also includes the thermal conductivity of scirrhous and mucinous (colloid) breast carcinomas, together with tumours in other organs/sites. The thermal conductivities for all tumours measured in this study (not just breast tumours) were all higher than those of the adjacent healthy tissues considered, except for the scirrhous carcinoma in the breast and colonic carcinoma.
The measurement method for these results is not discussed in the paper. However, the study does mention the thermal diffusion probe, which is capable of measuring the thermal conductivity together with the temperature, thermal diffusivity, and perfusion of tissues. There is no specific mention that the thermal diffusion probe was used to measure the thermal properties of human tissue, but the author describes the thermal diffusion probe method in relation to other canine and rat thermal conductivity measurements against time, within the same paper.
The study by Valvano et al. [
62] tackles the temperature dependence of the thermal conductivity. The authors describe a self-heated thermistor probe method of measuring the thermal conductivity simultaneously with the thermal diffusivity. Through this method, they obtained linear regression models for these properties of various animal and human tissues. Of interest to this review are the data on the thermal conductivity of breast adenocarcinoma.
Three samples of adenocarcinoma were obtained from biopsies, on which a total of 100 measurements were conducted within 24 h from excision. The thermal conductivity was measured at temperatures of 3, 10, 17, 23, 30, 37, and 45
. From these measurements, a linear model of the thermal conductivity as a function of temperature was obtained:
where
k is the thermal conductivity (W/m/K) and
T (
) is the temperature.
and
are the coefficients obtained through the linear regression fit and are equal to
/
/
and
/
/
/
, respectively. The correlation coefficient for the linear regression was found to be 0.60. Temperatures
T of 37
and 42
were considered to obtain the thermal conductivity at a baseline and mid-hyperthermic temperatures, which are reported in
Table 5.
Measurements were conducted using a method devised by the authors. First, a spherical thermistor probe is inserted into the tissue, and a baseline temperature
is measured using the thermistor in passive mode. Then, a voltage
is applied such that the temperature at the probe increases by around 4
. This new temperature
is kept constant for 20
by varying the voltage and, hence, the power
. The power at a time
t during heating is calculated through the equation:
where
R is the resistance of the feedback circuit used to heat the thermistor. The voltage is measured at intervals of
, and hence,
can be evaluated using Equation (
9). This power is characterised as
where
P and
S are the steady-state term and the transient term, respectively. These terms can be found from a plot of the power
against
in the interval where the elevated temperature
is kept constant. The thermal conductivity
k can then be found through the equation:
where
and
A and
B are constants obtained through the calibration of the probe on solutions of well-known thermal conductivities.
In Hamilton’s thesis [
60], measurements of the thermal conductivity (and water content) of breast fat samples were obtained. A total of 22 samples were obtained from three patients. Two of these samples were obtained through surgery on two patients, whilst the other 20 samples were obtained from a postmortem autopsy on one patient. Ten measurements were performed on each sample for a total of 220 measurements. The average thermal conductivity for human breast fat was found to be
/
/
, with a minimum measurement of
/
/
and a maximum of
/
/
. The measurements were conducted using the same method in Valvano et al. [
62].
As with the specific heat capacity, the thermal conductivity,
k, of tissues can also be approximated using the water content. The equation by Cooper and Trezek [
64] cited by Duck [
23] gives such a relation for the thermal conductivity of tissue:
where
W (%) is the water content of the tissue. This relation is also referred to in the IT’IS database, where the thermal conductivity of glandular breast tissue is calculated using the average water content reported in [
31] of 51.4%.
Another equation for estimating the thermal conductivity is given by Poppendiek et al. [
25] in Duck [
23], where the equation uses the properties of the components of the tissue. The three components considered are fat, protein, and water, and the thermal conductivity is estimated by:
where
is the mass fraction,
is the thermal conductivity,
is the density of the
component of the tissue, and
is the density of the tissue as a whole.
Note on Effective Thermal Conductivity
The aforementioned measurement studies involve both in vivo and in vitro measurements of the thermal conductivity. However, an important distinction should be made for these two scenarios. The in vivo measurements by Gautherie [
32] are referred to as “effective” thermal conductivities, where the blood perfusion of the tumour influences these measurements. In in vivo scenarios, heat is transported by convection through the capillary vessels while using the thermoelectric probe. This heat removal through blood perfusion allows for an increase in energy deposition within the same volume of tissue when conducting in vivo measurements, compared to the allowed energy deposition in in vitro measurements. In fact, the mean in vitro measurements presented by Gautherie [
32] are significantly lower than the reported in vivo values. On in vitro samples, the thermal conductivity is measured according to Fourier’s law, where the heat transport due to convection within the blood vessels does not influence the measurements. These in vitro measurements are referred to as “intrinsic” thermal conductivities by Bowman [
35].
3.5. Blood Perfusion
The blood perfusion term in the BHE is a major heat sink that counteracts the external heating during hyperthermia treatments. This review found four studies, Johnson [
53], Beaney [
55], Wilson et al. [
56], and Mankoff et al. [
59], that measured the blood perfusion rates of healthy and cancerous breast tissue. In each case, the fibroglandular or fat content in the healthy tissue was not specified, but the measurements on healthy breast tissue were listed as fatty breast tissue properties in
Table 4. Johnson [
53] conducted measurements using a thermal approach, while the other three studies were conducted using positron emission tomography (PET) imaging on breast cancer patients. Each study gives the measured blood perfusion rates in different units of measurement, which have been converted to units of
/
/
for comparison, as explained in
Section 2.
Johnson [
53] conducted blood perfusion measurements on in vivo patients using a thermodynamic approach to compare the blood perfusion of tumours before and after radiotherapy. This early study involved blood perfusion measurements on various human tumours, including measurements of healthy and cancerous breast tissue for two patients. The apparatus consisted of a copper heat sink placed over the tissue, which was kept at various temperatures ranging from hypothermic to hyperthermic through a water circulator and measured using a thermistor. A heat flow sensor was placed between the copper plate and the patient’s skin. The heat flux, surface skin temperature, and patient’s internal temperature were monitored until thermal equilibrium was reached, after which these three quantities were recorded over 10
.
The paper reports blood perfusion measurements for two patients, but only the data for one patient could be extracted. The measurement data within the paper are given through plots of blood perfusion over a number of measurement days before and after radiotherapy. The blood perfusion in the paper is defined as
, where
Q is the heat flux,
is the patient’s oral temperature,
is the skin surface temperature, and
K is undefined. The heat flux units vary within the paper itself, initially stating that it was recorded in
, but the heat flux disk was calibrated in units of bthu/in
2/
/
. Furthermore, the plots of blood perfusion are only labelled in symbol form as
, where
a is undefined. These conflicting units of measurement make it impossible to extract data from these plots with any certainty. The data reported in
Table 4 and
Table 5 were obtained from subsequent plots within the paper where the measurements were converted to units of mL/
/
using an estimation program referenced in the study, but unavailable online. The data from the plots were extracted using the GetData Graph Digitizer [
71] and converted to SI units using the conversion presented in
Table 1 and the appropriate quantities given in
Table 2. The data extracted from the graph digitiser resulted in blood perfusion rates of
mL/g/min and
mL/g/min for healthy and cancerous breast tissue, respectively, for measurements conducted before radiotherapy. This study showed a clear increase in the blood perfusion through breast tumour tissue compared to healthy breast tissue. The perfusion values were converted to the SI units used in this review through the appropriate conversion in
Table 1 and the densities of fatty breast and tumour tissue presented in
Table 2, which resulted in
/
/
and
/
/
for healthy and cancerous breast tissue, respectively.
Beaney [
55] conducted in vivo blood perfusion measurements using PET scans. Imaging was performed on ten patients whose ages ranged from 52 to 74 years using an ECAT II PET scanner, according to an earlier study, which reported more detail on the measurements, but with information on nine out of the ten patients [
72]. For each patient, the blood perfusion was measured for both tumour and normal breast tissue. The mean blood perfusion of tumour tissue was 18.78 ± 9.67 mL/100 mL/min (or 3.307 ± 1.662
/
/
). For healthy tissue, a mean blood perfusion of 4.00 ± 0.90 mL/ 100 mL/min (or 0.700 ± 0.157
/
/
) was obtained. The blood perfusion in healthy tissues was obtained by measuring perfusion in the healthy contralateral breast. Although the average tumour blood perfusion was higher than that of healthy breast tissue, the tumour blood perfusion measurements ranged from 7.76 to 31.40 mL/100 mL/min (or 1.358–
/
/
) according to the earlier published paper [
72]. The lower value for the blood perfusion of tumour tissue was still higher than the highest measured healthy breast blood perfusion, which ranged from 2.74 to 5.66 mL/100 mL/min (or 0.479–
/
/
).
Wilson et al. [
56] performed blood perfusion measurements on breast tumours and healthy tissue. The measurements were conducted on a total of 20 patients where the ages varied from 35 to 77. Each patient was diagnosed with IDC, except for a male patient, who was diagnosed with lobular carcinoma of the breast. The patients had lesions of different stages and were undergoing either no treatment, hormone therapy, chemotherapy, or radiotherapy at the time of study.
The blood perfusion measurements were conducted using an ECAT 931-08/12 PET scanner. The blood perfusion of tumour tissue was significantly larger than that of healthy tissue, as can be seen from the results presented in
Table 4 and
Table 5. The average blood perfusion for tumour tissue was 29.8 ±
mL/min/dL (or 5.214 ±
/
/
), whilst that of healthy tissue was 5.6 ±
mL/min/dL (or 0.980 ±
/
/
). The measured blood perfusion of the tumour tissue ranged from 11.3 to 76.8 mL/
/dL (or 1.977 to
/
/
), and no association could be made between the perfusion and tumour size. However, it was noted that three of the patients who developed rapid progressive and metastatic disease and died within three months of the study had the highest measured tumour blood perfusion.
Mankoff et al. [
59] also measured the blood perfusion rate of healthy and cancerous breast tissue. The measurements using PET imaging were carried out on 37 patients with newly diagnosed locally advanced breast cancer.
18F−FDG and
15O−water tracers were used in the imaging of tumours ranging from 1.9 to 11.0
. The study gives an average blood perfusion of 60 mL/min/kg (or
/
/
) for healthy tissue and 320 mL/min/kg (or
/
/
) for tumour tissue. Although there is a notable difference between these two values, the blood perfusion of tumour tissue varies greatly and the measurements within the study overlap those of healthy tissue.
Despite the different values between these three PET measurement studies, they all share a similar blood perfusion ratio between tumours and healthy breast tissue: 4.7 for Beaney [
55] and 5.3 for both Wilson et al. [
56] and Mankoff et al. [
59].
3.6. Non-Measured Studies
In this section, we summarise the modelling studies that used Non-Measured values of the thermal and physiological properties of breast tissues in their simulations. In these references, the authors estimated the thermophysical properties due to lack or difficult access to experimental measured data. Instead, they used approximations based on tissues with a similar tissue composition. Furthermore, most authors quote values from other sources, which, in turn, retrieve their properties from another source. Following this trail of references, some properties were in fact from measurement studies, but other values were misquoted or taken from sources pertaining to tissues that were not breast. As for breast tumour tissues, when measured values were not available, the thermal properties were sometimes assumed to be the same as those of glandular tissue or from generic tumour measurements from other sites.
The study by Ng et al. [
39] focused on the numerical modelling of a female breast with a tumour. The model consisted of a three-dimensional hemisphere with an outer skin layer with a subcutaneous fat layer. The majority of the breast was modelled as glandular tissue, with a layer of muscle to mimic the chest wall and the tumour inserted in the glandular tissue. The parameters given for the tissue used were density, thermal conductivity, metabolic heat generation rate, and blood perfusion coefficient. The densities were kept the same for each tissue at 1080
/
. Most of the thermal properties were obtained from approximations from Werner et al. [
51]. The thermal conductivity of breast glandular tissue was possibly obtained from that of the thyroid gland. While this was not explicitly stated and there were multiple tissues with the same thermal conductivity in Werner et al., the thyroid gland is the closest possible tissue reported. Ng et al. also used the same thermal conductivity for tumour tissue as that of glandular. The remaining properties of glandular tissue were approximated from those of muscle tissue, whilst the data for the subcutaneous fat were obtained from generic fat measurements.
The referenced study by Werner et al. reports values for the basal metabolic heat production in units of
while giving the respective volumes for the tissue. The metabolic heat production of glandular tissue can be calculated from these values of muscle, with a basal metabolic heat production of
and volume of 27,338
. For fat, a basal metabolic heat production of
for a volume of 10,153
. was listed. Dividing the basal metabolic heat production by the volume gives approximate values for the metabolic heat production of 700
/
for muscle and 400
/
for fat. These are the values noted in [
39] for glandular tissue and fat, respectively.
For the blood perfusion coefficient of glandular and fat tissue, the authors also considered values from [
51], possibly obtained from the values for muscle and fat (the authors did not specify). These quantities were then converted using Equation (
2) and the specific heat capacity of blood in
Table 2 to obtain the quoted values in units of
/
/
.
Tumour tissue properties, specifically the metabolic heat generation rate and blood perfusion coefficient, were obtained from a study by Gautherie [
32]. The metabolic heat production for various tumour sizes can be calculated from the tumour diameter, as discussed in
Section 3.4, while the blood perfusion coefficient was estimated from observations by Gautherie, [
32], Priebe [
68], and Vaupel et al. [
73].
The study by Ekstrand et al. [
54] considered a basic model of a human breast with a tumour to determine whether the tumour is preferentially heated during ablation. The breast model consisted of a sphere with fat properties with an embedded ellipsoidal tumour. The densities and specific heat capacities were gathered from sources that report the properties for generic fat tissue and tumour (not in the breast) [
51,
74]. However, the thermal conductivities were obtained from a 1975 study by Gautherie et al. [
69]. A copy of this earlier study by Gautherie could not be found, but the quoted values are the same as the in vitro measurements presented in the Gautherie’s 1980 study [
32], where the experimental data are included and discussed in this review.
He et al. [
43] considered a model of mostly glandular tissue with an embedded tumour and a layer of subcutaneous fat encasing the glandular tissue. According to the citations in the study, the thermophysical properties were obtained from [
39,
75,
76,
77]. However, the values given for fat do not match other values given in the sources. Possibly, the authors obtained an average from some or all sources. The thermophysical properties of tumour tissue from this study are included in this review in
Table 6. However, the tumour properties in this study are identical to the ones given for glandular tissue, which, in turn, are directly quoted in Chanmugam et al. [
41]. Hence, they are not listed in
Table 3. The study by Chanmugam et al. is included in the tables given in
Section 3 as more information about the thermal properties of glandular tissue is included and will be discussed in this current section.
The study by Converse et al. [
36] considered an anatomically realistic breast model, where the dielectric properties of the tissue varied depending on the fat content of the breast. However, the same approach was not adopted for the thermal properties, and the healthy breast tissues were given the same thermophysical properties regardless of fat content. Since the thermal properties of breast tissue in this study were used as the properties of fatty breast tissues in later studies [
47,
48,
49], the properties from Converse et al. are included in
Table 4 representing fatty breast tissues and not in the fibroglandular breast properties table. The authors listed 18 sources as the references for the thermal properties. As such, it is not possible to distinguish the exact sources for each individual tissue, and most likely, an average was obtained. The 18 sources include studies on the thermal properties of breast (with no distinction between fatty or fibroglandular tissue), muscle, fat, skin, and tumour.
The model used in the study by González [
33] consisted of a hemisphere of breast tissue with an embedded spherical tumour. A layer of muscle below the breast hemisphere was added to mimic the chest wall. The density and heat capacity were the same for both normal breast tissue and tumour. The study considered the breast hemisphere of radius 9
so that the study mimicked an example presented by Gautherie et al. [
32]. The thermal conductivity (used for both glandular and tumour tissue) and the metabolic heat generation rate of the tumour were the exact values as calculated in the Gautherie study for this specific example. There is no reference given for the density, specific heat capacity, and blood perfusion rates for healthy and cancerous tissue.
Bakker et al. [
46] investigated ultrasound hyperthermia applied to the breast, where they assigned thermal properties to breast, fat, and tumour tissues. Simulations were carried out on a breast anatomical model based on an MRI scan. This model depicted a breast with a background of fat and breast tissue within that fat. There was no indication that this breast tissue is glandular, but they referred to the tissue as breast tissue. The only traceable values in this study are the thermal conductivity of breast tissue and the density and thermal conductivity of fat tissue. The thermal conductivity of breast tissue can be traced back to the measured value of Bowman [
35]. The density and thermal conductivity of fat can be traced back to that of generic adipose tissue from Woodard and White [
31] and Lang et al. [
78], respectively. It is worth noting that although the reference trail leads to [
78], the value for the thermal conductivity in the primary source is that of
/
/
, whilst that given in Bakker et al. is
/
/
.
The density of breast tissue and the specific heat capacity and thermal conductivity of tumour tissue can be traced back to Sohrab et al. [
79]. These values were cited from a Ph.D. thesis not available digitally. The remaining properties, i.e., the specific heat capacity of fibroglandular breast and breast fat, the tumour density, and the blood perfusion rates for the three tissues considered, do not match the quantities given in Sohrab et al. Since this was the only reference given in Bakker et al., the sources for these properties could not be traced. However, for comparison in this review, the blood perfusion rates were converted into the SI units using the conversion in
Table 1 together with the tissue densities provided by the authors and the blood density in
Table 2.
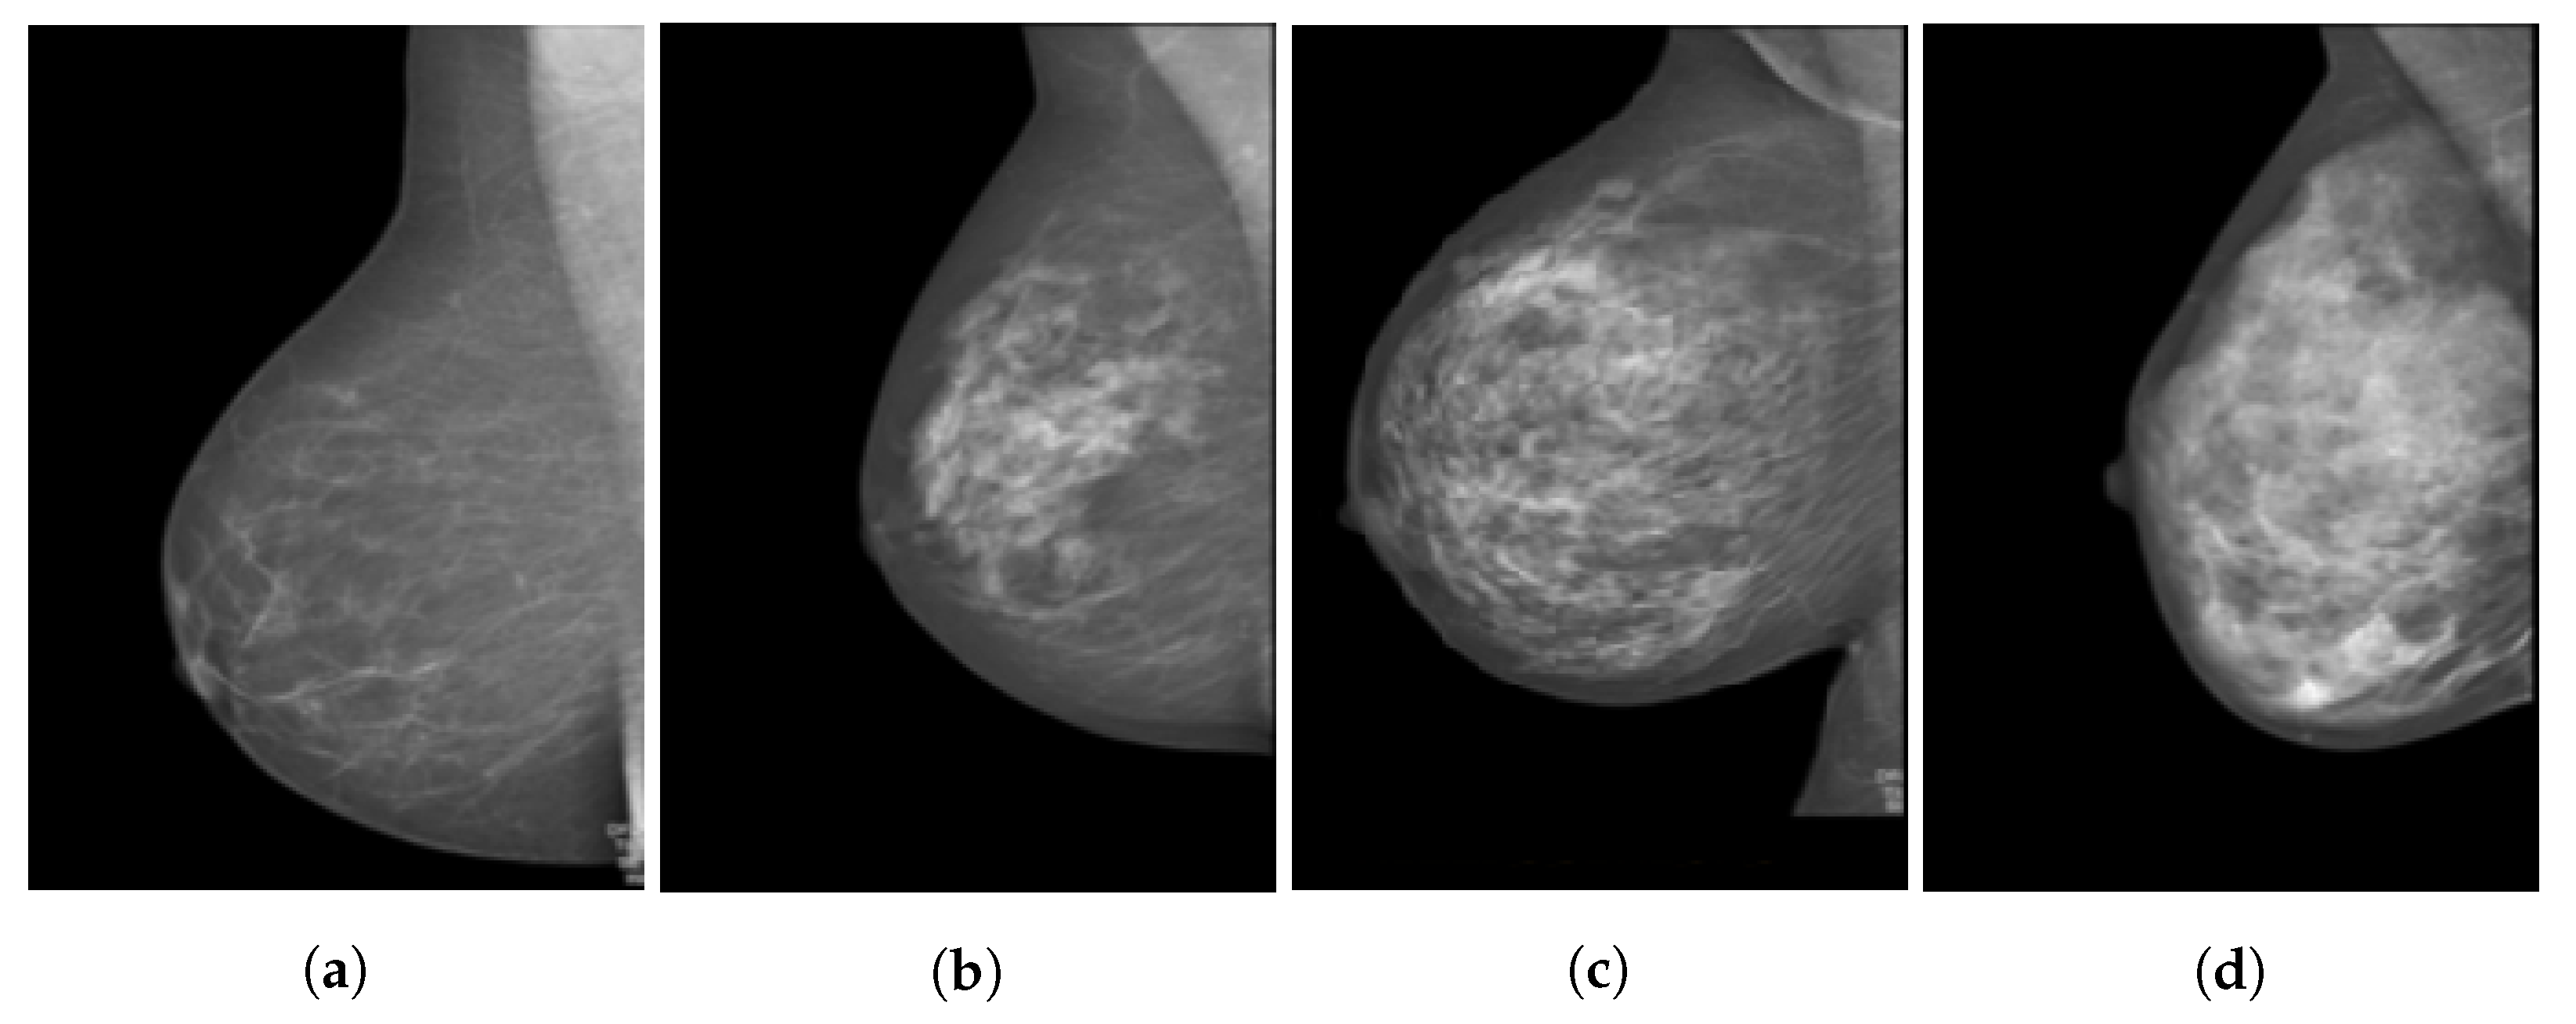
Zastrow et al. [
47] present a computational study of microwave hyperthermia for breast cancer, which included patient-specific breast models. The four models considered range from mostly fatty tissue to denser models of mostly glandular tissue, which are based on MRIs such as those in
Figure 2. The thermal properties of fibroglandular tissue were assumed to be the same as those for muscle tissue and were taken from [
52], a study that considered muscle tissue found in the head and eye. Throughout the study, the tumour was embedded in the fibroglandular tissue, and no dielectric or thermal contrast was considered. The thermal properties of fatty breast tissue and skin were quoted directly from [
36] and are therefore not repeated in
Table 4.
Jiang et al. [
34] considered a hemispherical model made of skin, subcutaneous fat, and two glandular tissues called
core gland and
sub gland. However, there was no distinction made between the thermal properties of the different types of glandular tissue, with the tissues being listed as glandular, fat, skin, and tumour. The authors referenced the thermal conductivity, metabolic heat generation rate, and blood perfusion coefficient to those from in vivo measurements by Gautherie [
32], but the only specific values presented in [
32] relate to the thermal conductivity of breast and tumour tissues. Furthermore, the value given for the in vivo measurements of the thermal conductivity of glandular breast tissue in Gautherie’s work is
/
/
, and not
/
/
, as reported by Jiang et al. The thermal conductivity of the fat tissue within this study was assumed to be anisotropic, where the values varied with the orientation of the tissue with respect to the axes considered. As for the metabolic heat generation rate and the blood perfusion coefficient in Jiang et al., there is also no specific mention of these quantities in Gautherie’s 1980 work [
32]. However, Jiang et al. considered the same calculations as Ng et al. [
39], where the metabolic heat was determined from tumour diameter. Although not directly stated, it seems the blood perfusion coefficients for glandular tissue, fat, and tumour were obtained from this study by Ng et al. The blood perfusion coefficients were converted to the blood perfusion rates using Equation (
2) and the specific heat capacity of blood presented in
Table 2.
Chanmugam et al. [
41] considered a model where the large part of the breast was made of glandular tissue, with a subcutaneous fat layer and a muscle layer below the gland in lieu of the chest wall. The tumour was embedded in the glandular tissue. For both glandular and fat tissues, the thermal conductivity and metabolic heat generation rate were cited from Ng et al. [
39]; the densities and specific heat capacities can also be traced back to Ng et al. However, in Chanmugam et al., these latter values are slightly different than the ones listed in the cited study. The blood perfusion rate values reported are also similar, but not exactly the same as those in Ng et al. For tumour tissue, the density and thermal conductivity can be traced back to Ng et al., whereas the specific heat capacity was quoted from that of a skin lesion in Çetingül et al. [
80]. The metabolic heat generation rate was retrieved from the minimum value provided by Jiang et al. [
34], who, in turn, used the tumour diameter and equations reported in Ng et al. [
39] to obtain the metabolic heat generation rate, as discussed in
Section 3.4.
The study by Singh et al. [
61] considered a computational breast model for ablation research. The breast model was made of mostly fatty breast tissue, with a tumour embedded within the fat. The density, specific heat capacity, thermal conductivity, and metabolic heat generation rate of both fat and tumour tissues were obtained from sources already listed and discussed in this review [
39,
40,
54,
69]. The tumour metabolic heat generation rate was obtained from the equations given in Ng et al. [
39] while considering a tumour diameter of
. The blood perfusion rates for both fat and tumour given in this study have not been discussed in this review yet. Two levels of perfusion were assigned to both fat and tumour tissue: highly perfused tissue and moderately perfused tissue. The values for highly perfused healthy and tumour tissue were obtained from Mankoff et al. [
59], whilst those for moderately perfused healthy and tumour tissue were obtained from Fujita et al. [
81]. In the former study, the blood perfusion measurements were carried out using PET imaging of cancerous breast tissue (discussed in
Section 3.5), while Fujita et al. [
81] measured the blood perfusion of the healthy abdomen and tumour within the abdomen (the specific tissue was not specified). The values presented in
Table 4 and
Table 5 are converted to the SI units from the original study’s units of /
by multiplying them with the tissue densities as specified by the study.
However, the blood perfusion values used by Singh et al. do not make physical sense. Firstly, moderately perfused breast fat is assigned a higher perfusion rate than highly perfused breast fat. Secondly, the tumour perfusion values for moderately and highly perfused tumours are 0.530 and //, respectively, which are outside the reported tumour values by Mankoff et al. (1.89– //). The same holds for breast tissues, where Singh et al. reported values of 8.80 and // for moderately and highly perfused tissue, respectively, while the measured range by Mankoff et al. is 0.46– //.
3.7. Summary
Density is the easiest property to measure, leading to more measurements being available on breast density. The distinction between glandular and fatty tissue within the breast was made in each study. However, some measurement conditions might have resulted in undesirable errors. For instance, in the study by Johns and Yaffe [
37], the tissue samples underwent two freezing and thawing processes before the densities were measured. Similarly, in Erdmann and Gos [
24], the samples were kept at 4
before bringing them up to room temperature and then measuring the density. There were no indications on how long the samples had been left out before being measured. In some instances, the samples were even obtained from autopsies [
24,
37]. These factors all contribute to alterations in the water content of the samples and, hence, introduce an unpredictable error within the measured density. Different methodologies were used to measure the densities. The water displacement method was used in [
30,
57]. The buoyancy of the samples was used to calculate the densities in [
37], whereas a pycnometer was used in [
24]. Finally, the density of the components of the tissue, together with the mass proportions of the components within the tissue were used in [
31].
Only one measured source was found for the specific heat capacity, which is Robinson et al. [
57]. The authors presented measurements of breast fat, adenocarcinoma, and benign fibrosis. Only two breast fat samples and one sample of adenocarcinoma and fibrosis were included in this study.
Four studies measured the thermal conductivity of breast tissue and tumour. The most thorough is the one by Gautherie [
32], where the author performed measurements on a total of 147 patients in the measurement campaign. The measurements were conducted both in vivo and in vitro, using a thermoelectric probe, while also considering the tissue composition of glandular, fibrous, fat, or tumour tissue. Bowman [
35] also measured the thermal conductivity of healthy breast tissue, scirrhous carcinoma, and mucinous carcinoma. However, the measurement method was not described and the fat content in the sample of breast tissue was not specified. Valvano et al. [
62] describes a method for measuring the thermal conductivity and thermal diffusivity of tissues simultaneously using a self-heating thermistor probe. The method was used to obtain a linear regression model of the thermal conductivity of adenocarcinoma samples as a function of temperature. Three samples were obtained from biopsies, and a total of 100 measurements were conducted not more than 24 h after excision. Finally, Hamilton [
60] measured the thermal conductivity of breast fat in his thesis from 22 samples. Although this was quite a large sample size, 20 of these samples were obtained from an autopsy of one patient. The author used the same self-heated thermistor probe method as Valvano et al. [
62].
Although this review could not find any direct measurement data of the metabolic heat generation rate of breast tissue, those of breast tumour tissue were studied by Gautherie [
32]. This study clearly shows an inverse relation between the metabolic heat generation rate and the tumour volume doubling time. Ng et al. [
39] also referred to this relation and used an equation relating the doubling time to the tumour diameter, while citing an earlier paper by Gautherie. Thus, most modelling studies used these equations to calculate the metabolic heat generation rate depending on the tumour size considered in their model.
The blood perfusion rate in the BHE is the only heat sink term. Heat is transferred by convection through the blood vessels in the tissue. Particularly in tumours, the chaotic and hypoxic environment makes the blood perfusion a complex system. Four studies in this review measure the blood perfusion through healthy and cancerous breast tissues using a thermal approach and PET imaging. In each study, the tumour blood perfusion was significantly higher than that of healthy tissue. While the study by Johnson [
53] used a thermal approach to measure the blood perfusion rate, the measurement method proved unreliable. The remaining three studies conducted using PET imaging all have similar healthy to cancerous blood perfusion ratios. However, a large range of values for the measured tumour blood perfusions were observed in the three studies, where tumour blood perfusion measurements were not always higher than those of healthy breast tissue. Furthermore, Wilson et al. [
56] noted that there could be no association made between blood perfusion and tumour size within their study.
Due to the lack of measurement data available, more recent thermal studies approximated the values for the thermal and physiological properties with those of other well-measured tissues. Glandular tissue properties were most often approximated from those of muscle tissue or thyroid gland, while fatty breast tissue properties were approximated from those of generic fat. In many cases, authors refer to a previous study in which an approximation has been made, who refer to another previous study, and so on. These trails lead to properties being approximated from values in eye muscle, such as in Zastrow et al. [
47]. Another example is in Chanmugam et al. [
41], where the tumour properties can be traced back to those of a skin lesion in [
80]. Studies such as Converse et al. [
36] provided too many references for all tissues used in the thermal model, without detailing how each individual property was obtained. This can be either difficult or impossible to trace back to the primary source of information. In such a case, the most likely scenario is that an average of the cited values was considered.
Certain studies also approximate some of the glandular and tumour properties to be the same. This can be seen in studies [
33,
39,
41,
43,
46,
47]. This may prove to be useful in thermal studies where the aim is to investigate the focusing ability of a hyperthermia system without relying on a thermal contrast already present. However, such approximations might provide unreliable results when considering preclinical scenarios and hyperthermia planning, especially considering the contrasting values presented in this review.
To summarise the data from this review,
Table 7 presents the minimum and maximum values for each property of the fibroglandular breast, fatty breast, and breast tumour tissues. A general pattern emerges where the thermal and physiological properties of fat tissue are the lowest, tumour tissue properties are the highest, and fibroglandular properties lie in between for each of the five properties. However, there is an overlap of data, especially when comparing the thermal properties of fibroglandular and fatty breast tissue. This overlap arises from the heterogeneity of the breast tissue, where some studies such as González [
33], Converse et al. [
36], and Bakker et al. [
46] do not consider the adipose content within the breast, but only consider breast tissue as a whole.
A notable difference can be seen in the ranges of the metabolic heat generation rate and blood perfusion rate of tumour tissue when compared to healthy breast tissue. The metabolic heat generation rate of tumour tissue was most often calculated from Equations (
14) and (
15). The lowest value of 690
/
is derived from Zastrow et al. [
47], where the authors considered the properties of tumour tissue to be the same as those of glandular breast tissue. The range of the tumour blood perfusion rate is also much larger than those of fibroglandular and fat breast tissue. This is possibly due to the increased vascularisation via angiogenesis typical of tumours, which presents a chaotic system of new blood vessels that supply the tumour with oxygen [
82].
While this review found tumour blood perfusion to be significantly higher than that of healthy tissue, this might not portray the reality. The vascularisation within a tumour changes as the tumour grows. The initial vascular system of the tumour can become compressed when the tumour starts to grow. This causes a reduction in the supply of oxygen and nutrients to the tumour, leading to a hypoxic environment, which is common in larger tumours that present a necrotic centre. Neovascularisation, the formation of new blood vessels, occurs within the tumour from pre-existing vessels or from the surrounding vessels within the healthy tissue. The efficiency of these new microvessels depends on how quickly they are formed, with rapidly growing tumours forming less structurally sound systems. As a result, the tumour blood perfusion may be more complex than the appearance of the tumour vascular system [
83].
The blood perfusion rates of human tumours do not necessarily decrease with increasing tumour size [
83]. Furthermore, a study by Shibata [
84] found that areas surrounding the tumours have higher perfusion rates than the central tumour. The same study reported that the ratio of blood perfusion within healthy tissue to tumour tissue (not breast tumours) ranged from 3:1 to 30:1, implying that tumour blood perfusion may actually be lower than normal tissue blood perfusion. An overlap within healthy and tumour tissue blood perfusion was also seen in the data from this review, as shown in the data ranges presented in
Table 7. The tumour blood perfusion also varies depending on the functional state of the breast tissue. The tumour within post-menopausal breast is substantially lower than the tumour within a lactating breast [
83].


 ,
, 


