
Real-Time Monitoring of SO2 Emissions Using a UV Camera with Built-in NO2 and Aerosol Corrections


1
State Key Laboratory of Magnetic Resonance and Atomic and Molecular Physics, Innovation Academy for Precision Measurement Science and Technology, Chinese Academy of Sciences, Wuhan 430071, China
2
University of Chinese Academy of Sciences, Beijing 100049, China
3
School of Opto-Electronic Information Science and Technology, Yantai University, Yantai 264005, China
*
Author to whom correspondence should be addressed.
Sensors 2022, 22(10), 3900; https://0-doi-org.brum.beds.ac.uk/10.3390/s22103900
Submission received: 12 April 2022
/
Revised: 12 May 2022
/
Accepted: 19 May 2022
/
Published: 20 May 2022
(This article belongs to the Special Issue Optical Sensing for Environmental Monitoring)
Abstract
:Nitrogen dioxide (NO2) absorption correction of the sulfur dioxide (SO2) camera was demonstrated for the first time. The key to improving the measurement accuracy is to combine a differential optical absorption spectroscopy (DOAS) instrument with the SO2 camera for the real-time NO2 absorption correction and aerosol scattering correction. This method performs NO2 absorption correction by the correlation between the NO2 column density measurement of the DOAS and the NO2 optical depth of the corresponding channel from the SO2 camera at a narrow wavelength window around 310 and 310 nm. The error of correction method is estimated through comparison with only using the second channel of the traditional SO2 camera to correct for aerosol scattering and it can be reduced by 11.3% after NO2 absorption corrections. We validate the correction method through experiments and demonstrate it to be of greatly improved accuracy. The result shows that the ultraviolet (UV) SO2 camera system with NO2 absorption corrections appears to have great application prospects as a technology for visualized real-time monitoring of SO2 emissions.
1. Introduction
Emissions of polluting gases from industries and ships have brought severe air pollution, particularly in developed and coastal areas. Atmospheric pollutants from industries and ships are mainly generated from fuel combustion. The main product of combustion includes sulfur dioxide (SO2), nitrogen dioxide (NO2), carbon dioxide (CO2), and particles [1,2,3]. SO2 is of special importance and interest. As a toxic gas, SO2 is responsible for many deleterious effects on human health, the environment, and the climate. SO2 emissions contribute to the formation of sulfate aerosols and small particles, which may penetrate deeply into the lungs, and, in sufficient quantity, can contribute to health problems. Increased SO2 in the Earth’s atmosphere can alter the radiation balance by intercepting scattered light. However, its far distance and low concentration make SO2 emissions difficult to measure by using the existing techniques.
The existing optical techniques for SO2 concentration measurements are an effective tool for high concentrations or fixed sources or near distances. Raman scattering lidar and differential absorption lidar are active detection methods [4,5] that can realize stereoscopic detection of pollutant space and have distance resolution capability. However, their spatial resolution is low and cannot meet the requirements of portable and mobile applications. For the sake of portability and engineering, passive detection methods have emerged. Fourier transform infrared spectroscopy and Fourier function analysis are characterized by multi-component analysis, wide measurement range, and fast analysis speed [6,7,8]. Differential optical absorption spectroscopy (DOAS) provides fast response and real-time monitoring to characterize and obtain data [9,10,11]. Recent advancements in spectroscopic techniques allow remote analysis of many species. Non-imaging measurement techniques allow us to measure the total column density of the trace gas along a single direction within the plume. Imaging DOAS (I-DOAS) combines the advantages of DOAS with imaging capabilities [12,13]. This technique allows the spectroscopic measurement of 2D pollutant gas distributions and improves the accuracy of quantitative measurement. A drawback of scanning DOAS systems is a relatively long time to acquire a 2D image of the trace gas distribution.
The development of remote sensing techniques based on a novel ultraviolet (UV) SO2 camera system [14] for trace gas measurement has emerged. The SO2 camera is increasingly used in SO2 emission due to its ability to remotely measure the 2D distribution of SO2 path concentrations in space and the emission rate over time in real-time. The measurement of 2D SO2 distribution in volcanic plumes has been realized by using a single UV camera. UV cameras have been increasingly established [15,16]. The University of Heidelberg discussed the theoretical basis of UV cameras and calibration issues, including the measurement principle, data evaluation, and solar zenith angle [17]. They used the 3D backward Monte Carlo radiative transfer model to describe the spectral radiance transmitted through the filter [18]. Christoph Kern et al. used seven different UV cameras and four different filters to continuously monitor the volcanic plumes in real-time [19]. Osorio, M et al. proposed a new two-image method (2-IM) to acquire background images and quantify SO2 emissions from industrial sources [20]. However, UV cameras are mostly used to measure higher concentrations of SO2 emissions from volcanic sources. Few measurements of emissions with low concentrations from industries and ships have been performed with UV cameras. Some persistent problems may arise when UV camera systems are used to measure the SO2 emissions of industrial and ship sources.
UV SO2 cameras are used to measure the SO2 absorption in a narrow wavelength (310 nm), and the effect of aerosol scattering can be partially corrected by measuring the weak absorption of SO2 around 330 nm. The measured signal is the integral intensity of the incident spectrum over the filter transmittance window. SO2 cameras are certainly limited by the fact that only one trace gas can be measured and the other spectral interferences and the effect of aerosol scattering on the particulate matter can potentially lead to an inaccurate measurement.
This work aims to correct NO2 absorption for real-time measurement of SO2 emissions with UV cameras. This proposed method performs NO2 absorption correction by the correlation between the NO2 column density measurement of the DOAS and the NO2 optical depth of the corresponding channel from the SO2 camera at a narrow wavelength window around 310 and 310 nm. Theoretical simulation analysis shows that different NO2 column densities have a relatively large influence on the error of SO2 column density measured by the UV camera. In this paper, we briefly described the theoretical basis for pertinent aspects of spectral consideration. The basic principles of UV SO2 camera methodology and the simulation of error analysis are described. The main experimental results are obtained from a plant in Wuhan. In order to further enhance the measurement accuracy, the Mie scattering corrections are made. The following discusses the measurement uncertainty of SO2 column density. Then, we show the SO2 error on NO2 absorption corrections.
2. Spectral Consideration
When scattered solar radiation passes through industrial and ship emission plumes, light is scattered and absorbed along the path. This condition is caused by absorption within the band due to other gases (such as NO2, O3), scattering of particles, and multiple scattering. In the UV region, the O3 absorption [blue line in Figure 1a] blocks part of the scattered solar spectra and the UV cannot break through the ozone at a wavelength shorter than 300 nm. In Figure 1a (red line), the relative scattered solar spectral intensity reaches the ground at a spectral resolution of 0.1 nm, which is calculated on MODTRAN [21]. The UV cameras are used to measure the SO2 emissions in a narrow wavelength band centered at 310 nm, which is the region of the scattered solar spectral intensity with an increasing magnitude as the wavelength increases. The spectral interference from other major emission products (such as NO2) should be considered for measuring SO2 emissions. The measurement of SO2 emission from industries and ships cannot be ignored due to the extremely high NO2 absorption interference. Figure 1b shows the SO2 absorption spectrum (blue line) and NO2 absorption spectrum (red line) in the spectral range of 280–360 nm.
As shown in Figure 1b, the absorption band of SO2 overlaps with the absorption band of NO2, and the absorption cross-sections of SO2 and NO2 are comparable in the chosen spectral window. We calculated the SO2 column density (CD) error caused by the interference of NO2 absorption. In accordance with the Beer–Lambert law to resolve the SO2 signal, the signal channel and the reference channel can be expressed as:
where the incident spectral radiation intensity and radiation intensity are the intensity images after and before traversing the plume at wavelength , is the absorption cross-section of SO2, is the SO2 CD or the integral of SO2 concentration along the effective optical path, is the absorption cross-section of NO2, and is its CD. is the apparent absorbance, which is the difference between the optical depth (OD) for and . No aerosols are assumed to be present in the emission plume. We obtain an expression for the SO2 optical depth:
where is the ratio between the integral of NO2 absorption cross-section at two region wavelengths of narrow-band filters. In this work, is 310 nm, and is 330 nm with narrow-band filters in the center wavelength.
Figure 2 shows the simulated SO2 CD measurement error under the influence of NO2 CD. With the significant increase in NO2 CD towards high concentration, the signal channel () SO2 OD is particularly influenced by the NO2 CD. This error is the main source for measuring SO2 emissions. It is important to eliminate the influence of NO2 absorption in the plume.
Figure 2b shows the calculated error varying with the NO2 CD at different SO2 CDs. The error is approximately the monotone function of NO2 CD, and the relation between them is particularly affected by the NO2 CD. The error clearly increases with the increase in NO2 CD. Therefore, the error of measuring SO2 CD can be effectively eliminated if the ratio of the two NO2 ODs of two channels is known.
3. Methodology
3.1. Experiment Instrument
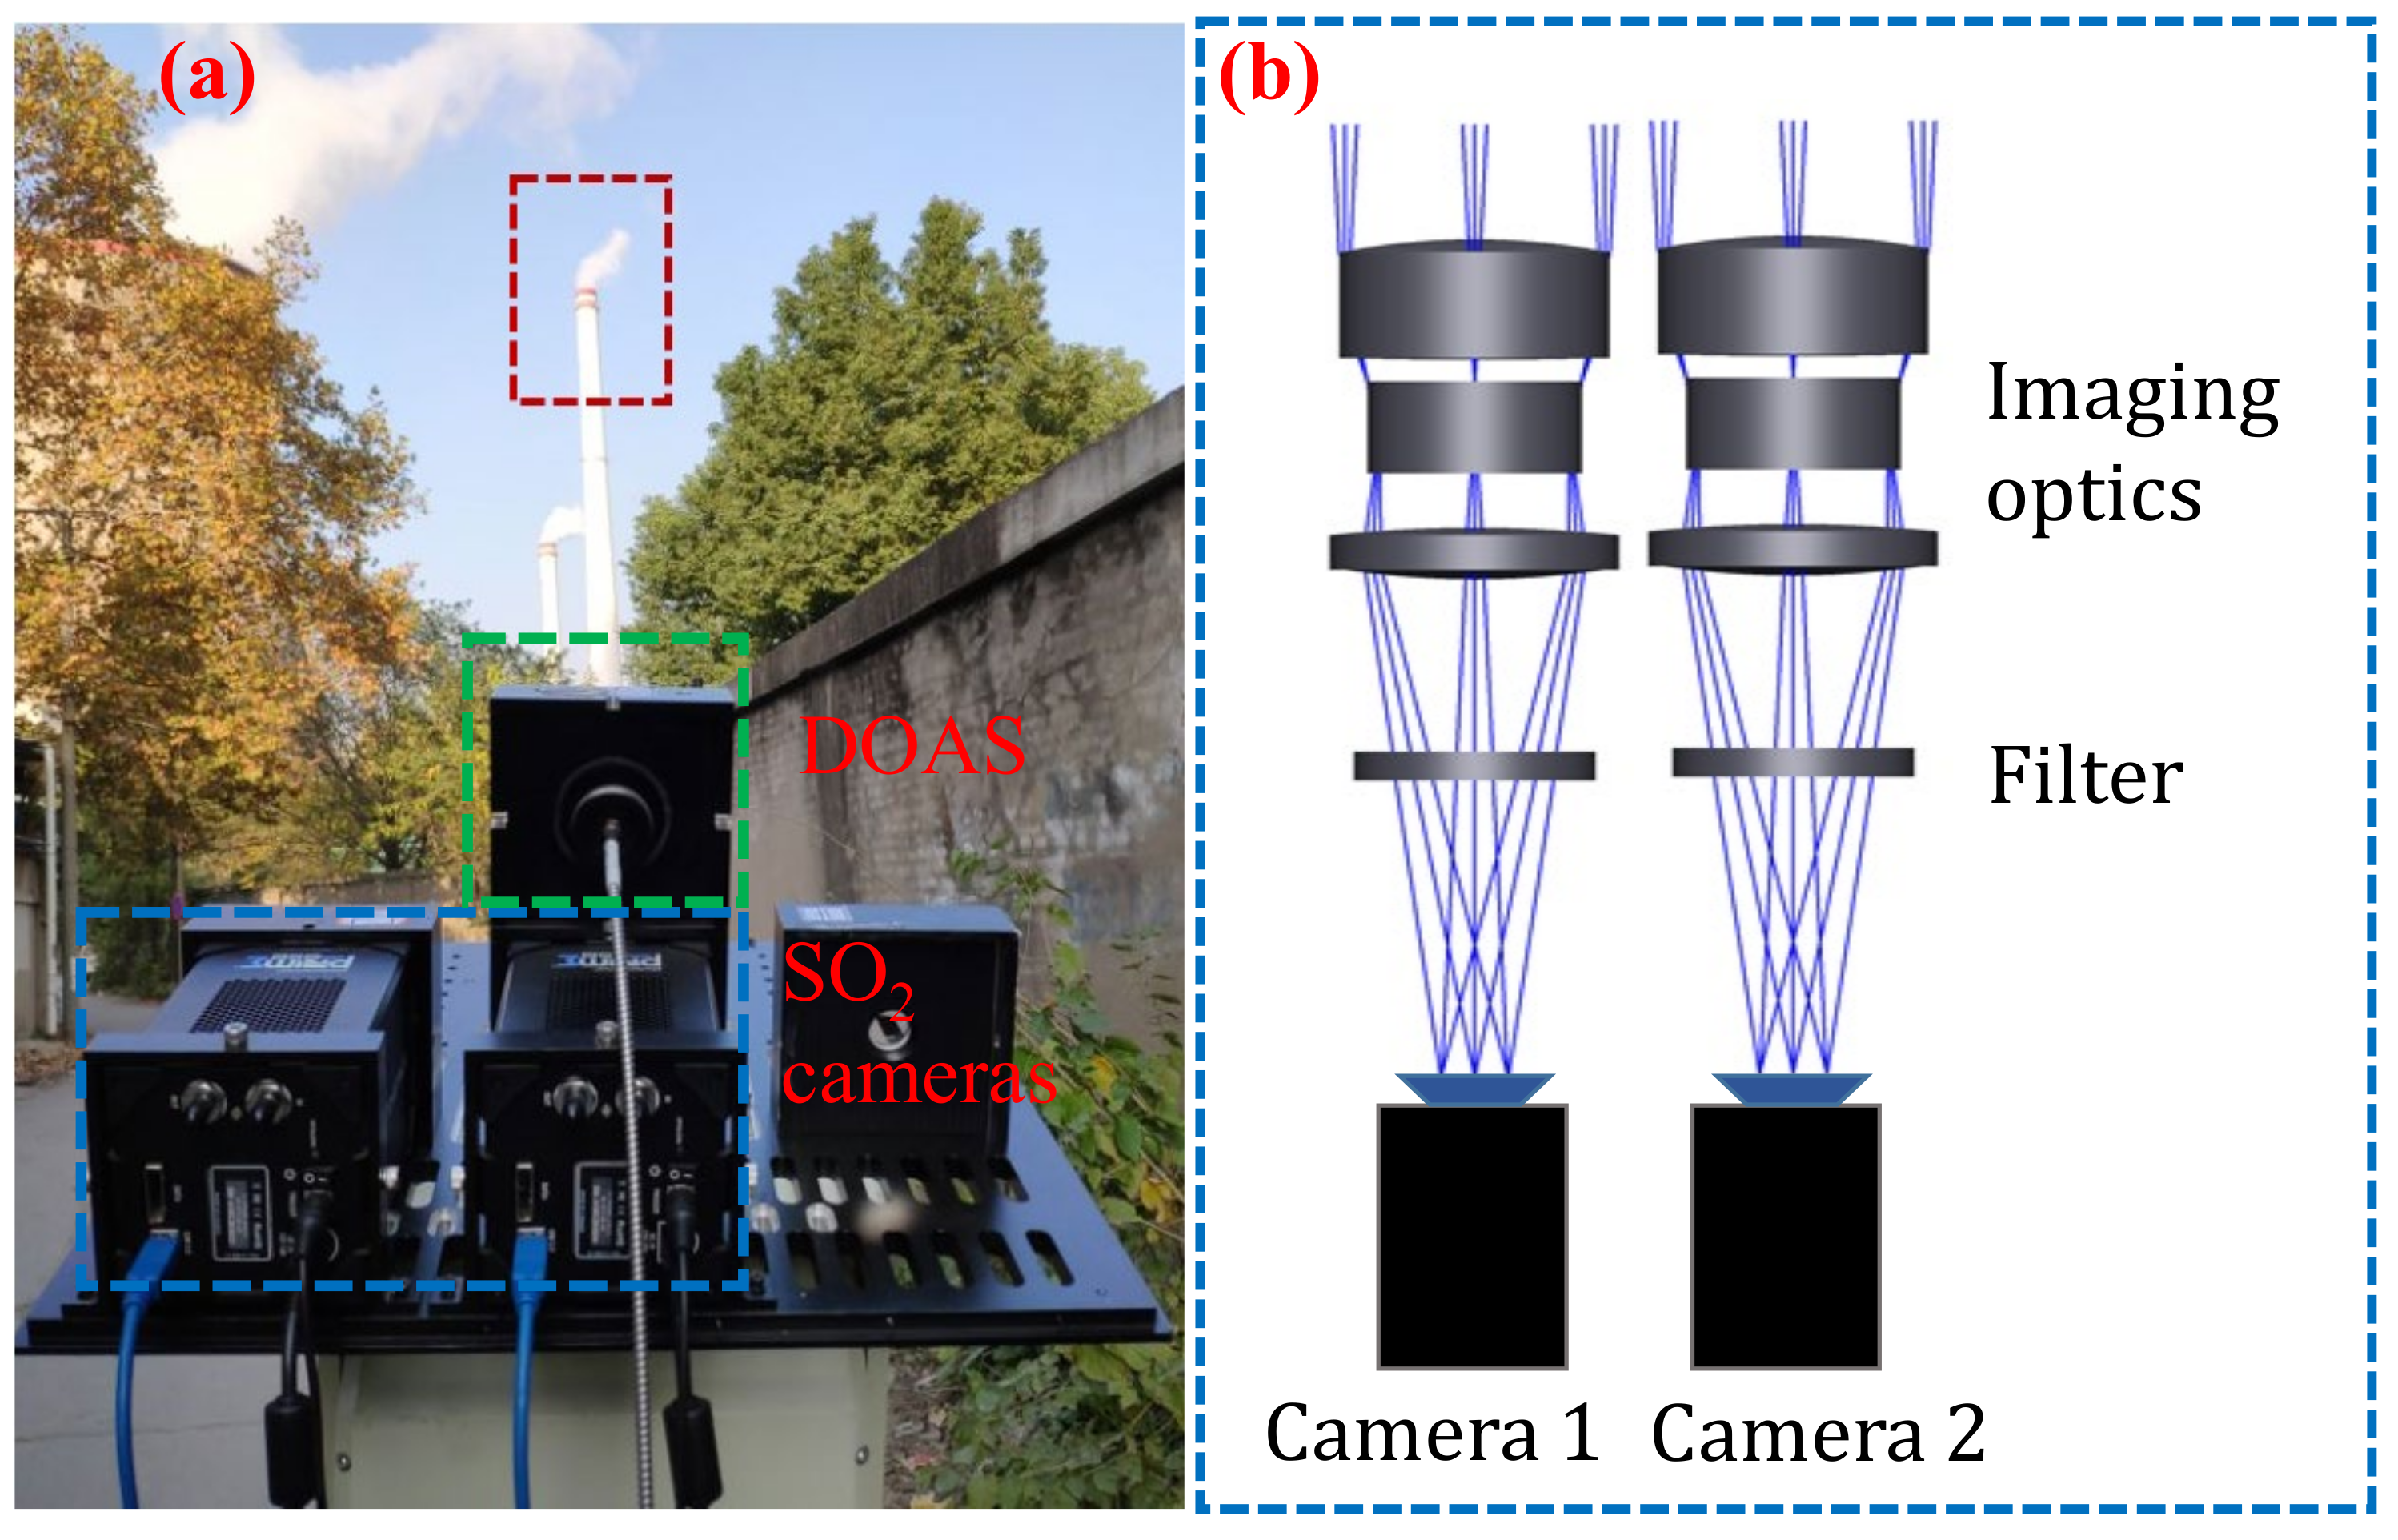
To verify the accuracy of the theoretical analysis and simulation, we used SO2 cameras to acquire images of SO2 emissions from the plant near Wuhan on 16 July 2021. The SO2 camera system is shown in Figure 3. Figure 3a shows a photograph of the SO2 camera system and the DOAS system. The main part of the instrument (see green dotted line area in Figure 3a) is the DOAS system, a lens, and spectrometer-connected fiber. As well as two cameras (blue dotted line area in Figure 3a), each with a lens and a bandpass filter (310 nm and 330 nm). From outside the plant, we can observe one stack from which SO2 emissions are monitored (red dotted line area in Figure 3a). Figure 3b shows a schematic diagram of the SO2 camera system (correspond to the blue dotted line in Figure 3a). The SO2 cameras (Prime 95B Blue) used for these experiments have the most sensitive scientific back-illuminated CMOS sensor (1200 × 1200 pixels, 11 μm × 11 μm pixel size) manufactured by Photometrics (Tucson, AZ, USA). The quantum efficiency of approximately 50–55% at 310 and 330 nm of each SO2 camera is high from 200–1000 nm. The UV lens (UV1054B) of 105 mm focal length (Universe Kogaku America Inc., Oyster Bay, NY, USA) with a total field of view (FOV) of 9.8° and F-number of 4.0 were mounted in front of each camera. Two UV narrow-band filters (ASAHI SPECTRA, Torrance, CA, USA), with a central wavelength of 310 (XBPA310) and 330 nm (XBPA330) and full width at half maximum of 10 nm, were used for the measurements. Two narrow-band filters were mounted between the lens and the cameras. This setup was chosen to reduce the influences from the illumination angle. Two cameras were fixed side by side to simultaneously capture the current polluting gases of industrial emissions by using a function generator (Tektronix AFG 3022B, Beaverton, OR, USA) with a frequency of 1–5 Hz. For comparison, a DOAS system was installed on the two UV cameras. The DOAS system consisted of an Ocean Optics Maya (Dunedin, FL, USA) 2000Pro spectrometer with a spectral range between 247 and 390 nm and a resolution of 0.035 nm, a 600 μm optical fiber, and a telescope with the same quartz lens as the UV camera.
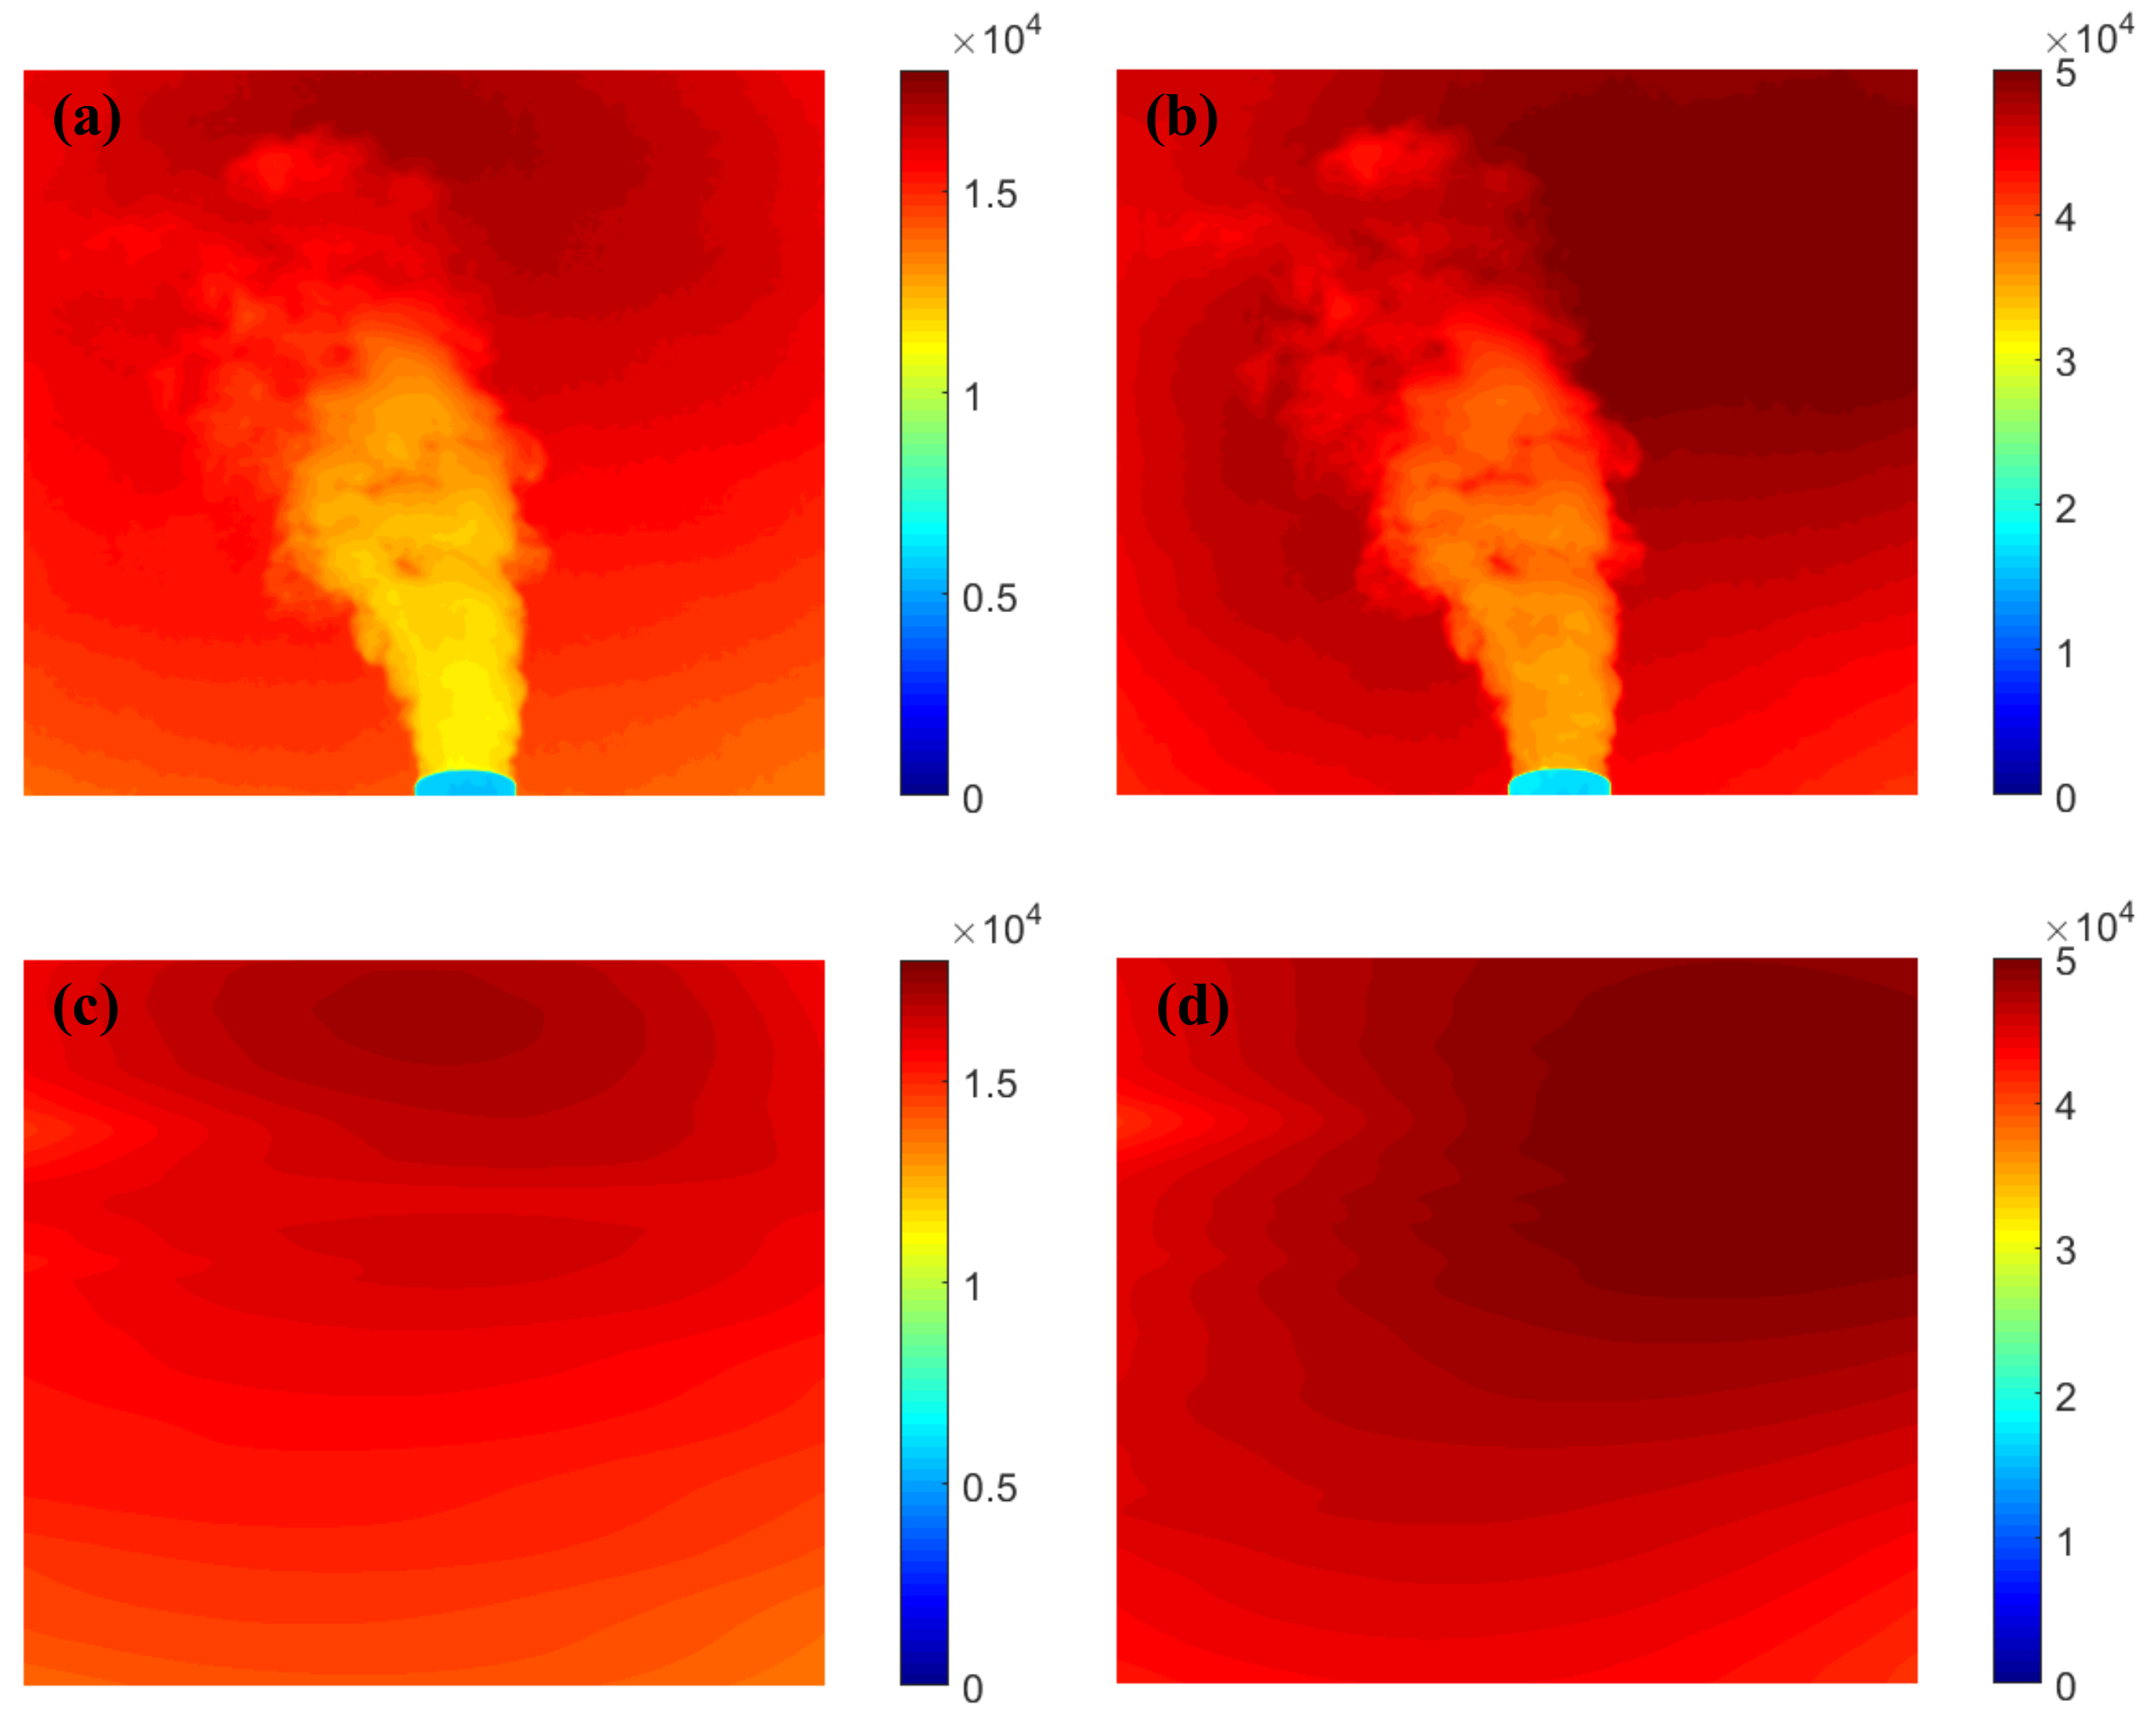
The SO2 camera system is portable. The location (approximately 500 m from the plant through a laser rangefinder) was chosen to be as close as possible to the plant plume emissions (red dotted line area in Figure 3a) to reduce light dilution effects. The exposure times (approximately 0.1 s for 310 nm and 0.06 s for 330 nm) were used to acquire images at approximately 50–60% of the intensity saturation level. The camera with a 310 nm narrow-band filter required long exposure times due to the low intensity of solar radiation. The UV cameras and DOAS system were controlled through panning and tilting. The exposure time of the camera system should be multiple times, especially for the measurement of industrial emissions, to overcome the mechanical complexity of the camera system and the influence of the zenith angle. The images were captured with acquisition rates of 5 Hz, with an additional collection of dark images prior to the capturing of plume sequences. The acquisition and subtraction of a dark frame are required to correct the dark current and electronic noise on the UV camera system. Figure 4a,b shows a pair of the raw images ( and ) of an industrial plume. The raw images were processed following the protocols, which are already described in the literature [20], including the subtraction of a dark current and image matching. Simultaneously, the background sky images ( and ) of the plume can be constructed from the raw plume images by plume segmentation and interpolation. Figure 4c,d shows a pair of the generated artificial background sky images ( and ) resulting from the 2-IM method.
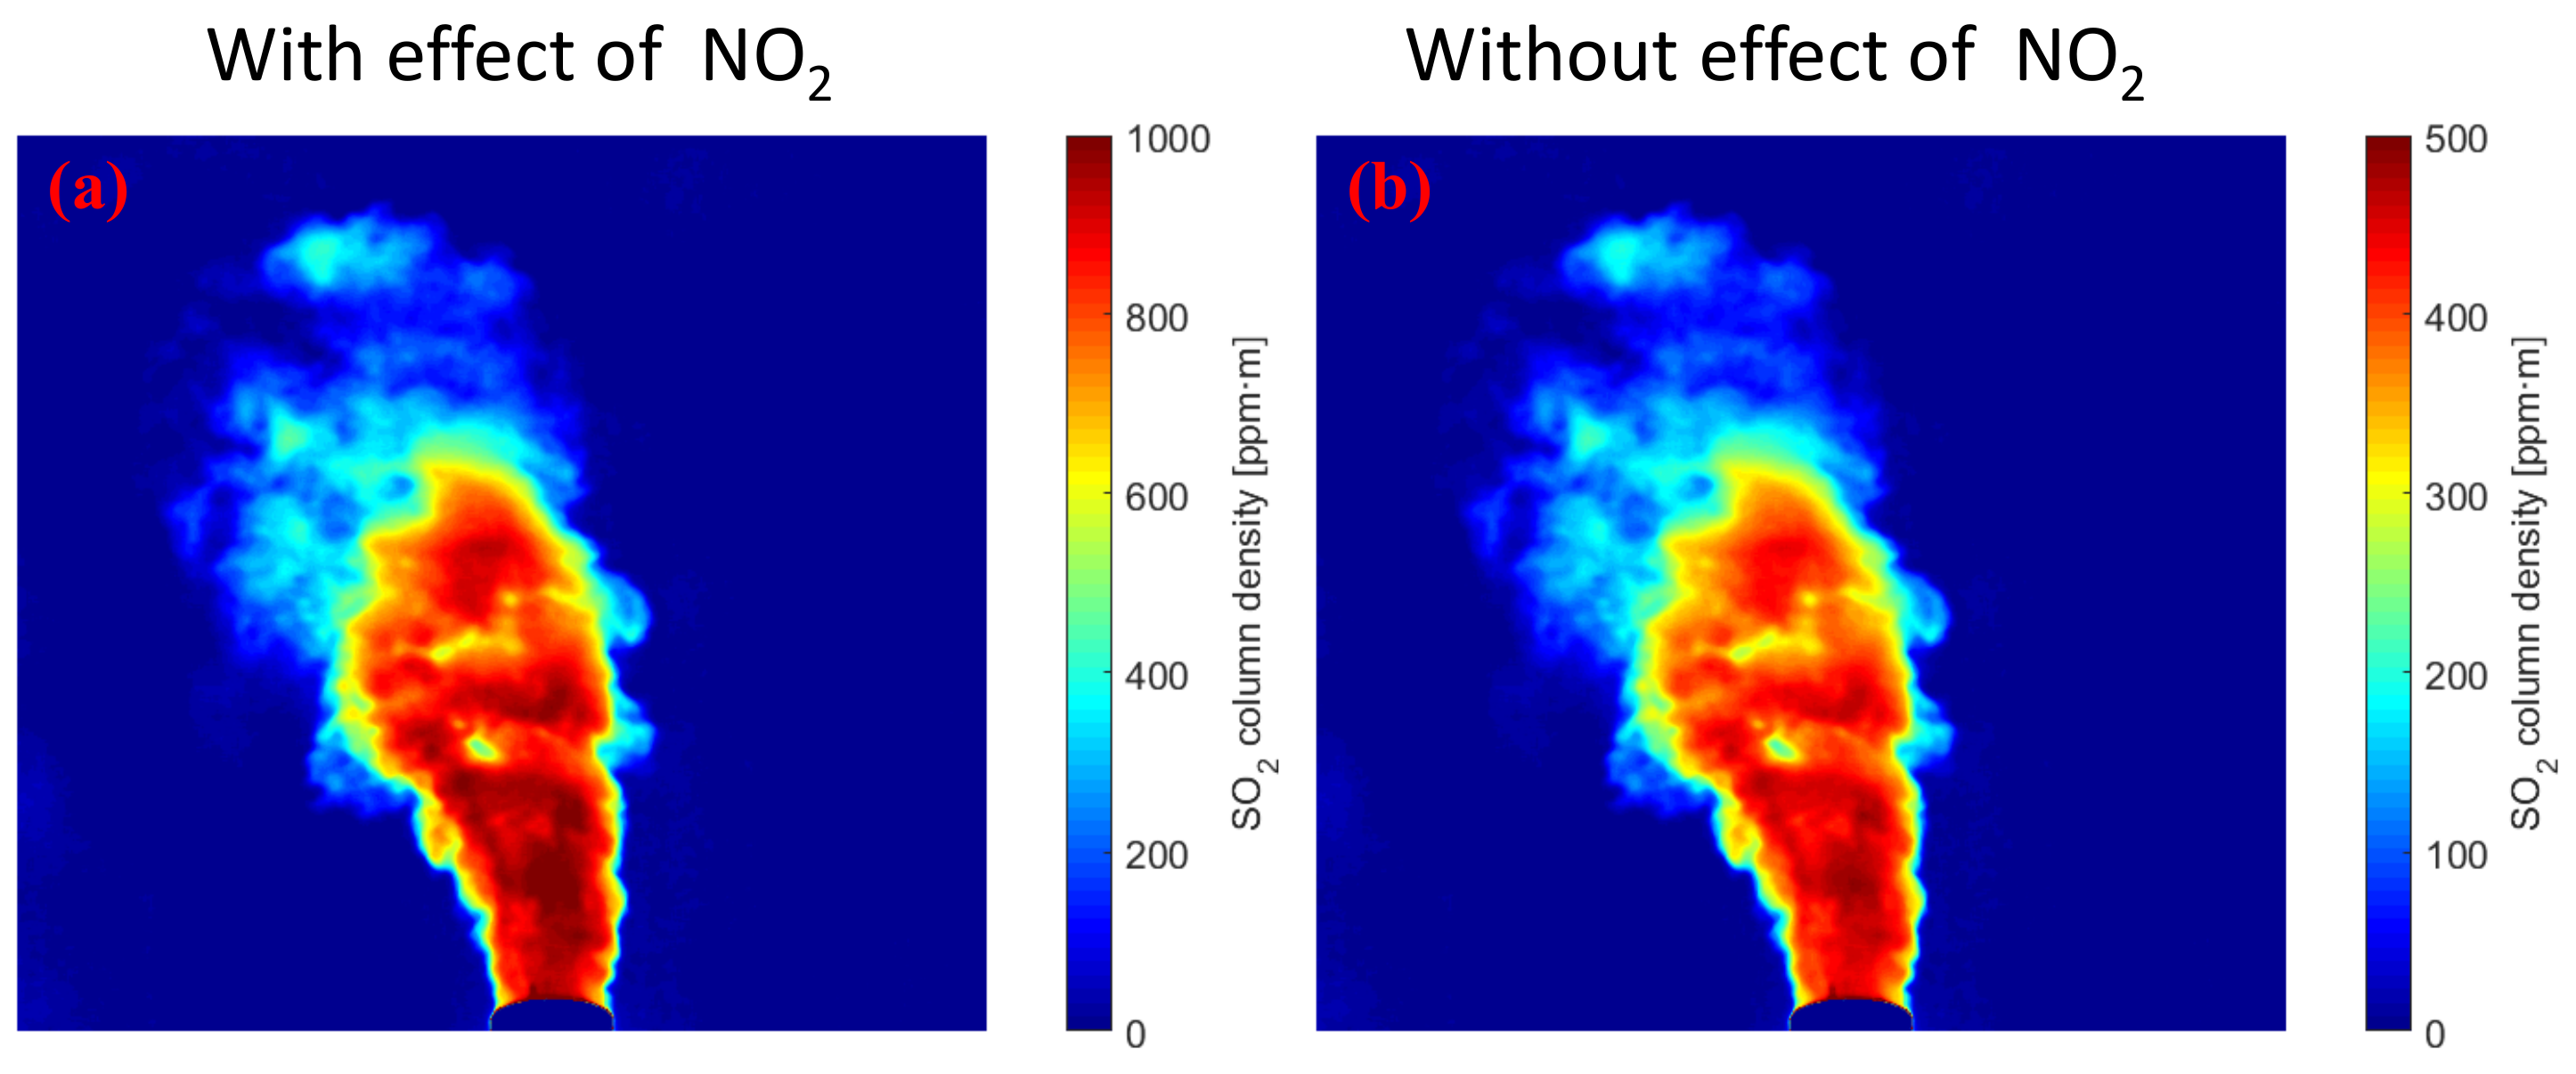
The measurement accuracy of the SO2 CD from industrial emissions is affected by the NO2 absorption. Industrial emissions were measured when the plume entered the camera FOV within the plant. The camera system can be calibrated by using the real-time continuous calibration method of Wu [22,23]. In the particular case of assuming the absence of aerosols in the plume, the SO2 CD density from industrial emissions obtained from the real-time continuous calibration method is shown in Figure 5. Figure 5a shows the SO2 image ignoring the effect of NO2 absorption, and Figure 5b shows the SO2 image using the second channel to correct the NO2 absorption. Ignoring the NO2 absorption leads to an overestimation of the emissions.
3.2. Mie Scattering Corrections
As illustrated in Figure 5, the effect of NO2 absorption can lead to an inaccurate SO2 image measurement. The result of the SO2 image obtained by the two methods differed twice. This finding may be the result of the NO2 absorption correction based on the use of a second channel. However, when scattered solar radiation reaches a camera after passing through a plume from a stack, it contains several trace gases (SO2 and NO2) and aerosol. Assuming that aerosol scattering is independent of wavelength, the second channel of the traditional camera is mostly used to correct plume aerosols in the stack. Therefore, a second channel is used to correct the aerosol or NO2 absorption. Although a second channel certainly reduces the influence of aerosol scattering and NO2 absorption on SO2 camera measurements, it does not completely remove it. This condition is a limitation of the SO2 camera. However, this problem can be overcome by correcting NO2 absorption and aerosol scattering. The OD of SO2 by applying two band-pass filters can be expressed as:
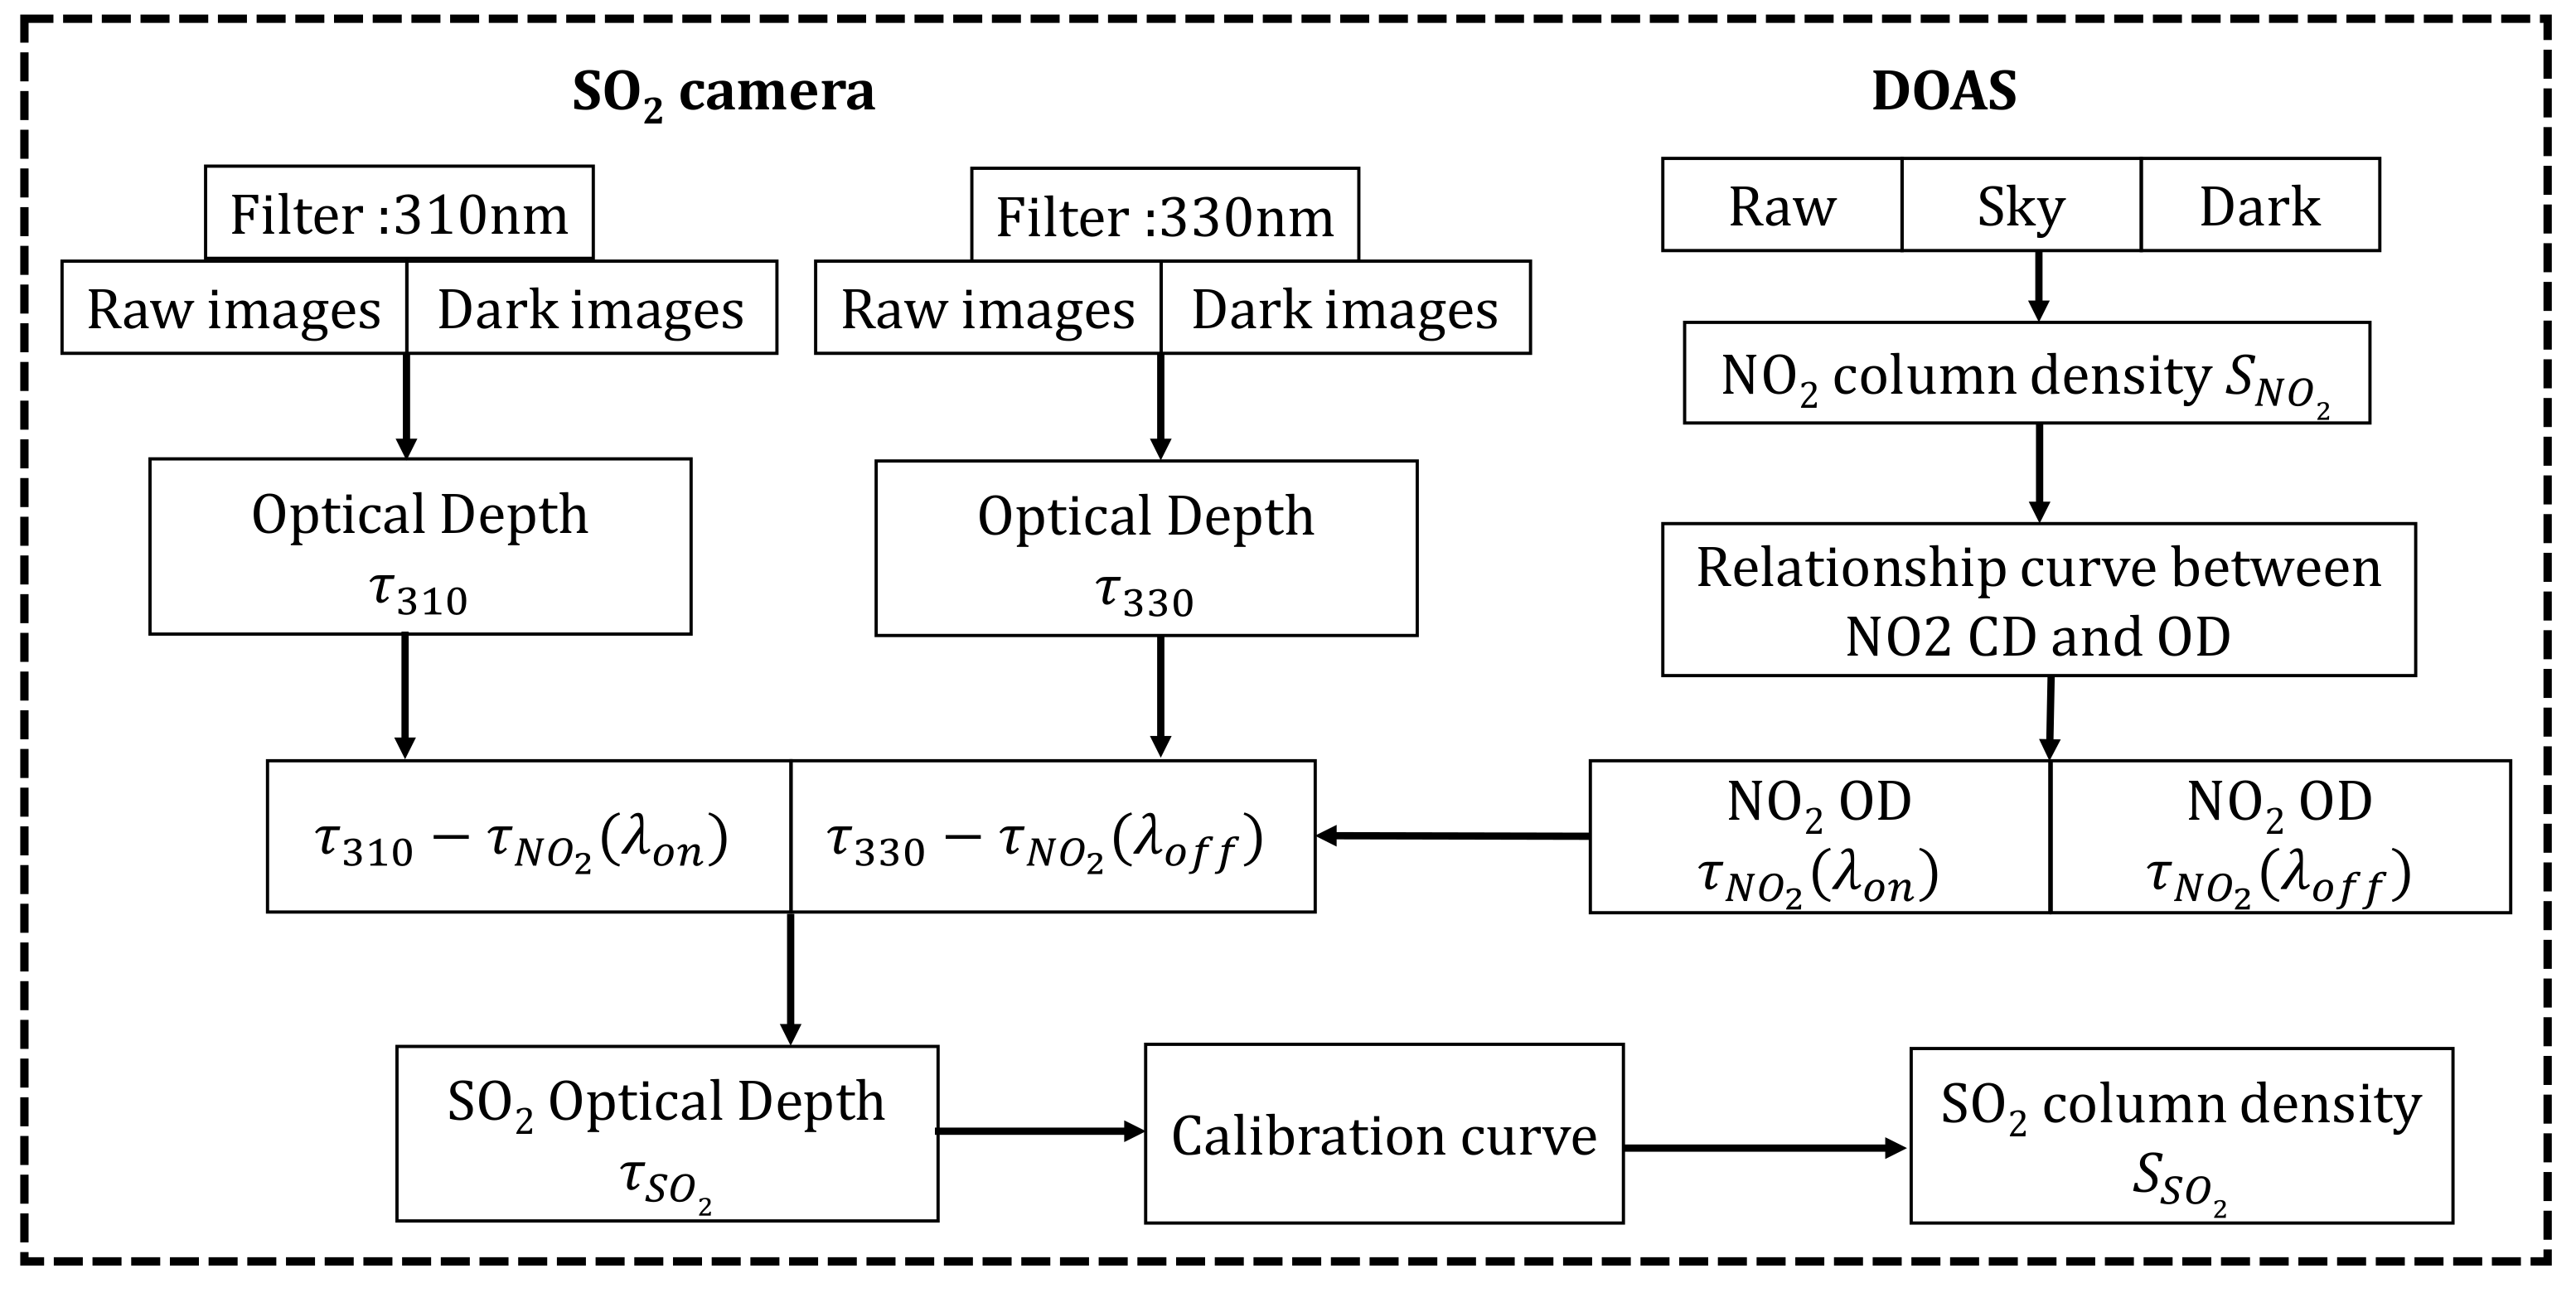
where is the ratio between the scattering cross-section at two different wavelengths and . and are the plume aerosol ODs (AODs). Data analysis was conducted and is summarized in Figure 6.
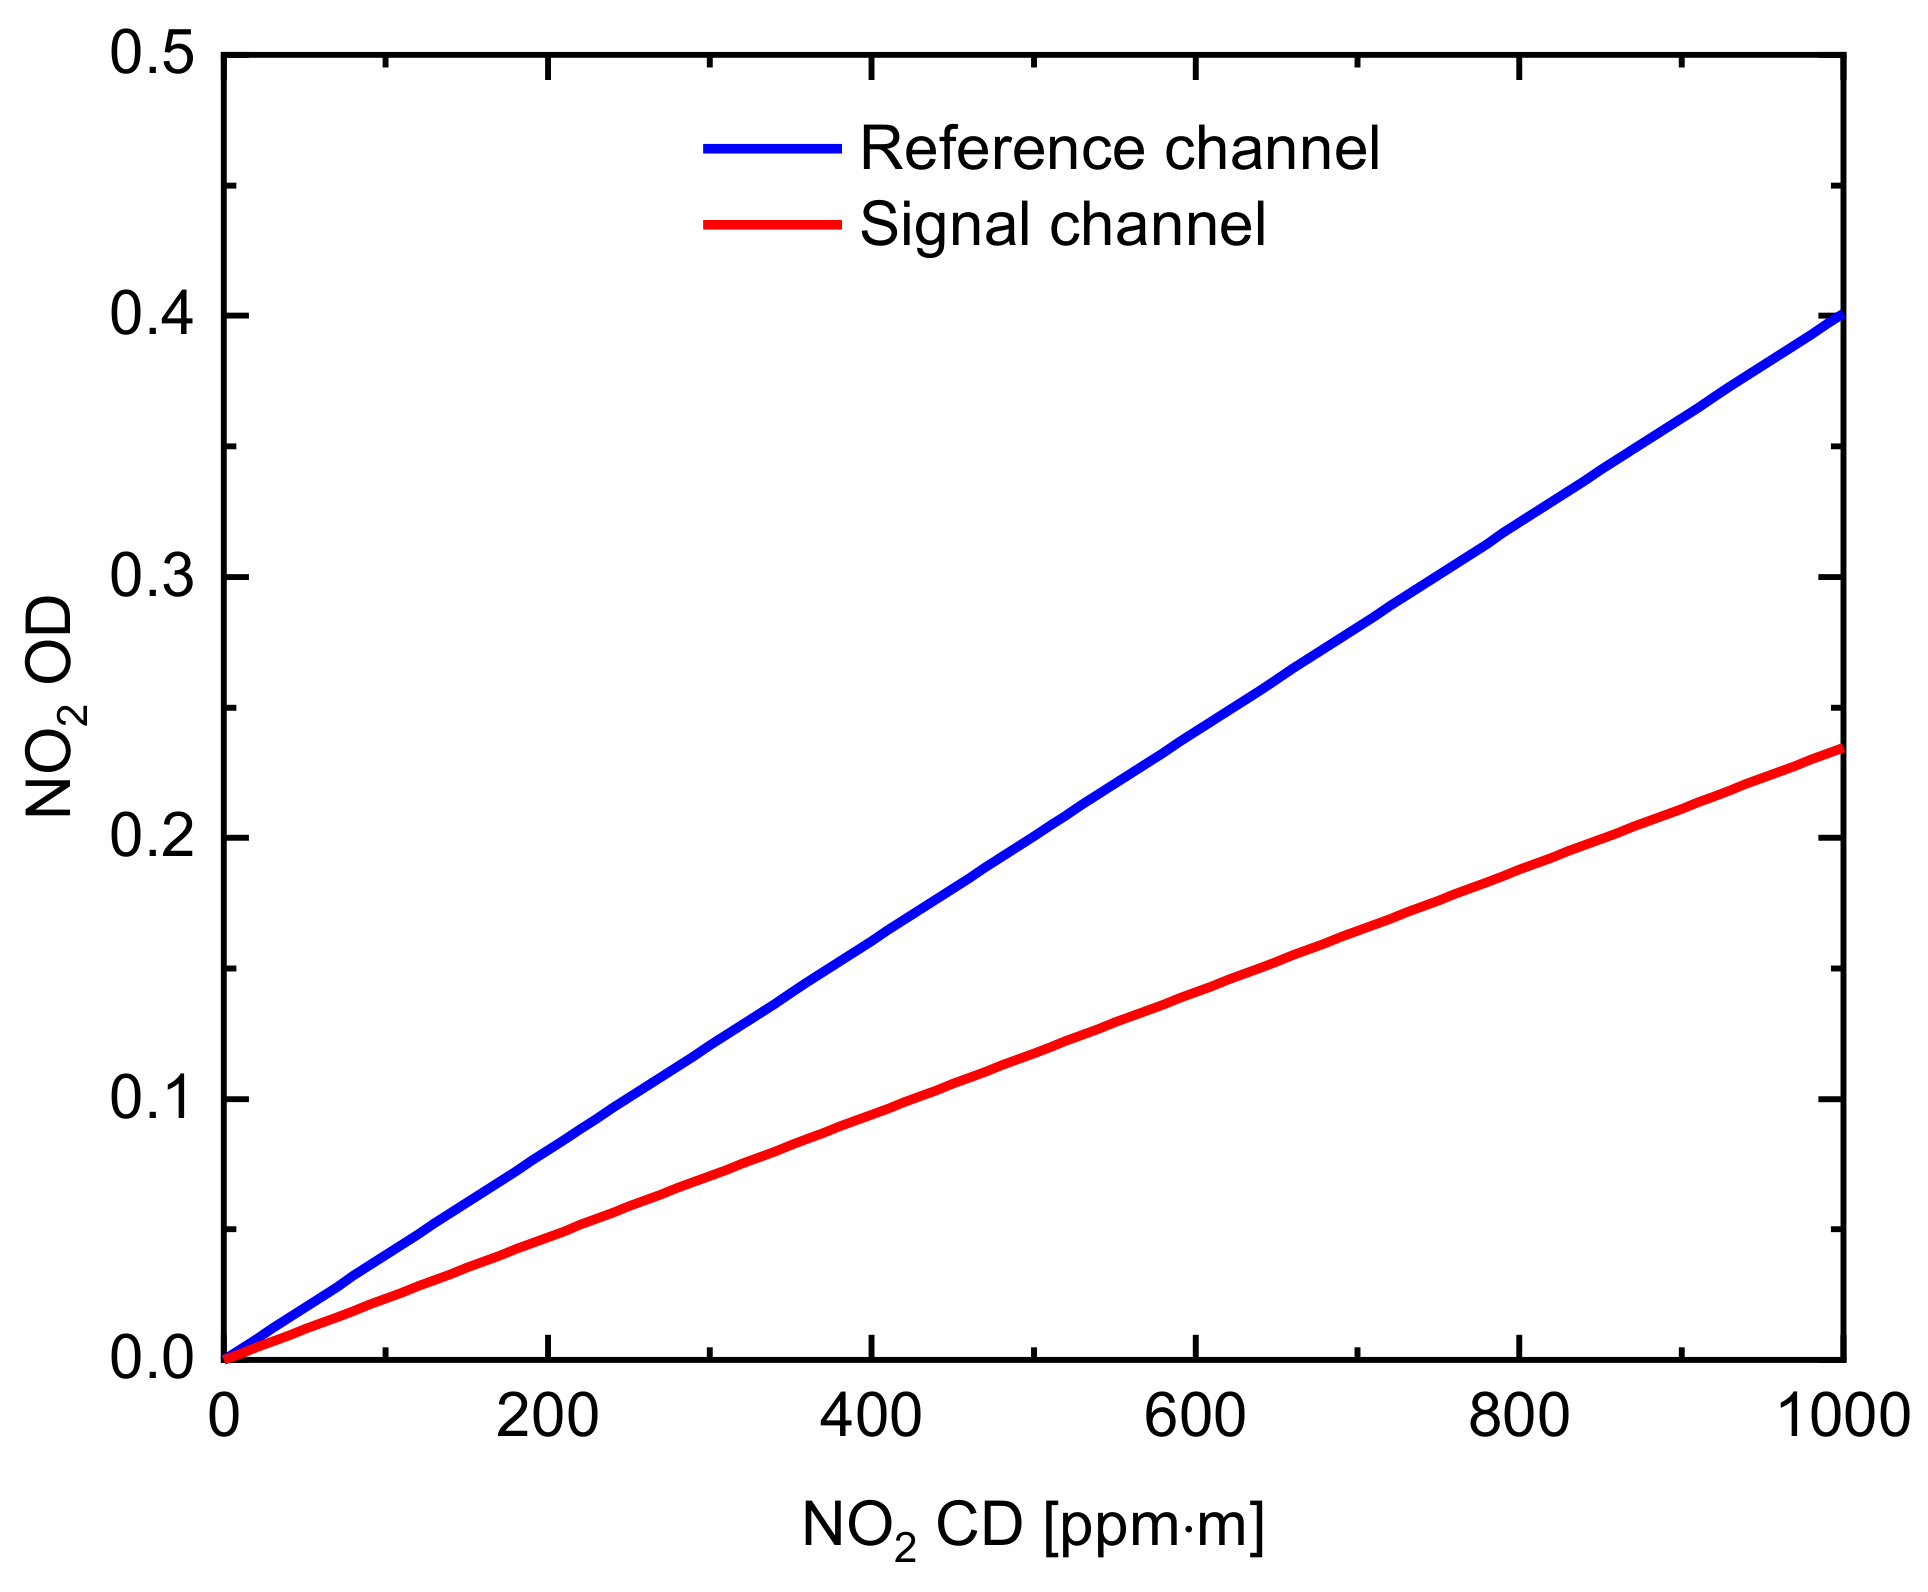
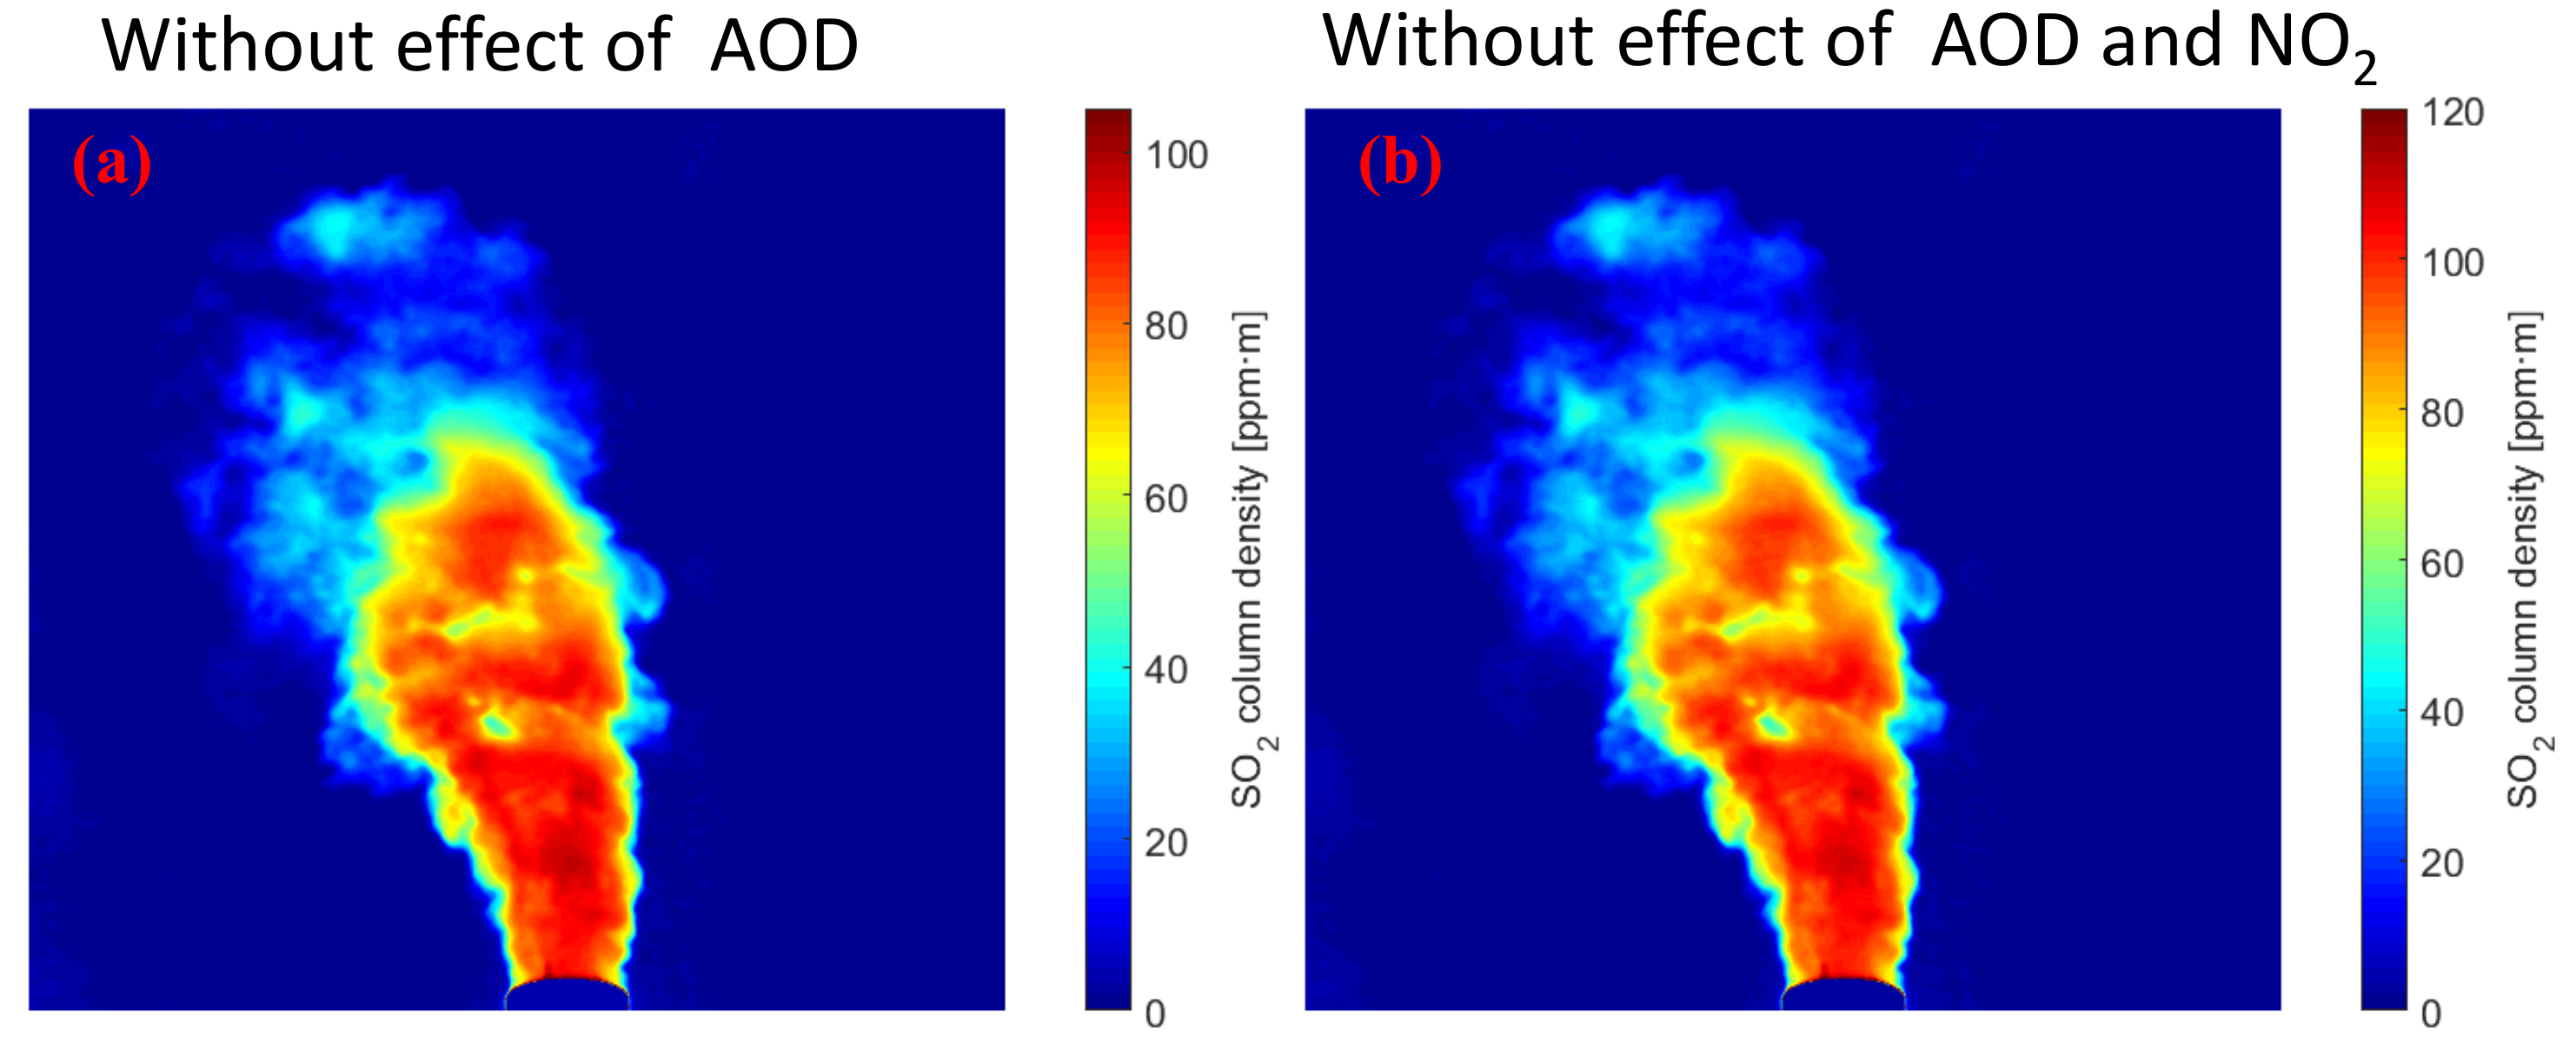
For two band-pass filters, correcting the effects of NO2 absorption and aerosol scattering at the same time is impossible. The corresponding signal channel () and the corresponding reference channel () are influenced by NO2 absorption and aerosol scattering. Here, the spectral data were analyzed by using DOAS to obtain the NO2 CD. The two cameras simultaneously capture the plume with the same FOV, and the spectrometer measures the spectral information of the plume area with the same FOV of the camera. This process was to accurately determine the area in which the DOAS optical FOV is directed and obtains the best correlation between the corresponding channel NO2 OD from the SO2 camera and the NO2 CD measured by DOAS. Using Equation (1), the relationship between the column density of NO2 and the optical density is obtained. Figure 7 shows the calculated relationship curve between the signal and reference channel NO2 CD of the SO2 cameras and the NO2 OD. The signal channel (red line) and the reference channel (blue line) NO2 OD of the SO2 cameras are derived from the NO2 CD measurement by DOAS. The NO2 CD is converted to NO2 OD by multiplying with the factor obtained from the relationship curve. The subtraction of the NO2 OD is required to correct the NO2 absorption in the two channels. Figure 8b shows the concentration image of the SO2 plume obtained by UV cameras with the NO2 absorption and aerosol scattering considered. For comparison, Figure 8a shows the SO2 CD from UV cameras with only aerosol scattering considered. A second channel is used to correct the plume aerosols because the SO2 CD is underestimated because of the presence of NO2 absorption in the plumes. Therefore, this method using DOAS with the SO2 camera makes the real-time NO2 absorption correction. The accuracy of this method is significantly improved by the NO2 absorption correction.
The accuracy of the SO2 CD depends on the difference between the NO2 OD measured by DOAS and the NO2 OD of the corresponding channels on the SO2 camera. Simultaneously, it can be found that only using the second channel from the SO2 camera to correct for aerosol scattering results in an underestimation of the SO2 measurement. However, this method is practical for emission plume monitoring from industrial sources and ships, especially for SO2 CD measurement with NO2 absorption correction.
4. SO2 CD Error
The error measured by the SO2 camera is an extremely important quantity for accuracy. The measurement uncertainty of the SO2 CD can be determined through propagation of error analysis. The dominant sources of uncertainty during the measurements are the system error (, uncertainty of 11.3%) and the random error (, uncertainty of 7.48%). The SO2 CD error can be expressed as:
The absorption in the second channel is due to NO2 and aerosols. However, the correction procedure for the second channel is only used to correct for plume aerosols. The influence of NO2 absorption on SO2 camera measurements is not completely removed. The system error of the SO2 CD measurement is calculated under the influence of NO2 CD. The random error of SO2 CD is derived from light intensities , , , and , which are referred to as the apparent quantities. The random error of the SO2 OD is obtained from the relation.
where , , , and represent the polarization of OD to light intensity, and is the amount of change in light intensity. The random errors of the SO2 OD are due to: (1) photon noise, which can be reduced by combining pixels. This precision can be improved to approximately twice by averaging 4 adjacent pixels and reducing the image size to 0.25 pixels. (2) the light dilution effect and the main source of the random error on UV SO2 camera measurements is related to the scattering of ambient photons [24].
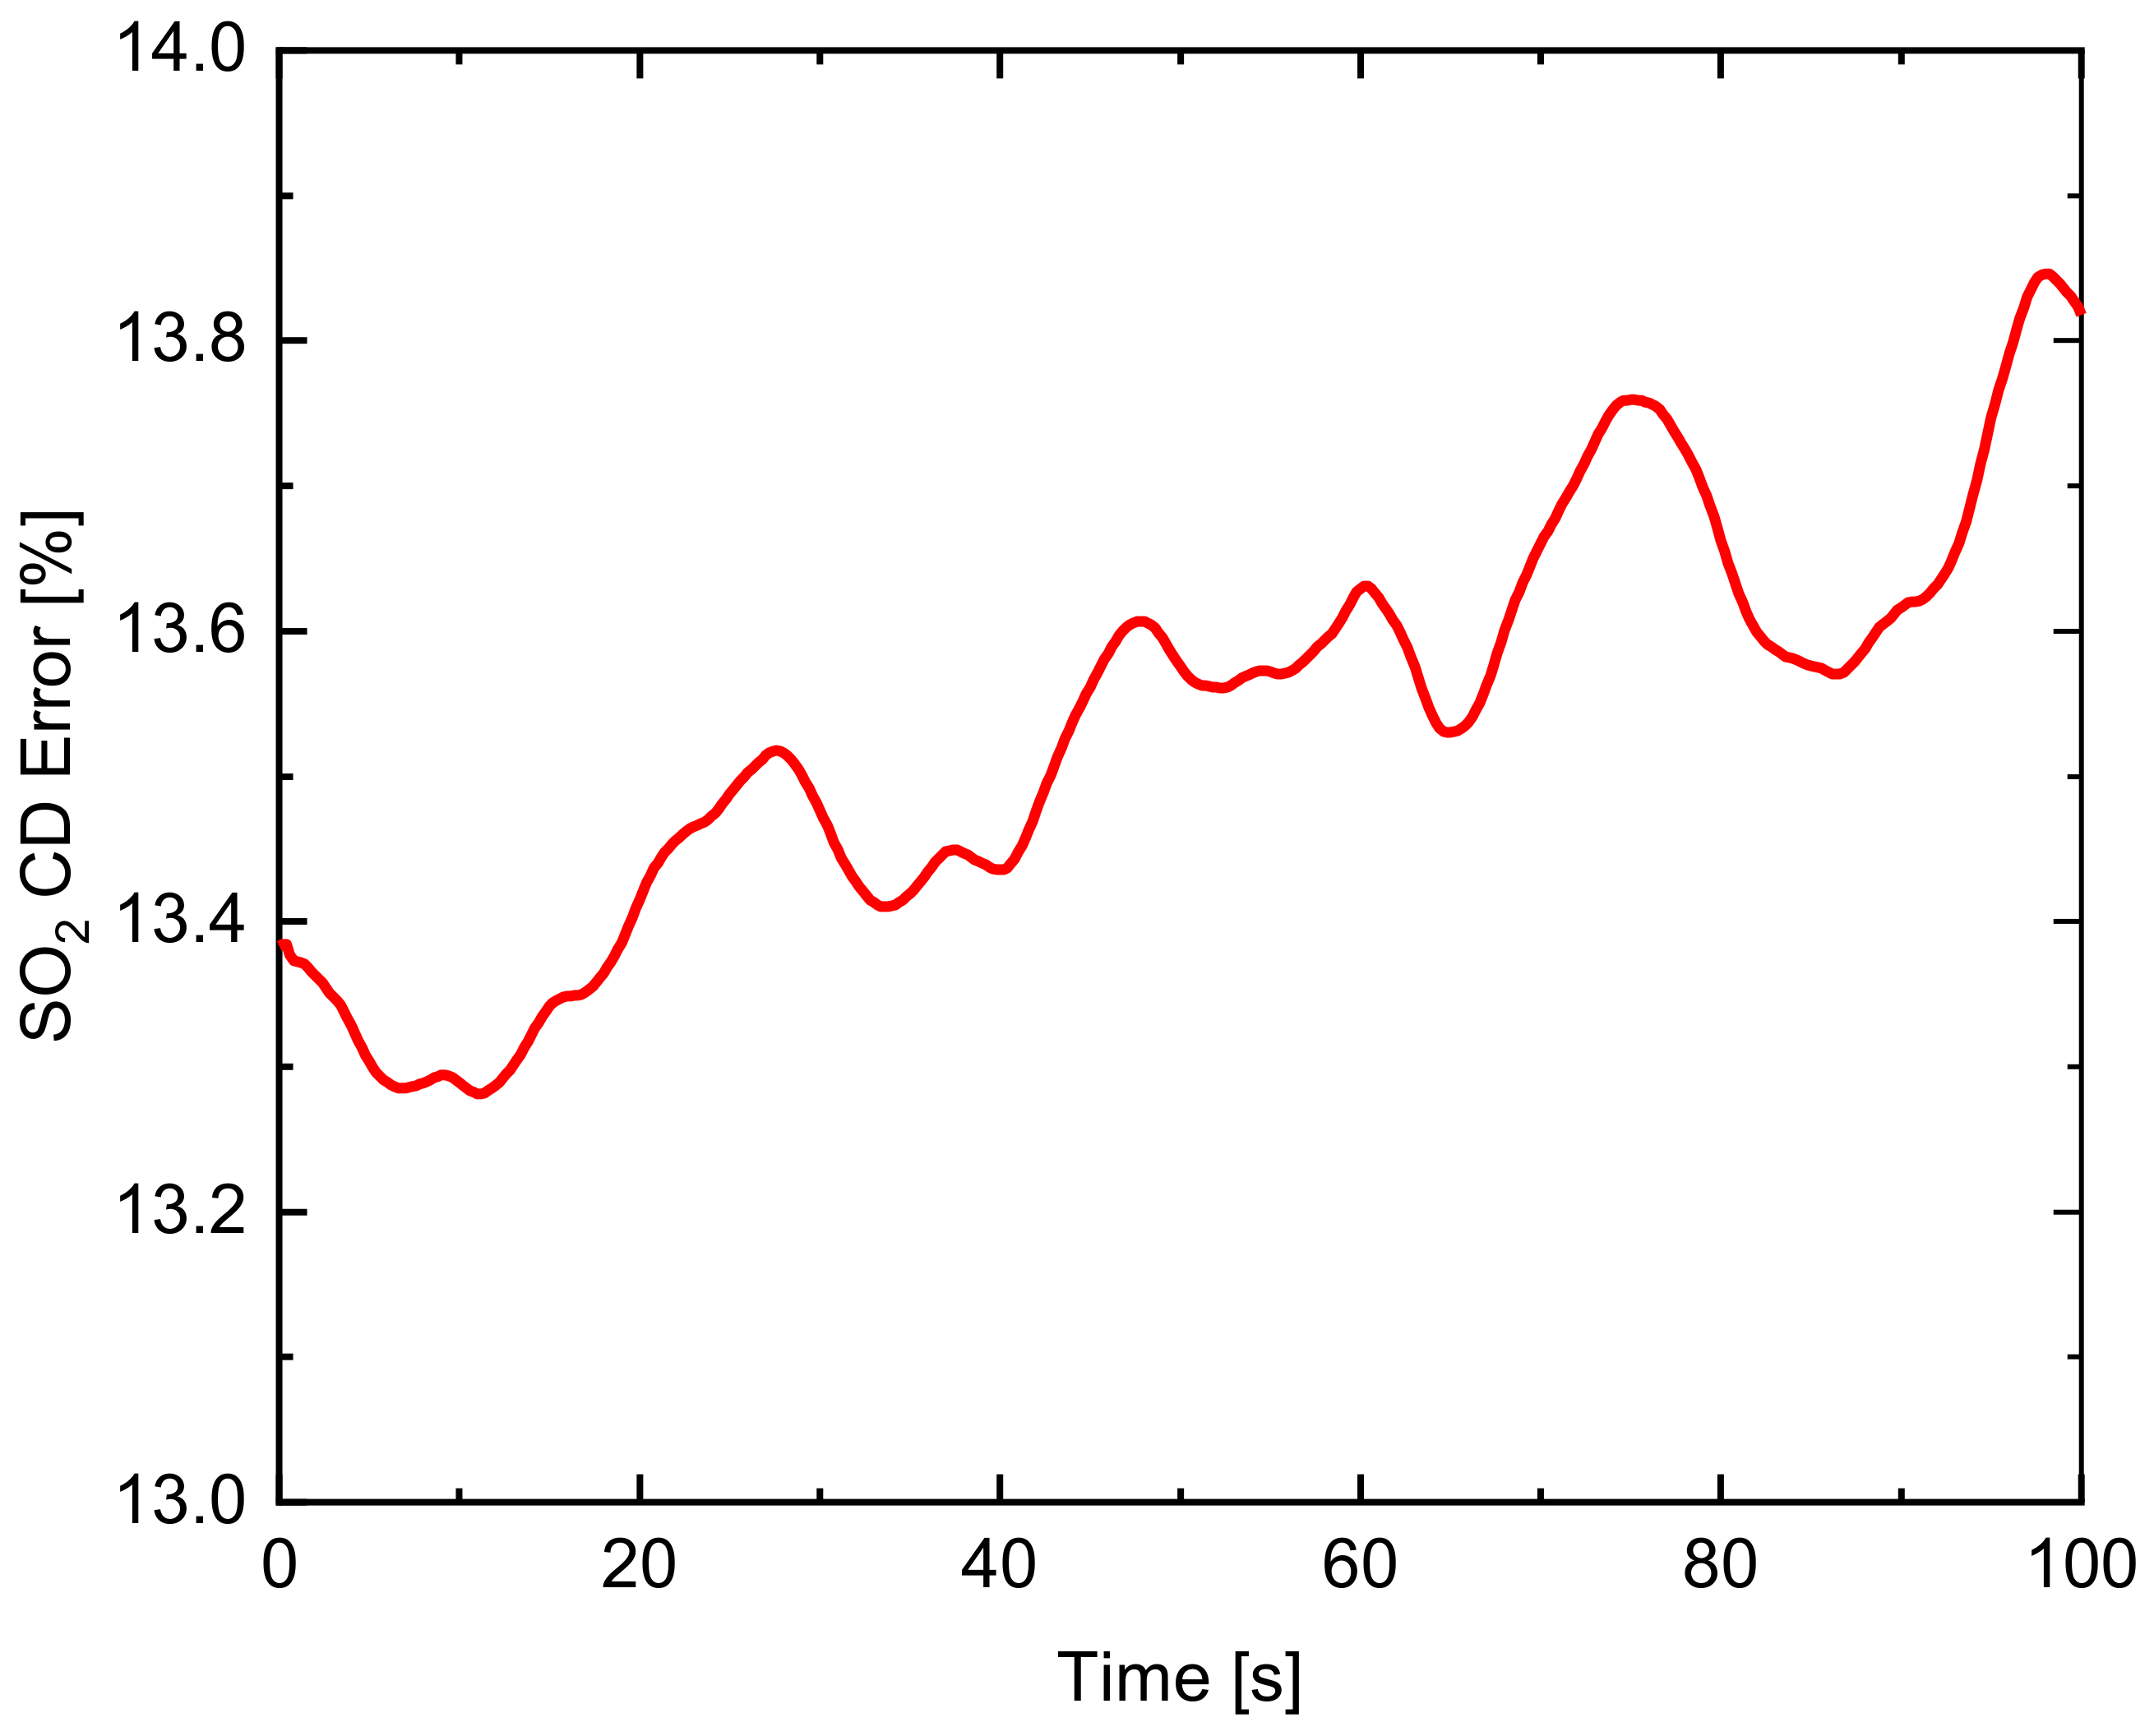
The time series of the error of the SO2 CD corrected for aerosol scattering using the second channel of the UV SO2 camera is shown in Figure 9. The error of the SO2 CD is under 14%. The variation of SO2 CD error is mostly due to the change of NO2 CD in the SO2 emission plume.
5. Conclusions
In this work, we first put forward an SO2 camera for the real-time NO2 absorption corrections to improve the measurement accuracy of SO2 emissions. The instrument was designed with NO2 absorption corrections and aerosol scattering corrections to improve the accuracy of the SO2 CD. The theoretical analysis for the spectral interference of industrial SO2 emissions is given in detail, and the error of NO2 absorption interference is simulated. The UV SO2 camera system with NO2 absorption corrections is developed to measure the SO2 CD of an industrial plume in Wuhan, and a series of experimental results are obtained to verify the accuracy of this theoretical analysis. The 2-IM method is utilized to obtain the artificial background sky images, SO2 CD, and the error of the SO2 CD. The traditional camera system only used the second channel to correct the interference of aerosol scattering, which underestimates the SO2 emissions due to the interference of NO2 absorption in the plume. We compare the experimental results with and without the effect of NO2 absorption correction. The SO2 CD errors between them are effectively reduced by 11.3% after NO2 absorption corrections. Therefore, an effective means to improve the accuracy of the SO2 CD is to combine the UV SO2 cameras and a spectrometer to measure the plume at the same time, which can effectively overcome the interference of NO2 absorption and aerosol scattering. This new method can provide a good temporal resolution for real-time NO2 absorption corrections, especially for measuring the plumes from industries and ships. This promising method may greatly improve the measurement accuracy of SO2 emissions and provide the most convenient option for rapid measurements of industrial and ship SO2 emissions in the foreseeable future.
Author Contributions
Conceptualization, F.L. and K.W.; methodology, Y.X.; data curation, G.Y., Z.C. and L.L.; writing—original draft preparation, Y.X.; funding acquisition, F.L. All authors have read and agreed to the published version of the manuscript.
Funding
This research was funded by the National Key Research and Development Program of China (2017YFC0211900) and the National Natural Science Foundation of China (41975039, 61705253).
Institutional Review Board Statement
Not applicable.
Informed Consent Statement
Not applicable.
Data Availability Statement
Not applicable.
Conflicts of Interest
The authors declare no conflict of interest. The funders had no role in the design of the study; in the collection, analyses, or interpretation of data; in the writing of the manuscript, or in the decision to publish the results.
References
- Zhou, F.; Gu, J.; Chen, W.; Ni, X. Measurement of SO2 and NO2 in Ship Plumes Using Rotary Unmanned Aerial System. Atmosphere 2019, 10, 657. [Google Scholar] [CrossRef] [Green Version]
- Cao, K.; Zhang, Z.; Li, Y.; Zheng, W.; Xie, M. Ship fuel sulfur content prediction based on convolutional neural network and ultraviolet camera images. Environ. Pollut. 2021, 273, 116501. [Google Scholar] [CrossRef] [PubMed]
- Zhang, Z.D.; Zheng, W.B.; Li, Y.; Cao, K.; Xie, M.; Wu, P. Monitoring Sulfur Content in Marine Fuel Oil Using Ultraviolet Imaging Technology. Atmosphere 2021, 12, 1182. [Google Scholar] [CrossRef]
- Kalabokas, P.D.; Papayannis, A.D.; Tsaknakis, G.; Ziomas, I. A study on the atmospheric concentrations of primary and secondary air pollutants in the Athens basin performed by DOAS and DIAL measuring techniques. Sci. Total Environ. 2012, 414, 556–563. [Google Scholar] [CrossRef] [PubMed]
- Hughes, E.J.; Yorks, J.; Krotkov, N.A.; da Silva, A.M.; McGill, M. Using CATS near-real-time lidar observations to monitor and constrain volcanic sulfur dioxide (SO2) forecasts. Geophys. Res. Lett. 2016, 43, 11089–11097. [Google Scholar] [CrossRef]
- Allard, P.; Burton, M.; Mure, F. Spectroscopic evidence for a lava fountain driven by previously accumulated magmatic gas. Nature 2005, 433, 407–410. [Google Scholar] [CrossRef] [PubMed]
- Burton, M.; Allard, P.; Mure, F.; La Spina, A. Magmatic gas composition reveals the source depth of slug-driven strombolian explosive activity. Science 2007, 317, 227–230. [Google Scholar] [CrossRef] [Green Version]
- La Spina, A.; Burton, M.; Allard, P.; Alparone, S.; Muré, F. Open-path FTIR spectroscopy of magma degassing processes during eight lava fountains on Mount Etna. Earth Planet. Sci. Lett. 2015, 413, 123–134. [Google Scholar] [CrossRef]
- Berg, N.; Mellqvist, J.; Jalkanen, J.P.; Balzani, J. Ship emissions of SO2 and NO2: DOAS measurements from airborne platforms. Atmos. Meas. Tech. 2012, 5, 1085–1098. [Google Scholar] [CrossRef] [Green Version]
- Wu, F.C.; Xie, P.H.; Li, A.; Mou, F.S.; Chen, H.; Zhu, Y.; Zhu, T.; Liu, J.G.; Liu, W.Q. Investigations of temporal and spatial distribution of precursors SO2 and NO2 vertical columns in the North China Plain using mobile DOAS. Atmos. Chem. Phys. 2018, 18, 1535–1554. [Google Scholar] [CrossRef] [Green Version]
- Tan, W.; Liu, C.; Wang, S.S.; Xing, C.Z.; Su, W.J.; Zhang, C.X.; Xia, C.Z.; Liu, H.R.; Cai, Z.N.; Liu, J.G. Tropospheric NO2, SO2, and HCHO over the East China Sea, using ship-based MAX-DOAS observations and comparison with OMI and OMPS satellite data. Atmos. Chem. Phys. 2018, 18, 15387–15402. [Google Scholar] [CrossRef] [Green Version]
- Bobrowski, N.; Honninger, G.; Lohberger, F.; Platt, U. IDOAS: A new monitoring technique to study the 2D distribution of volcanic gas emissions. J. Volcanol. Geotherm. Res. 2006, 150, 329–338. [Google Scholar] [CrossRef]
- Schonhardt, A.; Altube, P.; Gerilowski, K.; Krautwurst, S.; Hartmann, J.; Meier, A.C.; Richter, A.; Burrows, J.P. A wide field-of-view imaging DOAS instrument for two-dimensional trace gas mapping from aircraft. Atmos. Meas. Tech. 2015, 8, 5113–5131. [Google Scholar] [CrossRef] [Green Version]
- Wilkes, T.C.; McGonigle, A.J.; Pering, T.D.; Taggart, A.J.; White, B.S.; Bryant, R.G.; Willmott, J.R. Ultraviolet Imaging with Low Cost Smartphone Sensors: Development and Application of a Raspberry Pi-Based UV Camera. Sensors 2016, 16, 1649. [Google Scholar] [CrossRef] [Green Version]
- Mori, T.; Burton, M. The SO2 camera: A simple, fast and cheap method for ground-based imaging of SO2 in volcanic plumes. Geophys. Res. Lett. 2006, 33, L24804. [Google Scholar] [CrossRef]
- Bluth, G.J.S.; Shannon, J.M.; Watson, I.M.; Prata, A.J.; Realmuto, V.J. Development of an ultra-violet digital camera for volcanic SO2 imaging. J. Volcanol. Geotherm. Res. 2007, 161, 47–56. [Google Scholar] [CrossRef]
- Kern, C.; Kick, F.; Lubeck, P.; Vogel, L.; Wuhrbach, M.; Platt, U. Theoretical description of functionality, applications, and limitations of SO2 cameras for the remote sensing of volcanic plumes. Atmos. Meas. Tech. 2010, 3, 733–749. [Google Scholar] [CrossRef] [Green Version]
- Kern, C.; Werner, C.; Elias, T.; Sutton, A.J.; Lubcke, P. Applying UV cameras for SO2 detection to distant or optically thick volcanic plumes. J. Volcanol. Geotherm. Res. 2013, 262, 80–89. [Google Scholar] [CrossRef]
- Kern, C.; Lubcke, P.; Bobrowski, N.; Campion, R.; Mori, T.; Smekens, J.F.; Stebel, K.; Tamburello, G.; Burton, M.; Platt, U.; et al. Intercomparison of SO2 camera systems for imaging volcanic gas plumes. J. Volcanol. Geotherm. Res. 2015, 300, 22–36. [Google Scholar] [CrossRef]
- Osorio, M.; Casaballe, N.; Belsterli, G.; Barreto, M.; Gomez, A.; Ferrari, J.A.; Frins, E. Plume Segmentation from UV Camera Images for SO2 Emission Rate Quantification on Cloud Days. Remote Sens. 2017, 9, 517. [Google Scholar] [CrossRef] [Green Version]
- Wang, P.; Liu, K.Y.; Cwik, T.; Green, R. MODTRAN on supercomputers and parallel computers. Parallel Comput. 2002, 28, 53–64. [Google Scholar] [CrossRef]
- Wu, K.; Feng, Y.; Xiong, Y.; Duan, W.; Yu, G.; Li, F. Real-time continuous calibration method for an ultraviolet camera. Opt. Lett. 2020, 45, 6851–6854. [Google Scholar] [CrossRef]
- Wu, K.; Xiong, Y.; Feng, Y.; Yu, Y.; Li, F. Development of a self-calibration method for real-time monitoring of SO2 ship emissions with UV cameras. Opt. Express 2021, 29, 1813–1823. [Google Scholar] [CrossRef]
- Campion, R.; Delgado-Granados, H.; Mori, T. Image-based correction of the light dilution effect for SO2 camera measurements. J. Volcanol. Geotherm. Res. 2015, 300, 48–57. [Google Scholar] [CrossRef]
Figure 1.
(a) Scattered solar relative spectral intensity varying with wavelength (red line) and absorption cross-section of O3 varying with wavelength (blue line); (b) Absorption cross-section of SO2 (blue line) and absorption cross-section of NO2 (red line), which are calculated on HITRAN.
Figure 1.
(a) Scattered solar relative spectral intensity varying with wavelength (red line) and absorption cross-section of O3 varying with wavelength (blue line); (b) Absorption cross-section of SO2 (blue line) and absorption cross-section of NO2 (red line), which are calculated on HITRAN.

Figure 2.
(a) Result of SO2 column density (CD) error under the influence of NO2 CD; (b) Error varying with NO2 CD for five different SO2 CDs (, , , , and ).
Figure 2.
(a) Result of SO2 column density (CD) error under the influence of NO2 CD; (b) Error varying with NO2 CD for five different SO2 CDs (, , , , and ).

Figure 3.
(a) Photograph of the SO2 cameras system and differential optical absorption spectroscopy (DOAS) system; (b) The optical diagram of the SO2 camera system.
Figure 3.
(a) Photograph of the SO2 cameras system and differential optical absorption spectroscopy (DOAS) system; (b) The optical diagram of the SO2 camera system.

Figure 4.
Example of raw images at nm (a); and at nm (b); and the artificial background sky images at nm (c); and at nm (d).
Figure 4.
Example of raw images at nm (a); and at nm (b); and the artificial background sky images at nm (c); and at nm (d).

Figure 5.
SO2 CD of industrial emissions obtained by a UV camera in the absence of aerosol scattering within the plume. (a) ignoring the effect of NO2 absorption; (b) considering the NO2 absorption.
Figure 5.
SO2 CD of industrial emissions obtained by a UV camera in the absence of aerosol scattering within the plume. (a) ignoring the effect of NO2 absorption; (b) considering the NO2 absorption.

Figure 6.
Flow chart of data analysis.

Figure 7.
Relationship curve between the corresponding NO2 CD and the NO2 optical depth (OD).

Figure 8.
SO2 CD of industrial emission obtained by UV camera in the presence of aerosols within the plume. (a) with aerosol scattering considered; (b) with the NO2 absorption and aerosol scattering considered.
Figure 8.
SO2 CD of industrial emission obtained by UV camera in the presence of aerosols within the plume. (a) with aerosol scattering considered; (b) with the NO2 absorption and aerosol scattering considered.

Figure 9.
Time series of the error of the SO2 CD retrieved from the UV SO2 camera.

Publisher’s Note: MDPI stays neutral with regard to jurisdictional claims in published maps and institutional affiliations. |
© 2022 by the authors. Licensee MDPI, Basel, Switzerland. This article is an open access article distributed under the terms and conditions of the Creative Commons Attribution (CC BY) license (https://creativecommons.org/licenses/by/4.0/).
Share and Cite
MDPI and ACS Style
Xiong, Y.; Wu, K.; Yu, G.; Chen, Z.; Liu, L.; Li, F. Real-Time Monitoring of SO2 Emissions Using a UV Camera with Built-in NO2 and Aerosol Corrections. Sensors 2022, 22, 3900. https://0-doi-org.brum.beds.ac.uk/10.3390/s22103900
AMA Style
Xiong Y, Wu K, Yu G, Chen Z, Liu L, Li F. Real-Time Monitoring of SO2 Emissions Using a UV Camera with Built-in NO2 and Aerosol Corrections. Sensors. 2022; 22(10):3900. https://0-doi-org.brum.beds.ac.uk/10.3390/s22103900
Chicago/Turabian StyleXiong, Yuanhui, Kuijun Wu, Guangbao Yu, Zhenwei Chen, Linmei Liu, and Faquan Li. 2022. "Real-Time Monitoring of SO2 Emissions Using a UV Camera with Built-in NO2 and Aerosol Corrections" Sensors 22, no. 10: 3900. https://0-doi-org.brum.beds.ac.uk/10.3390/s22103900
Note that from the first issue of 2016, this journal uses article numbers instead of page numbers. See further details here.