
Research on an Improved Segmentation Recognition Algorithm of Overlapping Agaricus bisporus


1
School of Mechatronic Engineering and Automation, Shanghai University, Shanghai 200444, China
2
School of Intelligent Manufacturing and Control Engineering, Shanghai Polytechnic University, Shanghai 201209, China
*
Author to whom correspondence should be addressed.
Sensors 2022, 22(10), 3946; https://0-doi-org.brum.beds.ac.uk/10.3390/s22103946
Submission received: 20 March 2022
/
Revised: 16 May 2022
/
Accepted: 19 May 2022
/
Published: 23 May 2022
(This article belongs to the Special Issue AI-Based Sensors and Sensing Systems for Smart Agriculture)
Abstract
:The accurate identification of overlapping Agaricus bisporus in a factory environment is one of the challenges faced by automated picking. In order to better segment the complex adhesion between Agaricus bisporus, this paper proposes a segmentation recognition algorithm for overlapping Agaricus bisporus. This algorithm calculates the global gradient threshold and divides the image according to the image edge gradient feature to obtain the binary image. Then, the binary image is filtered and morphologically processed, and the contour of the overlapping Agaricus bisporus area is obtained by edge detection in the Canny operator, the convex hull and concave area are extracted for polygon simplification, and the vertices are extracted using Harris corner detection to determine the segmentation point. After dividing the contour fragments by the dividing point, the branch definition algorithm is used to merge and group all the contours of the same Agaricus bisporus. Finally, the least squares ellipse fitting algorithm and the minimum distance circle fitting algorithm are used to reconstruct the outline of Agaricus bisporus, and the demand information of Agaricus bisporus picking is obtained. The experimental results show that this method can effectively overcome the influence of uneven illumination during image acquisition and be more adaptive to complex planting environments. The recognition rate of Agaricus bisporus in overlapping situations is more than 96%, and the average coordinate deviation rate of the algorithm is less than 1.59%.
1. Introduction
The factory production of Agaricus bisporus is relatively mature, and the daily output of the larger Agaricus bisporus plant can reach more than ten tons [1,2]. Because the background of the mushroom bed is complex and diverse, the size and shape of the Agaricus bisporus community vary greatly, and there are more complex adhesions between them, so the picking and locating becomes difficult [3]. At present, the picking of Agaricus bisporus in factory production mainly depends on manual labor, but manual picking has the problems of large labor, low efficiency, high cost and inconsistent standards [4]. With the increase in mushroom production, mushroom farming is currently facing the problems of labor shortage and rising costs to maintain sustainability [5]. Therefore, it is an inevitable trend to realize the automatic picking of Agaricus bisporus. With the development of robotics, robotic harvesting of Agaricus bisporus has been researched [6,7,8,9]. Among them, machine vision technology is the key technology in the Agaricus bisporus picking robot [10,11].
At present, mushroom recognition and positioning methods based on machine vision are widely used. Yu Gaohong [12] proposed to start from the central coordinate points of each central area, search for mushroom boundary points along the radius of different angles, and store the found mushroom boundary points in the corresponding dynamic linked list to achieve the independent division of each mushroom. Yang Yongqiang [13] proposed to use Harris corners as texture features to filter the background, accurately extract the foreground targets, search for the regional extreme points in the foreground distance map, and then use the marker-based watershed algorithm to achieve the adhesion of the mushroom segmentation, and finally, ellipse fitting achieves positioning. For segmentation recognition of overlapping target objects, UECS [14] uses a morphological segmentation method to obtain the label of each object, which can be used to segment particles in all shapes, but if the degree of overlap is high, the segmentation results may be affected. In [15,16,17,18], through polygon approximation and ellipse fitting, concave point extraction was used to segment overlapping objects. Although this method is effective for regularly shaped objects, objects with shapes that deviate from the ellipse are problematic.
In [19,20], a twice-watershed algorithm is proposed to segment Agaricus bisporus during size grading, but for overlapping Agaricus bisporus, it seems there are issues in. Sun Jingwei [21] adopted a submergence algorithm on depth images for mushroom segmentation, but how to obtain a high-quality depth image in the case of overlapping is a practical problem. In [22,23,24], object recognition based on a deep learning framework was developed for human activity and intention recognition, and the framework demonstrated superior performance. However, this kind of algorithm has not been widely used in Agaricus bisporus recognition, which also provides a new idea.
In this paper, the segmentation identification of overlapping Agaricus bisporus is studied. We highlight the contributions of this paper as follows.
- (1)
- We adopt gradient feature to reduce the influence of illumination variance.
- (2)
- Considering grouping the segmented contours as combinatorial optimization, we propose a branch definition algorithm to merge and group the dispersed outlines of the same Agaricus bisporus.
- (3)
- To solve arc segmentation with different curvatures and lengths for reconstruction of Agaricus bisporus contours, we exploit two algorithms: the least square ellipse fitting algorithm for high curvature or long length and the minimum distance circle fitting for low curvature or short length.
2. Segmentation of Overlapping Agaricus bisporus
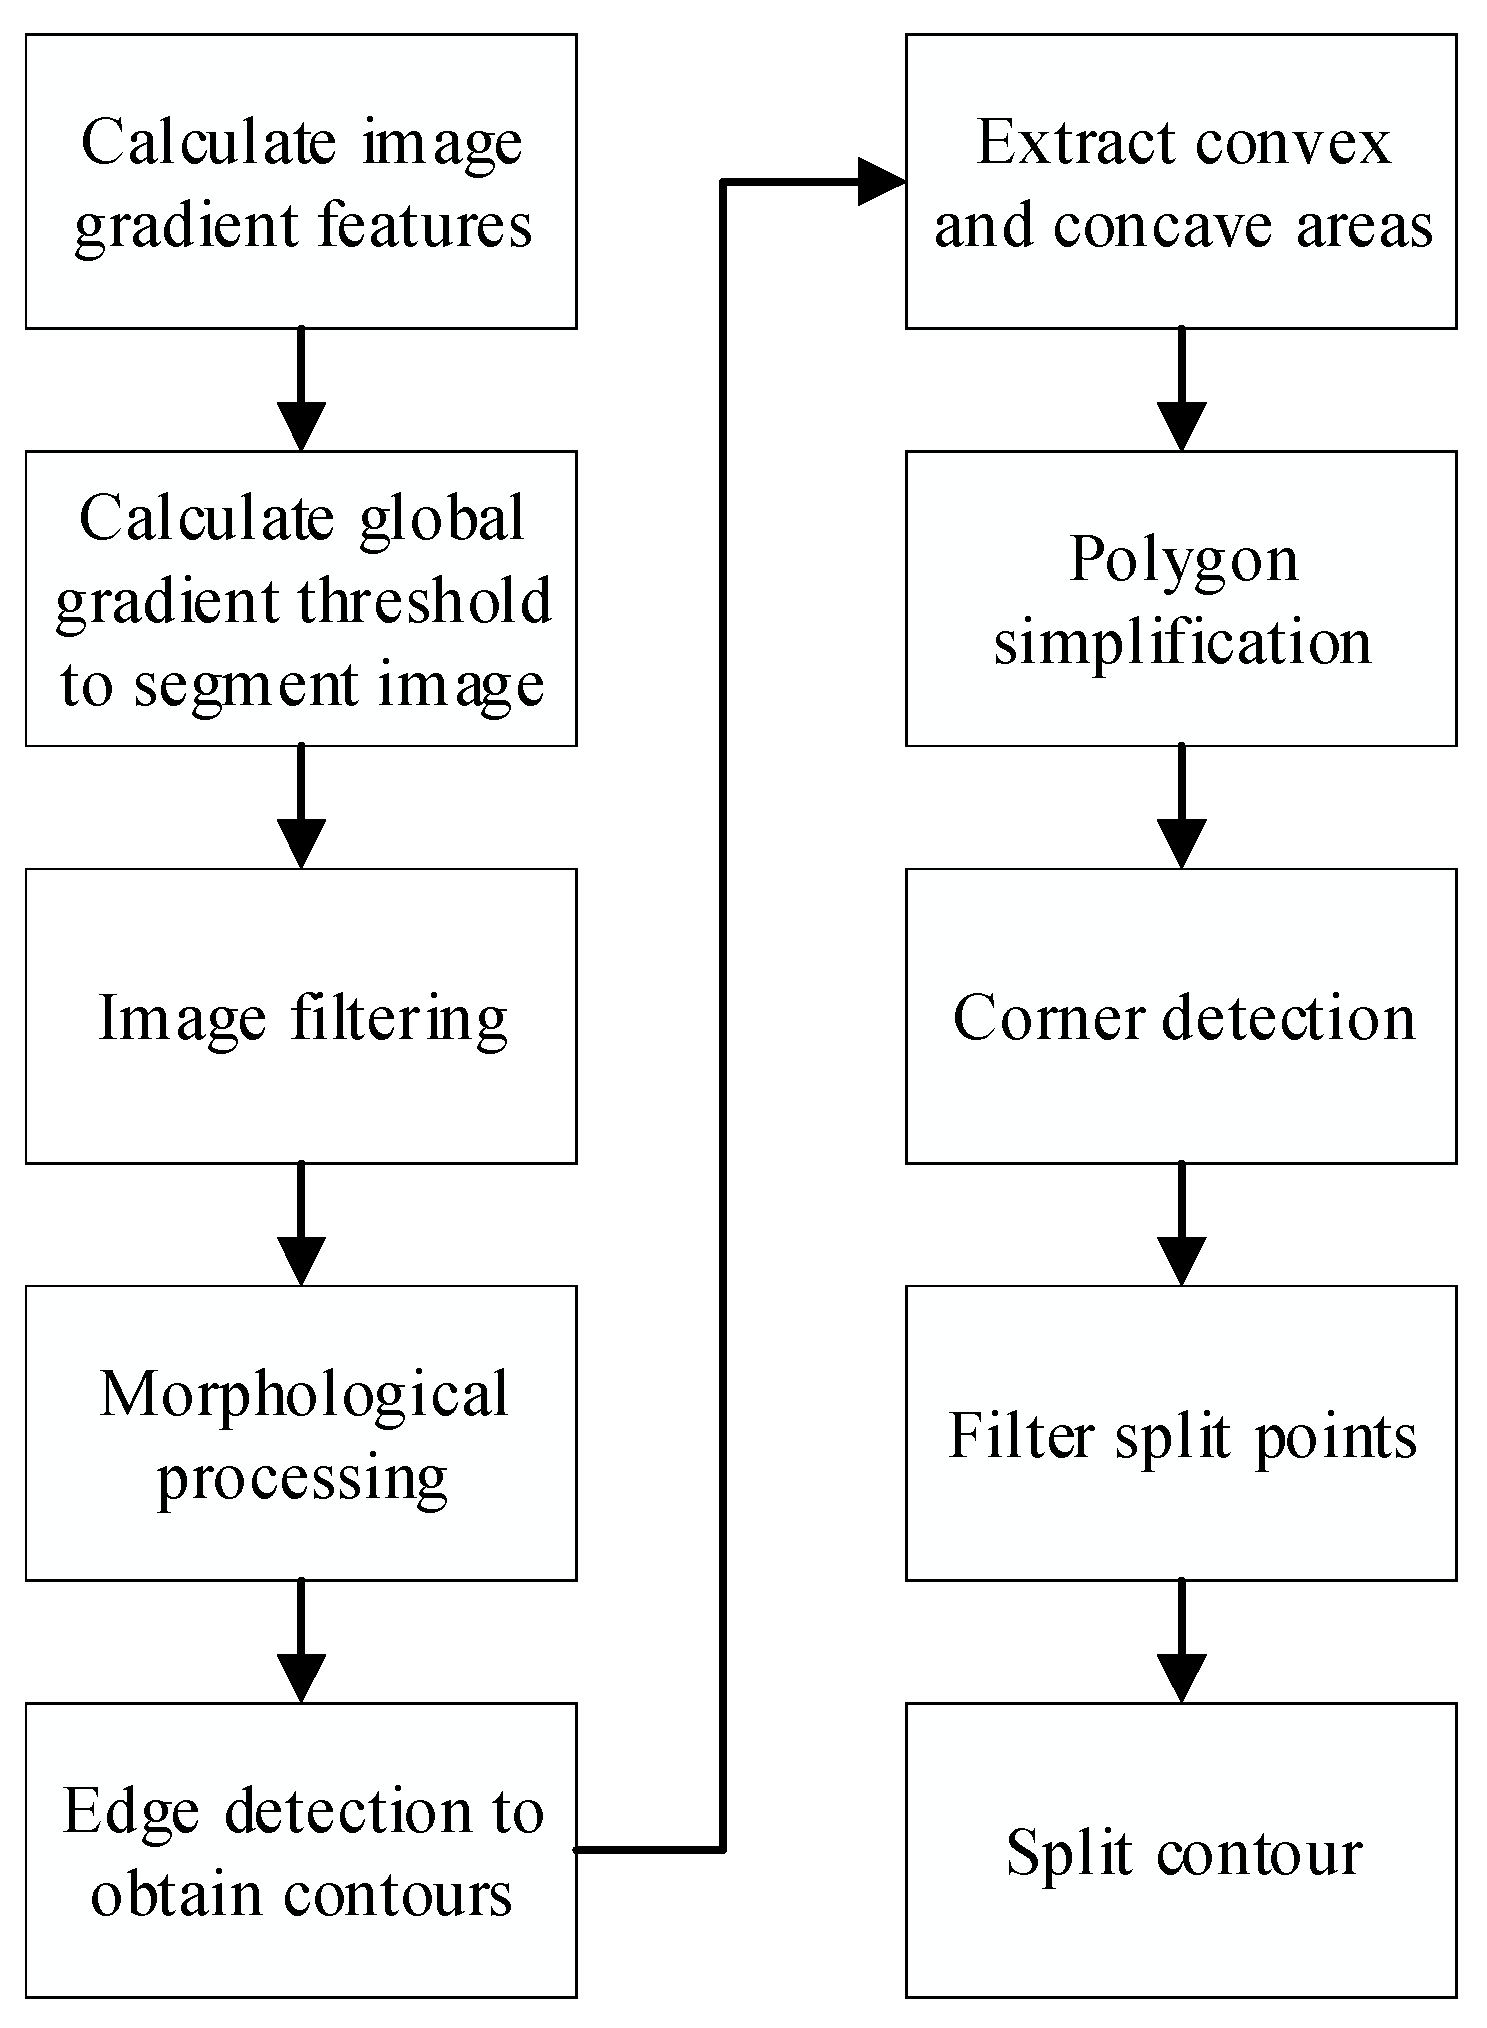
Due to the large difference in soil height and uneven illumination under the industrialized environment of Agaricus bisporus, according to the edge gradient characteristics in the image, a global gradient threshold is calculated to segment the image to obtain a binary image. Then, the binary image is filtered and morphologically processed, the contour is obtained by edge detection in the Canny operator, the convex hull of the overlapping Agaricus bisporus area is extracted, and the concave area is extracted to simplify the polygon. Finally, Shi-Tomasi corner detection is used to extract the vertices and determine the segmentation points, and the overlapping outlines of Agaricus bisporus are segmented. The specific process is shown in Figure 1.
2.1. Segmentation Based on Image Edge Gradient
Due to the complicated and diverse planting environment of Agaricus bisporus, the difference in soil height and the uneven illumination, the traditional threshold segmentation cannot fully extract the Agaricus bisporus area, which affects the accuracy of the edge fitting of Agaricus bisporus. Therefore, combining the image gradient feature to calculate the global gradient threshold to segment the image can obtain the bisporus area more completely.
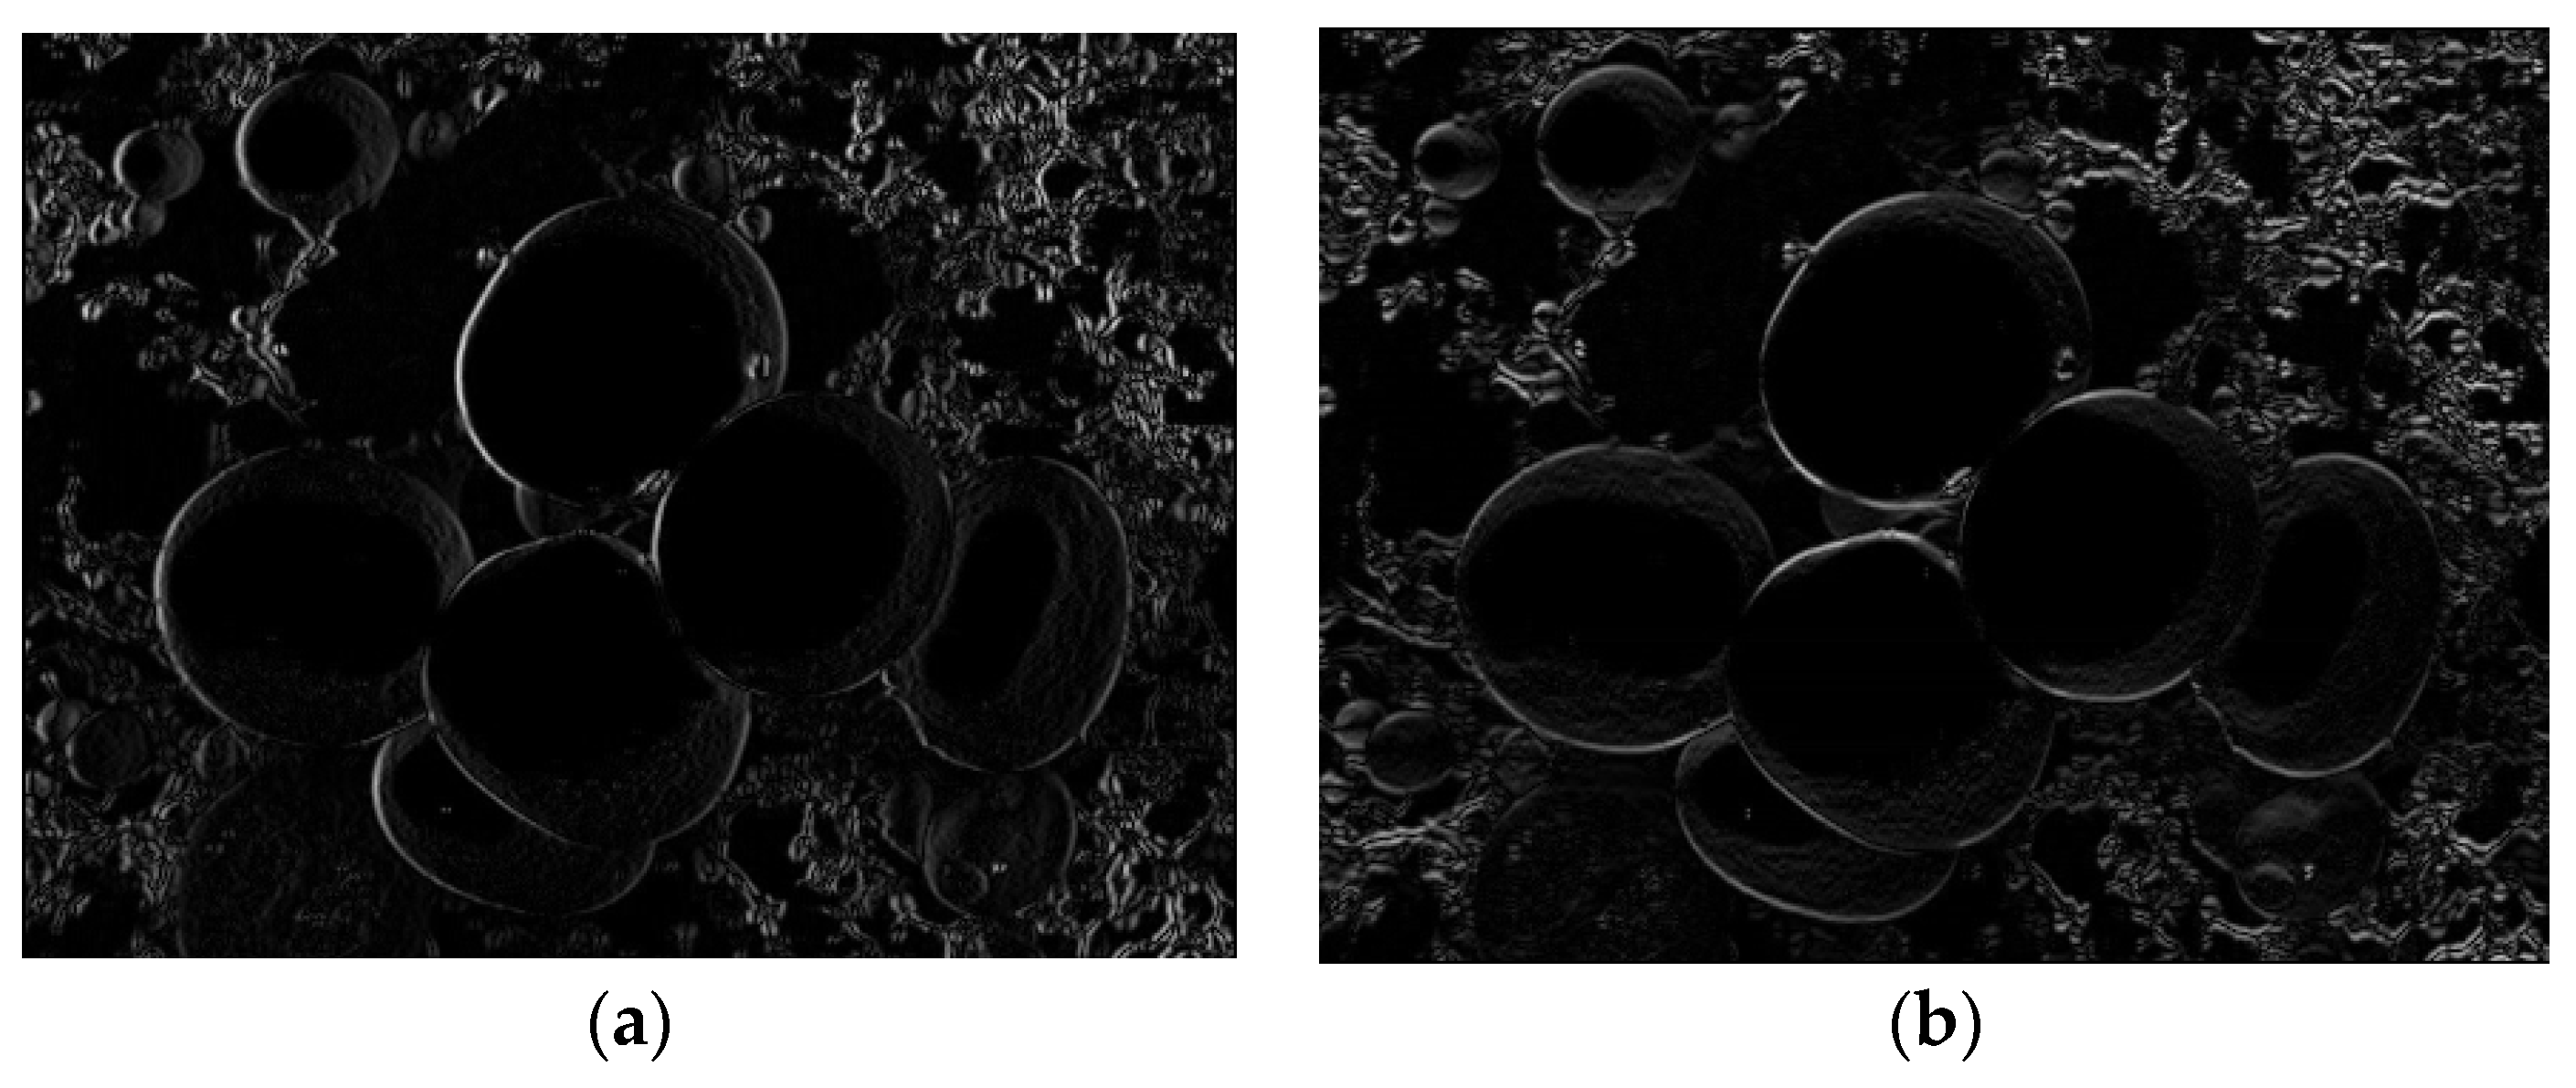
Using the gradient characteristics in the image [25,26], the gradients in the direction and the direction are calculated separately; that is, the first-order differentiation of the image is obtained. Assuming that the image is , the gradients of the direction and direction of the at the coordinate point are:
The gradient images of , corresponding to the and directions, are shown in Figure 2.
The maximum value of the gradient is calculated according to the gradient in the and directions:
According to the maximum value, the global gradient threshold is calculated:
where is the gray value at , are the number of rows and columns of the image.
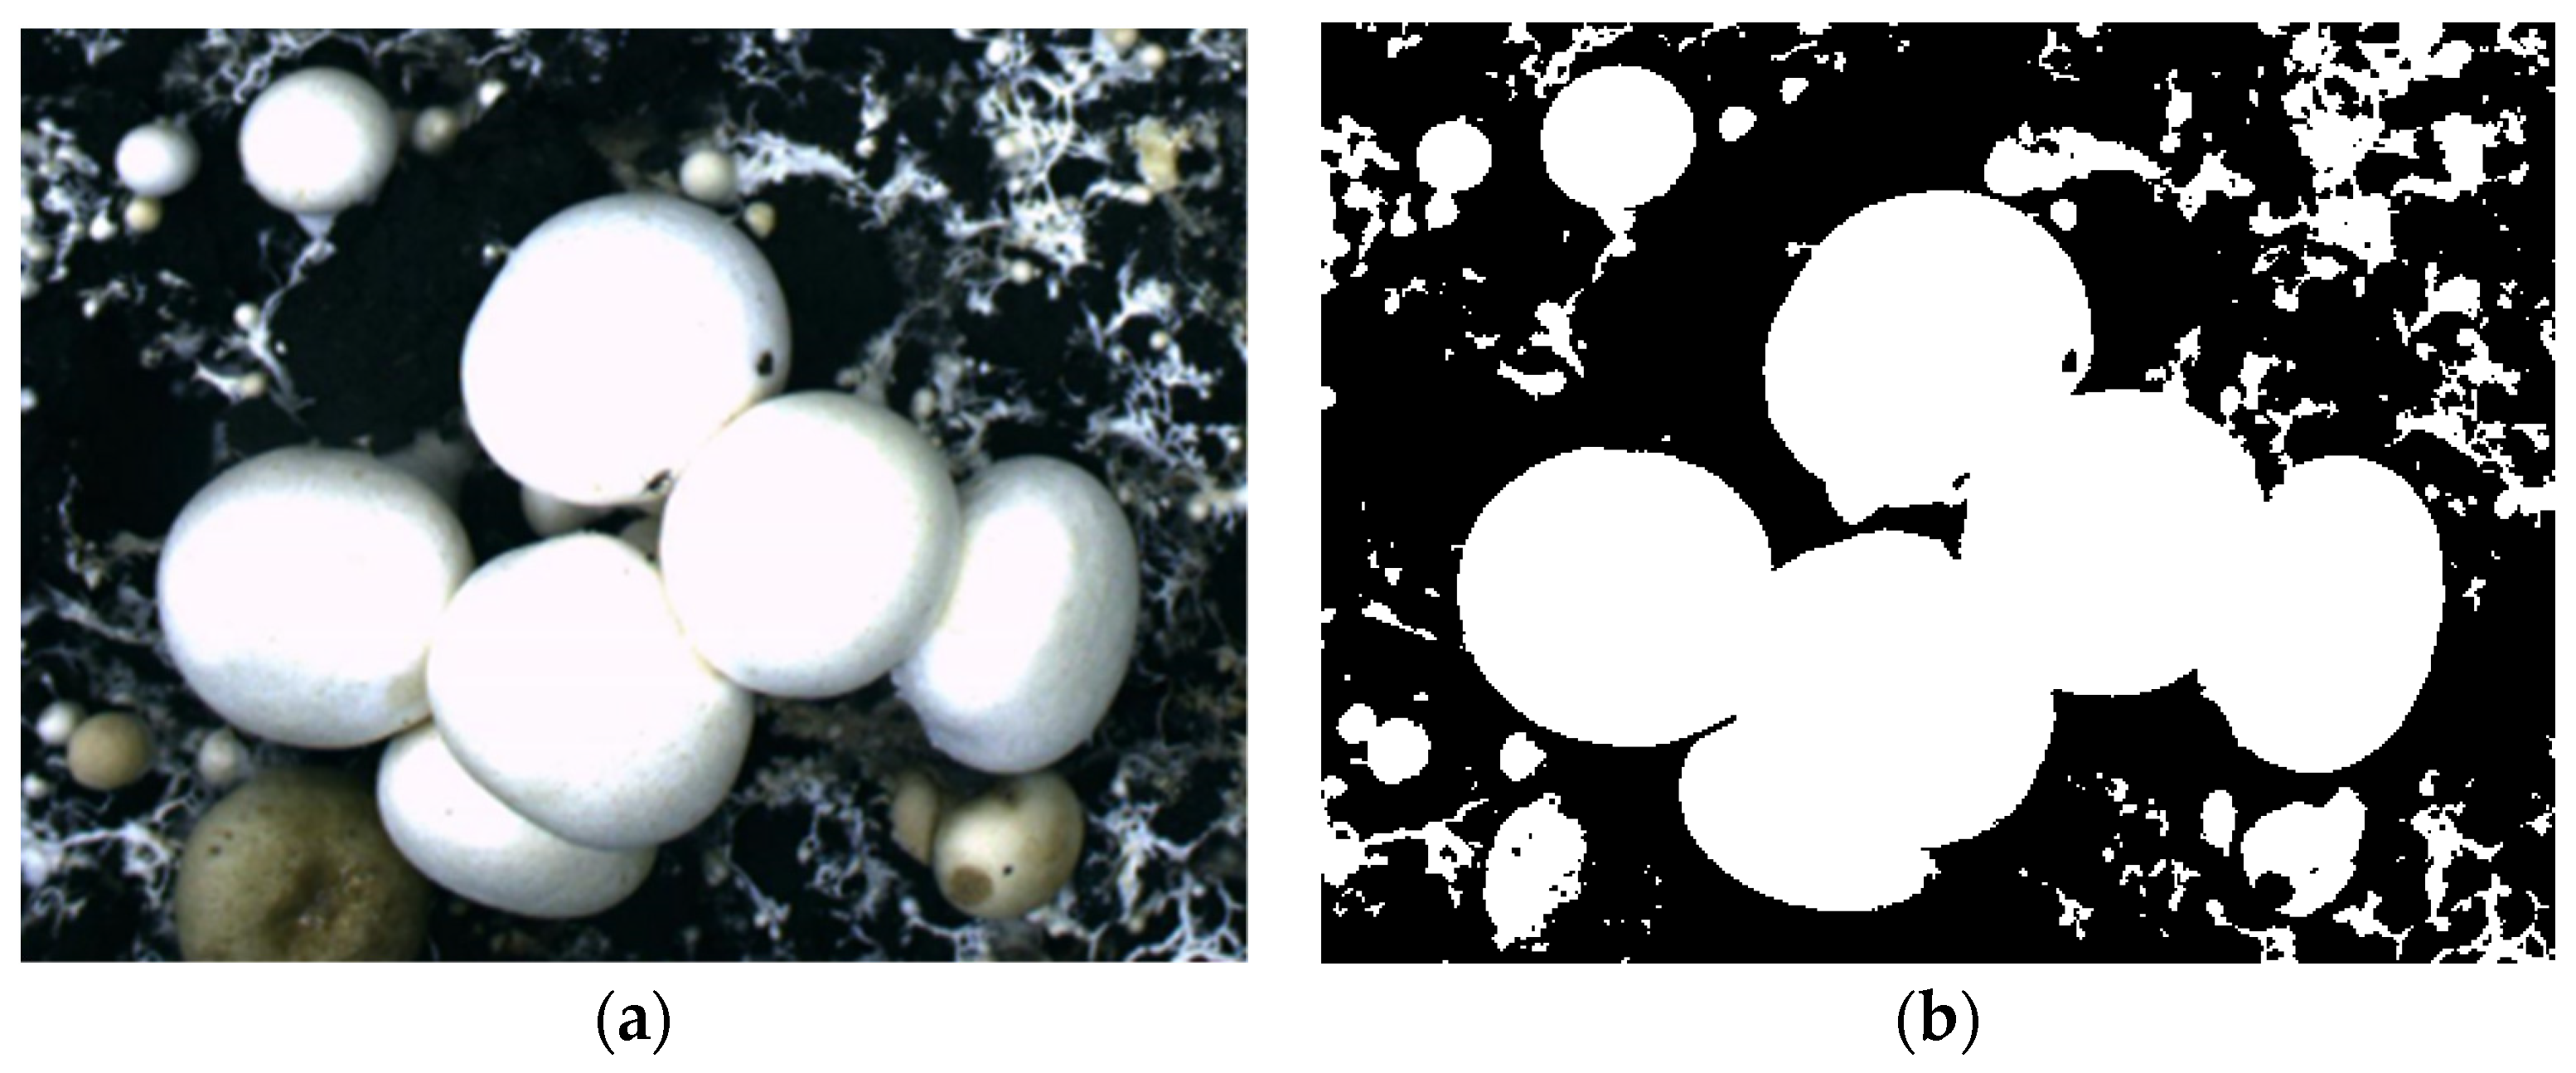
The global gradient threshold is used for image segmentation to extract the Agaricus bisporus region. The segmented binary image is:
The binary image obtained by this method is shown in Figure 3.
The median filter is used to remove impulsive noise from the binary image of Agaricus bisporus, while retaining the image edge details. The median filter output is:
where are the original image and the processed image, respectively, and is a two-dimensional template.
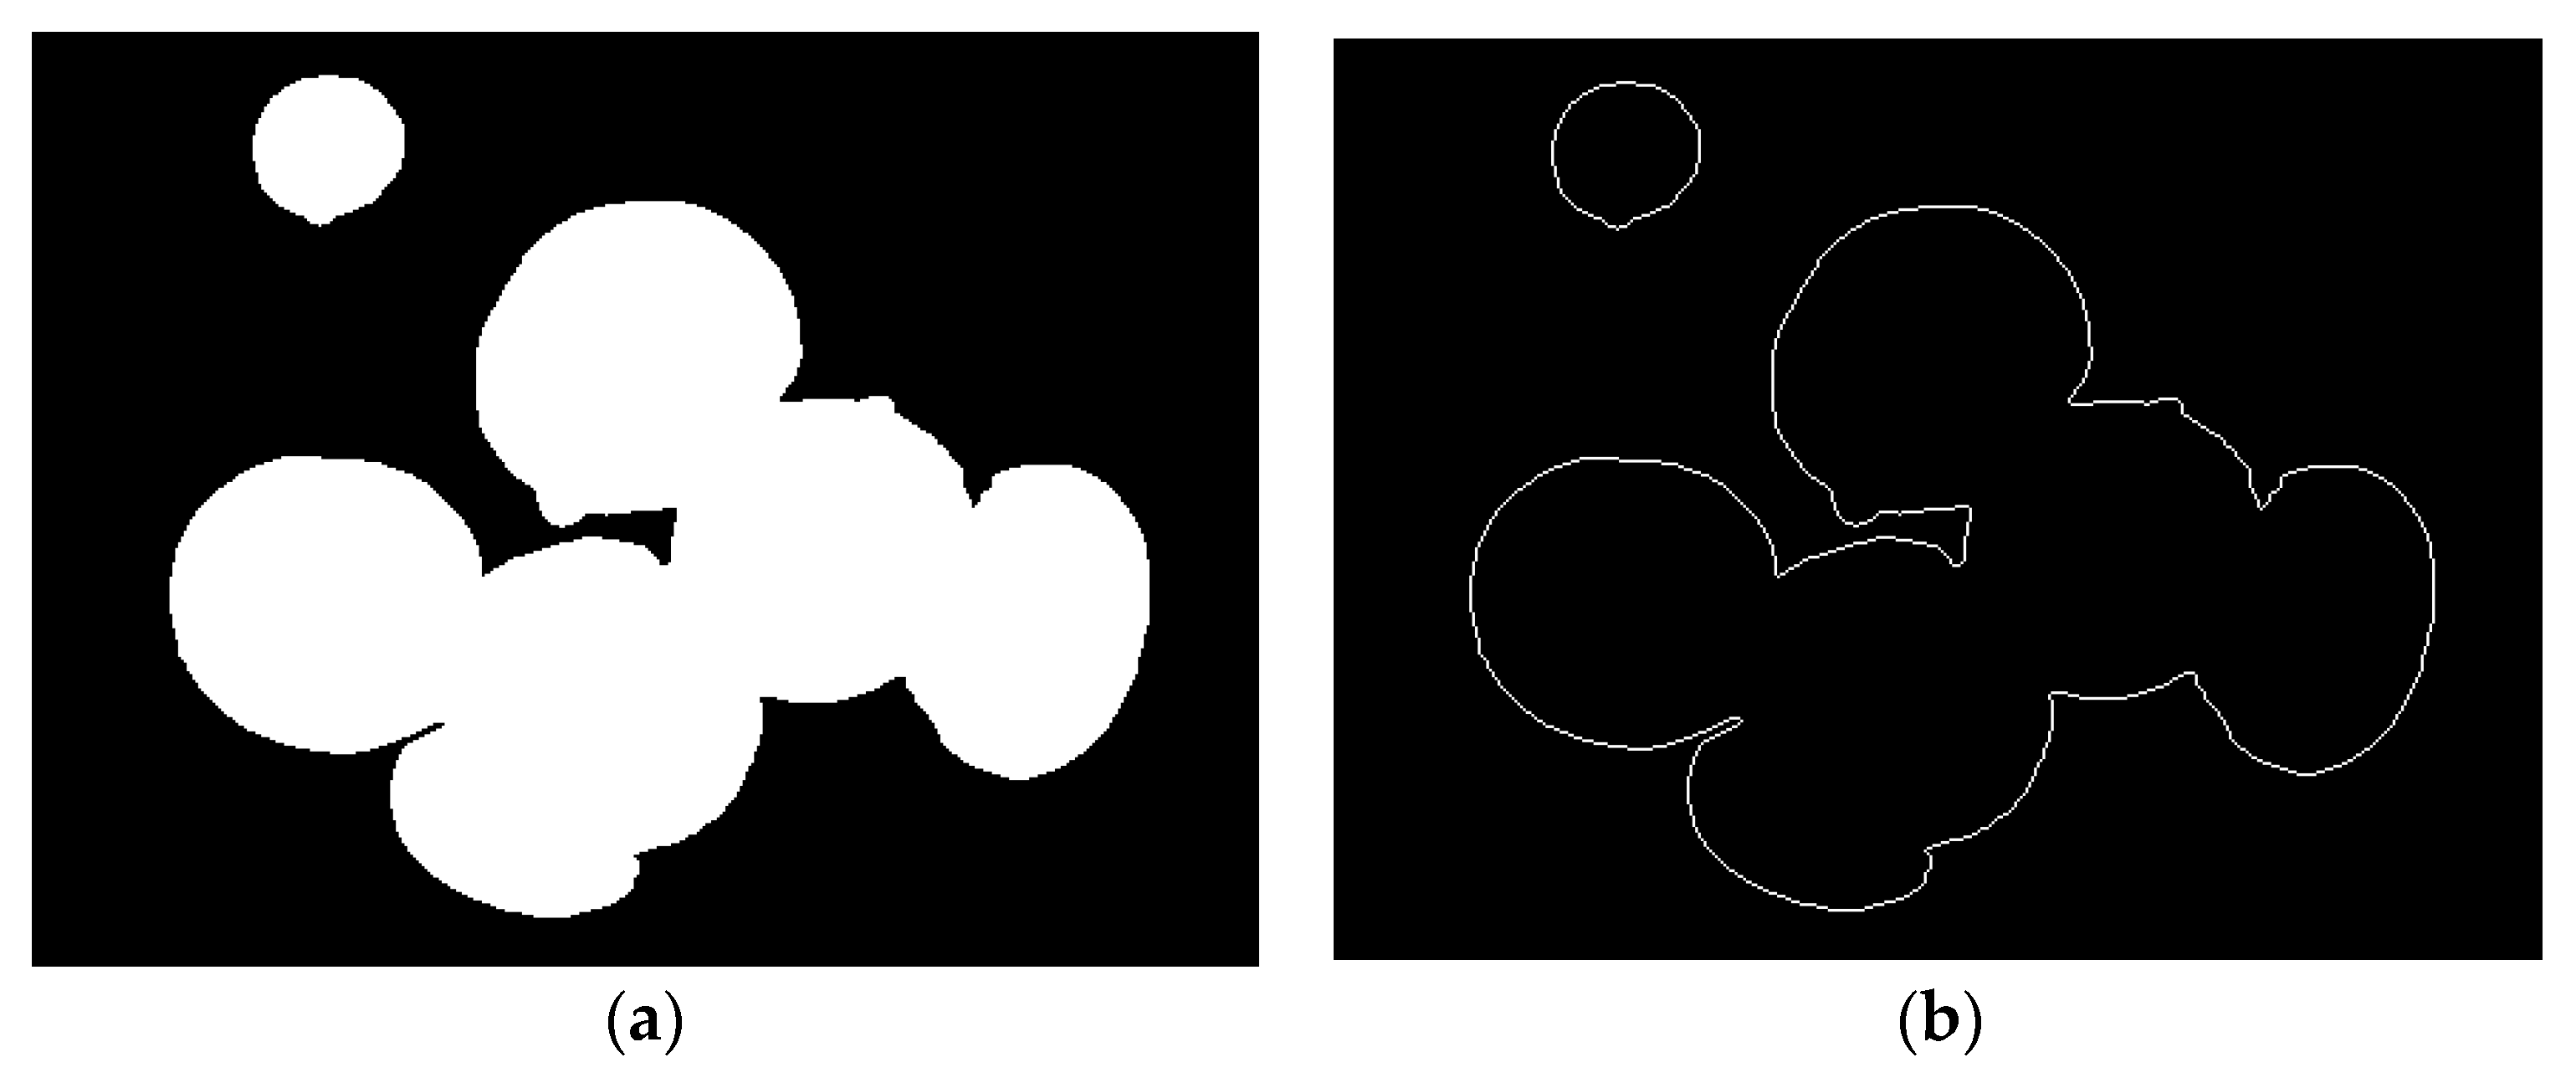
Fill the holes with an area of less than 40 pixels in the Agaricus bisporus area, and then perform morphological processing, using a 20-pixel diameter circle and the median filtered area to open the operation to remove impurities, such as mycelium in the soil. The results are shown in Figure 4a.
Finally, the Canny operator is used to detect the edge of the processed binary image, the number of pixels in each connected area is counted, and the independent border contour blackening process with a pixel area of less than 1200 is obtained to obtain the actual contour of Agaricus bisporus. The result is shown in Figure 4b as follows.
2.2. Extraction of Convex and Concave Areas
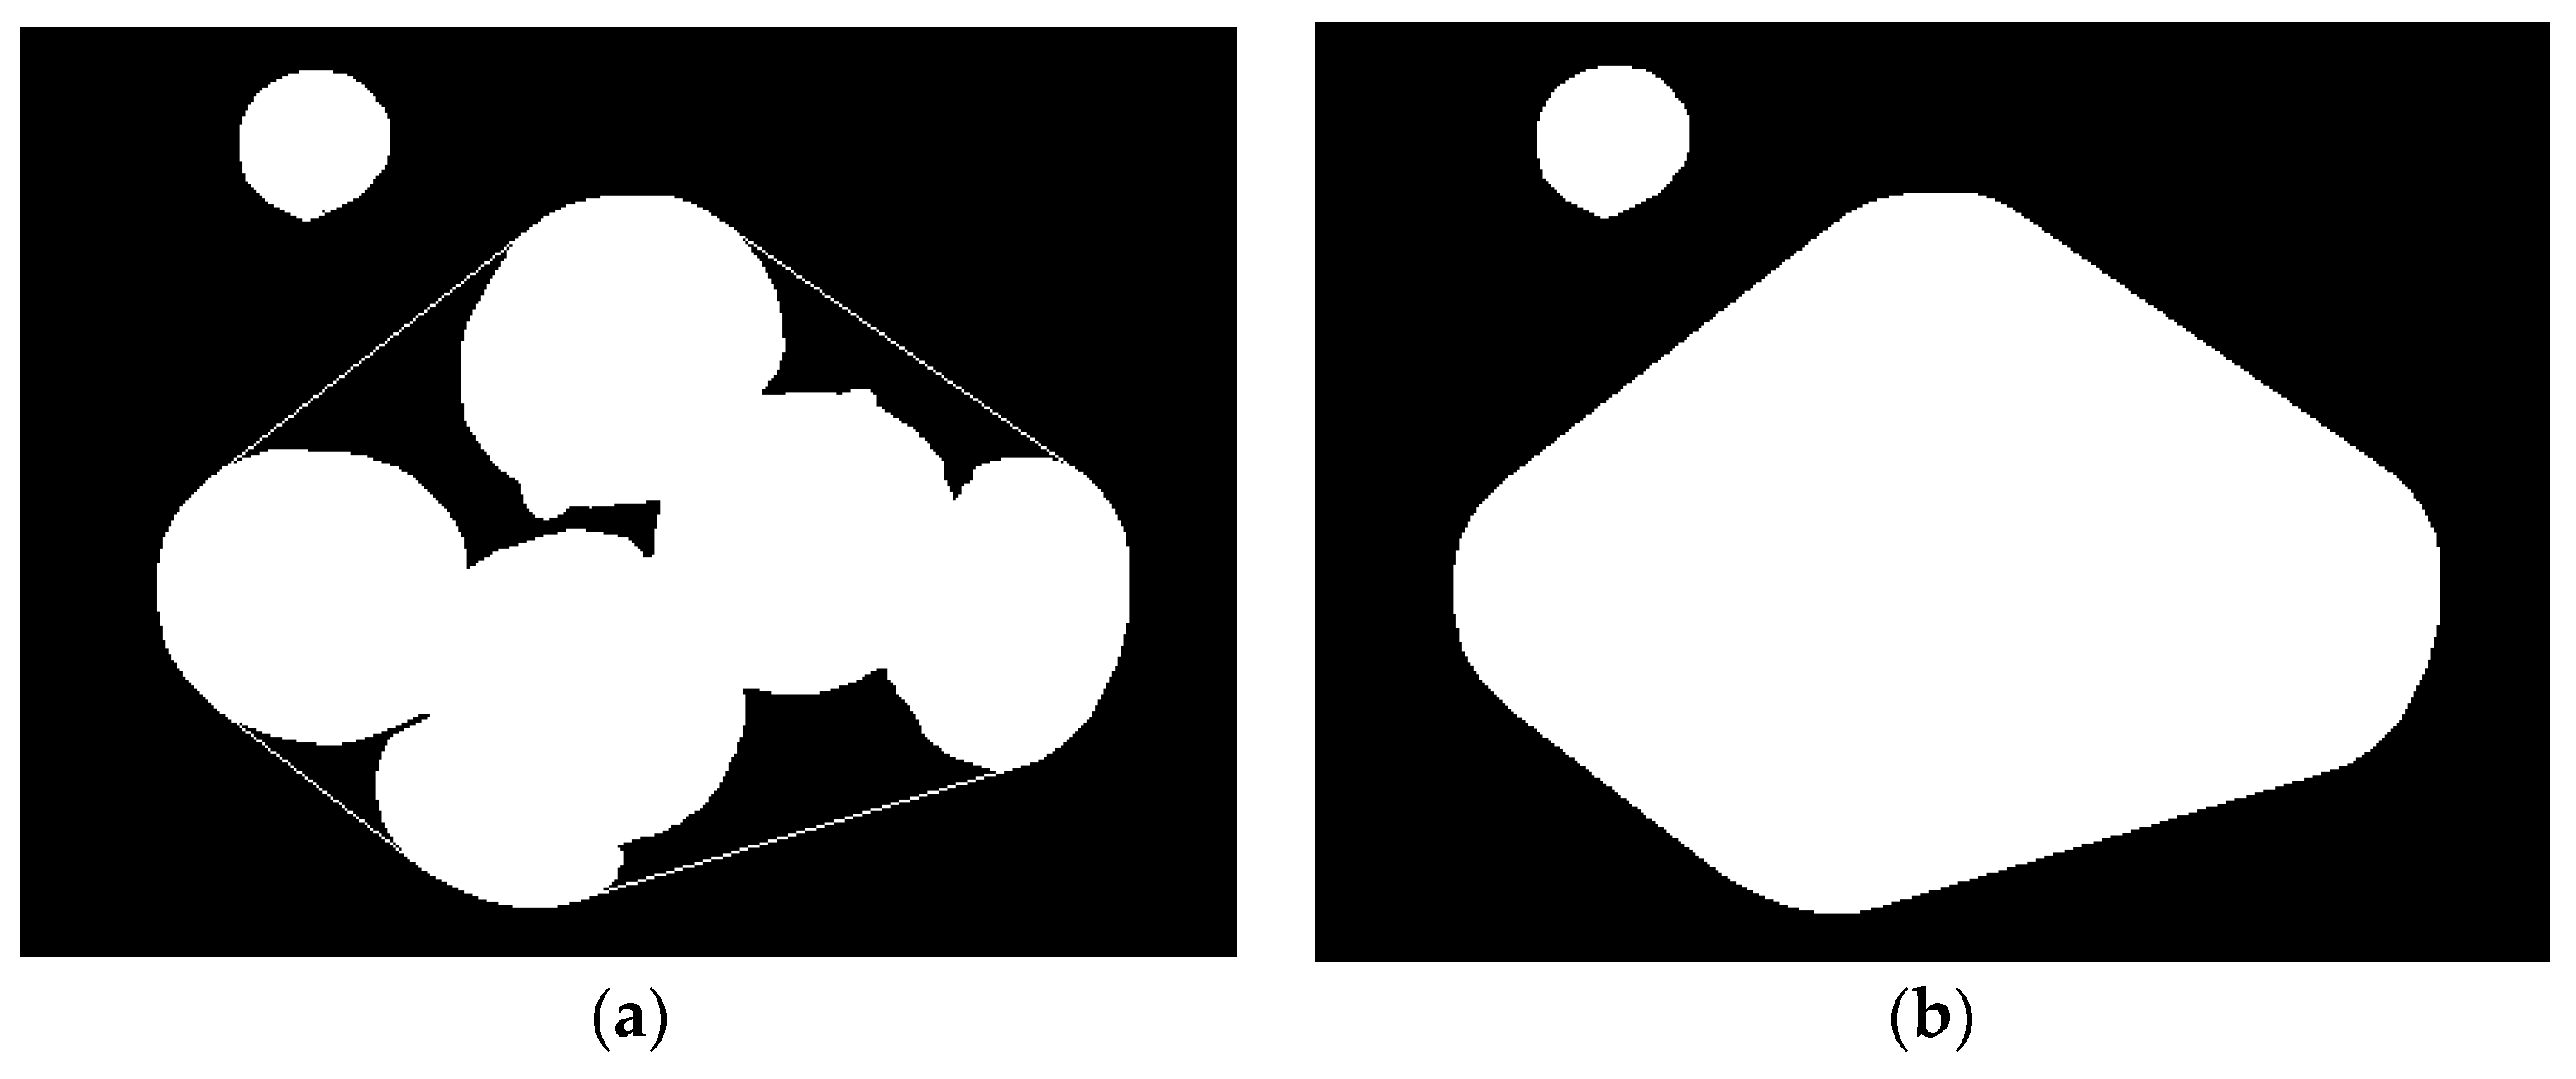
The convex hull of the overlapping Agaricus bisporus area is obtained by the volume wrapped convex hull algorithm [27,28], and the outermost points of the point set in the connected area are connected to form a convex hull, as shown in Figure 5a. The convex hull curve completely encloses the Agaricus bisporus area and obtains the area enclosed by the convex hull curve. The result is shown in Figure 5b.
The pixel area of the area enclosed by the convex hull curve and the overlapping spore mushroom area can be obtained as a concave area:
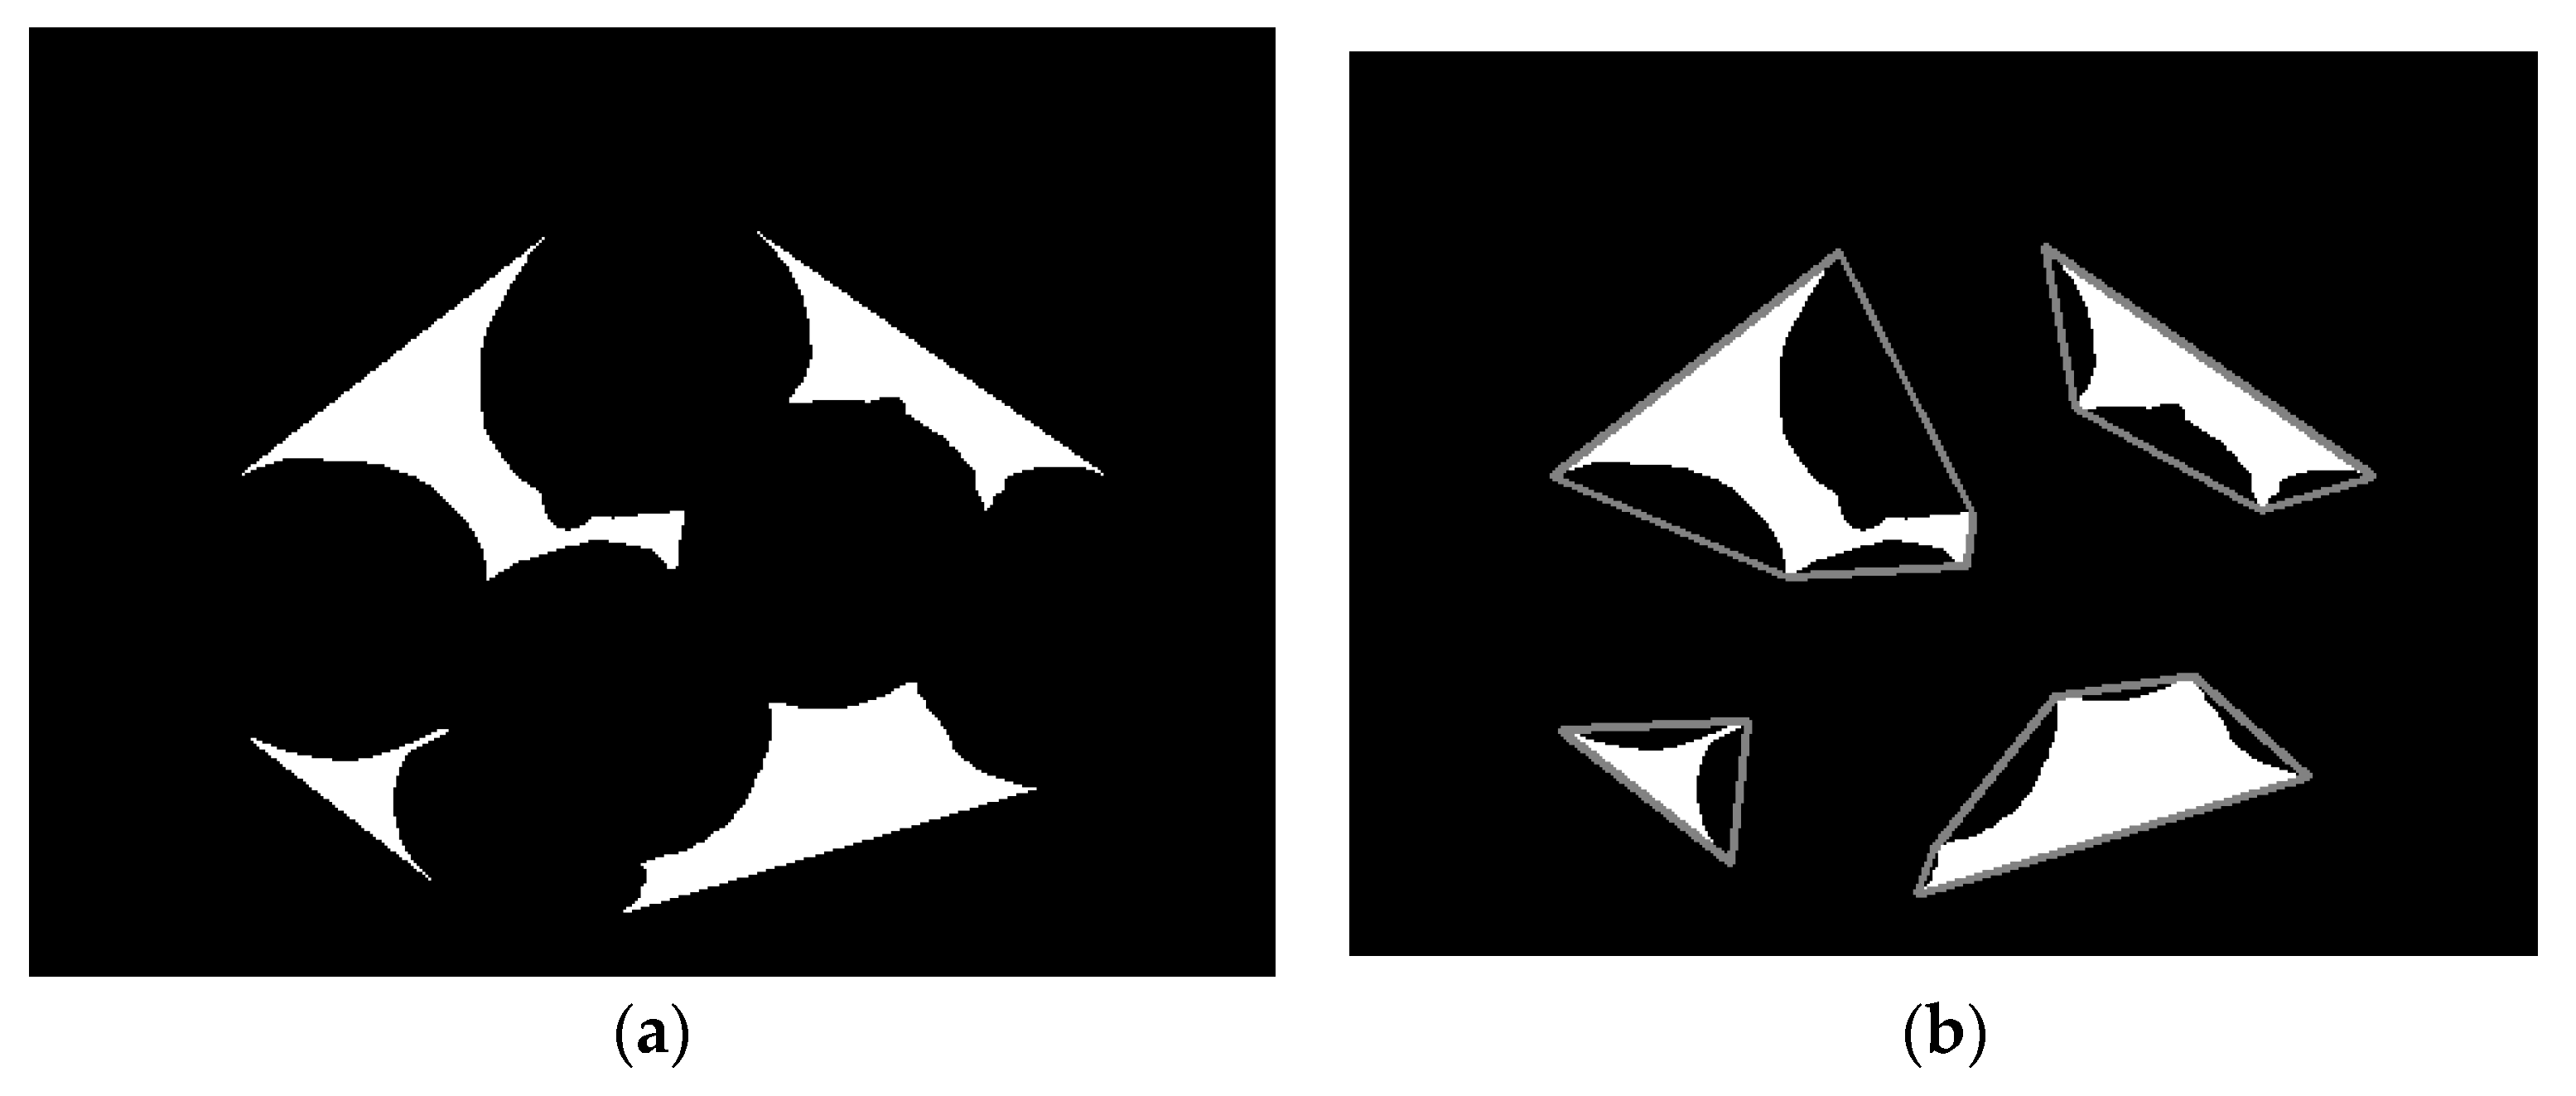
where , respectively, represent the overlapping Agaricus bisporus area, convex hull area and the requested concave area. The results are shown in Figure 6a.
Convex polygon simplification for each acquired concave region and the result of polygon simplification are shown in Figure 6b.
2.3. Corner Detection and Contour Segmentation
Harris corner detection is used to extract the vertices of the simplified polygons in the concave area. The basic idea of Harris corner detection is to move in all directions on the image through a sliding window and compare the gray changes in pixels before and after moving. If there is a large gray change, there must be corners in the window [29].
The extracted vertices are shown in Figure 7a, and the extracted vertices are displayed on the outline, as shown in Figure 7b. The eigenvalue analysis of the autocorrelation matrix produces two eigenvalues and two feature direction vectors. The response function R used by Harris is:
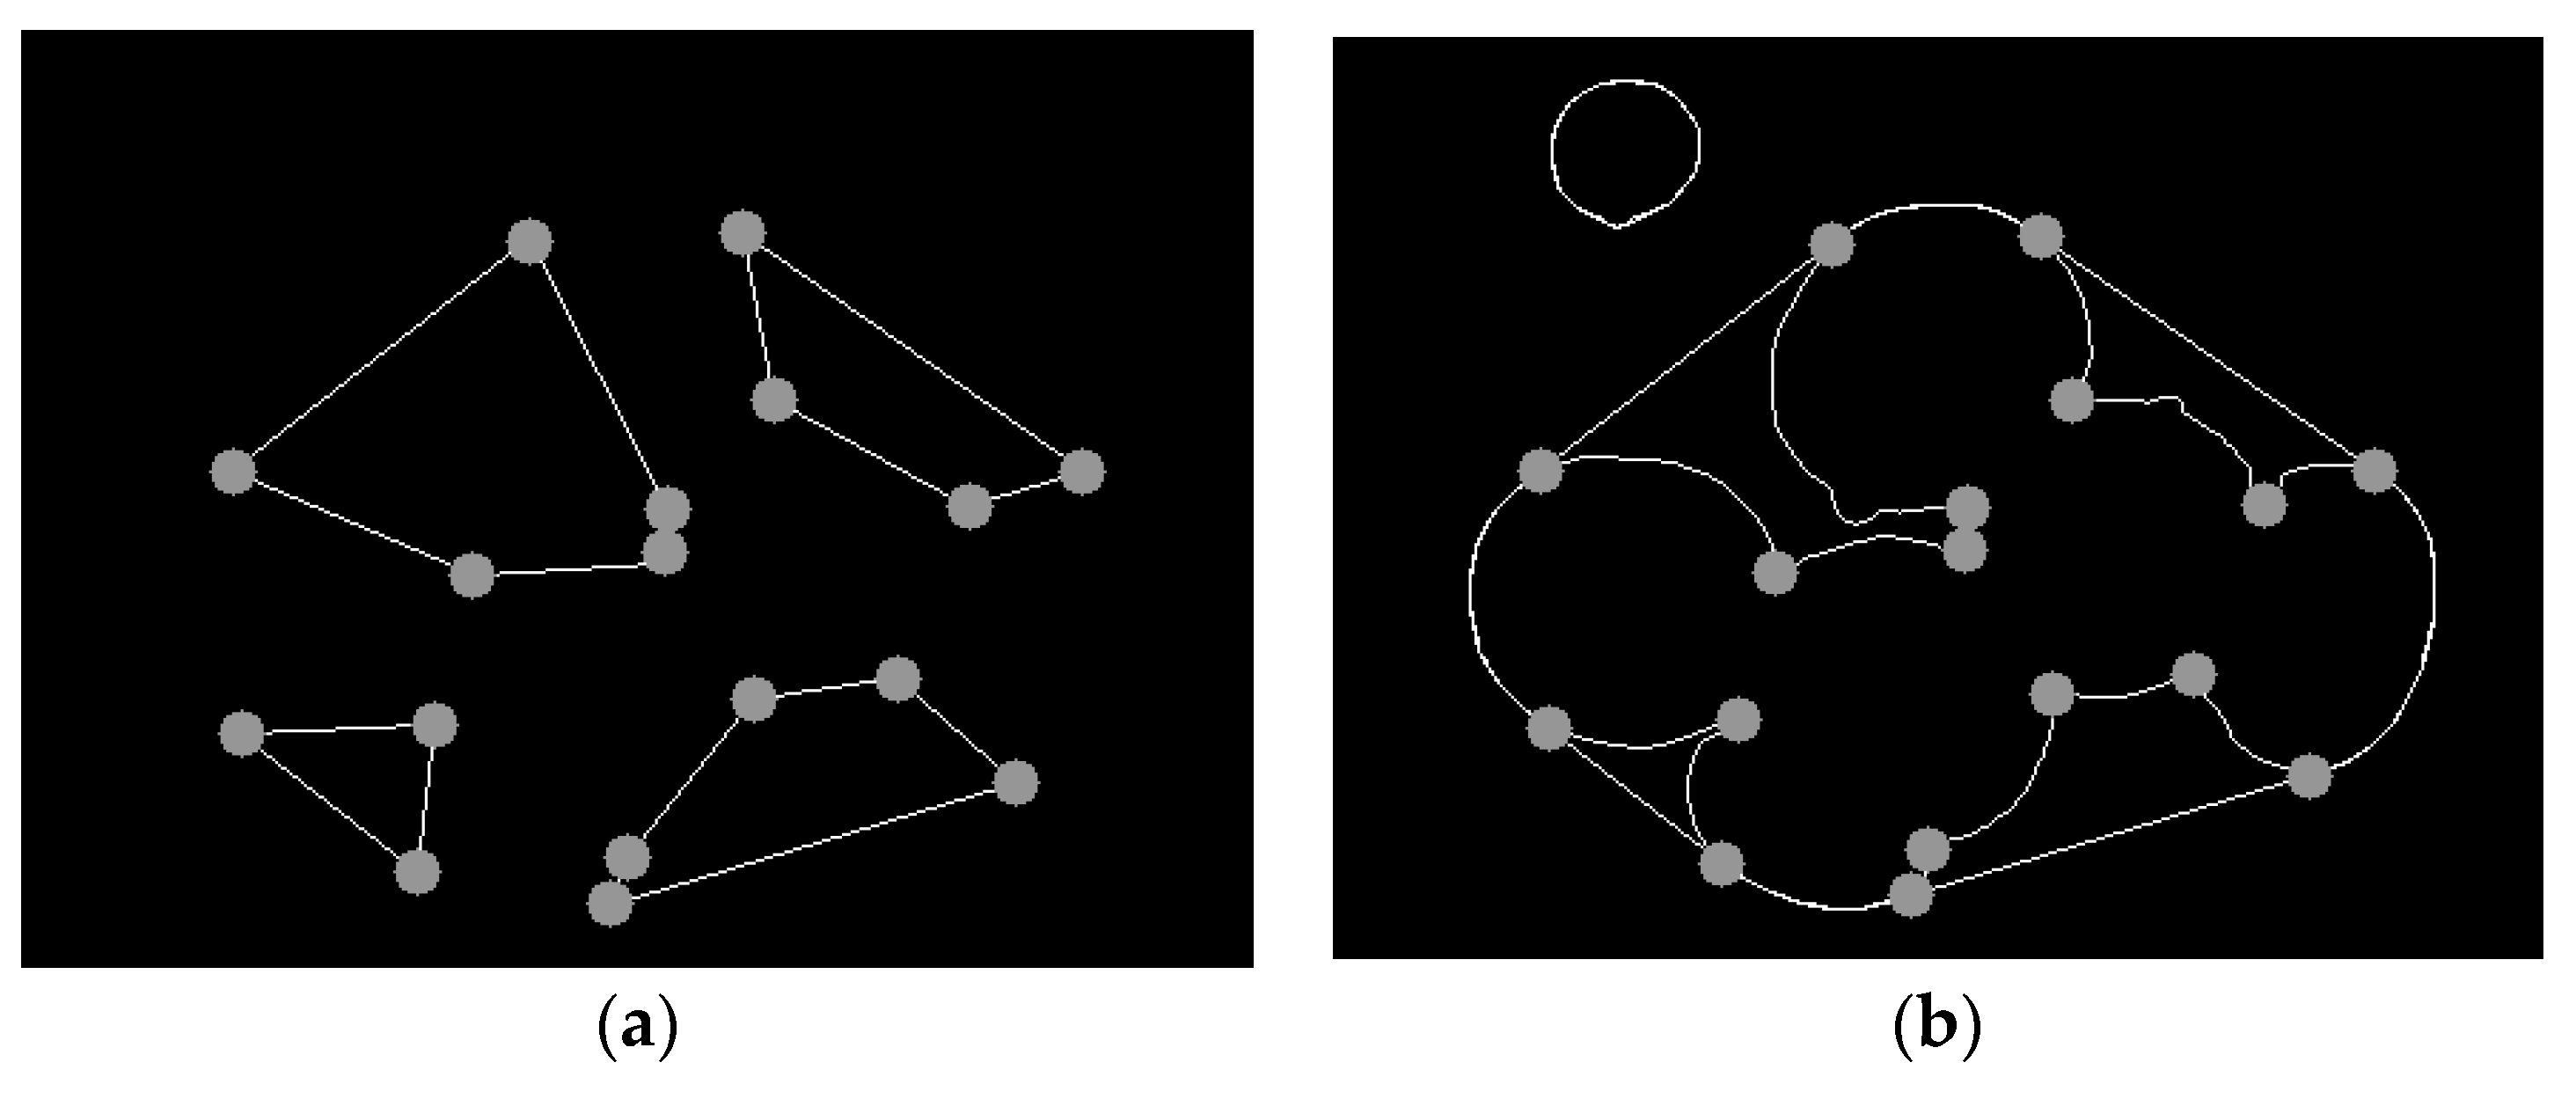
In order to obtain the segmentation points of the overlapping Agaricus bisporus contours, by analyzing the distance relationship between each vertex and the convex shell contour of Agaricus bisporus, the vertices with a contour distance greater than 2 pixels are screened to determine the segmentation points. The segmentation point is shown in Figure 8a, and finally, the segmentation of the overlapping Agaricus bisporus outline is completed, as shown in Figure 8b.
3. Overlapping Agaricus bisporus Outline Grouping
After the outline of the overlapping Agaricus bisporus is divided, the single Agaricus bisporus may produce multiple contour fragments, so it is necessary to merge all the contours of the same Agaricus bisporus. The contour merging and grouping are abstracted into a combinatorial optimization problem, which is solved using a branch-defining algorithm [30,31,32] to obtain the optimal solution for the overlapping grouping of Agaricus bisporus.
3.1. Problem Description
Let be the set of segmented segments after segmentation, and group the contours in this set into d subsets (), so that the contours belonging to the same Agaricus bisporus merge. Let be the index number of the group to which the contour segment belongs, then use to represent the set of all group index numbers.
The set of index numbers of all possible groupings in the contour segment is included in the real number set . The grouping criterion is given by the evaluation function of . The evaluation function will measure the similarity between the group and the real Agaricus bisporus contour segment group, so this grouping problem is to find the optimal solution set , so that the evaluation value of the grouping criterion is the smallest:
3.2. Branch Definition Algorithm Grouping
CONTOUR grouping is a combinatorial optimization problem. There can be at most solutions, and the optimal solution is determined by evaluation criterion . However, such optimization problems will become very difficult because the number of solutions will increase exponentially [33]. The branch definition algorithm can avoid exhaustive search using the optimal solution set and can define the boundary for the evaluation function.
The partial solution calculated by the branch definition algorithm is . Assuming that the lower bound of the value of the objective evaluation function is , then:
Suppose and are two sets of solutions. If the lower bound of is greater than the lower bound of , and the new lower bound is , then:
Assuming that is the upper bound of the optimal solution of evaluation function , then:
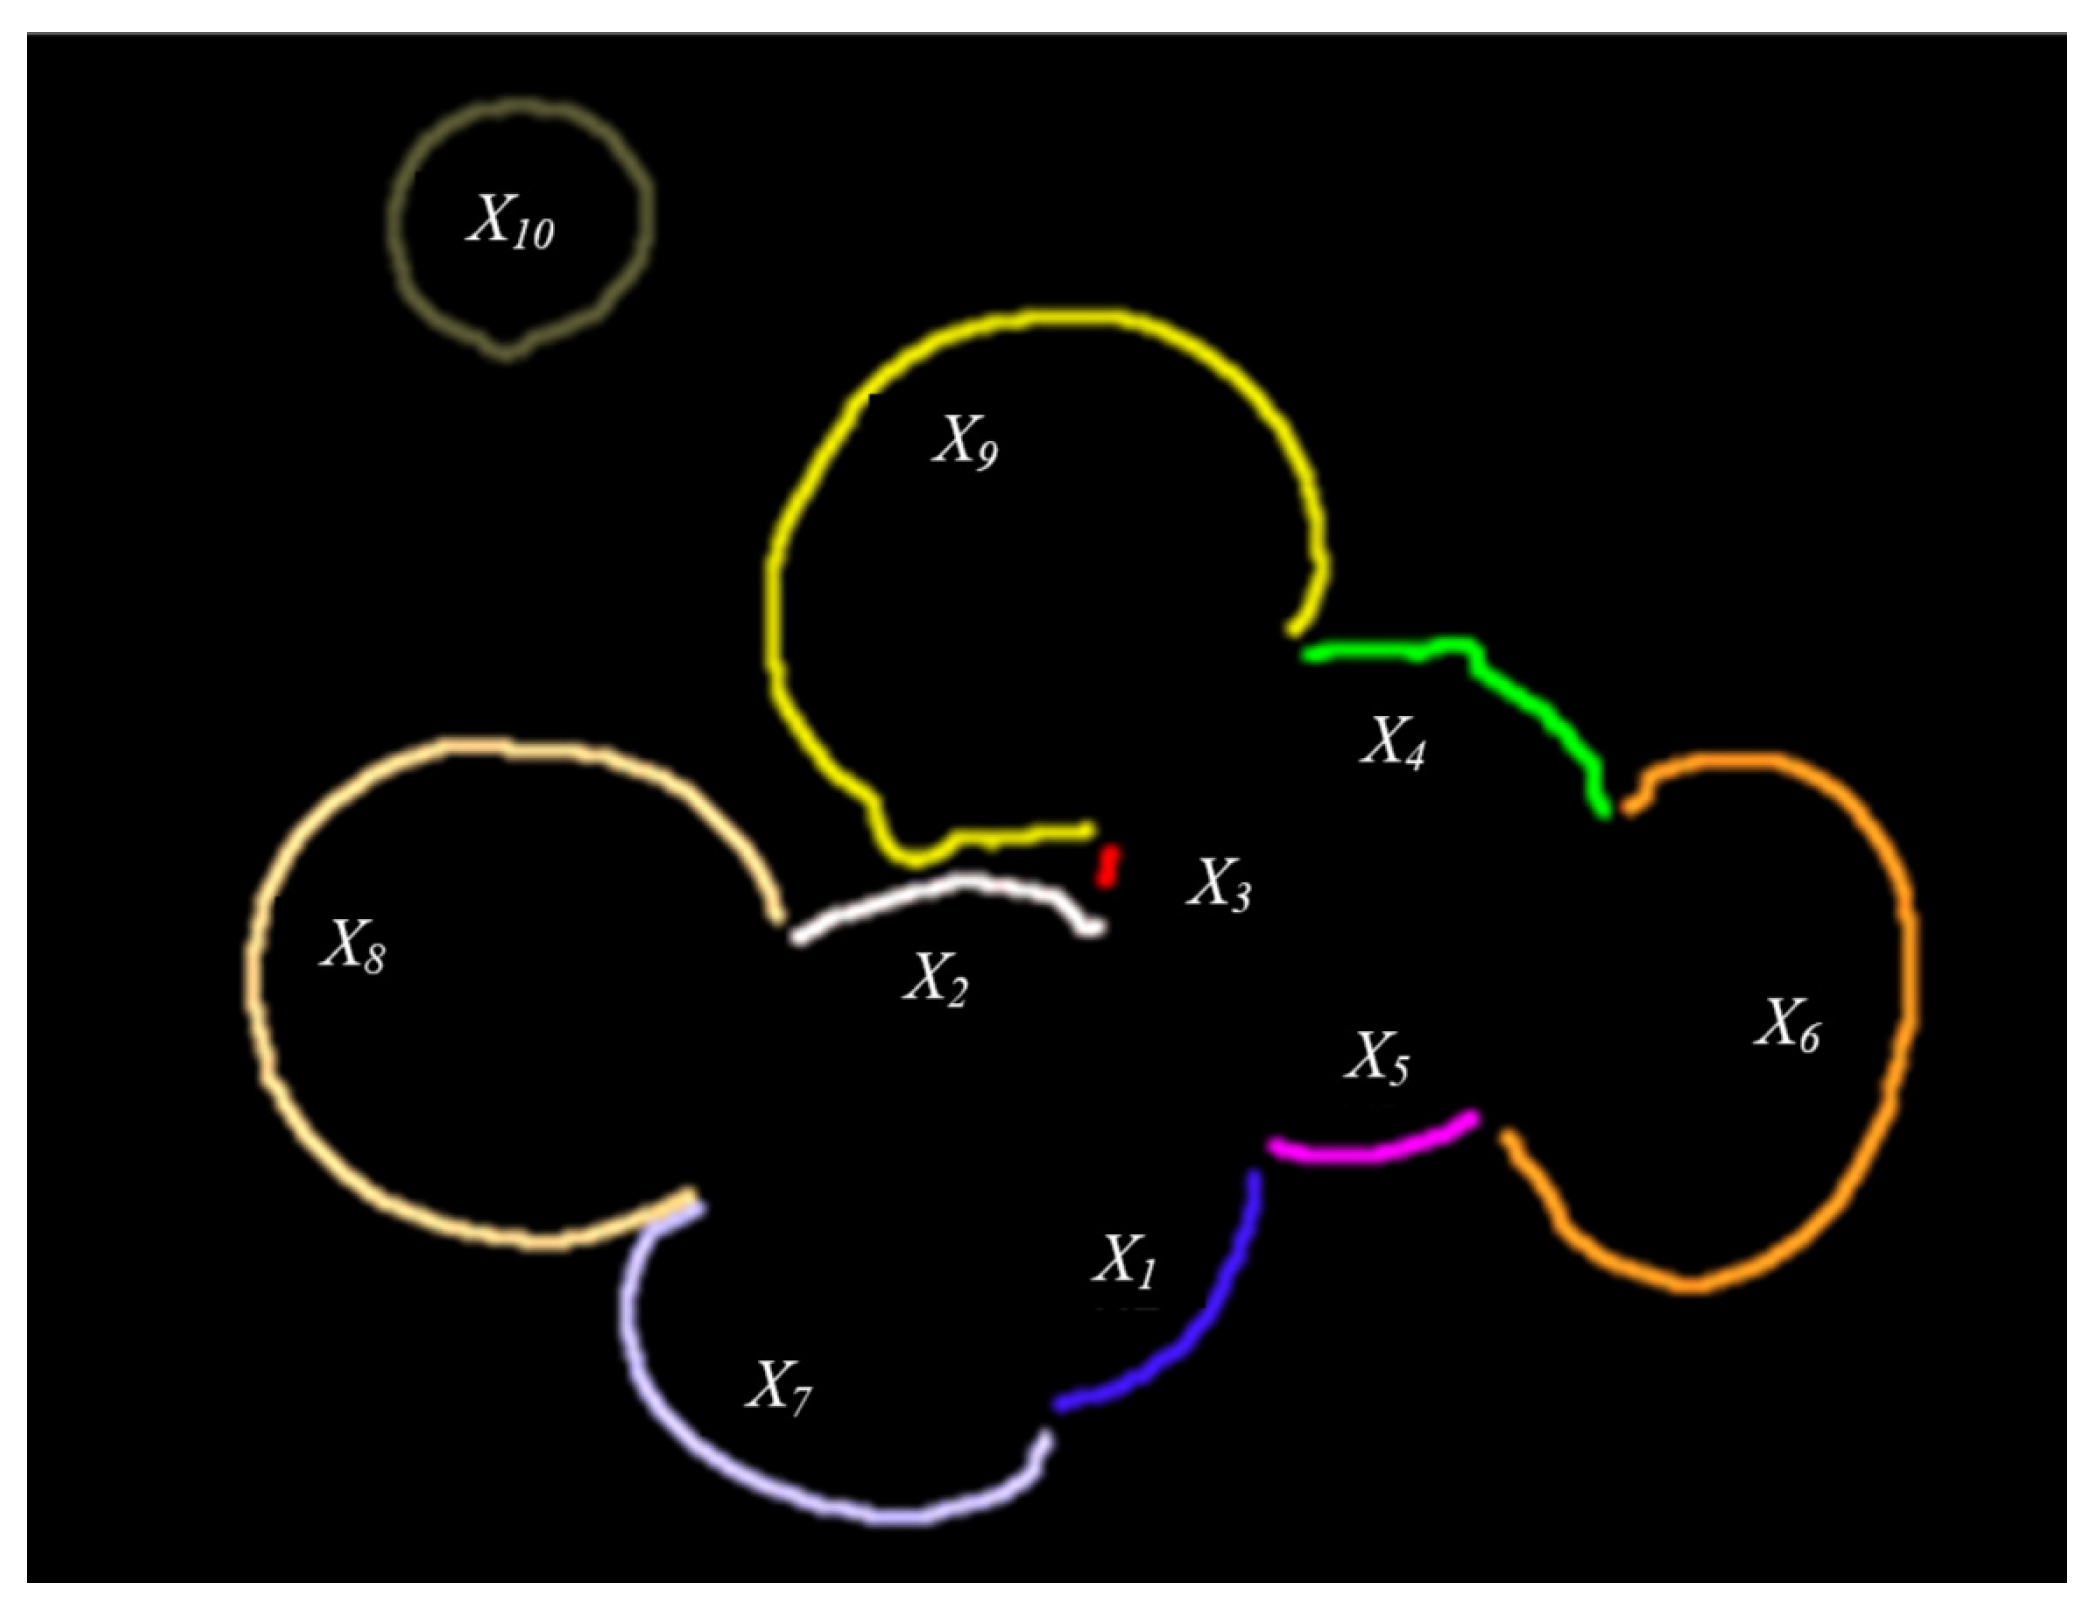
Therefore, given the restricted ranges in Equations (10) and (12), the suboptimal solution set can be removed. As shown in Figure 9, the contour segment is represented as .
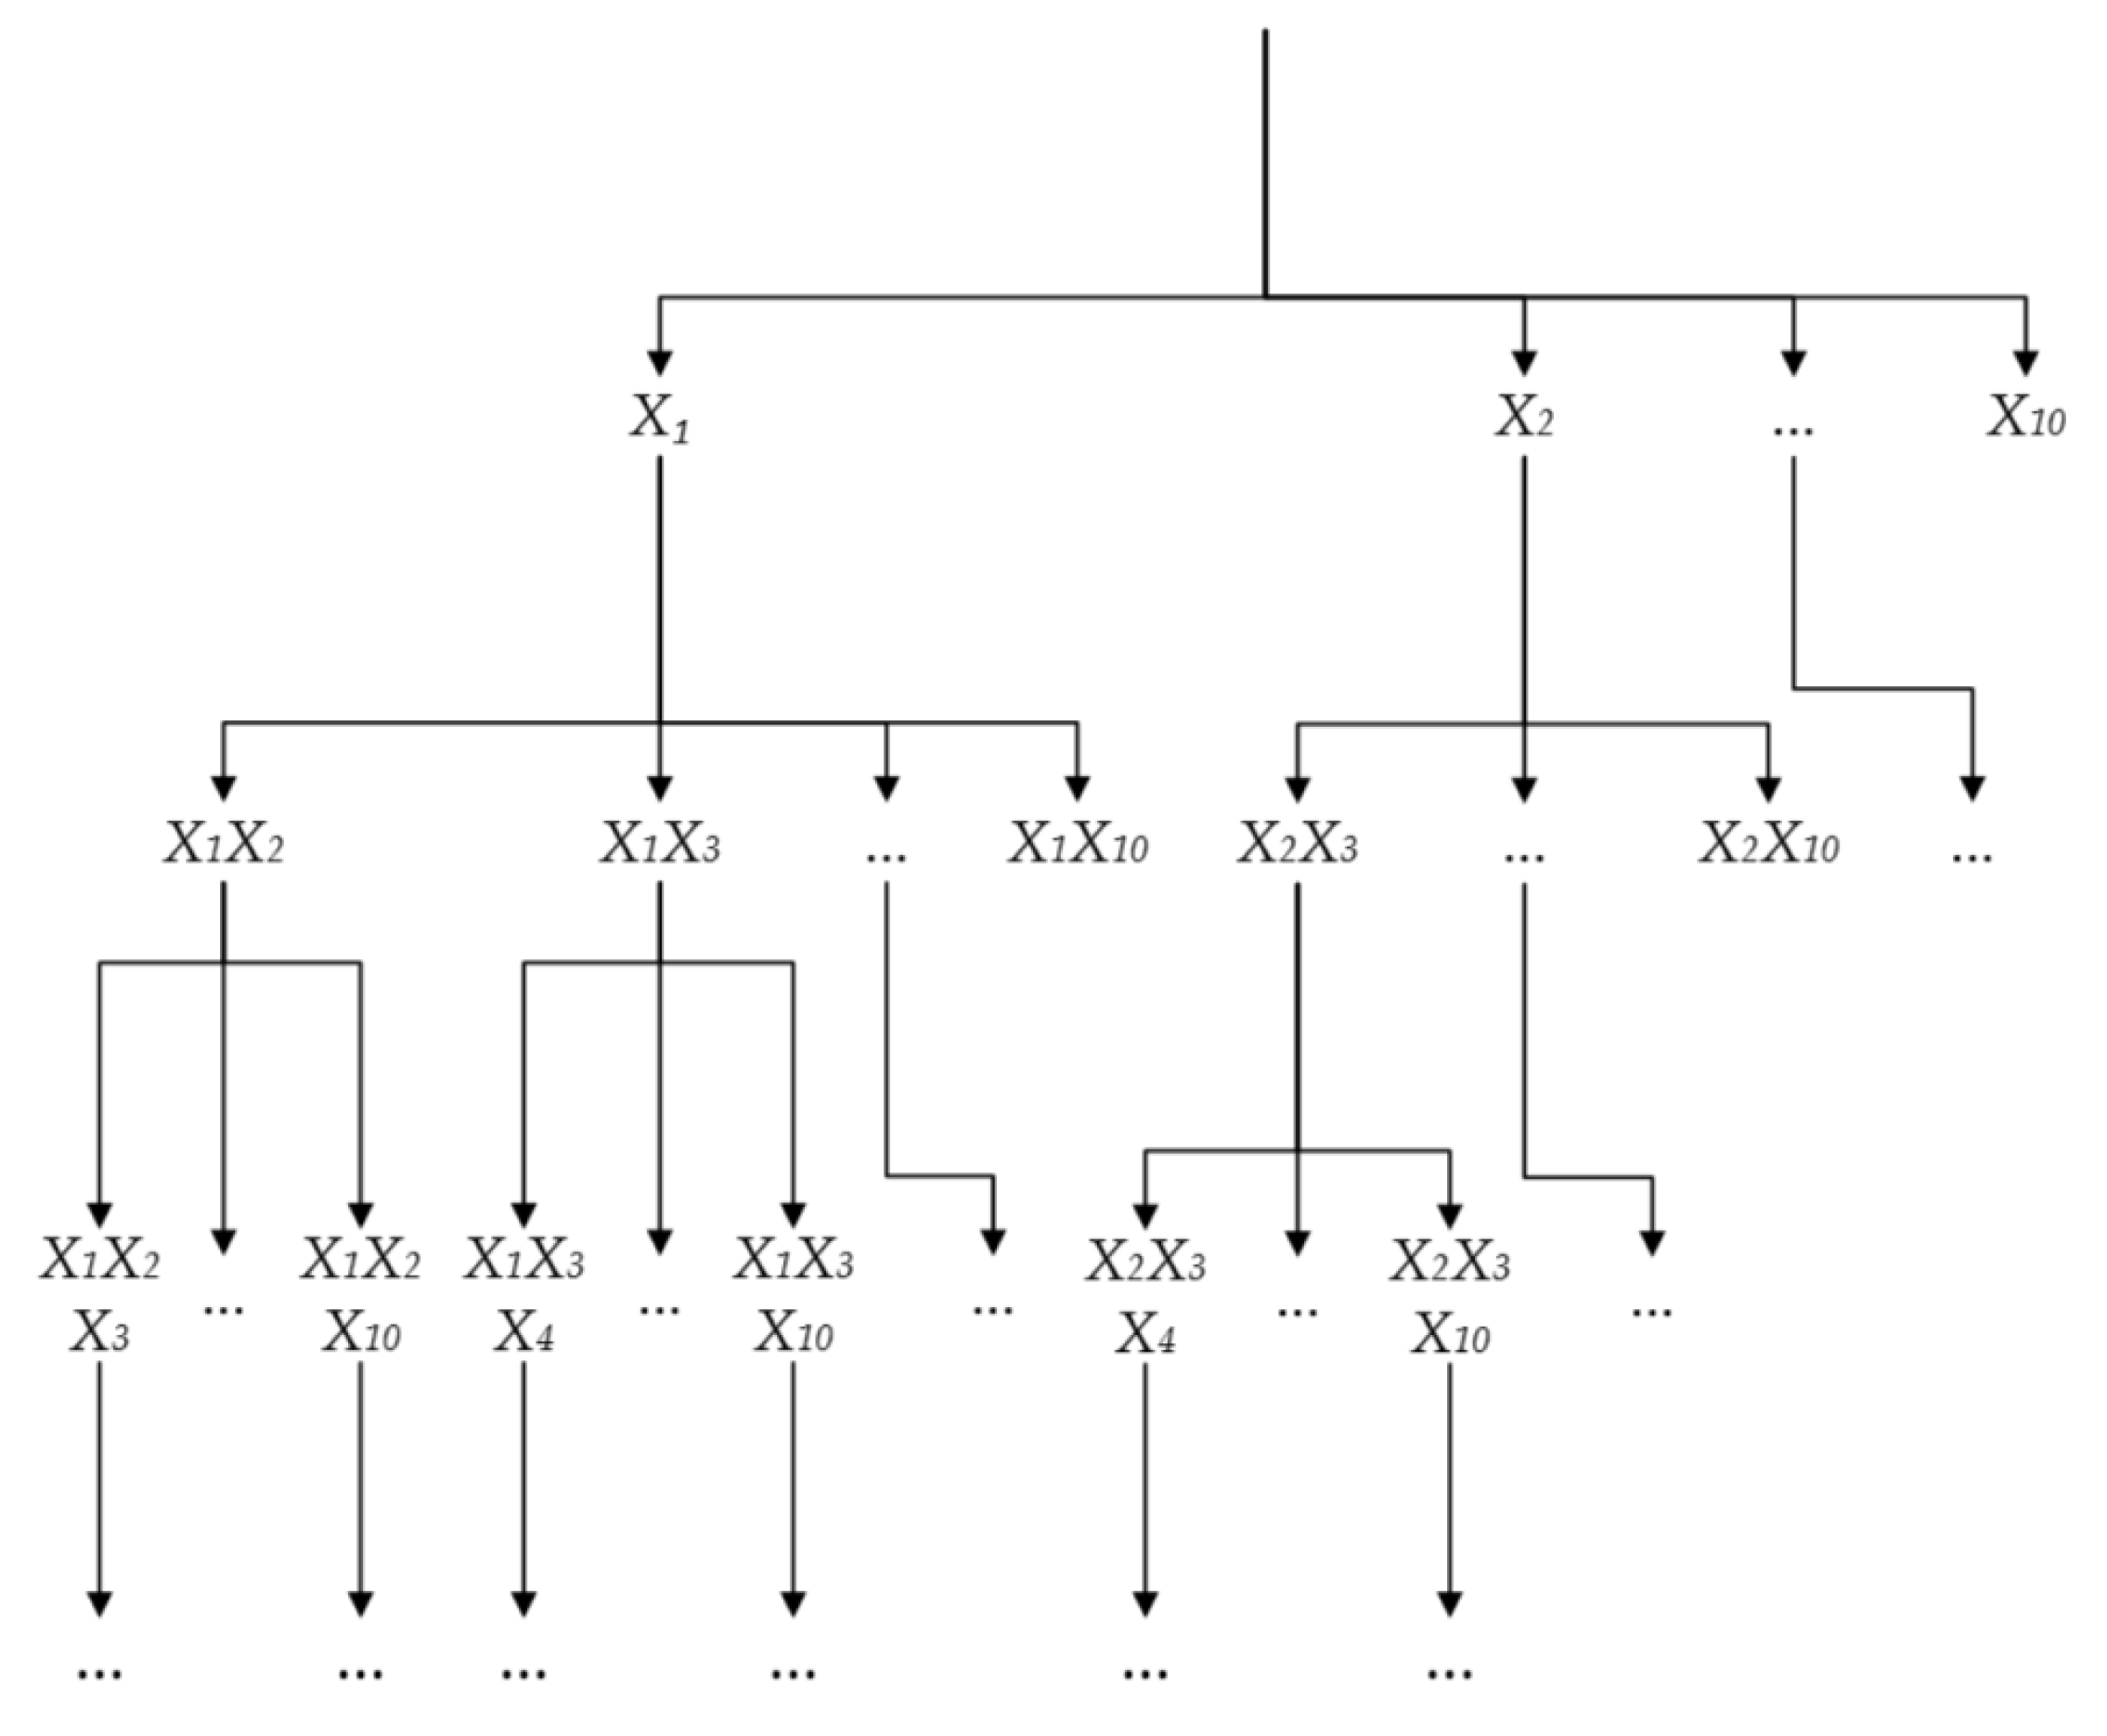
The branch definition algorithm process is represented by the search tree, as shown in Figure 10. The root of the search tree represents the starting state, i.e., the 10 contour segments are all a separate group. The roots are then combined to obtain other groups by , and each node at level of the search tree represents a different grouping of groups.
3.3. Grouping Criteria
The selection of grouping criteria greatly affects the effect of branch definition algorithm. Define the evaluation function as:
where , are, respectively, roundness and symmetry, , are the weight coefficients of the two parts.
Roundness represents the degree of conformity between the circle fitted by the contour and the actual contour. The contour segment consists of n points, and the coordinates of each point are (m = 1, 2, …, n). Their corresponding points of the fitted circle are (m = 1, 2, …, n), then the roundness can be expressed as:
By collecting the normal vectors of the contour segments, the symmetry centers of the contour segments and can be obtained as and . As with the fast radial symmetric transformation [34], the gradient vector is replaced with the normal vector of the contour segment. The degree of symmetry can be regarded as the value of the distance between and normalized by the maximum size :
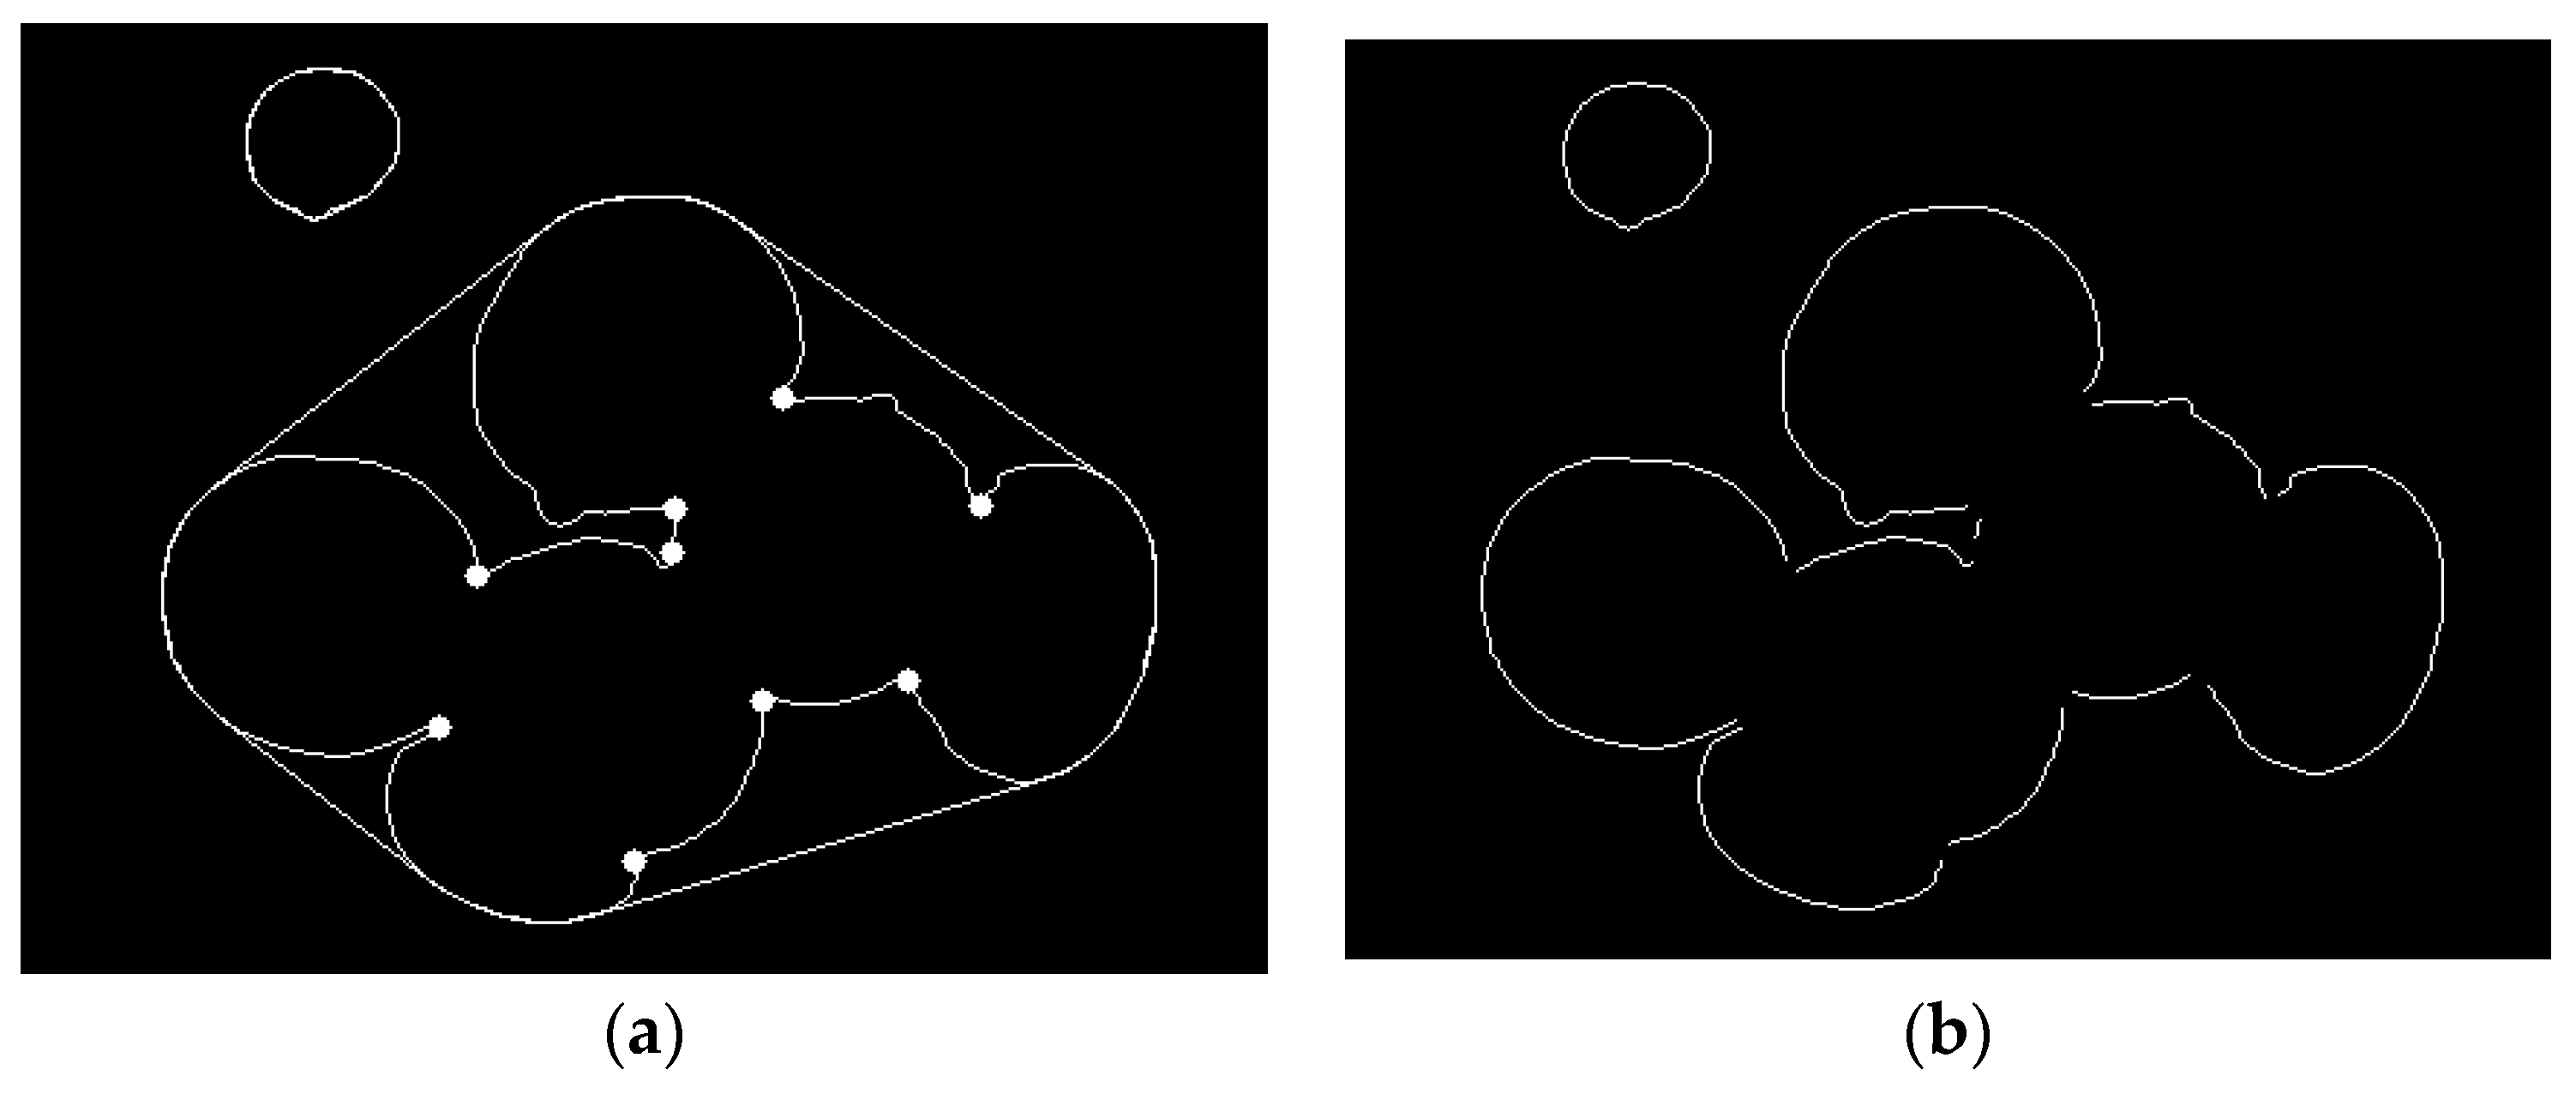
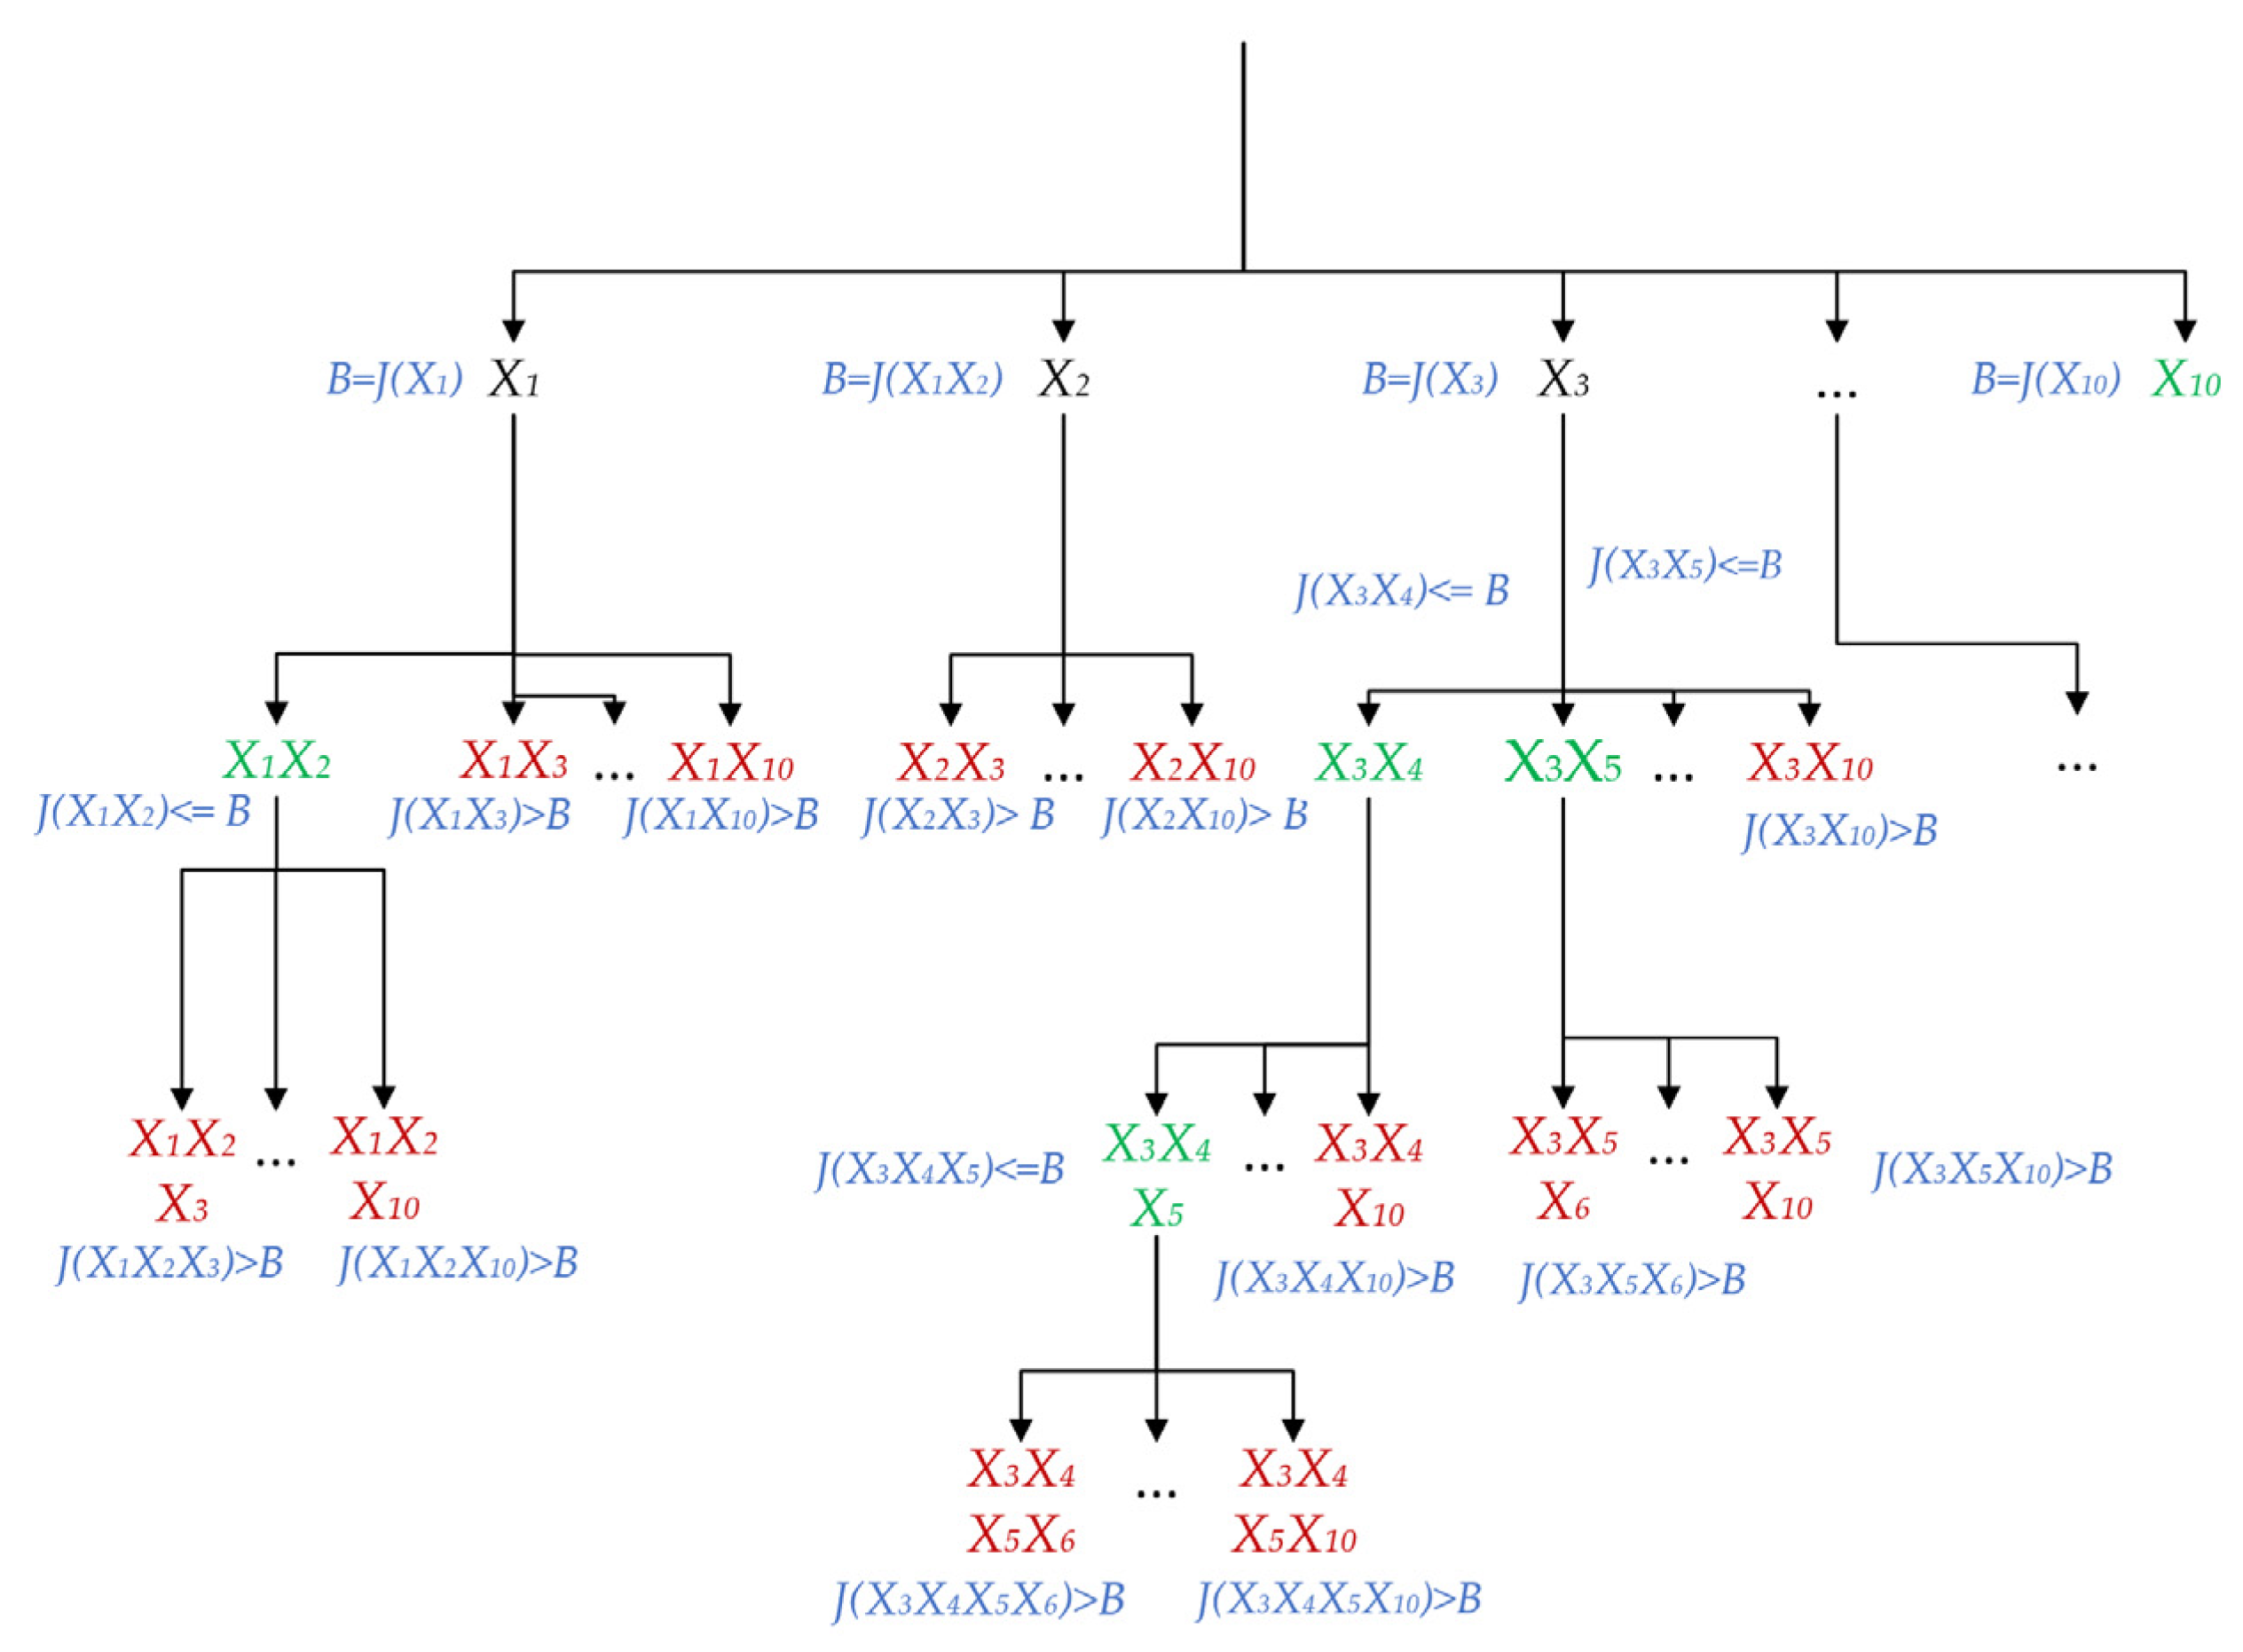
The expansion of the search tree is controlled by the grouping criteria, and the best grouping is the node with the lowest evaluation value. As shown in Figure 11, the upper bound of the optimal group is formed after the first node is generated. If the node enters the best group, the upper bound is determined by the evaluation value of the best group. On the contrary, the upper bound is determined by the evaluation value of the node itself.
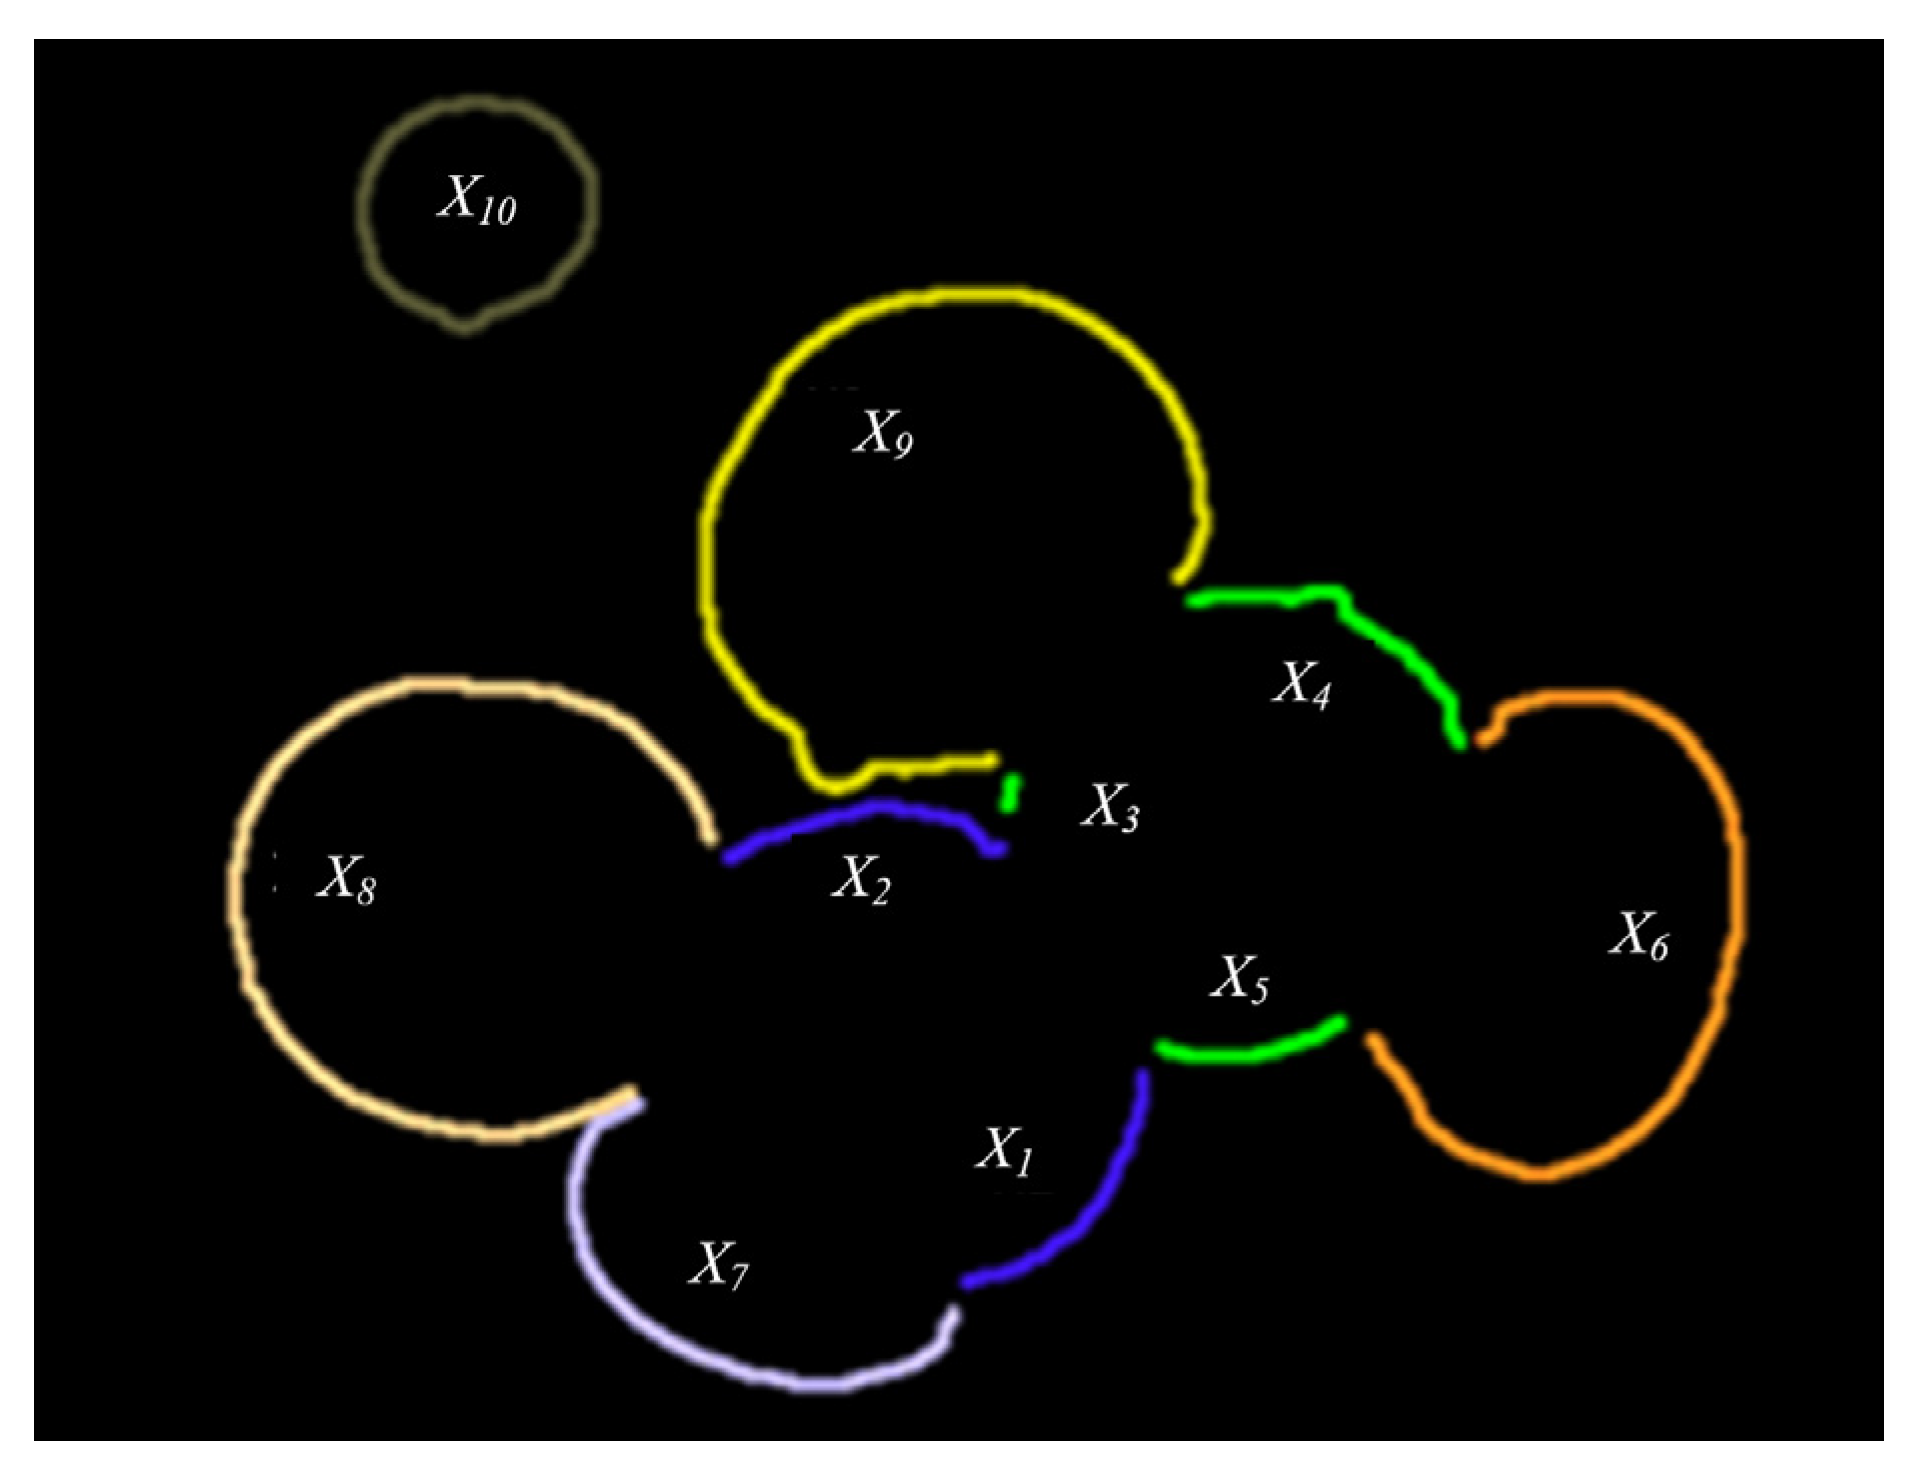
The initial upper bounds of are set to their section review value, because these nodes do not enter the best grouping. The initial definition of is , because is already part of the optimal solution . When the expanded node , it will stop expanding. When the value of the section reviews is less than the upper bound, the new upper bound will be replaced. When the weighting coefficients and of roundness and symmetry are both set to 0.5, the outline grouping of the overlapping Agaricus bisporus is shown in Figure 12.
4. Reconstruction and Recognition of Overlapping Agaricus bisporus
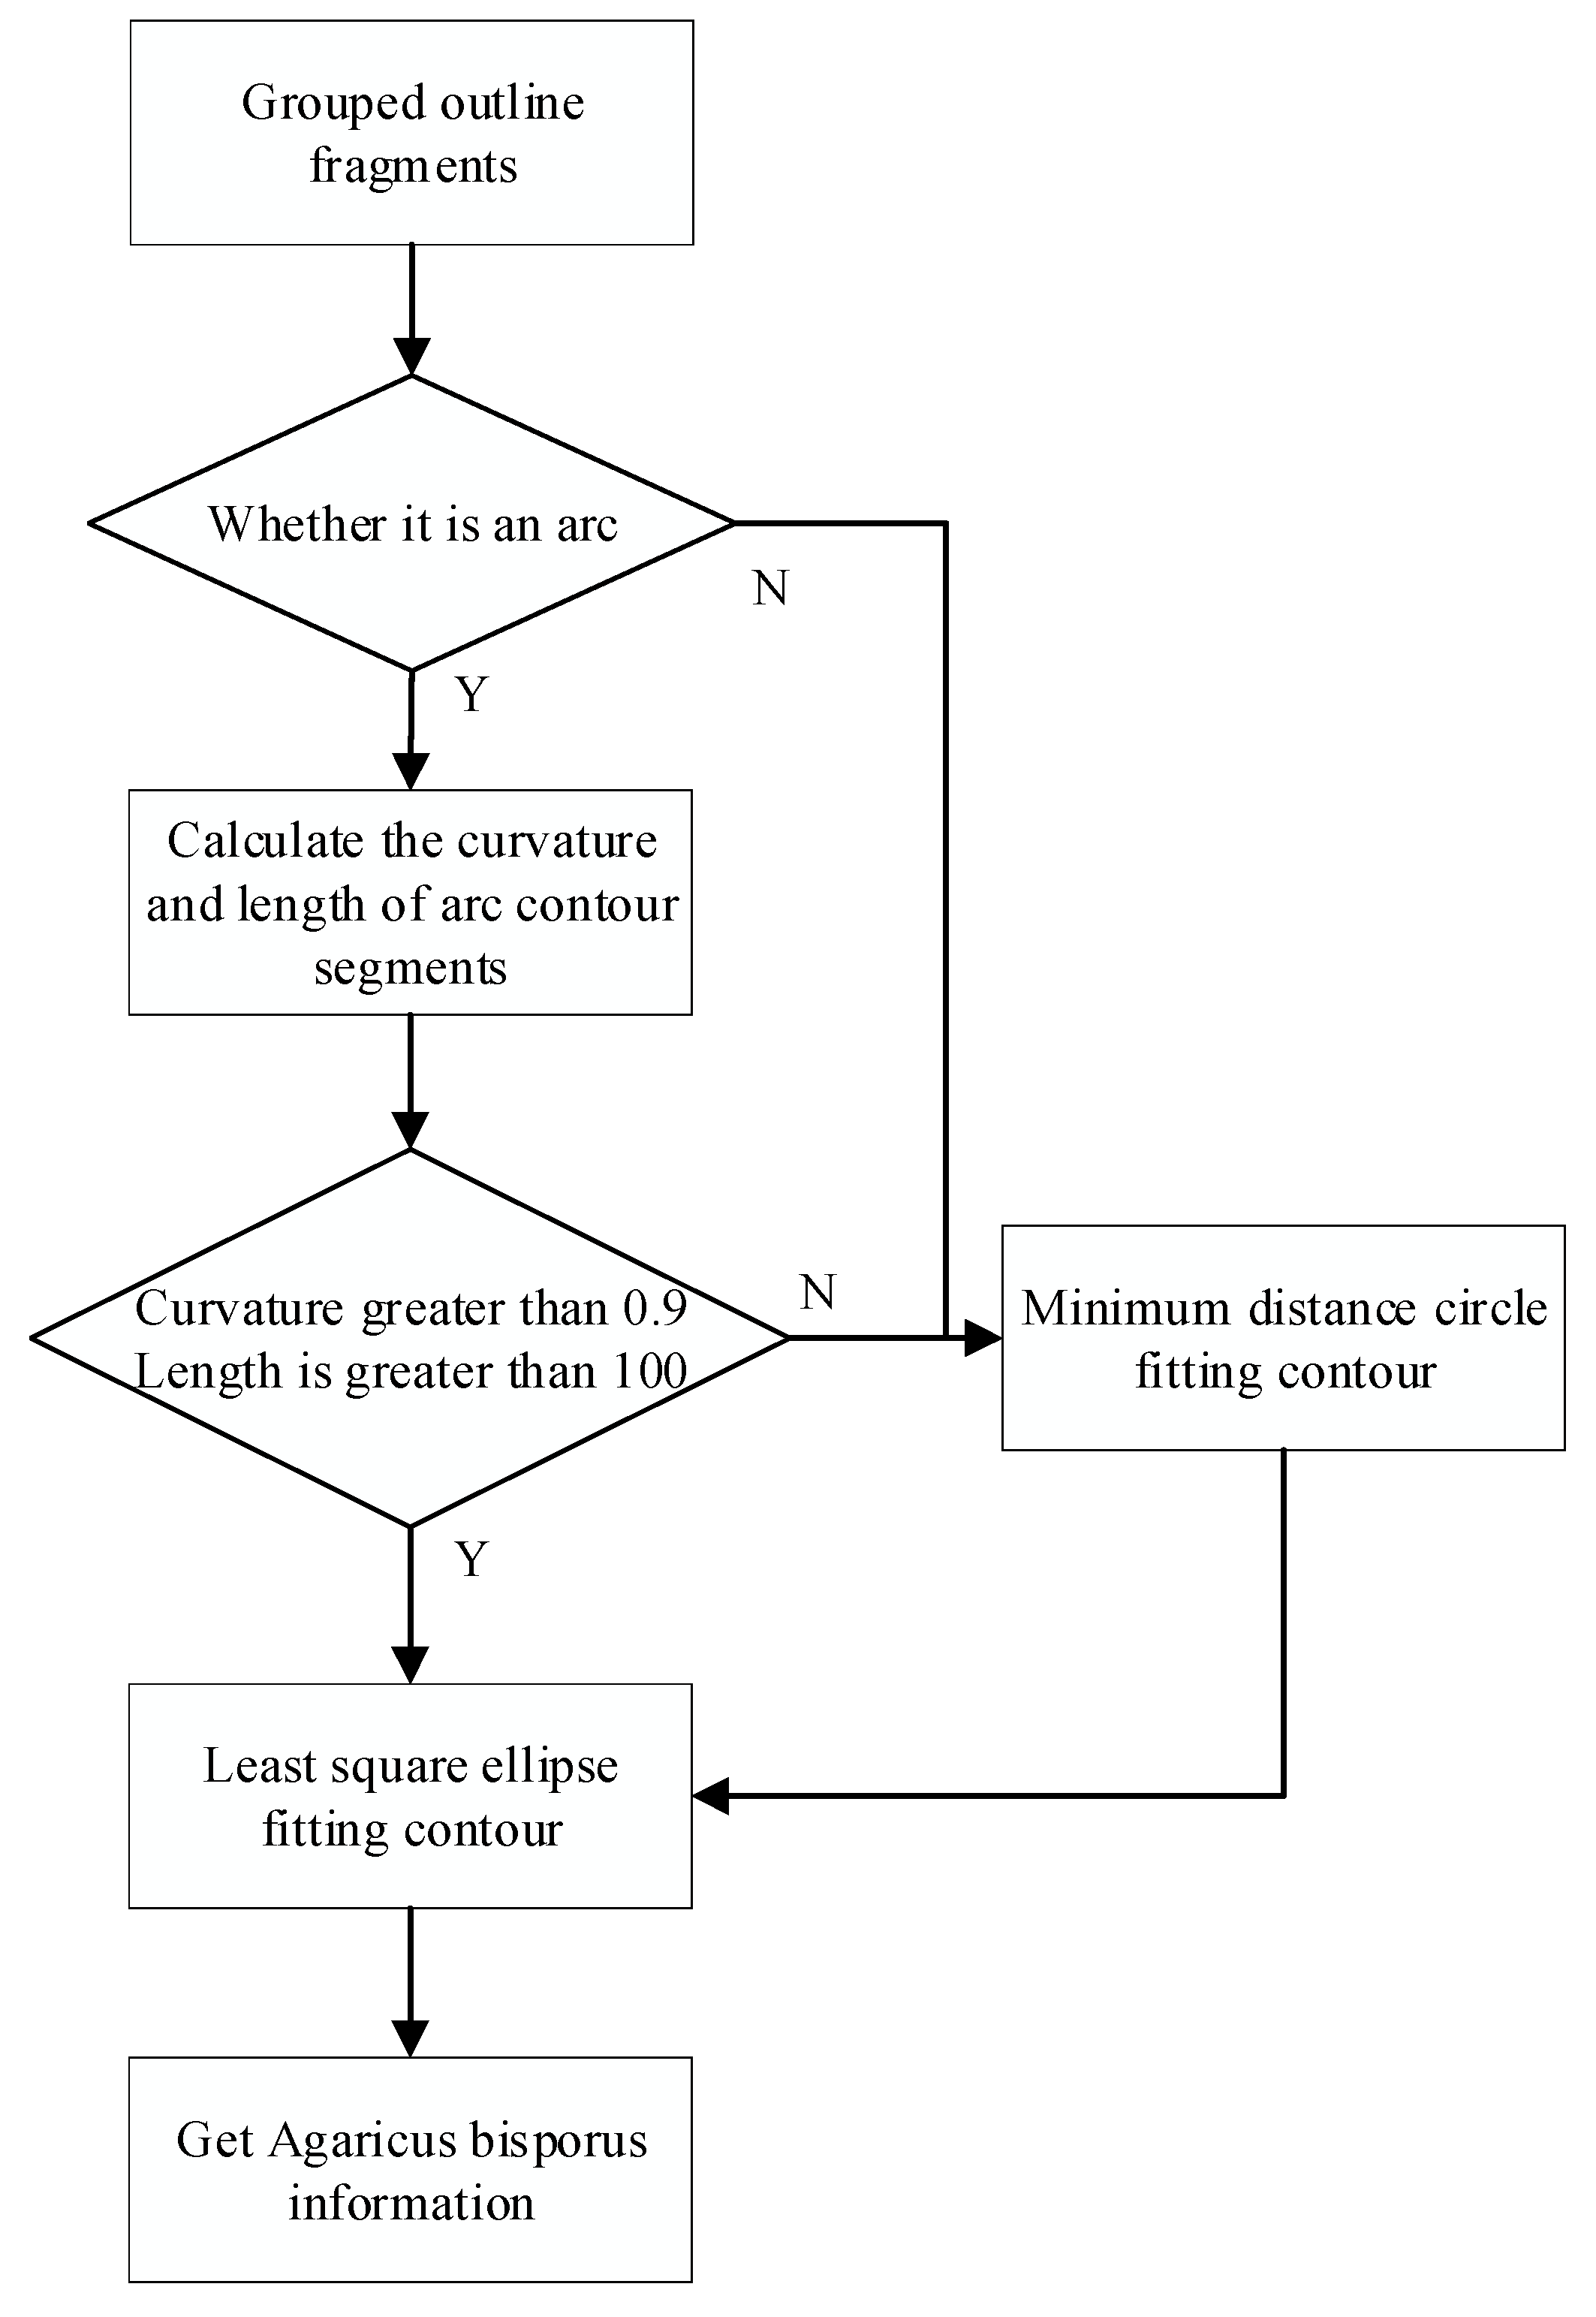
Since the grouped Agaricus bisporus contour fragments are still not closed, in order to truly restore the Agaricus bisporus target, least squares ellipse fitting and minimum distance circle fitting are used to reconstruct the Agaricus bisporus target contour. The specific process is shown in Figure 13.
4.1. Least Square Ellipse Fitting Reconstruction Contour
Since the outline fragments of Agaricus bisporus after grouping are still scattered, if the outline is determined to be an arc, the arc height at any point on the search curve is traversed, and the height is calculated according to the Helen formula:
where are the three sides of the triangle formed by the points at the two ends of the contour and any point on the curve, is the half circumference, and is the area of the triangle.
According to the calculated bow height, the chord length of the arc is calculated, so the bow curvature can be obtained:
where is the bow radius of curvature, is the chord length, and is the bow height.
Calculate the curvature and length of each contour, and then select the contour with a curvature greater than 0.9 and a contour length greater than 200 pixels, and take measurement points for each contour as . According to the principle of least squares, the fitting objective function is:
To minimize , you need to:
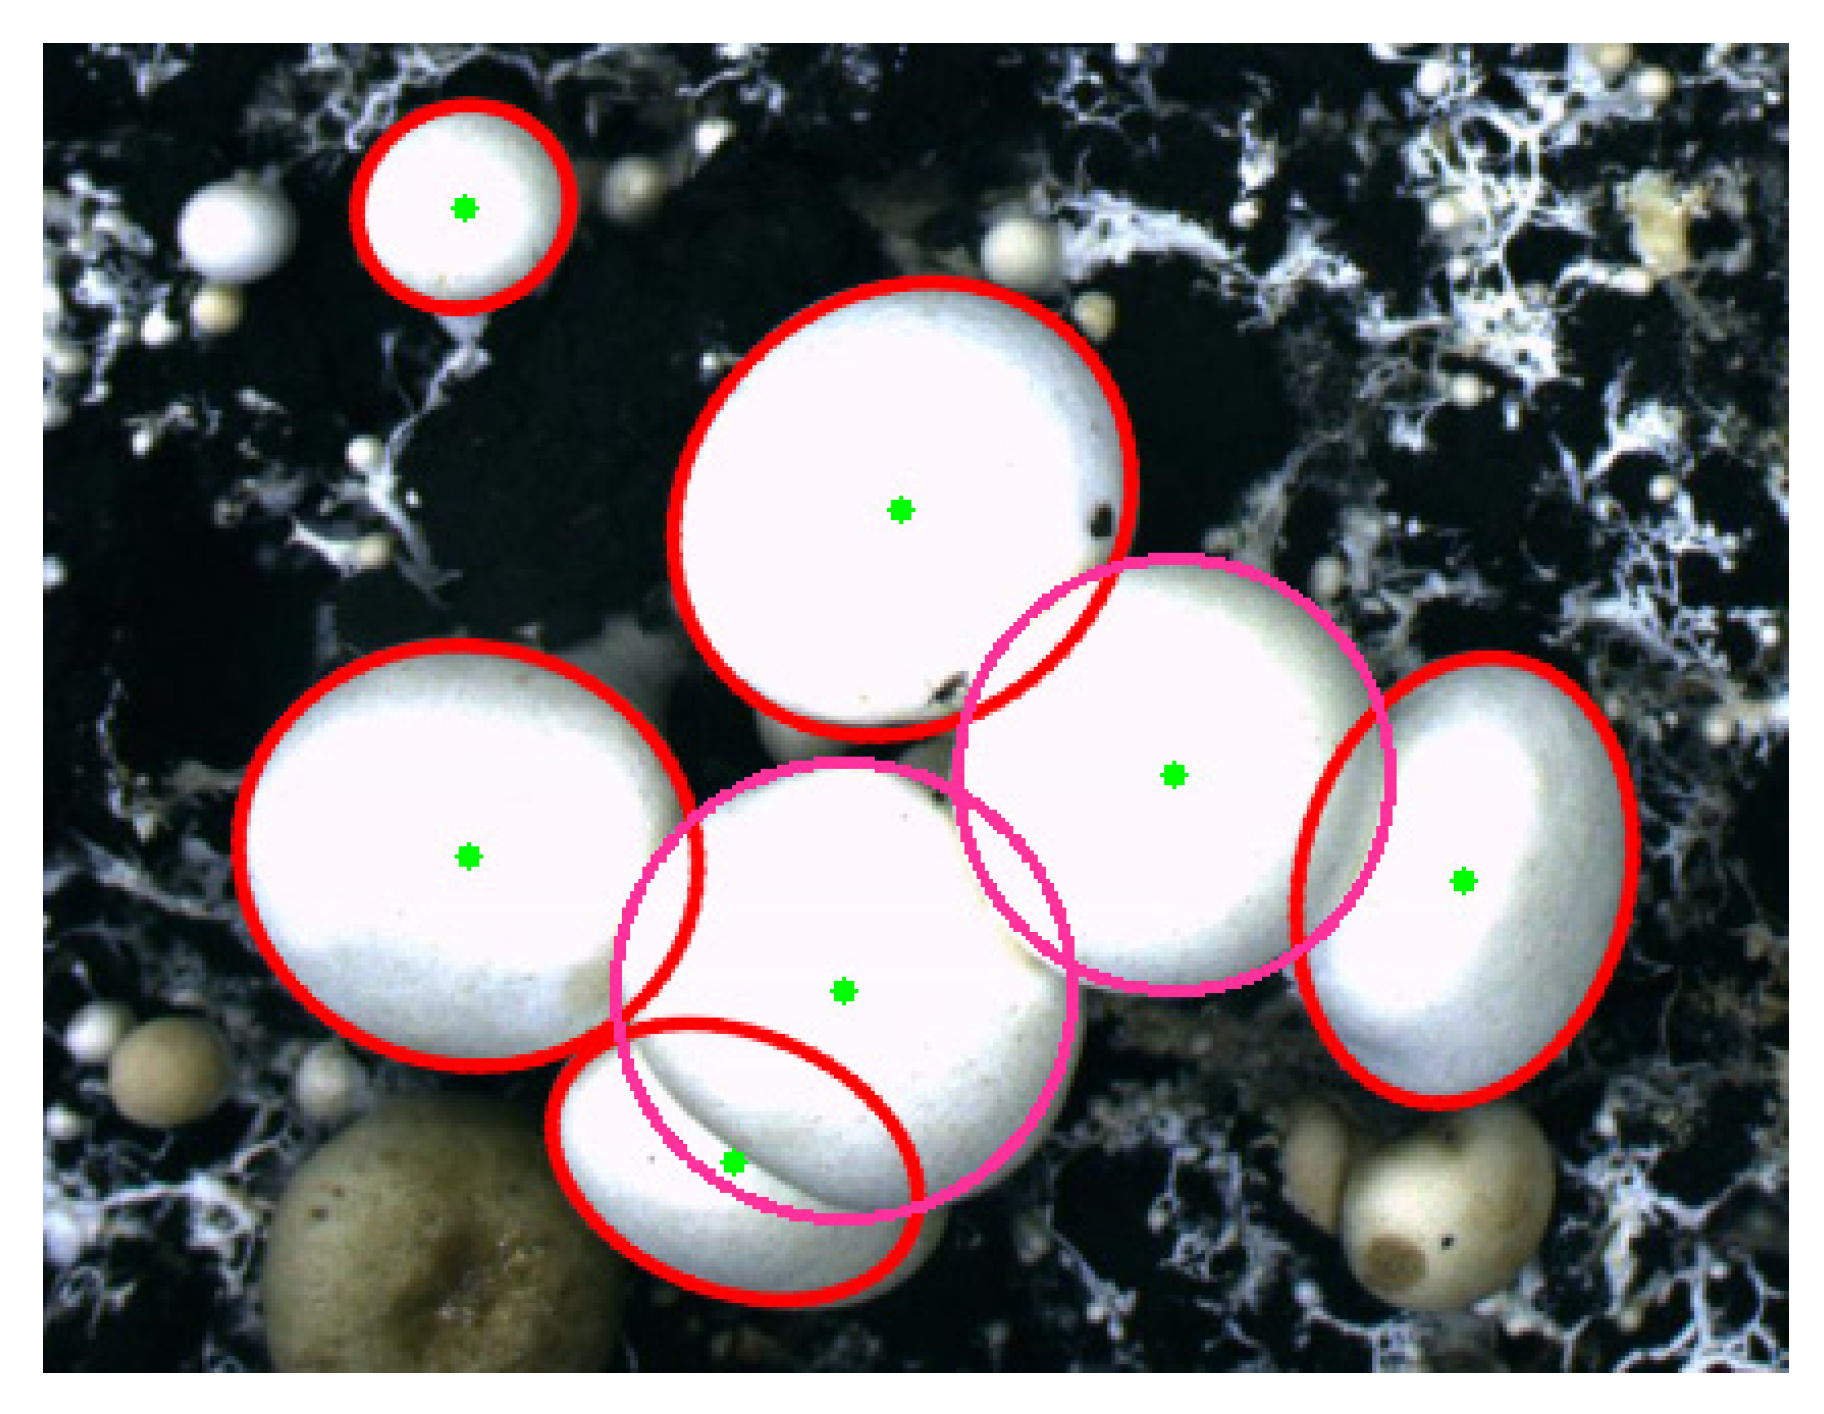
The values of and can be solved. According to the characteristics of the ellipse, the ellipse position parameters and shape parameters can be calculated to reconstruct the elliptical profile of Agaricus bisporus. The results are shown in Figure 14.
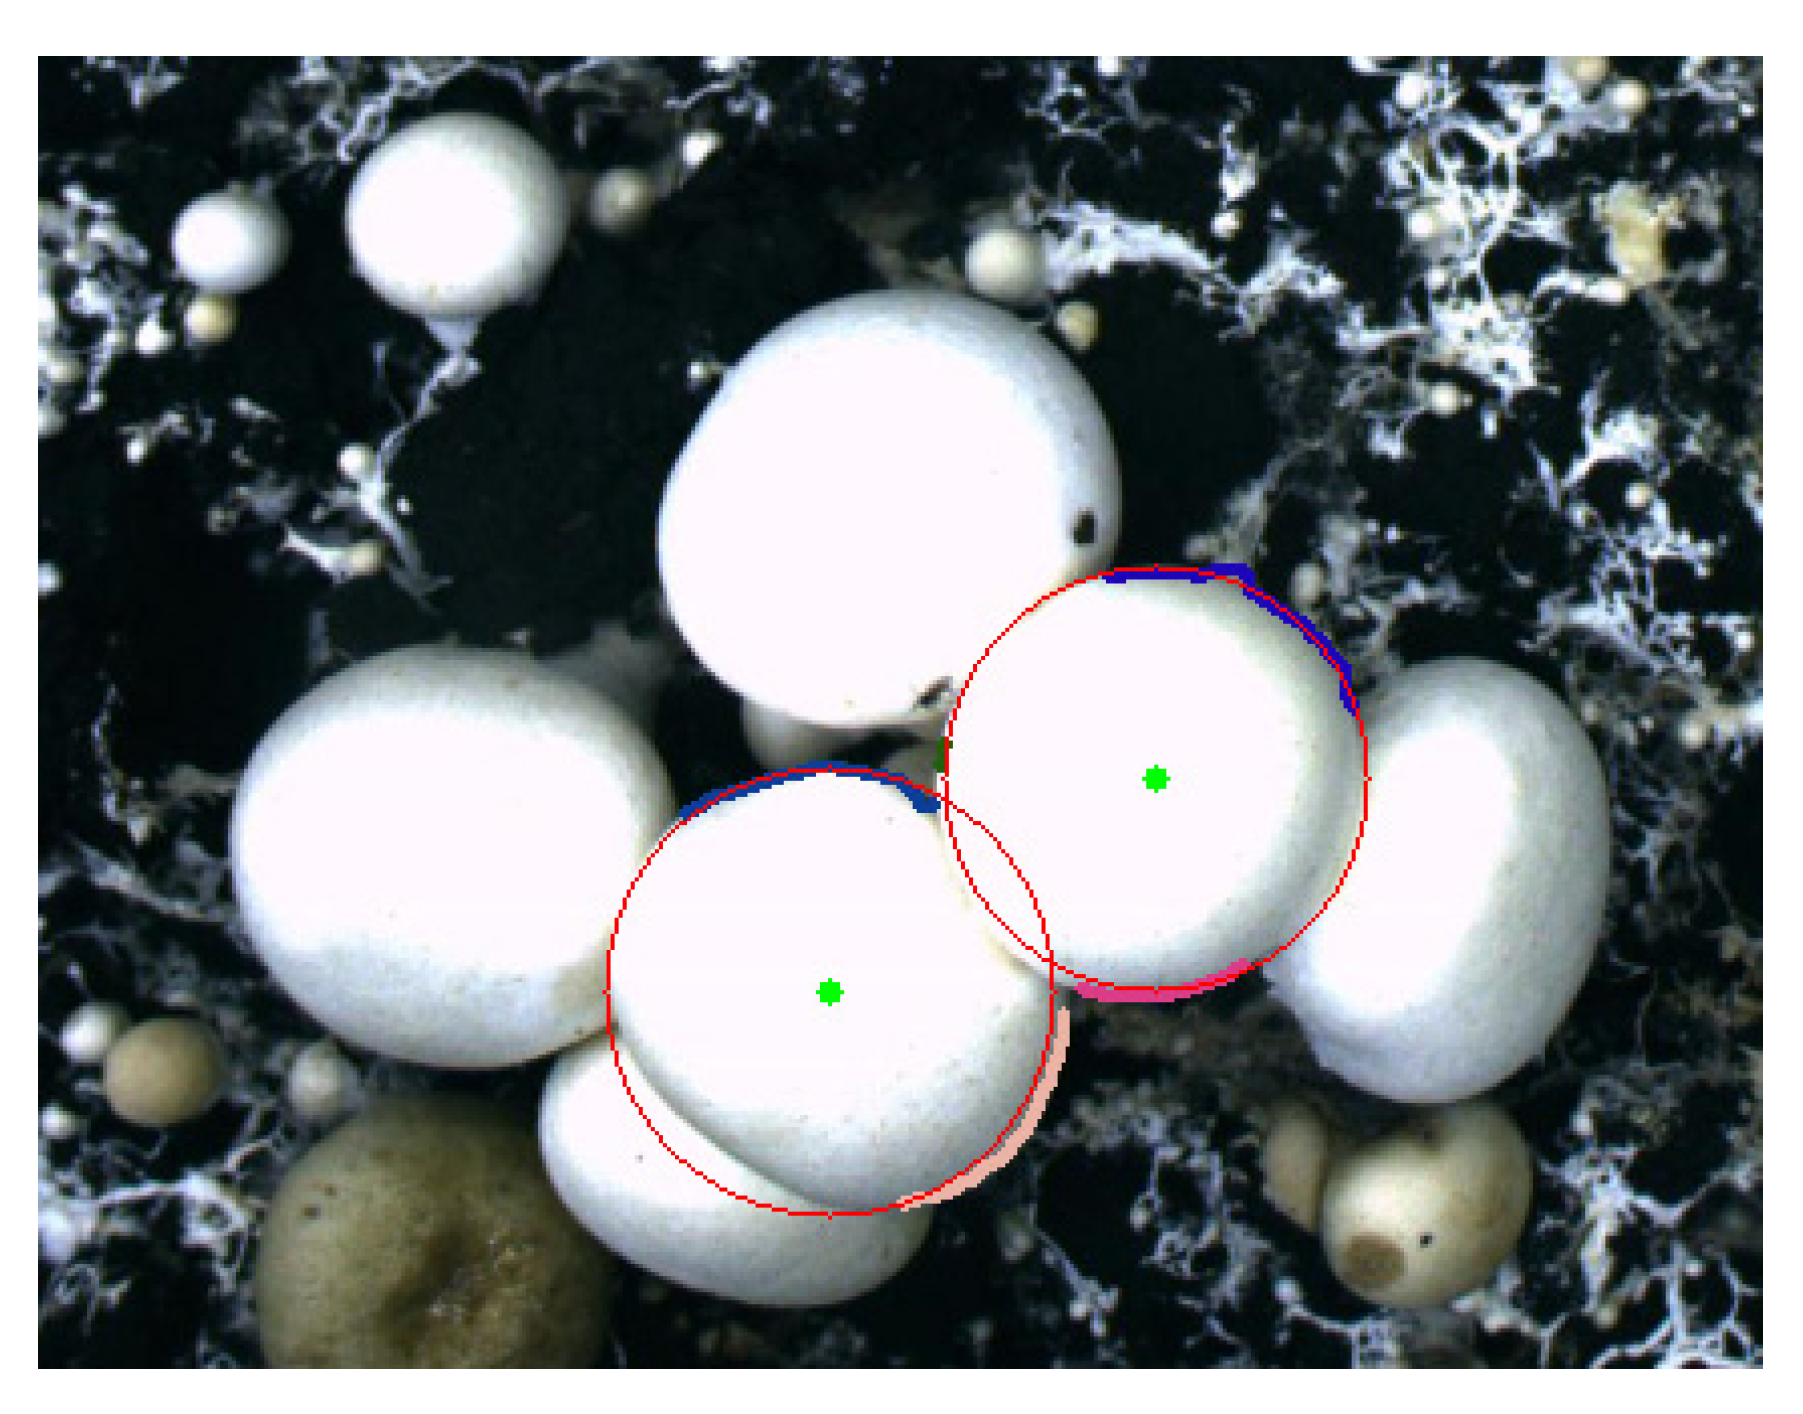
4.2. Minimum Distance Circle Fitting Contour Reconstruction
For some arc segments with low curvature or short length, if least square ellipse fitting is adopted, the center point deviation may be large, and the fitting contour deviates greatly from the actual. For the grouped and merged contours, the short-segment contours are more discrete, so for the contours of the above two cases, the circle fitting method is used to reconstruct the contours.
Least squares circle fitting is widely used, and it is very effective for data points whose errors conform to the normal distribution, but in practical applications, some interference points are often encountered. These interference points tend to deflect in a certain direction, which causes the fitted circle to deviate more. Therefore, next, the minimum distance circle fitting is used to reconstruct the Agaricus bisporus target.
Select points on the contour, and determine the parameters of the circle according to the sum of the absolute values of the distances from the data points to the circle, which is the following formula:
The and that make achieve the minimum value are the best fitting parameters. The fitting result is shown in Figure 15.
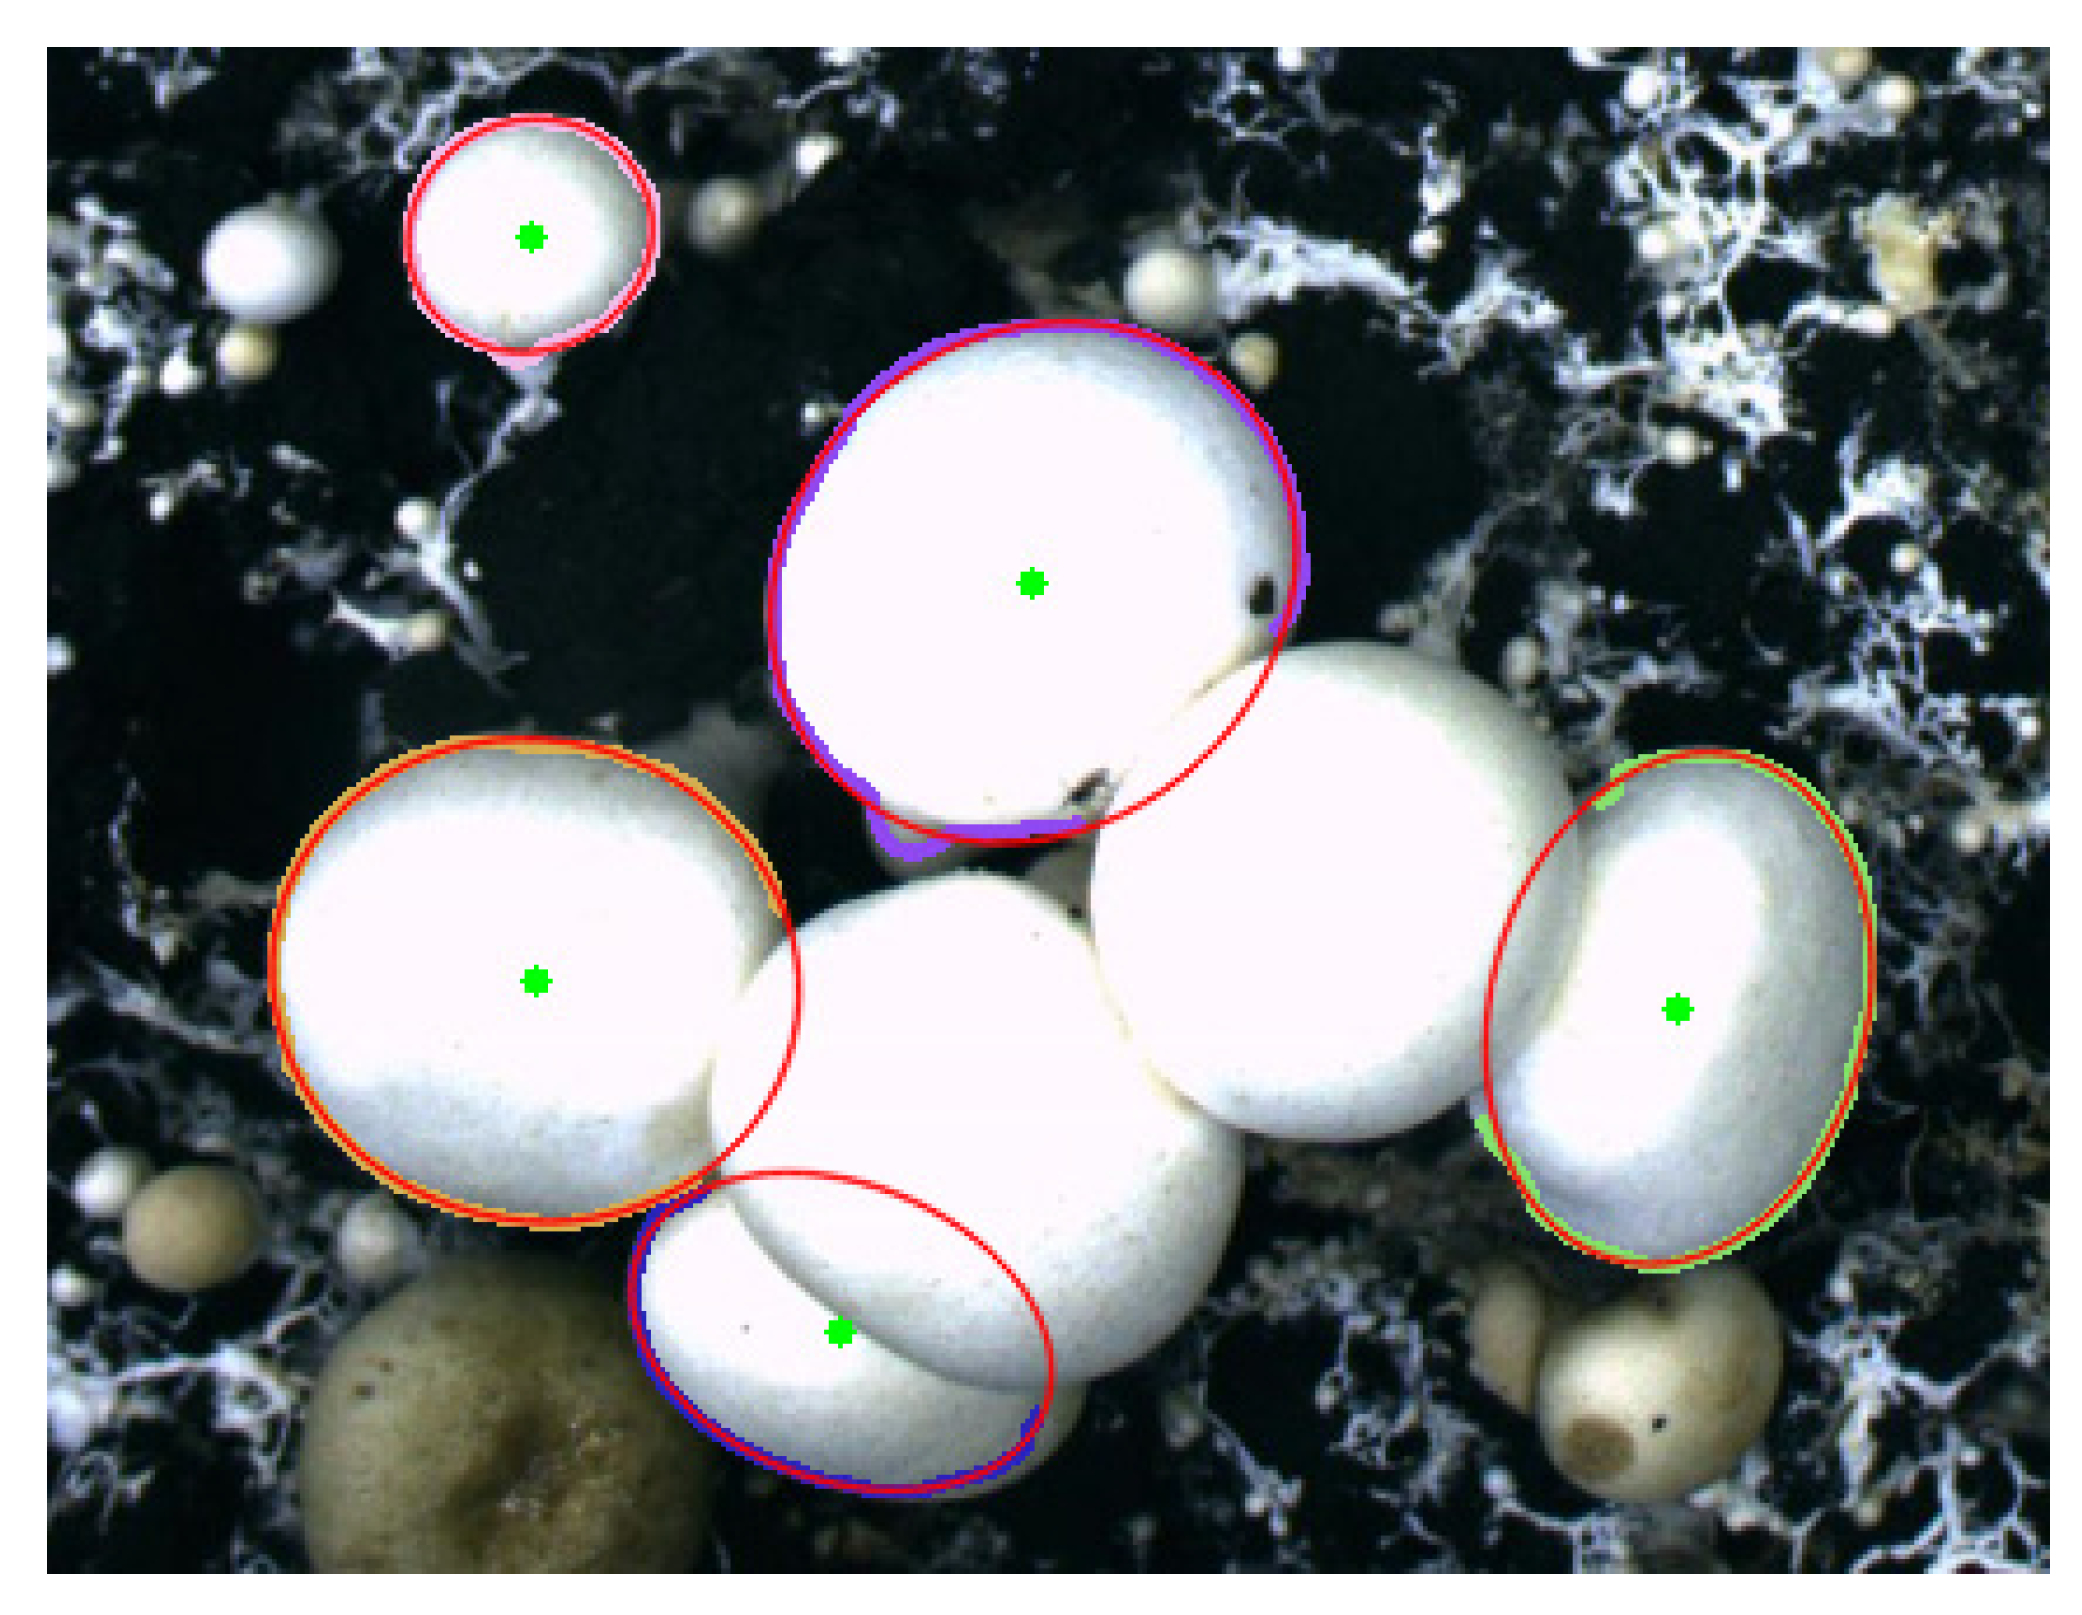
Calculate the center coordinates, long axis size and short axis size of the elliptical outline of the constructed Agaricus bisporus. Calculate the center coordinates and radius of the circular outline of the constructed Agaricus bisporus. The final recognition result of Agaricus bisporus is shown in Figure 16.
5. Experiment and Result Analysis
The experimental hardware system mainly includes a camera, lens, light source, industrial computer and so on. Among them, the industrial computer adopts Advantech embedded ARK-3500P, the operating system is Windows 7, and we use OpenCV3.4.8 library to process images in real time to obtain the picking information of Agaricus bisporus.
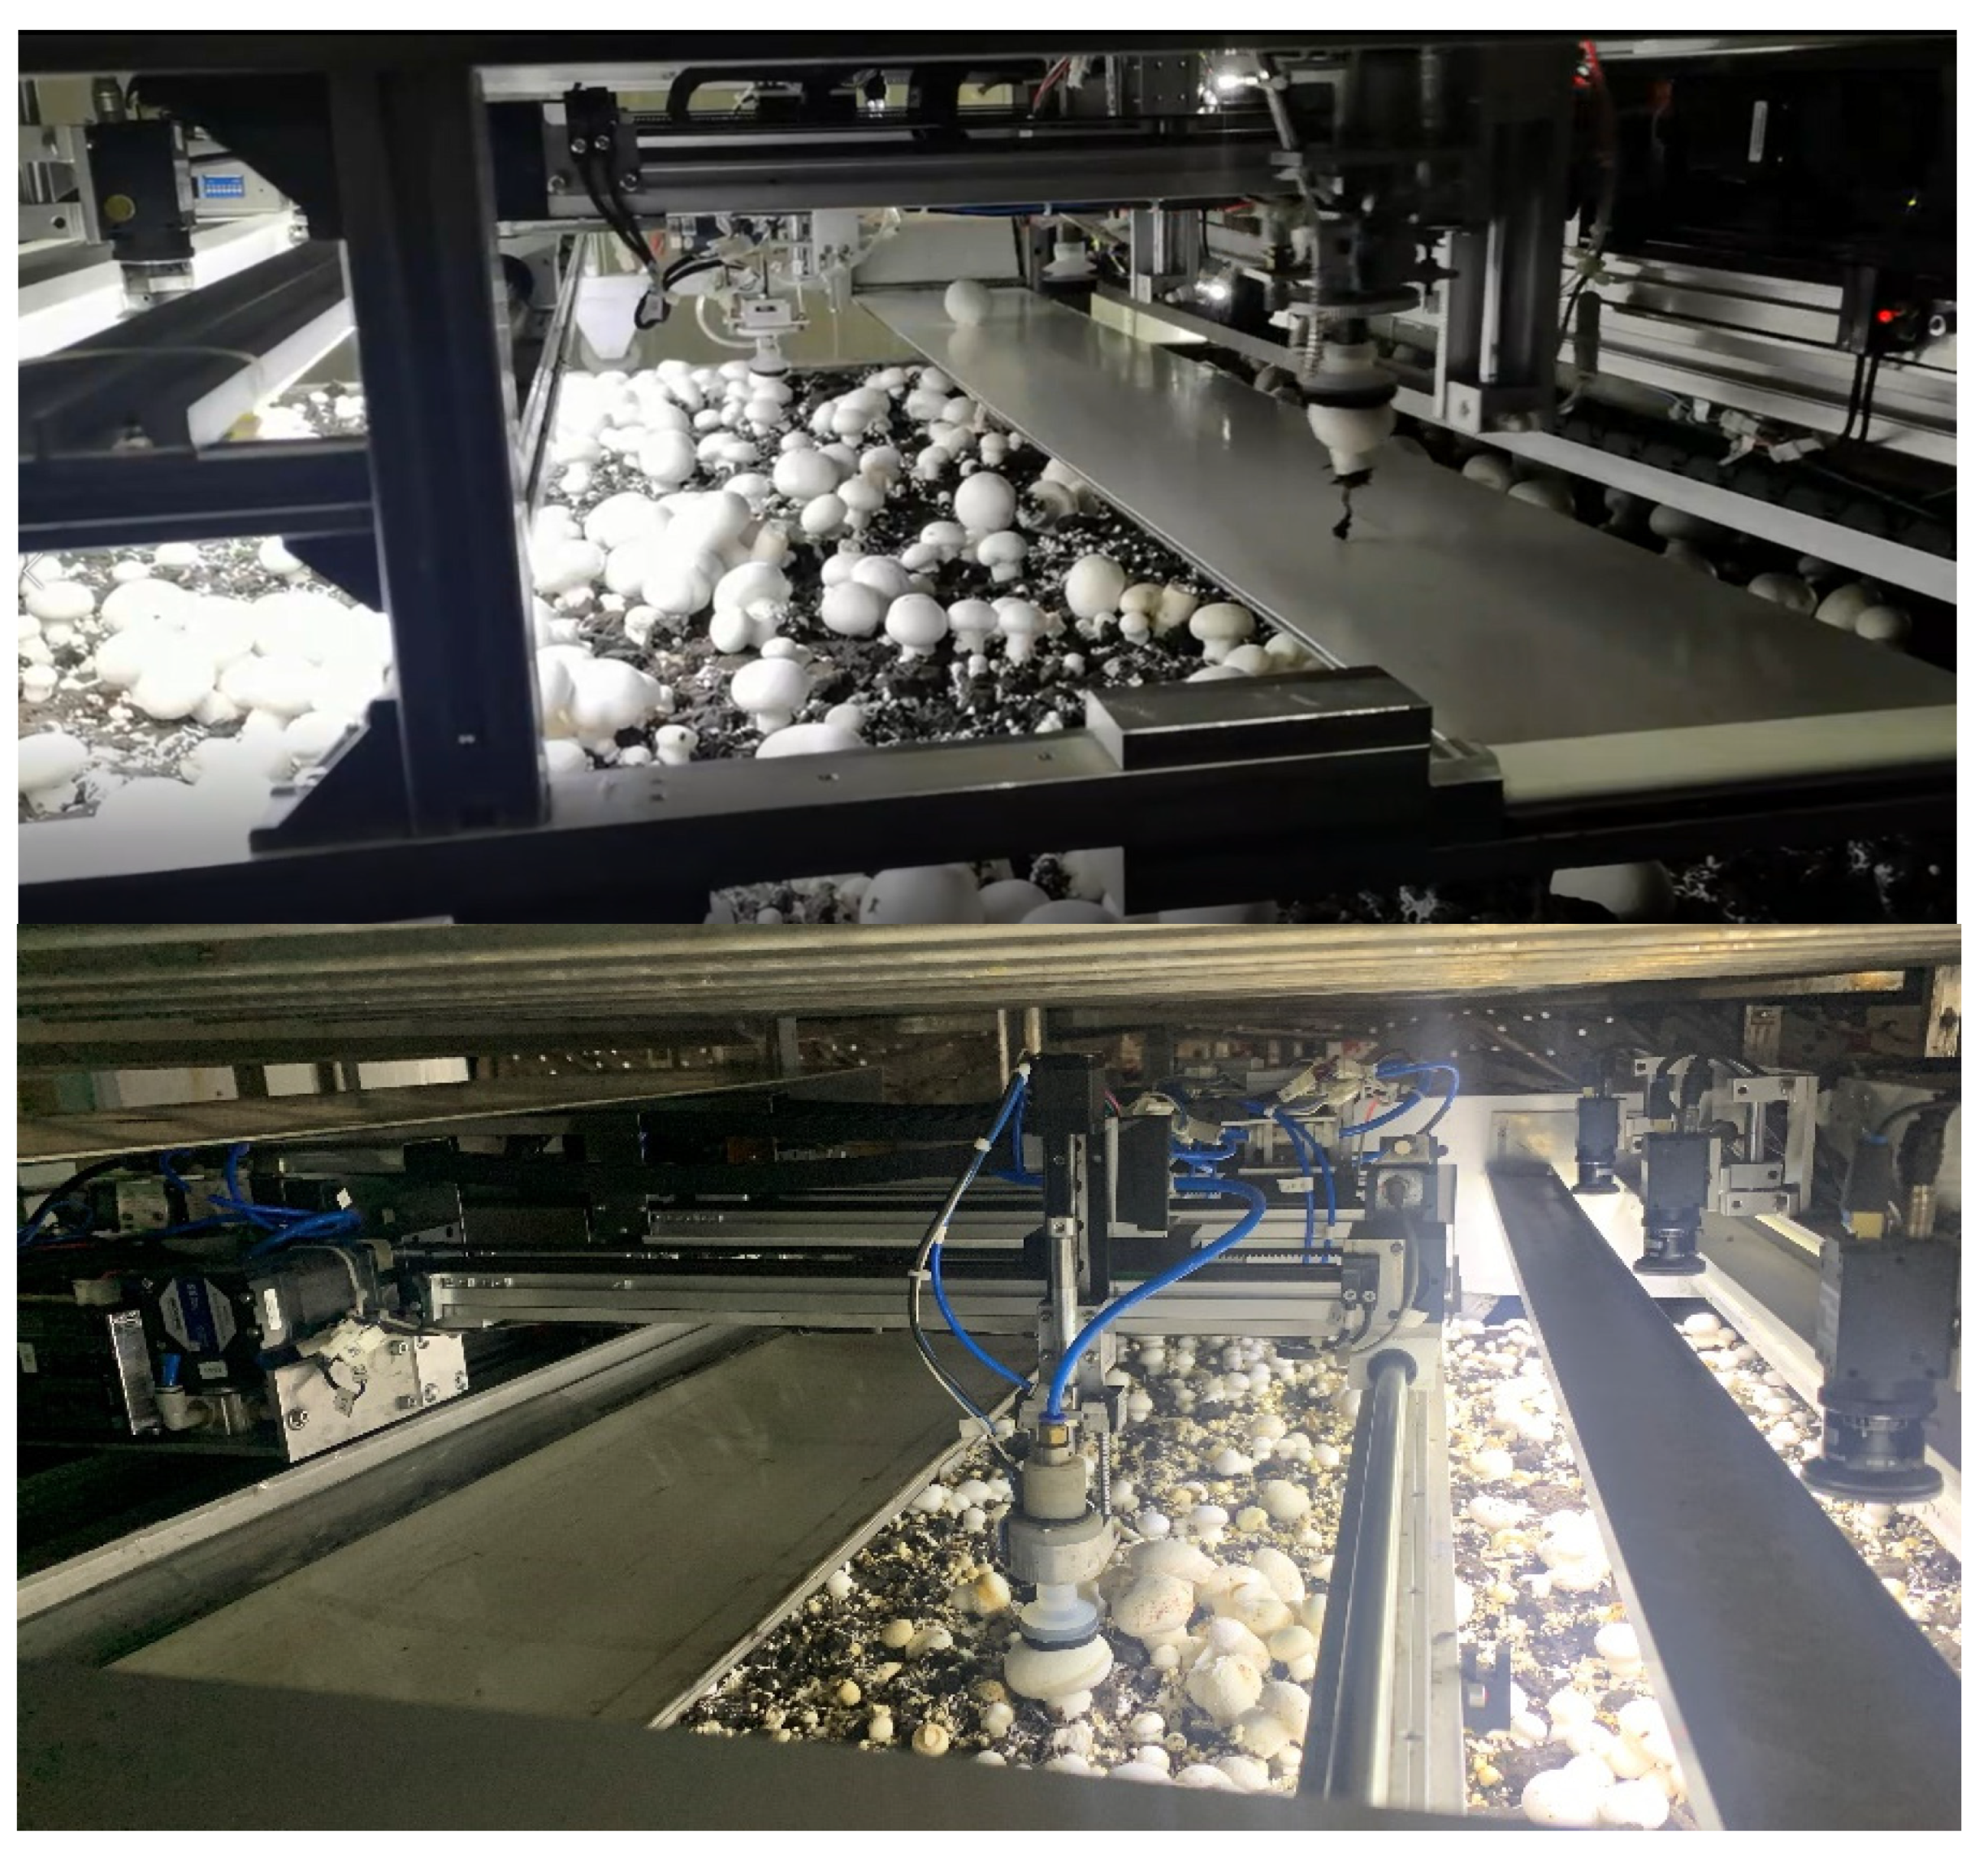
In order to verify the effectiveness of the method in this paper, sample images of Agaricus bisporus are all captured from the actual factory environment by the Agaricus bisporus multi-arm intelligent picking robot, developed by our team, as shown in Figure 17. Overlapping segmentation identification experiments of Agaricus bisporus were then conducted.
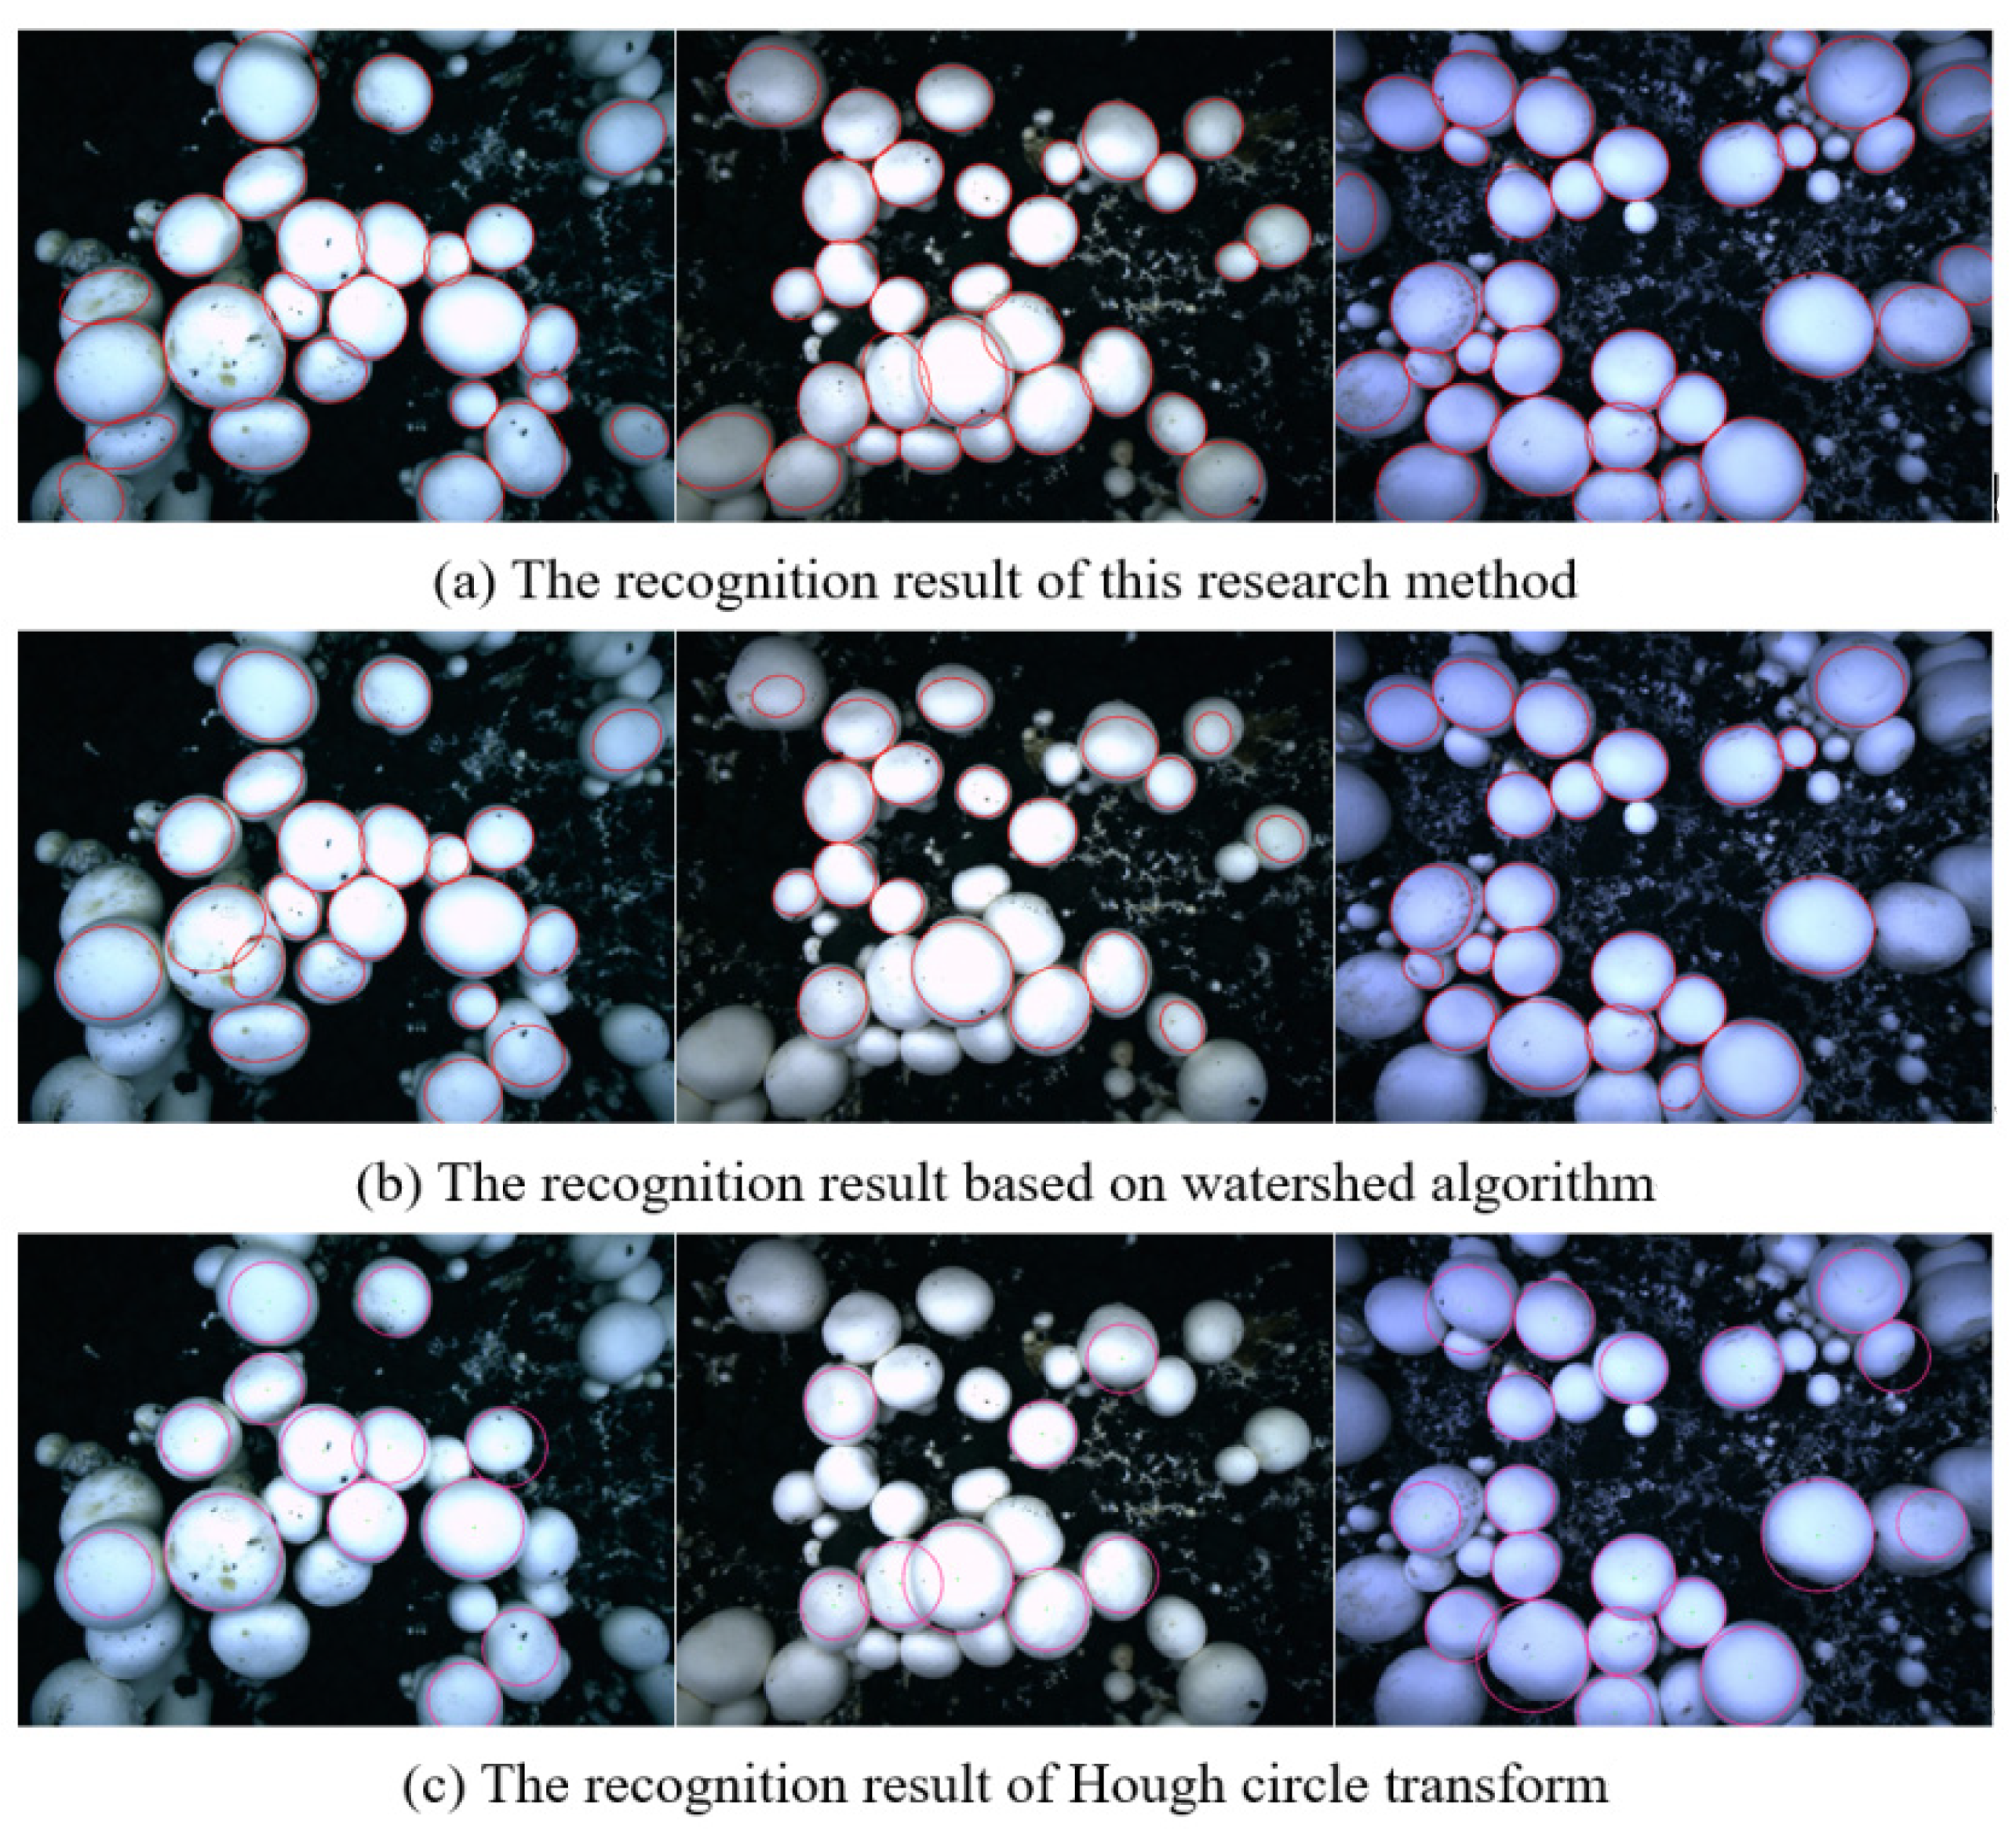
We used the research method in this paper, the watershed algorithm based on distance transform, and the Hough circle transform algorithm to segment and identify overlapping Agaricus bisporus, with the comparison results shown in Figure 18. Using the research method in this paper can not only improve the adaptability to complex planting environments and overcome the influence of uneven illumination, but also accurately segment Agaricus bisporus, accurately reconstruct Agaricus bisporus contours, and meet the automatic identification and picking needs of the spore mushroom picking robot.
In the experiment, 200 sets of overlapping Agaricus bisporus image samples were selected for segmentation and identification and the actual number of Agaricus bisporus was 6109.
The research methods in this paper, the watershed algorithm based on distance transformation and the Hough circle transformation algorithm to achieve segmentation recognition, corresponding to the number of effective recognition and recognition rate comparison results, are shown in Table 1. The average recognition rate of the research method in this paper is 98.81%, which is obviously higher than the watershed algorithm and Hough circle transform algorithm based on distance transformation. It shows that the research method in this paper is effective for segmentation recognition of overlapping Agaricus bisporus.
In order to better evaluate the accuracy of this research method in segmentation and reconstruction of overlapping Agaricus bisporus, two indexes, namely, two-dimensional coordinate deviation rate E and recognition success rate R, are defined to evaluate the recognition accuracy of overlapping Agaricus bisporus under this research method, watershed algorithm based on distance transformation and Hough circular transformation method.
where, are the row and column coordinates of the center point of Agaricus bisporus, measured manually, are the row and column coordinates of the central point of Agaricus bisporus obtained by the research method in this paper, and W and H are the width and height of the image of Agaricus bisporus, respectively.
If the two-dimensional coordinate deviation rate is less than 3%, it is judged that this Agaricus bisporus is a successful recognition, so the recognition success rate r of overlapping Agaricus bisporus can be calculated by Equation (24).
where N3 is the number of Agaricus bisporus whose deviation rate of center point coordinate recognized in the sample image is less than 3%, and N is the total number of Agaricus bisporus recognized.
In addition, the influence degree of overlapping Agaricus bisporus clustered can be measured by the overlapping rate F, which is expressed by Equation (25).
where, are the manually measured row and column coordinates of two overlapping Agaricus bisporus, are the pixel coordinates of the manually measured radius of the corresponding two Agaricus bisporus.
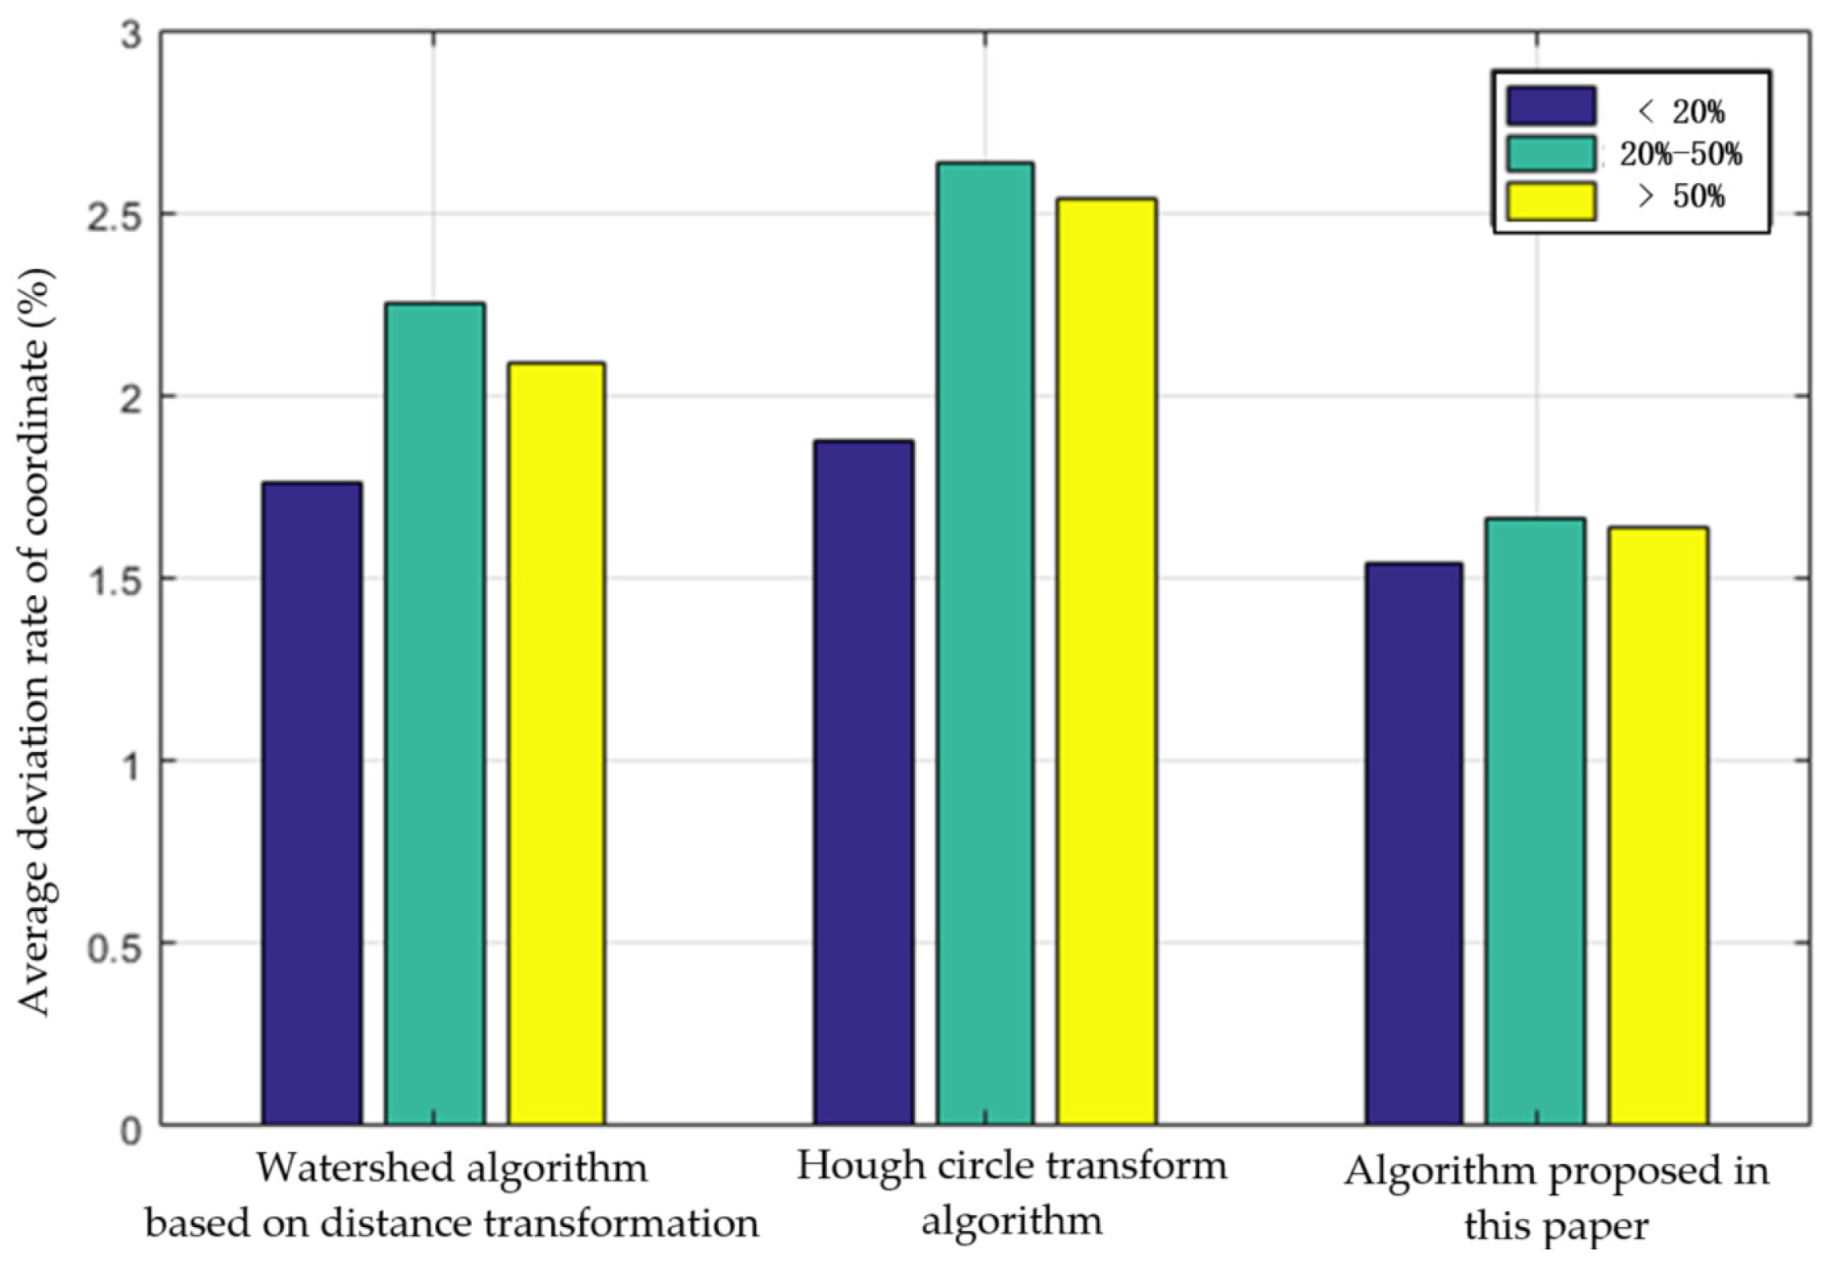
For the Agaricus bisporus segmented and identified by the three methods in Table 1, the average deviation rate of coordinates is counted. The statistics also count the Agaricus bisporus with different overlap rates. The statistical results are shown in Figure 19. Hough’s circular transformation method has the largest average coordinate deviation rate when the overlap rate of Agaricus bisporus is 20–50%. The average deviation rate of coordinates obtained by the algorithm in this paper is the smallest in three different intervals of Agaricus bisporus overlap rate.
Table 2 shows the recognition success rate (the proportion of coordinate deviation rate less than 3%) and the overall recognition success rate (the ratio of the number of successful recognitions to the total number of Agaricus bisporus in the original sample image) under different methods.
As shown in Table 2, the recognition success rate of the research method in this paper is 97.25%, and the overall recognition success rate is 96.09%, which is obviously higher than those of the watershed algorithm based on distance transformation and Hough circle transformation algorithm. For the statistics of Agaricus bisporus after segmentation and recognition, the average coordinate deviation rate of the algorithm studied in this paper is only 1.59%, and the average time is 212 ms, which is the shortest of the three methods. It shows that the research method in this paper is effective for the segmentation and recognition of overlapping Agaricus bisporus.
6. Conclusions
This paper takes Agaricus bisporus in a factory environment as the research object. Aiming at the complex overlapping segmentation of Agaricus bisporus, a segmentation identification method of overlapping Agaricus bisporus is proposed. According to the image edge gradient characteristics, the global gradient threshold is calculated to divide the image to obtain the binary image, and then the binary image is filtered and morphologically processed, and the contour is obtained by Canny operator edge detection. We extract the convex hull of the overlapping Agaricus bisporus area and the concave area to simplify the polygon. We also adopt the Harris corner to detect the vertices and determine the segmentation point, and then use the branch definition algorithm to merge and group the dispersed outlines of the same Agaricus bisporus. Finally, we use the least square ellipse fitting algorithm and the minimum distance circle fitting to reconstruct Agaricus bisporus contours. The experimental results show that the recognition rate of overlapping Agaricus bisporus is higher than 96%, the average coordinate deviation rate of the algorithm studied in this paper is only 1.59%, which provides picking demand information for the Agaricus bisporus picking robot. This method is innovative in segmentation recognition of overlapping circular fruit. However, due to the large amount of calculation in this method, it takes a long time. In future research, the algorithm needs to be improved to increase the efficiency of the algorithm.
Author Contributions
S.Y.: Writing—original draft, writing—review and editing, conceptualization, methodology, investigation, data curation, formal analysis, validation, production of related equipment, funding acquisition. B.N.: writing—original draft, writing—review and editing, data curation, validation, software, production of related equipment. W.D.: investigation, writing—review and editing, conceptualization, visualization, software, production of related equipment. T.Y.: investigation, production of related equipment, conceptualization, project administration, funding acquisition. All authors have read and agreed to the published version of the manuscript.
Funding
This research was funded by the Shanghai Agriculture Applied Technology Development Program, Grant No. 2019-02-08-00-10-F01123, and Shanghai Science and Technology Innovation Action Plan—Agriculture, Grant No. 21N21900600.
Institutional Review Board Statement
Not applicable.
Informed Consent Statement
Not applicable.
Data Availability Statement
Anyone can access our data by sending an email to [email protected].
Acknowledgments
We acknowledge the Shanghai Lianzhong edible fungus professional cooperative for the use of their mushrooms and facilities.
Conflicts of Interest
The authors declare no conflict of interest.
References
- Hu, X.M.; Wang, C.; Yu, T. Design and application of visual system in the Agaricus bisporus picking robot. JOP Conf. Ser. 2019, 1187, 032034. [Google Scholar]
- Available online: https://www.fao.org/home/en/ (accessed on 15 March 2022).
- Zhou, Y.S.; Li, Q.; Li, H.Y.; Wang, R.G.; He, W.B. Application of computer vision in mushroom picking robots. Trans. Chin. Soc. Agric. Eng. 1995, 11, 27–32. [Google Scholar]
- Liu, Y.; Yu, L.S.; Yang, C.H.; Wang, Z.; Xiong, L.Y. Segmentation and reconstruction of unobstructed overlapping citrus targets. Jiangsu Agric. J. 2019, 35, 1441–1449. [Google Scholar]
- Reed, J.N.; Miles, S.J.; Butler, J.; Baldwin, M.; Noble, R. AE-Automation and emerging technologies: Automatic mushroom harvester development. Agric. Eng. Res. 2001, 78, 15–23. [Google Scholar] [CrossRef]
- Yue, J.R.; Guo, H.; Zhang, X.J.; Yang, W.Z.; Zhou, Y.S. Discussion on the application of picking robot in agriculture. Xinjiang Agric. Mech. 2016, 1, 31–34. [Google Scholar]
- Jia, B.C.; Yang, S.Z.; Yu, T. Research on three picking arm avoidance algorithms for agaricus mushroom picking robot. In Proceedings of the 2020 IEEE International Conference on Advances in Electrical Engineering and Compute Applications, AEECA 2020, Dalian, China, 25–27 August 2020; pp. 325–328. [Google Scholar]
- Masoudian, A.; Mcisaac, K.A. Application of Support Vector Machine to Detect Microbial Spoilage of Mushrooms. In Proceedings of the 2013 International Conference on Computer and Robot Vision, CRV 2013, Regina, SK, Canada, 29–31 May 2013; pp. 281–287. [Google Scholar]
- Huang, M.S.; He, L.; Choi, D.; Pecchia, J.; Li, Y.M. Picking dynamic analysis for robotic harvesting of Agaricus bisporus mushrooms. Comput. Electron. Agric. 2021, 32, 185–256. [Google Scholar] [CrossRef]
- Stajnko, D.; Cmelik, Z. Modeling of apple fruit growth by application of image analysis. Agric. Conspec. Sci. 2005, 70, 59–64. [Google Scholar]
- Zhao, J.; Tow, J.; Katupitiya, J. On-tree fruit recognition using texture properties and color data. In Proceedings of the International Conference on Intelligent Robots and Systems, Edmonton, AB, Canada, 5 December 2005; IEEE Press: New York, NY, USA, 2005; pp. 3993–3998. [Google Scholar]
- Yu, G.H.; Luo, J.M.; Zhao, Y. Region labeling technology and mushroom image segmentation method based on sequential scanning algorithm. J. Agric. Eng. 2006, 4, 139–142. [Google Scholar]
- Yang, Y.Q.; Ye, M.; Lu, D.H.; Ren, S.G. Adhesion mushroom positioning algorithm under corner density characteristics. Comput. Syst. Appl. 2018, 27, 119–125. [Google Scholar]
- Park, C.; Huang, J.Z.; Ji, J.X.; Ding, Y. Segmentation, inference and classification of partially overlapping nanoparticles. IEEE Trans. Pattern Anal. Mach. Intell. 2013, 35, 669–681. [Google Scholar]
- Zhang, W.H.; Jiang, X.; Liu, Y.M. A method for recognizing overlapping elliptical bubbles in bubble image. Pattern Recogn. Lett. 2012, 33, 1543–1548. [Google Scholar] [CrossRef]
- Bai, X.; Sun, C.; Zhou, F. Splitting touching cells based on concave points andellipse fitting. Pattern Recogn. 2009, 42, 2434–2446. [Google Scholar] [CrossRef]
- Zafari, S.; Eerola, T.; Sampo, J.; Kalviainen, H.; Haario, H. Segmentation of partially overlapping nanoparticles using concave points. In Proceedings of the 11th International Symposium on Advances in Visual Computing, ISVC 2015, Las Vegas, NV, USA, 14–16 December 2015; pp. 187–197. [Google Scholar]
- Yeo, T.; Jin, X.; Ong, S.; Sinniah, R. Clump splitting through concavityanalysis. Pattern Recogn. Lett. 1994, 15, 1013–1018. [Google Scholar] [CrossRef]
- Wang, F.Y.; Zheng, J.Y.; Zhao, J.; Lu, D.; Liu, Y.Z.; Zhao, W.X. The grading algorithm of Agaricus bisporus based on machine vision. Jiangsu Agric. Sci. 2018, 46, 193–197. [Google Scholar]
- Wang, F.Y.; Zheng, J.Y.; Tian, X.C.; Wang, J.F.; Niu, L.Y.; Feng, W.J. An automatic sorting system for fresh white button mushrooms based on image processing. Comput. Electron. Agric. 2018, 151, 416–425. [Google Scholar] [CrossRef]
- Sun, J.W.; Zhao, K.X.; Ji, J.T.; Zhu, X.F.; Ma, H. Detection and diameter measurement method of Agaricus bisporus based on “submerged method”. J. Agric. Mech. Res. 2021, 2, 29–33. [Google Scholar]
- Chen, K.X.; Yao, L.N.; Zhang, D.L.; Wang, X.Z.; Chang, X.J.; Nie, F.P. A semisupervised recurrent convolutional attention model for human activity recognition. IEEE Trans. Neural Netw. Learn Syst. 2020, 31, 1747–1756. [Google Scholar] [CrossRef]
- Luo, M.N.; Chang, X.L.; Nie, L.Q.; Yang, L.; Hauptmann, A.G.; Zheng, Q.H. An adaptive semisupervised feature analysis forvideo semantic recognition. IEEE Trans. Cybern. 2018, 48, 648–660. [Google Scholar] [CrossRef]
- Zhang, D.L.; Yao, L.N.; Chen., K.X.; Wang., S.; Chang, X.J.; Liu, Y.H. Making sense of spatio-temporal preserving representations for EEG-based human intention recognition. IEEE Trans. Cybern 2019, 50, 3033–3044. [Google Scholar] [CrossRef]
- Zhong, C.; Li, L.S.; Ding, P. Automatic segmentation of bingtang orange image based on color difference and gradient features. Sci. Technol. 2018, 1, 26–27. [Google Scholar]
- Ma, H.; Zhang, L. Ocean SAR image segmentation and edge gradient feature extraction. J. Coast. Res. 2019, 94, 141–144. [Google Scholar] [CrossRef]
- Jiang, M.; Sun, S.S.; He, D.J.; Song, H.B. Occlusion apple target recognition and positioning method combining K-means clustering segmentation algorithm and convex hull principle. Smart Agric. 2019, 1, 45–54. [Google Scholar]
- Yang, C.H.; Hu, Y.C.; Huang, L.; Liu, S.; Liu, Y.P. Overlapped Fruit Recognition for Citrus Harvesting Robot in Natural Scenes. In Proceedings of the 2017 2nd International Conference on Robotics and Automation Engineering, ICRAE 2017, Shanghai, China, 29–31 December 2017; pp. 398–402. [Google Scholar]
- Sikka, P.; Asati, A.R.; Shekhar, C. Real time FPGA implementation of a high speed and area optimized Harris corner detection algorithm. Microprocess. Microsyst. 2021, 80, 103514. [Google Scholar] [CrossRef]
- Morrison, D.R.; Jacobson, S.H.; Sauppe, J.J. Branch-and-bound algorithms: A survey of recent advances in searching, branching, and pruning. Discret. Optim. 2016, 19, 79–102. [Google Scholar] [CrossRef]
- Lempitsky, V.S.; Blake, A.; Rother, C. Image Segmentation by Branch-and-Mincut. In Proceedings of the 10th European Conference on Computer Vision, ECCV 2008, Marseille, France, 12–18 October 2008; pp. 15–29. [Google Scholar]
- Coniglio, S.; Furini, F.; San, S.P. A new combinatorial branch-and-bound algorithm for the Knapsack Problem with Conflicts. Eur. J. Oper. Res. 2021, 289, 435–455. [Google Scholar] [CrossRef]
- Zafari, S.; Eerola, T.; Sampo, J. Segmentation of partially overlapping convex objects using branch and bound algorithm. In Proceedings of the 13th Asian Conference on Computer Vision, ACCV 2016, Taipei, Taiwan, 20–24 November 2016; pp. 76–90. [Google Scholar]
- Loy, G.; Zelinsky, A. Fast radial symmetry for detecting points of interest. IEEE Trans. Pattern Anal. Mach. Intell. 2003, 25, 959–973. [Google Scholar] [CrossRef] [Green Version]
Figure 1.
Flow chart of segmentation of Agaricus bisporus.

Figure 2.
Image edge gradient. (a) X direction gradient map; (b) Y direction gradient map.

Figure 3.
The segmented image after calculating the global gradient threshold. (a) Original image; (b) binary image after segmentation.
Figure 3.
The segmented image after calculating the global gradient threshold. (a) Original image; (b) binary image after segmentation.

Figure 4.
Agaricus bisporus area and outline. (a) Image after open operation; (b) edge detection.

Figure 5.
Overlapping Agaricus bisporus convex shell. (a) Convex hull curve extraction; (b) convex hull enclosed area.
Figure 5.
Overlapping Agaricus bisporus convex shell. (a) Convex hull curve extraction; (b) convex hull enclosed area.

Figure 6.
Extraction and simplification of concave areas. (a) Concave area; (b) polygon simplification.
Figure 6.
Extraction and simplification of concave areas. (a) Concave area; (b) polygon simplification.

Figure 7.
Vertex detection. (a) Corner detection; (b) corner display on the outline.

Figure 8.
Contour segmentation of Agaricus bisporus. (a) Split point; (b) split contour segment.

Figure 9.
The contour representation after segmentation.

Figure 10.
Contour fragment search tree.

Figure 11.
Search tree grouping expansion process.

Figure 12.
Grouped outline fragments.

Figure 13.
Flow chart of reconstruction contour.

Figure 14.
Oval profile of Agaricus bisporus.

Figure 15.
Circle outline of Agaricus bisporus.

Figure 16.
Recognition effect of Agaricus bisporus.

Figure 17.
The Agaricus bisporus multi-arm intelligent picking robot working in the multistory shelf trays in the factory environment.
Figure 17.
The Agaricus bisporus multi-arm intelligent picking robot working in the multistory shelf trays in the factory environment.

Figure 18.
Comparison of the recognition effects of overlapping Agaricus bisporus.

Figure 19.
Comparison of average deviation rate of Agaricus bisporus coordinates under different overlap rates.
Figure 19.
Comparison of average deviation rate of Agaricus bisporus coordinates under different overlap rates.


Table 1.
Comparison of different methods for segmentation and identification of overlapping Agaricus bisporus.
Table 1.
Comparison of different methods for segmentation and identification of overlapping Agaricus bisporus.
| Method | Number of Samples | Effective Identification Number | Recogniton Reate |
|---|---|---|---|
| Hough circle transform algorithm | 6109 | 4338 | 71.01% |
| Watershed algorithm based on distance transformation | 6109 | 5319 | 87.07% |
| The algorithm proposed in this article | 6109 | 6036 | 98.81% |
Table 2.
Comparison of different algorithms for recognition of overlapping Agaricus bisporus.
| Methods | Number of Segmentation and Recognition | Number of Successfully Recognited | Average Deviation Rate of Coordinates | Recognition Success Rate | Overall Recognition Success Rate | Average Time (ms) |
|---|---|---|---|---|---|---|
| Hough circle transform algorithm | 4338 | 3363 | 2.29% | 77.52% | 55.05% | 358 |
| Watershed algorithm based on distance transformation | 5319 | 4570 | 1.99% | 85.92% | 74.81% | 224 |
| The algorithm proposed in this article | 6036 | 5870 | 1.59% | 97.25% | 96.09% | 212 |
Publisher’s Note: MDPI stays neutral with regard to jurisdictional claims in published maps and institutional affiliations. |
© 2022 by the authors. Licensee MDPI, Basel, Switzerland. This article is an open access article distributed under the terms and conditions of the Creative Commons Attribution (CC BY) license (https://creativecommons.org/licenses/by/4.0/).
Share and Cite
MDPI and ACS Style
Yang, S.; Ni, B.; Du, W.; Yu, T. Research on an Improved Segmentation Recognition Algorithm of Overlapping Agaricus bisporus. Sensors 2022, 22, 3946. https://0-doi-org.brum.beds.ac.uk/10.3390/s22103946
AMA Style
Yang S, Ni B, Du W, Yu T. Research on an Improved Segmentation Recognition Algorithm of Overlapping Agaricus bisporus. Sensors. 2022; 22(10):3946. https://0-doi-org.brum.beds.ac.uk/10.3390/s22103946
Chicago/Turabian StyleYang, Shuzhen, Bowen Ni, Wanhe Du, and Tao Yu. 2022. "Research on an Improved Segmentation Recognition Algorithm of Overlapping Agaricus bisporus" Sensors 22, no. 10: 3946. https://0-doi-org.brum.beds.ac.uk/10.3390/s22103946
Note that from the first issue of 2016, this journal uses article numbers instead of page numbers. See further details here.