Design of a Smart Ultrasonic Transducer for Interconnecting Machine Applications

Abstract
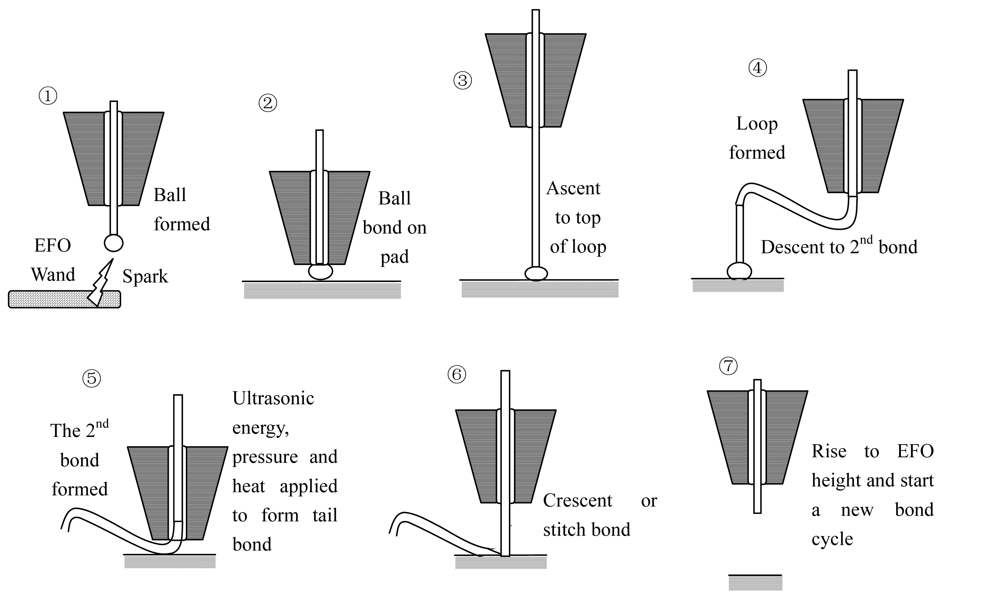
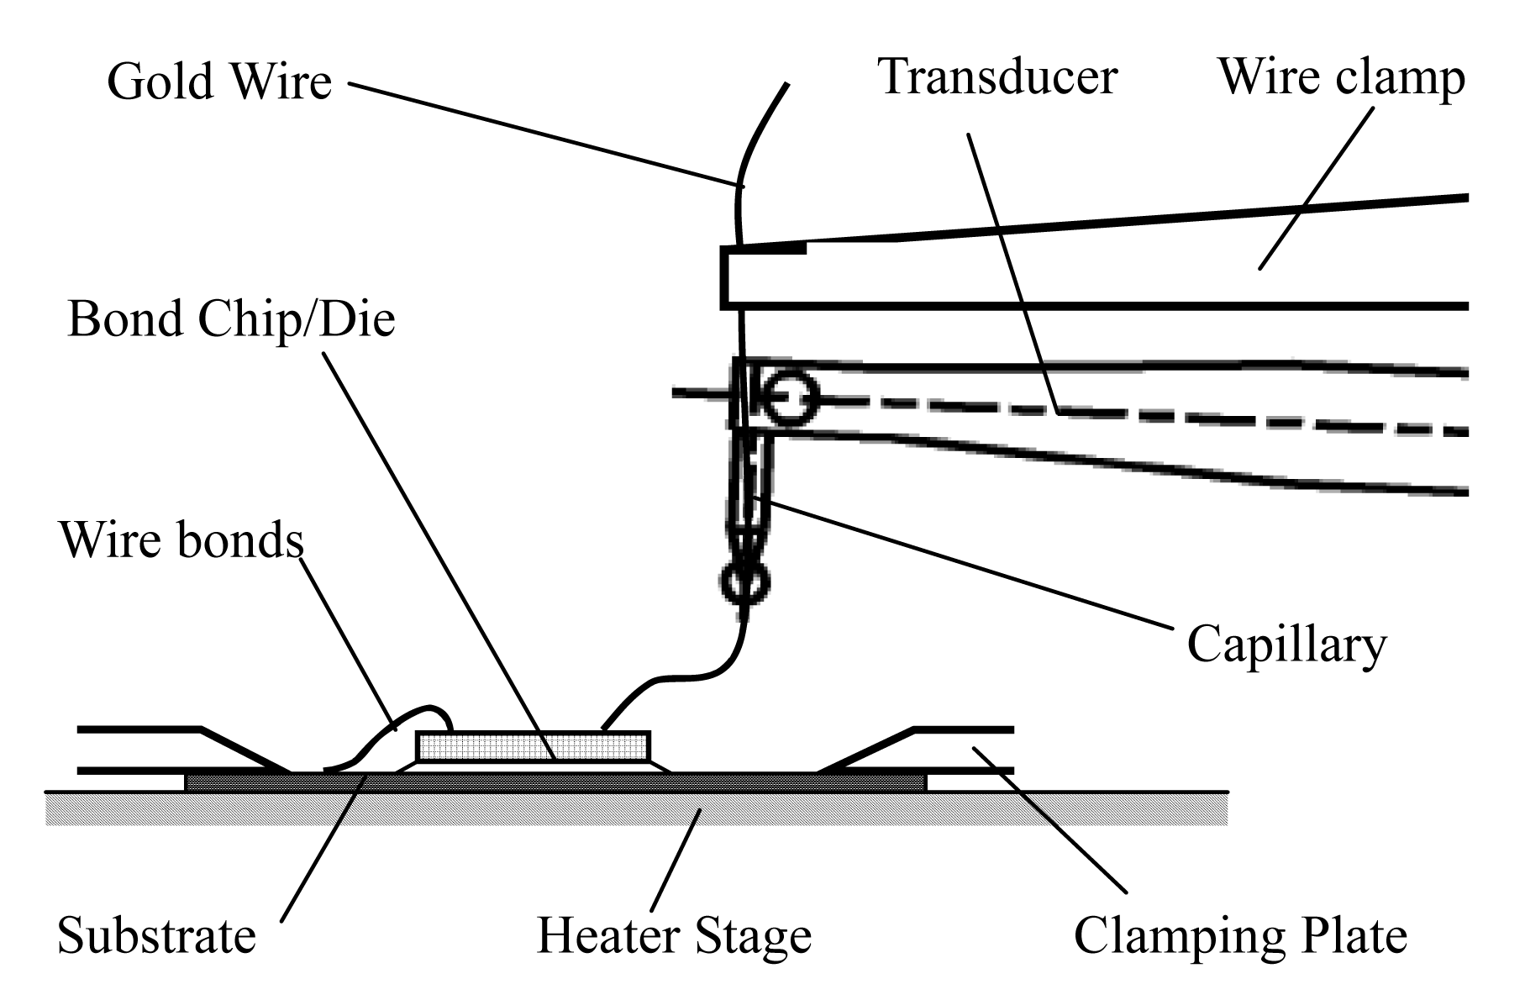
:1. Introduction
2. The System Configuration and Performances
3. Finite Element Modeling Techniques for the Transducer
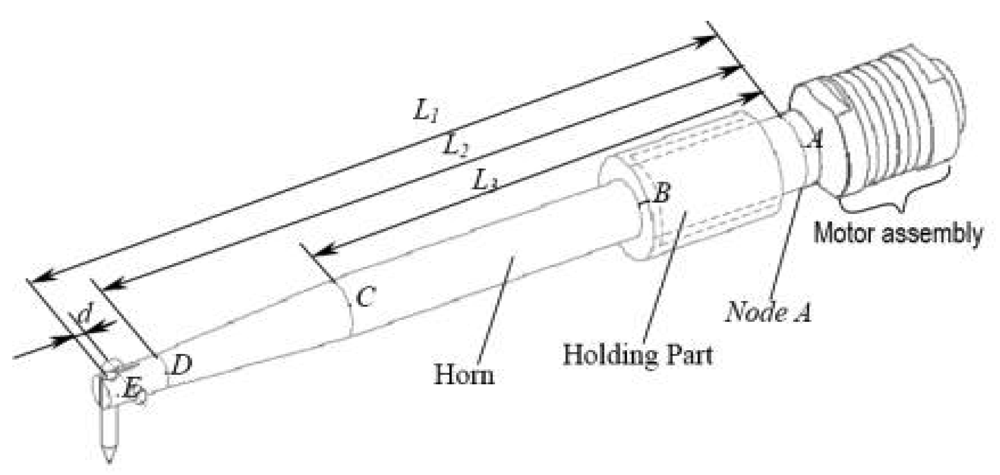
3.1. Parts Models and Design Rules
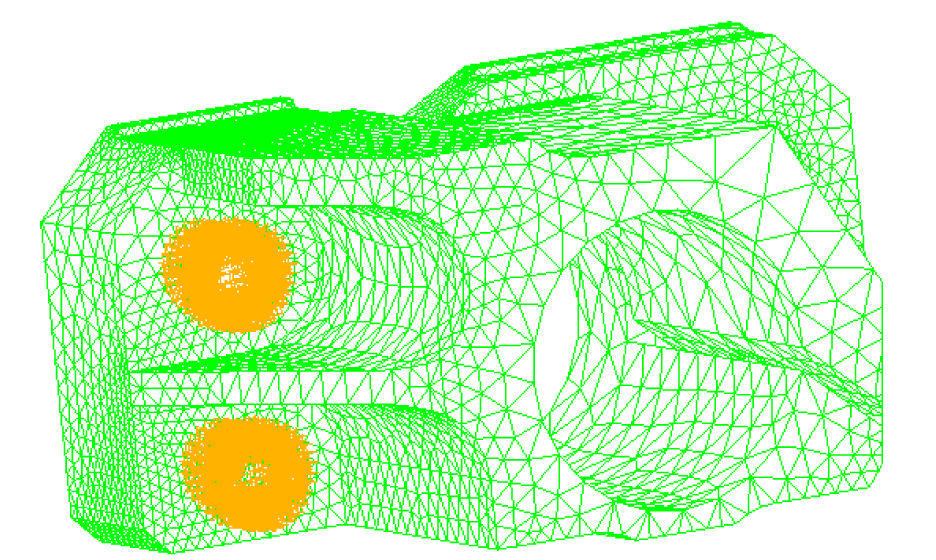
1. Ultrasonic motor assembly
2. Ultrasonic sonotrode horn
3. Ultrasonic sonotrode with amplifie
4. Transducer capillary
5. Transducer Holder
3.2. FEM Simulation of the Transducer
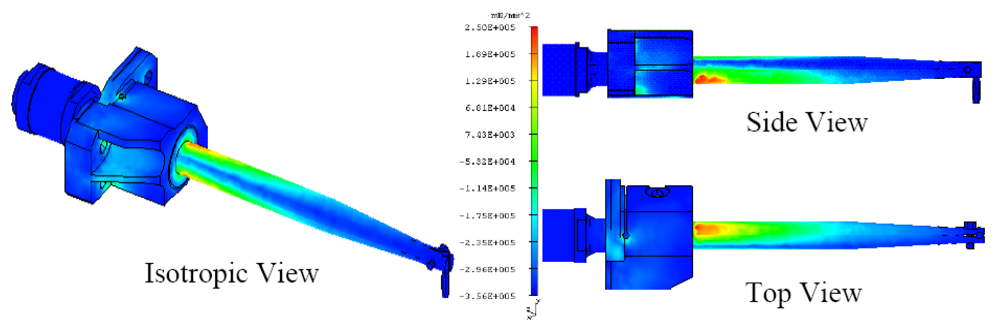
4. FEM Results and Discussion
- Transducer tip is maintained at a distance of 88.6 mm away from the pivot center;
- Fixing locations are kept same/constant for all designs;
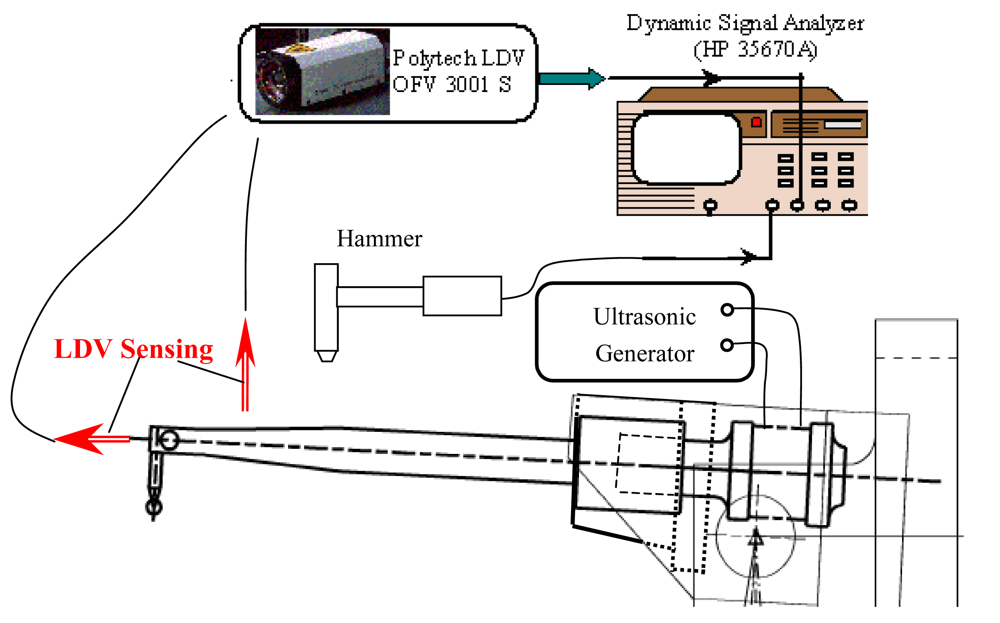
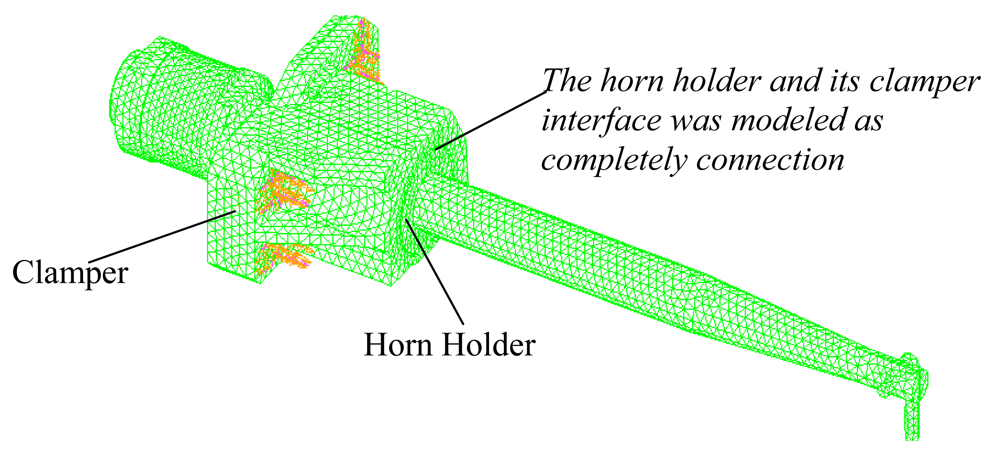
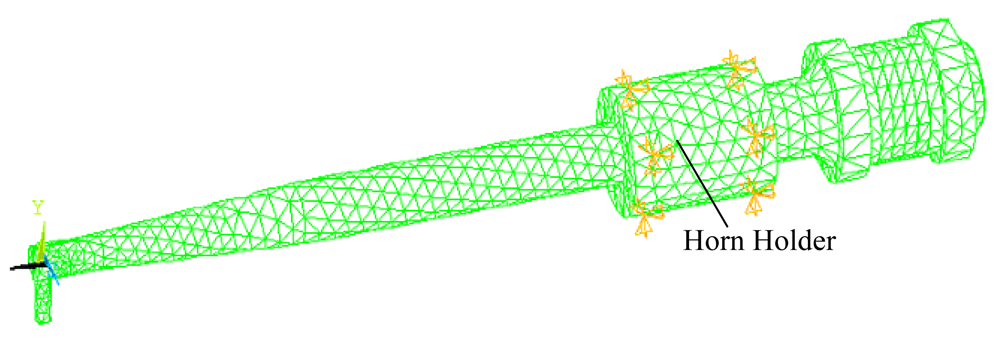
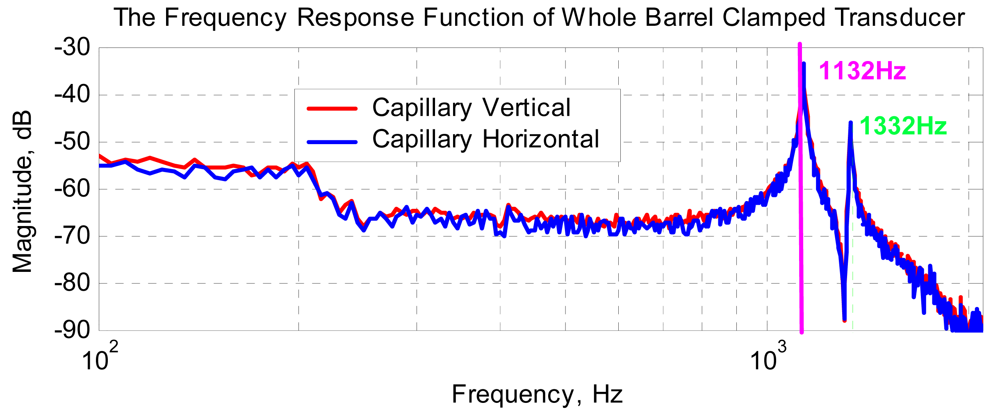
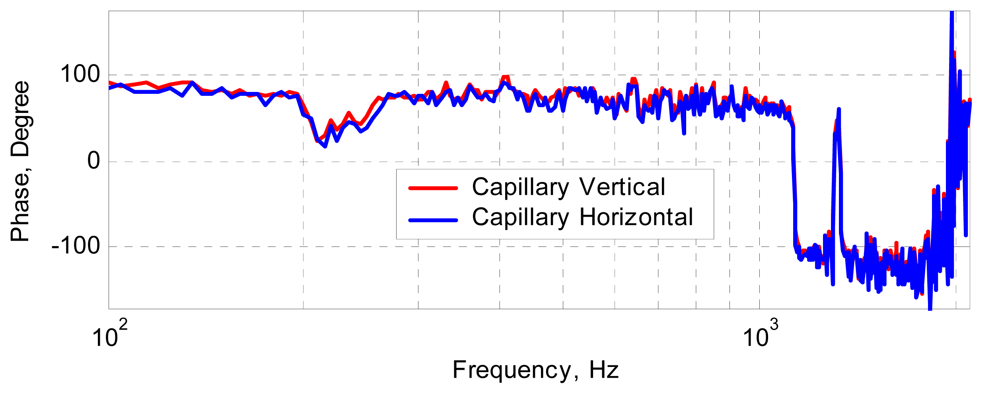
- In cylindrical holder design, the transducer is fixed at eight location points or completely clamped. The ideal holding point for the transducer should be a node located at point B when working at a longitudinal mode for transforming the mechanical energy at a certain frequency, e.g. 95 kHz or 138 kHz. Whereas in barrel holder design, the two dimensions for its diameter are considered for FEM simulation and experimental testing, one diameter is 13.0 mm, the other diameter is 11.0 mm; the studied cases and final dimensions are shown in Table 2. The FE Model for a commercial transducer was calibrated by experiments results, which are obtained from the setup shown in Figure 4.
- If joint stiffness in system level is considered, these frequencies would be less and tip deflection would be higher, the additional joint stiffness should be possibly avoided in design.
5. Conclusions
Acknowledgments
References and Notes
- Tummala, R.R.; Rymaszewski, E.J. Microelectronics Packaging Handbook [M]Part I; 2nd ed.; Chapman & Hall: New York, NY, USA, 1997; pp. I-37–38. [Google Scholar]
- Harman, G. Wire Bonding in Microelectronics: Materials, Processes, Reliability, and Yield, 2nd ed.; McGraw-Hill: New-York, NY, USA, 1997. [Google Scholar]
- Leung, M.L.H.; Lai-Wah, H.C.; Chou-Kee, P.L. Comparison of bonding defects for longitudinal and transverse thermosonic flip-chip. 2003 Electronics Packaging Technology Conference, 10-12 December 2003; pp. 350–355.
- Or, S.W.; Chan, H.L.W.; Lo, V.C.; Yuen, C.W. Ultrasonic wire-bond quality monitoring using piezoelectric sensor. Sens. Actuat. 1998, A65, 69–75. [Google Scholar]
- Ramminger, S.; Seliger, N.; Wachutka, G. Reliability model for Al wire bonds subjected to heel crack failures. Microelectron. Reliab. 2000, 40, 1521–1525. [Google Scholar]
- Mayer, M. Microelectronic bonding process monitoring by integrated sensors.; Hartung-Gorre: Konstanz, Germany, 2000; pp. 28–34. [Google Scholar]
- Chiu, S.S.; Chan, H.L.W.; Or, S.W.; Cheung, Y.M.; Liu, P.C.K. Effect of electrode pattern on the outputs of piezosensors for wire bonding process control. Mater. Sci. Eng. 2003, B99, 121–126. [Google Scholar]
- Moorhouse, A.T.; Gibbs, B.M. Prediction of the structureborne noise emission of machine: development of a methodology. J. Sound Vib. 1993, 167, 223–237. [Google Scholar]
- Han, L.; Zhong, J.; Gao, G.Z. Effect of tightening torque on transducer dynamics and bond strength in wire bonding. Sens. Actuat. A 2008, 141, 695–702. [Google Scholar]
- Chua, P.W.P.; Li, H.L.; Chan, H.L.W.; Ng, K.M.W.; Liu, P.C.K. Smart ultrasonic transducer for wire-bonding applications. Mat. Chem. Phys. 2002, 75, 95–100. [Google Scholar]
- Chua, P.W.P.; Chong, C.P.; Chan, H.L.W.; Ng, K.M.W.; Liu, P.C.K. Placement of piezoelectric ceramic sensors in ultrasonic wire-bonding transducers. Microelectron. Eng. 2003, 66, 750–759. [Google Scholar]
- Or, S.W.; Chan, H.L.W. Dynamics of an ultrasonic transducer used for wire bonding. IEEE Trans. Ultrason. Ferroelectr. Freq. Control 1998, 45, 1453–1460. [Google Scholar]
- Parrini, L. New technology for the design of advanced ultrasonic transducers for high-power applications. Ultrasonics 2003, 41, 261–269. [Google Scholar]
- Tsujino, J.; Yoshihara, H.; Sano, T.; Ihara, S. High-frequency ultrasonic wire bonding systems. Ultrasonics 2000, 38, 77–80. [Google Scholar]
- Or, S.W.; Chan, H.L.W.; Liu, P.C.K. Piezocomposite ultrasonic transducer for high-frequency wire-bonding of microelectronics devices. Sens. Actuat. A 2007, 133, 195–199. [Google Scholar]
- Michael, M.; Juerg, S.; Daniel, B.; Oliver, P.; Juergen, S. Active Test Chips for in situ Wire Bonding Process Characterisation. Proceeding SEMICON® Singapore 2001, Assembly and Packaging Seminar; 2001; pp. 159–168. [Google Scholar]
- Parrini, L. Advances process characterization for 125 kHz wire bonder ultrasonic transducer. IEEE Trans. Compon. Packag. Technol. 2002, 25, 486–494. [Google Scholar]
- Chylak, B.; Qin, I.W.; Eder, J. Achieve Optimal Wire Bonding Performance through Ultrasonic System Improvement. Kulicke and Soffa Industries, Inc. SEMICON® Singapore. 2004. [Google Scholar]
- Ditri, J.; Eder, J. Real Time Ultrasonic Bond Quality Monitoring. Originally presented at SEMICON® Singapore; 2002; pp. A1–A7. [Google Scholar]
- UTHE 200 kHz SYSTEM TRANSDUCERS. Available online: http://www.bita.se/bitase1/u-200k.htm.
- Haftka, R.T.; Gürdal, Z.; Kamat, M.P. Elements of Structural Optimization; Kluwer Academic Publishers: Dordrecht, the Netherlands, 1990. [Google Scholar]


| (Unit) | Steel | Titanium | Alumina | PZT | Aluminum | Capillary | |
|---|---|---|---|---|---|---|---|
| Young's Modulus | Gpa | 210 | 110 | 300 | 92 | 70 | 301 |
| Poisson's ratio | - | 0.3 | 0.32 | 0.2 | 0.33 | 0.30 | 0.21 |
| Density | Kg/m3 | 7800 | 4430 | 3720 | 7700 | 2700 | 3718 |
| Thermal Expansion | 10-6/K | 15 | 9 | - | d31,d32* | 23 | - |
| Length (mm) | Horn Diameter | Holder Completely Clamped, fixed via four screws | Holder fixed via eight points directly |
| L1 = 82.0; L2 = 75.0 L3 = 54.0; d = 2.0 | 13.0 mm | Case 1 | Case 2 |
| 11.0 mm | Case 3 | Case 4 |
| Experimental Results for Complete Holder Clamping, fixed four screws Torque = 0.4 N·m | Case 1: FEA with Complete Holder Clamping | Case 2: FEA Using 8 Points Constraints | ||||
|---|---|---|---|---|---|---|
| Capillary Vertical (Hz) | Capillary Horizontal (Hz) | Mode 1 (Hz) | Mode 2 (Hz) | Mode 1 (Hz) | Mode 2 (Hz) | |
| Mode 1 | 1,132 | 1,132 | 1,140 | 1,331 | 1,444 | 1,454 |
| Mode 2 | 1,332 | 1,332 | +0.44% | -0.3% | +27% | +9.0% |
| Experimental Results for Complete Holder Clamping, fixed four screws | Case 3: FEA Using Complete Holder | Case 4: FEA Using 8 Points Constraints | |||||
|---|---|---|---|---|---|---|---|
| Torque = 0.5 N·m | Torque = 0.4 N·m | ||||||
| Capillary Vertical (Hz) | Capillary Horizontal (Hz) | Capillary Vertical (Hz) | Capillary Horizontal (Hz) | Mode 1 (Hz) | Mode 2 (Hz) | Mode 1 (Hz) | Mode 2 (Hz) |
| 1,100 | 1,065 | 1,080 | 1,045 | 1,123 | 1,295 | 1,540 | 1,652 |
| 1,333 | 1,280 | 1,333 | 1,276 | +2.1% | -2.8% | +40% | +24% |
© 2009 by the authors; licensee Molecular Diversity Preservation International, Basel, Switzerland. This article is an open access article distributed under the terms and conditions of the Creative Commons Attribution license (http://creativecommons.org/licenses/by/3.0/).
Share and Cite
Yan, T.-H.; Wang, W.; Chen, X.-D.; Li, Q.; Xu, C. Design of a Smart Ultrasonic Transducer for Interconnecting Machine Applications. Sensors 2009, 9, 4986-5000. https://0-doi-org.brum.beds.ac.uk/10.3390/s90604986
Yan T-H, Wang W, Chen X-D, Li Q, Xu C. Design of a Smart Ultrasonic Transducer for Interconnecting Machine Applications. Sensors. 2009; 9(6):4986-5000. https://0-doi-org.brum.beds.ac.uk/10.3390/s90604986
Chicago/Turabian StyleYan, Tian-Hong, Wei Wang, Xue-Dong Chen, Qing Li, and Chang Xu. 2009. "Design of a Smart Ultrasonic Transducer for Interconnecting Machine Applications" Sensors 9, no. 6: 4986-5000. https://0-doi-org.brum.beds.ac.uk/10.3390/s90604986