Altered Proteins in the Hippocampus of Patients with Mesial Temporal Lobe Epilepsy

 , ,
, ,
Abstract
:1. Introduction
2. Results
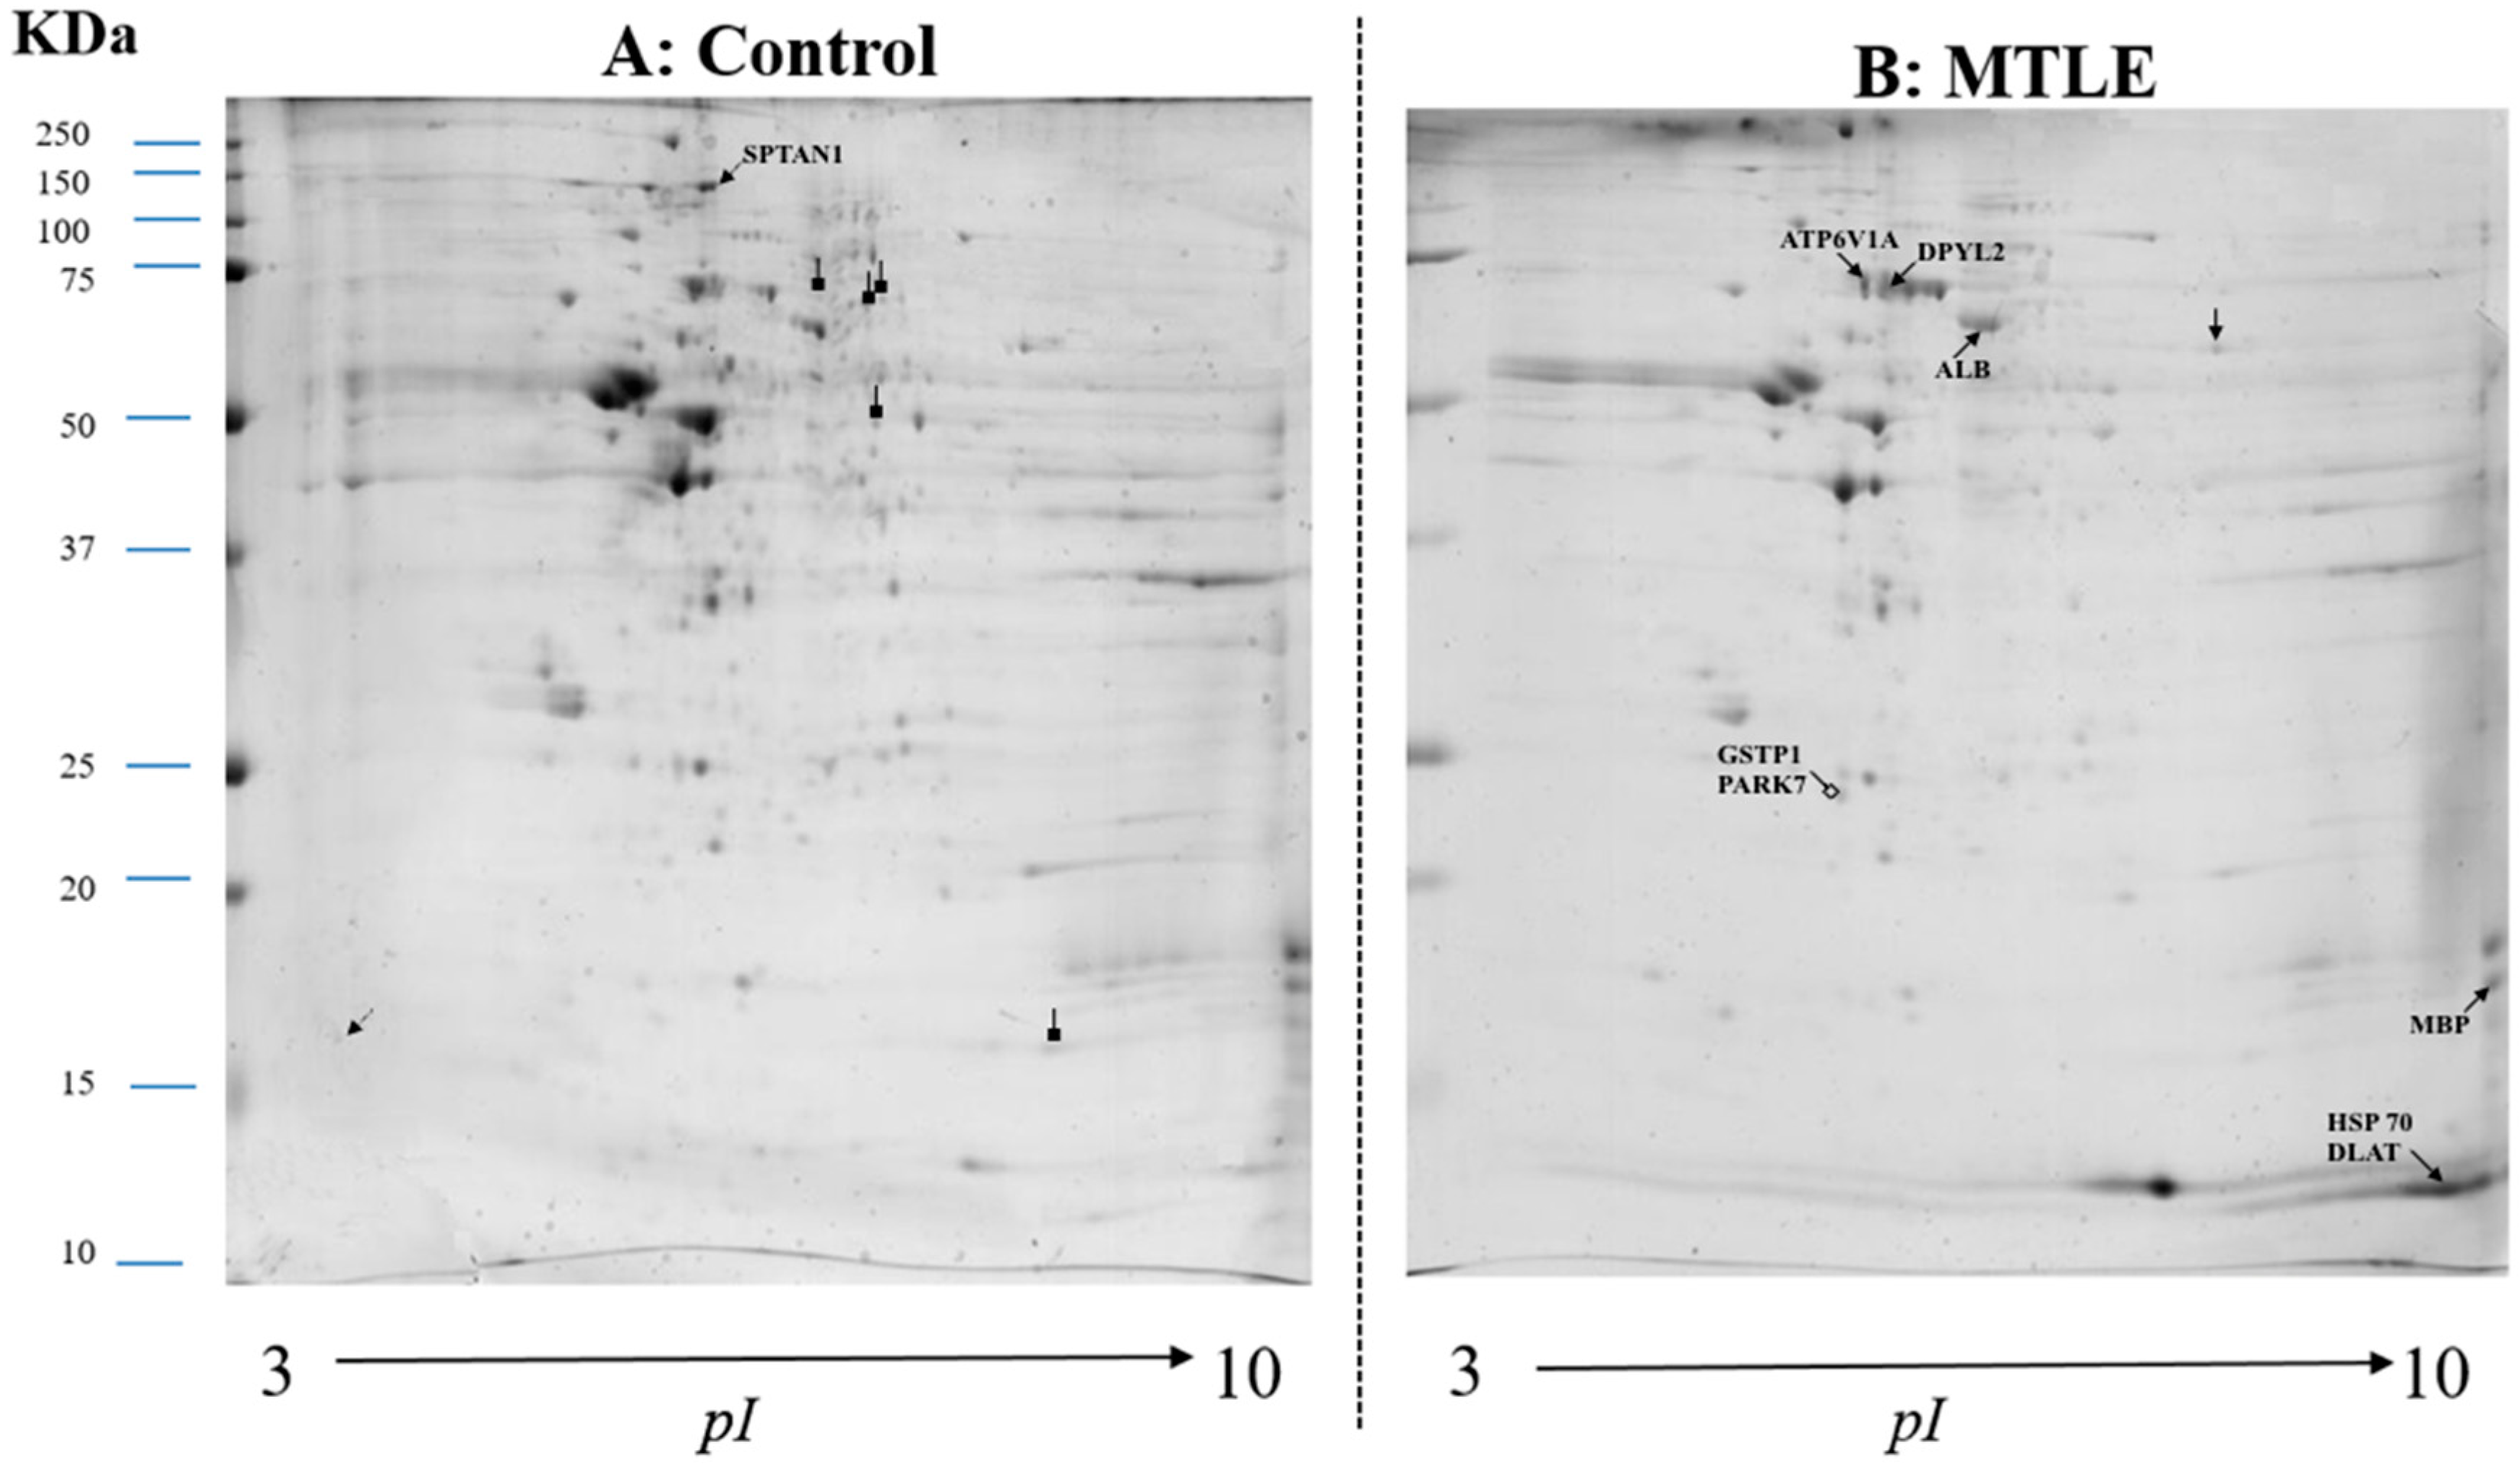
2.1. Comparative Proteomic Analysis
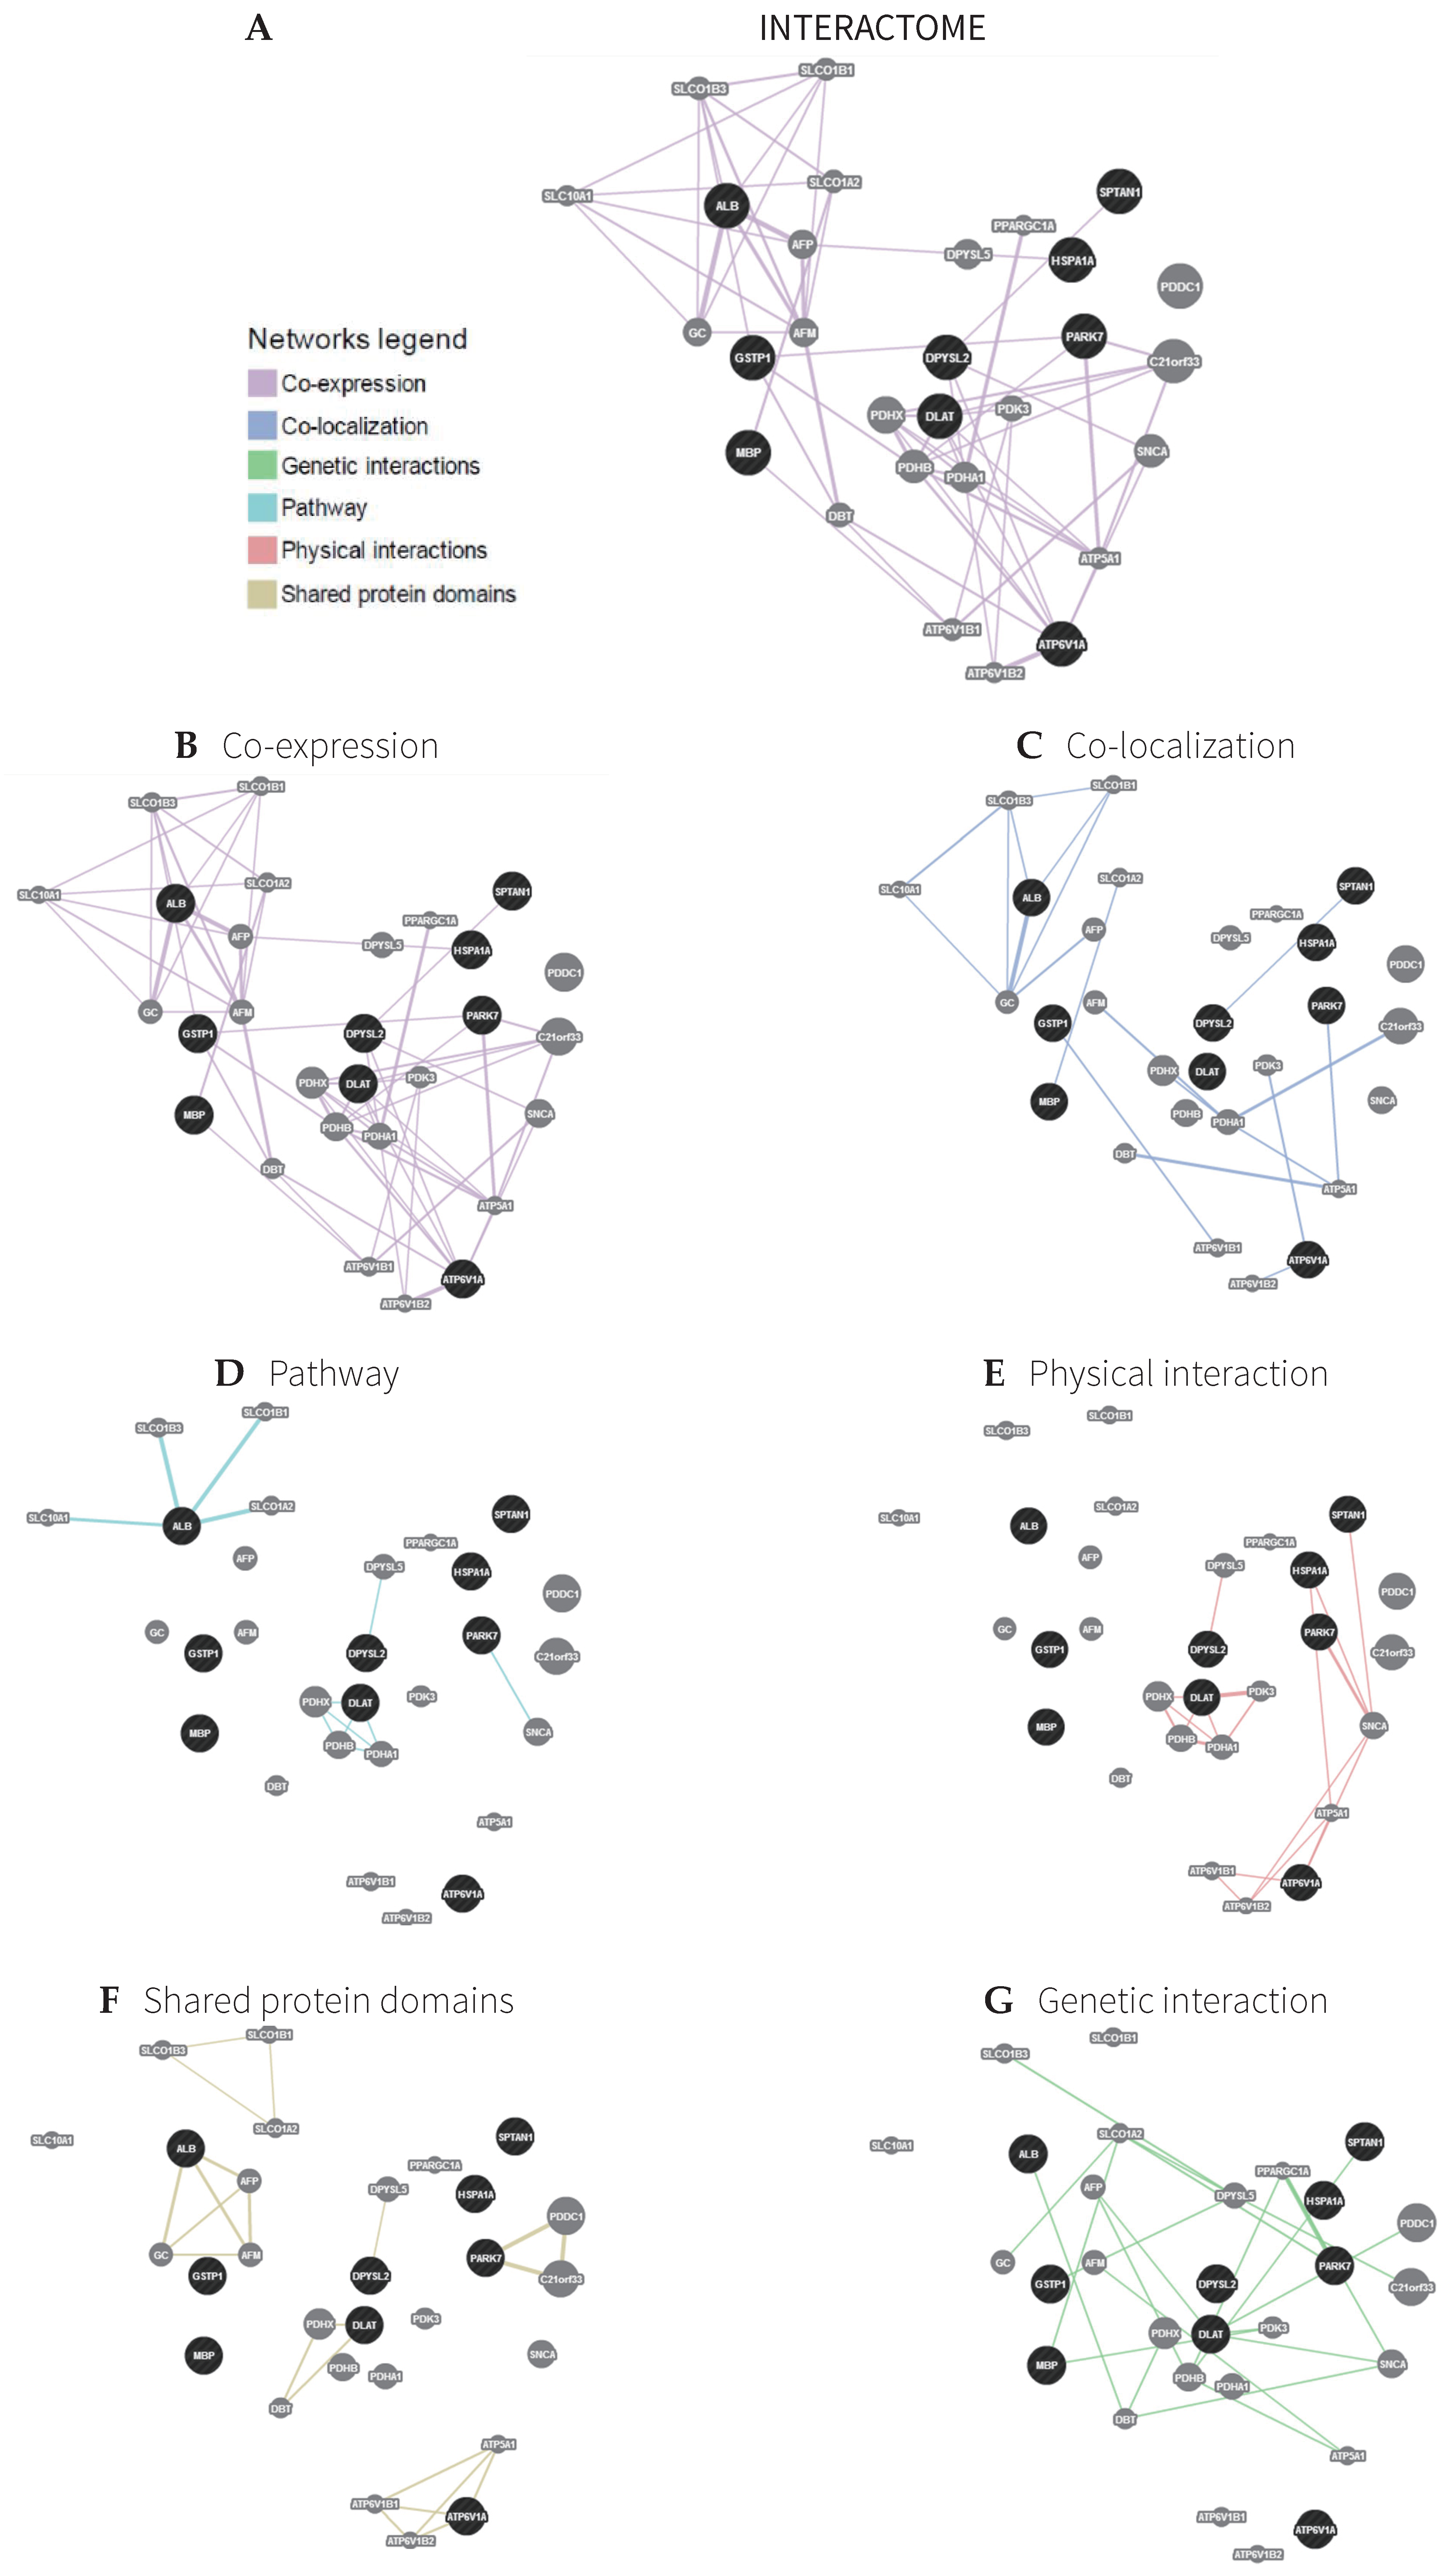
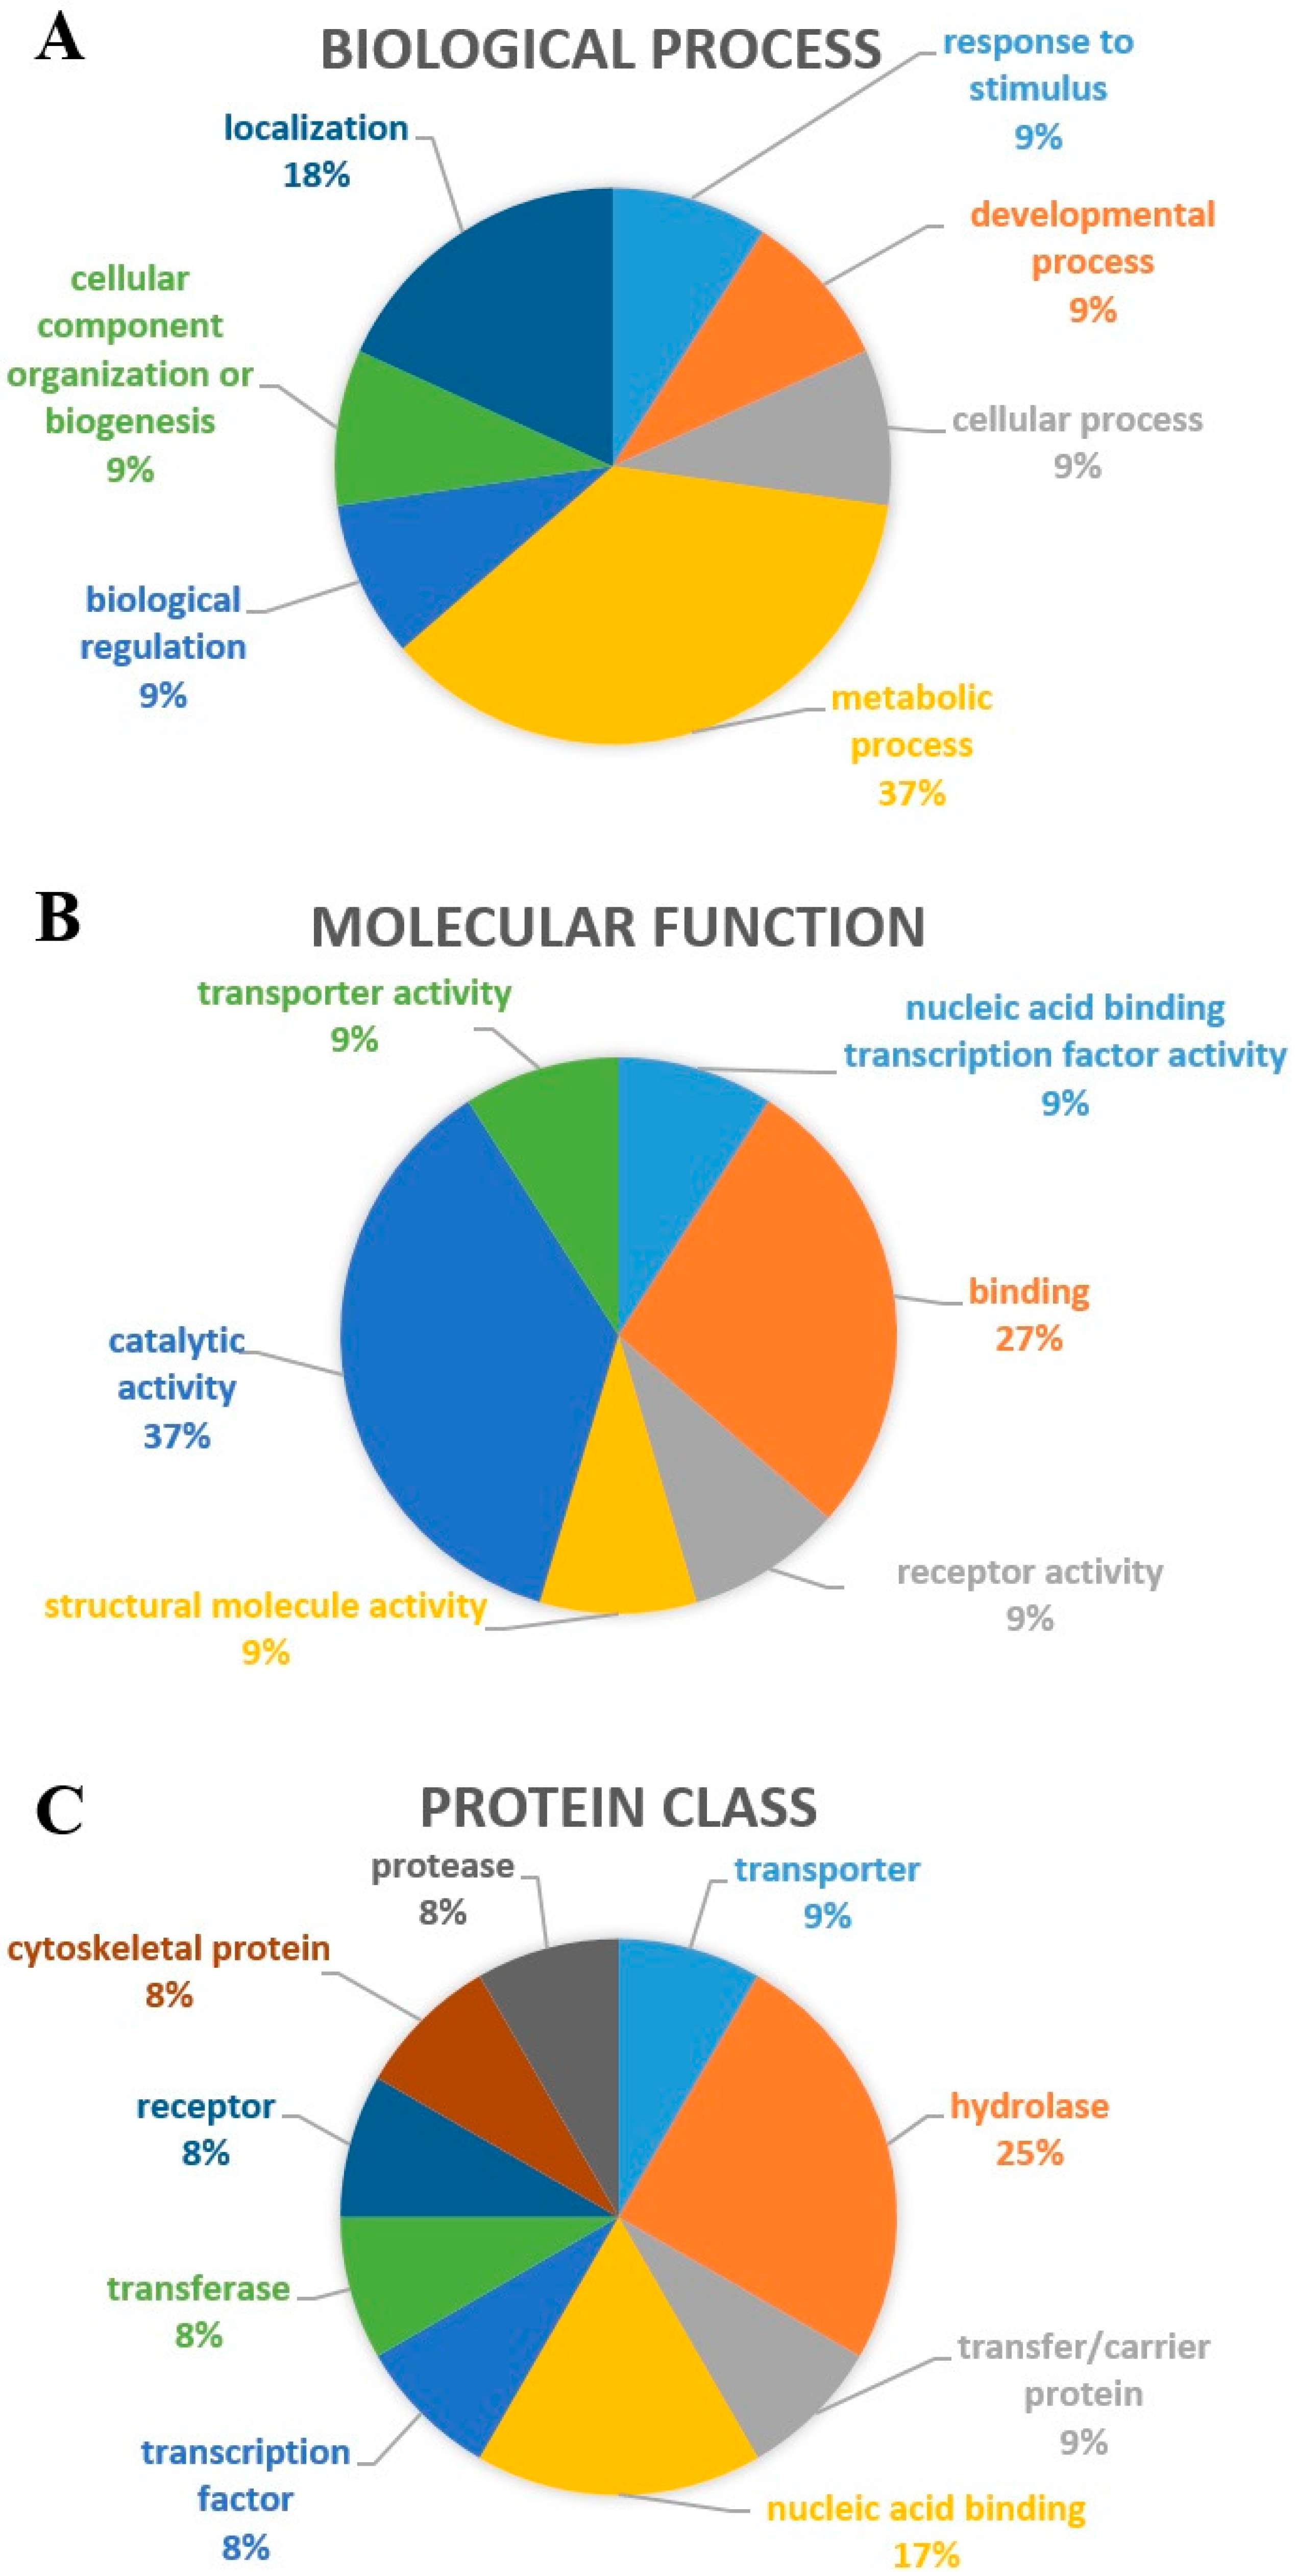
2.2. Interactome
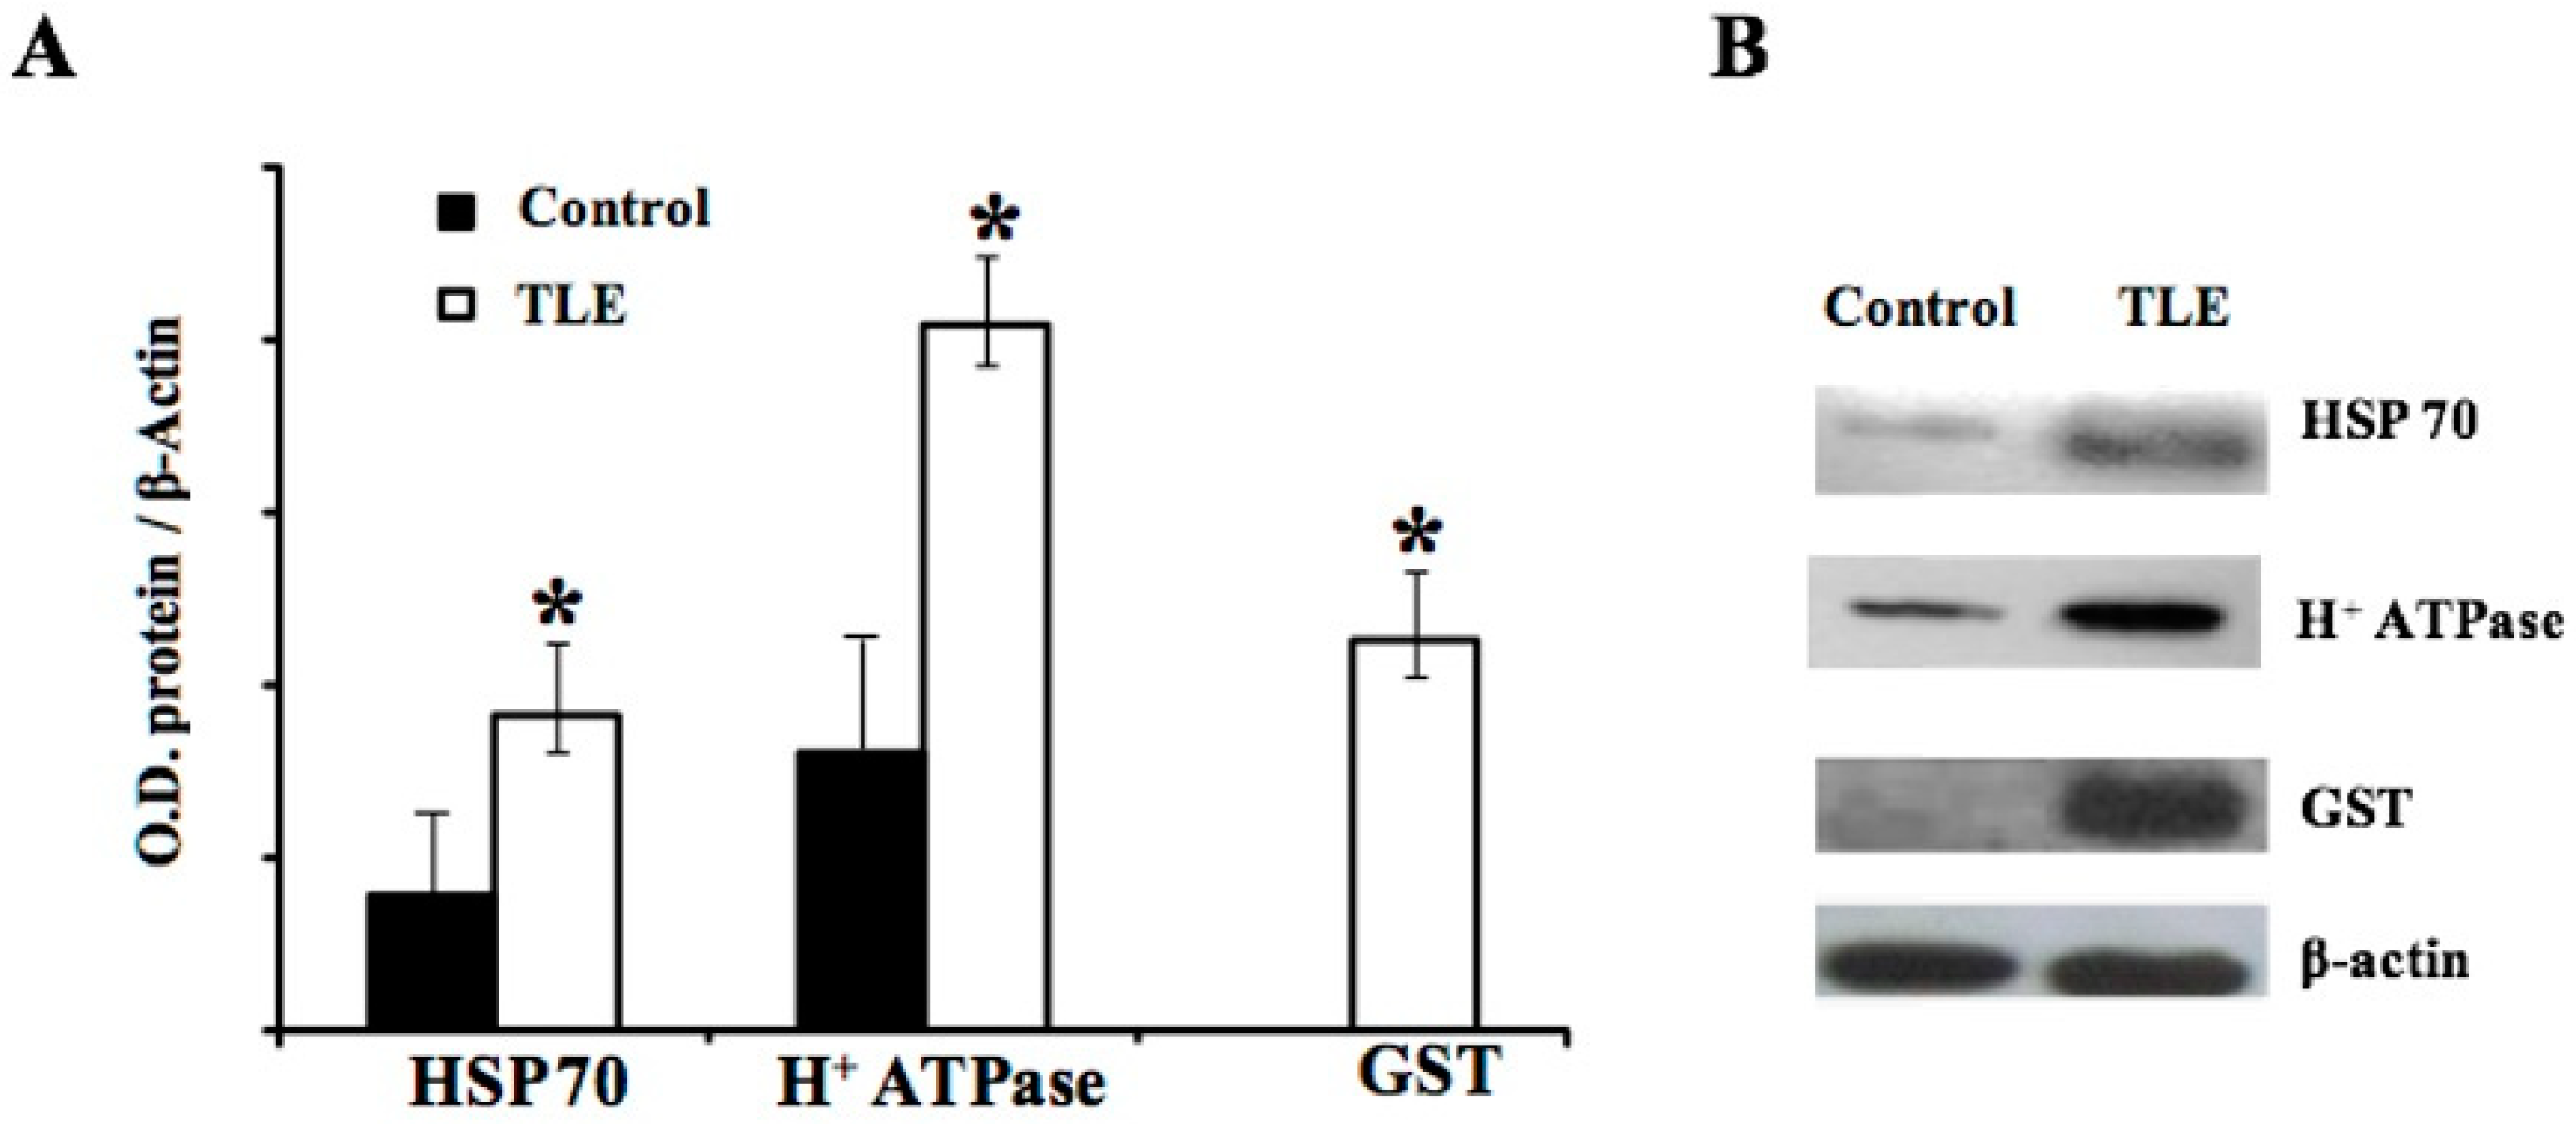
2.3. Western Blot Validation
3. Discussion
3.1. Neuronal Development and Plasticity
3.2. Neuronal Excitability
3.3. Mitochondria and Bioenergetics
3.4. Integrity of the Blood–Brain Barrier and Myelination
3.5. Interactome
4. Materials and Methods
4.1. Human Tissue
4.2. Sample Preparation
4.3. Two-Dimensional Gel Electrophoresis (2-DE)
4.4. Image Analysis for Proteome Determination
4.5. In-Gel Digestion
4.6. Nano-LC-ESI-MS/MS Analysis
4.7. Interactome
4.8. Western Blot
4.9. Statistics
5. Conclusions
Author Contributions
Funding
Acknowledgments
Conflicts of Interest
References
- WHO. 2018. Available online: http://www.who.int/news-room/fact-sheets/detail/epilepsy (accessed on 8 February 2018).
- Engel, J. A Proposed Diagnostic Scheme for People with Epileptic Seizures and with Epilepsy: Report of the ILAE Task Force on Classification and Terminology. Epilepsia 2001, 42, 796–803. [Google Scholar] [CrossRef] [PubMed] [Green Version]
- Mathern, G.W.; Pretorius, J.K.; Babb, T.L. Influence of the type of initial precipitating injury and at what age it occurs on course and outcome in patients with temporal lobe seizures. J. Neurosurg. 1995, 2, 220–227. [Google Scholar] [CrossRef] [PubMed]
- Whelan, C.D.; Altmann, A.; Botia, J.A.; Jahanshad, N. Structural brain abnormalities in the common epilepsies assessed in a worldwide ENIGMA study. Brain 2018, 141, 391–408. [Google Scholar] [CrossRef] [PubMed] [Green Version]
- Graebenitz, S.P.; Cerina, M.; Lesting, J.R.; Kedo, O.; Gorji, A.; Pannek, H.; Hans, V.; Zilles, K.; Pape, H.C.; Speckmann, E.J. Directional spread of activity in synaptic networks of the human lateral amygdala. Neuroscience 2017, 349, 330–340. [Google Scholar] [CrossRef] [PubMed]
- Chen, S.D.; Wang, Y.L.; Liang, S.F.; Shaw, F.Z. Rapid amygdala kindling causes motor seizure and comorbidity of anxiety- and depression-like behaviors in rats. Front. Neurol. 2017, 8, 3. [Google Scholar] [CrossRef] [PubMed]
- French, J.A. Refractory epilepsy: Clinical overview. Epilepsia 2017, 48, 3–7. [Google Scholar] [CrossRef] [PubMed]
- Wotton, C.J.; Goldacre, M.J. Coexistence of schizophrenia and epilepsy: Record-linkage studies. Epilepsia 2012, 53, e71–e74. [Google Scholar] [CrossRef] [PubMed]
- Ravizza, T.; Onat, F.Y.; Brooks-Kayal, A.R.; Depaulis, A.; Galanopoulou, A.S.; Mazarati, A.; Hans, V.; Zilles, K.; Pape, H.; Speckmann, E. WONOEP appraisal: Biomarkers of epilepsy-associated comorbidities. Epilepsia 2017, 58, 331–342. [Google Scholar] [CrossRef] [PubMed]
- Czech, T.; Yang, J.W.; Csaszar, E.; Kappler, J.; Baumgartner, C.; Lubec, G. Reduction of Hippocampal Collapsin Response Mediated Protein-2 in Patients with Mesial Temporal Lobe Epilepsy. Neurochem. Res. 2004, 29, 2189–2196. [Google Scholar] [CrossRef] [PubMed]
- Eun, J.P.; Choi, H.Y.; Kwak, Y.G. Proteomic analysis of human cerebral cortex in epileptic patients. Exp. Mol. Med. 2004, 36, 185–191. [Google Scholar] [CrossRef] [PubMed] [Green Version]
- Xiao, F.; Chen, D.; Lu, Y.; Xiao, Z.; Guan, L.; Yuan, J.; Wang, L.; Xi, Z.; Wang, X. Proteomic analysis of cerebrospinal fluid from patients with idiopathic temporal lobe epilepsy. Brain Res. 2009, 1255, 180–189. [Google Scholar] [CrossRef] [PubMed]
- Yang, J.W.; Czech, T.; Yamada, J.; Csaszar, E.; Baumgartner, C.; Slavc, I.; Lubec, G. Aberrant cytosolic acyl-CoA thioester hydrolase in hippocampus of patients with mesial temporal lobe epilepsy. Amino Acids 2004, 27, 269–275. [Google Scholar] [CrossRef] [PubMed]
- Yang, J.W.; Czech, T.; Gelpi, E.; Lubec, G. Extravasation of plasma proteins can confound interpretation of proteomic studies of brain: A lesson from apo A-I in mesial temporal lobe epilepsy. Mol. Brain Res. 2005, 139, 348–356. [Google Scholar] [CrossRef] [PubMed]
- He, S.; Wang, Q.; He, J.; Pu, H.; Yang, W.; Ji, J. Proteomic analysis and comparison of the biopsy and autopsy specimen of human brain temporal lobe. Proteomics 2006, 6, 4987–4996. [Google Scholar] [CrossRef] [PubMed]
- Mériaux, C.; Franck, J.; Park, D.B.; Quanico, J.; Kim, Y.H.; Chung, C.K.; Park, Y.M.; Steinbusch, H.; Salzet, M.; Fournier, I. Human temporal lobe epilepsy analyses by tissue proteomics. Hippocampus 2014, 24, 628–642. [Google Scholar] [CrossRef] [PubMed]
- Persike, D.S.; Lima, M.L.; Amorim, R.P.; Cavalheiro, E.A.; Yacubian, E.M.T.; Centeno, R.S.; Carrete, H.; Schenkman, S.; Canzian, M.; Fernandes, M.J.S. Hippocampal Proteomic Profile in Temporal Lobe Epilepsy. J. Epilepsy Clin. Neurophysiol. 2012, 218, 53–56. [Google Scholar] [CrossRef]
- Huang, Z.; Zhou, Y.; Xiao, B.; Wu, J.; Wu, X.; Yang, P.; Wu, L. Proteomic screening of postsynaptic density proteins related with temporal lobe epilepsy. Chin. Med. J. 2008, 88, 3205–3209. [Google Scholar]
- Marchi, N.; Teng, Q.; Ghosh, C.; Fan, Q.; Nguyen, M.T.; Desai, N.K.; Bawa, H.; Rasmussen, P.; Masaryk, T.K.; Janigro, D. Blood–brain barrier damage, but not parenchymal white blood cells, is a hallmark of seizure activity. Brain Res. 2010, 1353, 176–186. [Google Scholar] [CrossRef] [PubMed] [Green Version]
- Liu, Z.; Liu, J.; Wang, S.; Liu, S.; Zhao, Y. Neuronal uptake of serum albumin is associated with neuron damage during the development of epilepsy. Exper. Ther. Med. 2016, 12, 695–701. [Google Scholar] [CrossRef] [PubMed]
- Mayer, M.P.; Bukau, B. Hsp70 chaperones: Cellular functions and molecular mechanism. Cell. Mol. Life Sci. 2005, 62, 670–684. [Google Scholar] [CrossRef] [PubMed] [Green Version]
- Castegna, A.; Aksenov, M.; Thongboonkerd, V.; Klein, J.B.; Pierce, W.M.; Booze, R.; Markesbery, W.R.; Butterfield, D.A. Proteomic identification of oxidatively modified proteins in Alzheimer’s disease brain. Part II: Dihydropyrimidinase-related protein 2, alpha-enolase and heat shock cognate 71. J. Neurochem. 2002, 82, 1524–1532. [Google Scholar] [CrossRef] [PubMed]
- Gu, Y.; Ihara, Y. Evidence that collapsin response mediator protein-2 is involved in the dynamics of microtubules. J. Biol. Chem. 2000, 275, 17917–17920. [Google Scholar] [CrossRef] [PubMed]
- Wechsler, A.; Teichberg, V.I. Brain spectrin binding to the NMDA receptor is regulated by phosphorylation, calcium and calmodulin. EMBO J. 1998, 17, 3931–3939. [Google Scholar] [CrossRef] [PubMed] [Green Version]
- Toei, M.; Saum, R.; Forgac, M. Regulation and isoform function of the V-ATPases. Biochemistry 2010, 49, 4715–4723. [Google Scholar] [CrossRef] [PubMed]
- Sharma, R.; Yang, Y.; Sharma, A.; Awasthi, S.; Awasthi, Y.C. Antioxidant Role of Glutathione S-Transferases: Protection Against Oxidant Toxicity and Regulation of Stress-Mediated Apoptosis. Antioxid. Redox Signal. 2004, 6, 289–300. [Google Scholar] [CrossRef] [PubMed]
- Shang, W.; Liu, W.H.; Zhao, X.H.; Sun, Q.J.; Bi, J.Z.; Chi, Z.F. Expressions of glutathione S-transferase alpha, mu, and pi in brains of medically intractable epileptic patients. BMC Neurosci. 2008, 9, 67. [Google Scholar] [CrossRef] [PubMed]
- Taira, T.; Saito, Y.; Niki, T.; Iguchi-Ariga, S.M.; Takahashi, K.; Ariga, H. DJ-1 has a role in antioxidative stress to prevent cell death. EMBO Rep. 2004, 5, 213–218. [Google Scholar] [CrossRef] [PubMed] [Green Version]
- Junn, E.; Jang, W.H.; Zhao, X.; Jeong, B.S. Mouradian MM. Mitochondrial localization of DJ-1 leads to enhanced neuroprotection. J. Neurosci. Res. 2009, 87, 123–129. [Google Scholar] [CrossRef] [PubMed]
- Berg, J.M.; Tymoczko, J.L.; Stryer, L. Biochemistry, 5th ed.; Section 17.1, The Citric Acid Cycle Oxidizes Two-Carbon Units; W. H. Freeman: New York, NY, USA, 2002. [Google Scholar]
- Surguchov, A.; Surgucheva, I.; Sharma, M.; Sharma, R.; Singh, V. Pore-forming proteins as mediators of novel epigenetic mechanism of epilepsy. Front. Neurol. 2017, 8, 3. [Google Scholar] [CrossRef] [PubMed]
- Marques-Carneiro, J.E.; Persike, D.S.; Litzahn, J.J.; Fernandes, M.J.S. Hippocampal Proteome of rats subjected to the Li-pilocarpine epilepsy model and effect of carisbamate treatment. Pharmaceuticals 2017, 10, 67. [Google Scholar] [CrossRef] [PubMed]
- Morimura, R.; Nozawa, K.; Tanaka, H.; Ohshima, T. Phosphorylation of Dpsyl2 (CRMP2) and Dpsyl3 (CRMP4) is required for positioning of caudal primary motor neurons in the zebrafish spinal cord. Dev. Neurobiol. 2013, 73, 911–920. [Google Scholar] [CrossRef] [PubMed] [Green Version]
- Ujike, H.; Sakai, A.; Nakata, K.; Tanaka, Y.; Kodaka, T.; Okahisa, Y.; Harano, M.; Inada, T.; Yamada, M.; Komiyama, T.; et al. Association study of the dihydropyrimidinase-related protein 2 gene and methamphetamine psychosis. Ann. N. Y. Acad. Sci. 2006, 1074, 90–96. [Google Scholar] [CrossRef] [PubMed]
- Curia, G.; Lucchi, C.; Vinet, J.; Gualtieri, F.; Marinelli, C.; Torsello, A.; Costantino, L.; Biagini, G. Pathophysiogenesis of mesial temporal lobe epilepsy: Is prevention of damage antiepileptogenic? Curr. Med. Chem. 2014, 21, 663–688. [Google Scholar] [CrossRef] [PubMed]
- Gray, W.P.; Sundstrom, L.E. Kainic acid increases the proliferation of granule cell progenitors in the dentate gyrus of the adult rat. Brain Res. 1998, 790, 52–59. [Google Scholar] [CrossRef]
- Buga, A.M.; Vintilescu, R.; Balseanu, A.T.; Pop, O.T.; Streba, C. Repeated PTZ treatment at 25-day intervals leads to a highly efficient accumulation of doublecortin in the dorsal hippocampus of rats. PLoS ONE 2012, 7, e39302. [Google Scholar] [CrossRef] [PubMed]
- Schmoll, H.; Badan, I.; Grecksch, G.; Walker, L.; Kessler, C.; Popa-Wagner, A. Kindling status in sprague-dawley rats induced by pentylenetetrazole. Am. J. Pathol. 2003, 162, 1027–1034. [Google Scholar] [CrossRef]
- Zhong, Q.; Ren, B.X.; Tang, F.H. Neurogenesis in the hippocampus of patients with temporal lobe epilepsy. Curr. Neurol. Neurosci. 2016, 16, 1–9. [Google Scholar] [CrossRef] [PubMed]
- Silver, J.T.; Noble, E.G. Regulation of survival gene hsp70. Cell Stress Chaperon. 2012, 17, 1–9. [Google Scholar] [CrossRef] [PubMed]
- Planas, A.M.; Soriano, M.A.; Ferrer, I.; Rodríguez, F.E. Kainic acid-induced heat shock protein-70, mRNA and protein expression is inhibited by MK-801 in certain rat brain regions. Eur. J. Neurosci. 1995, 7, 293–304. [Google Scholar] [CrossRef] [PubMed]
- Wilkens, S.; Zhang, Z.; Zheng, Y. A structural model of the vacuolar ATPase from transmission electron microscopy. Micron 2005, 36, 109–126. [Google Scholar] [CrossRef] [PubMed]
- Wang, Y.; Floor, E. Hydrogen peroxide inhibits the vacuolar H+-ATPase in brain synaptic vesicles at micromolar concentrations. J. Neurochem. 1998, 70, 646–652. [Google Scholar] [CrossRef] [PubMed]
- Li, Z.; Burrone, J.; Tyler, W.J.; Hartman, K.N.; Albeanu, D.F.; Murthy, V.N. Synaptic vesicle recycling studied in transgenic mice expressing synaptopHluorin. Proc. Natl. Acad. Sci. USA 2005, 102, 6131–6136. [Google Scholar] [CrossRef] [PubMed] [Green Version]
- Chan, J.Y.; Chan, S.H. Activation of endogenous antioxidants as a common therapeutic strategy against cancer, neurodegeneration and cardiovascular diseases: A lesson learnt from DJ-1. Pharmacol. Ther. 2015, 156, 69–74. [Google Scholar] [CrossRef] [PubMed]
- Zhou, W.; Barkow, J.C.; Freed, C.R. Running wheel exercise reduces α-synuclein aggregation and improves motor and cognitive function in a transgenic mouse model of Parkinson’s disease. PLoS ONE 2017, 12, e0190160. [Google Scholar] [CrossRef] [PubMed]
- Kovac, S.; Kostova, A.T.D.; Herrmann, A.M.; Melzer, N.; Meuth, S.G.; Gorji, A. Metabolic and homeostatic changes in seizures and acquired epilepsy-mitochondria, calcium dynamics and reactive oxygen species. Int. J. Mol. Sci. 2017, 18, 1935. [Google Scholar] [CrossRef] [PubMed]
- Seyfried, B.T.; Mantis, J.G.; Todorova, M.T.; Greene, A.E. Dietary management of epilepsy: Role of glucose and ketone bodies. In The Encyclopedia of Basic Epilepsy Research; Schwartzkroin, P.A., Ed.; Elsevier Press/Academic Press: San Diego, CA, USA, 2009; Volume 2, pp. 687–693. [Google Scholar]
- Giordano, C.; Marchio, M.; Timofeeva, E.; Biagini, G. Neuroprotective peptides as putative mediators of antiepileptic ketogenic diets. Front. Neurol. 2014, 5, 63. [Google Scholar] [CrossRef] [PubMed]
- You, Y.; Bai, H.; Wang, C.; Chen, L.W.; Liu, B.; Zhang, H.; Gao, G.D. Myelin damage of hippocampus and cerebral cortex in rat pentylenetetrazol model. Brain Res. 2011, 1381, 208–216. [Google Scholar] [CrossRef] [PubMed]
- Keck, M.; Dijk, R.M.; Deeg, C.A.; Kistler, K.; Walker, A.; Rüden, E.L.; Russman, V.; Hauck, S.M.; Potschka, H. Proteomic profiling of epileptogenesis in a rat model: Focus on cell stress, extracellular matrix and angiogenesis. Neurobiol. Dis. 2018, 112, 119–135. [Google Scholar] [CrossRef] [PubMed]
- Vinet, J.; Costa, A.M.; Salinas-Navarro, M.; Leo, G.; Moons, L.; Arckens, L.; Biagini, G. A Hydroxypyrone-Based Inhibitor of Metalloproteinase-12 Displays Neuroprotective Properties in Both Status Epilepticus and Optic Nerve Crush Animal Models. Int. J. Mol. Sci. 2018, 19, 2178. [Google Scholar] [CrossRef] [PubMed]
- Bradford, M.M. A rapid and sensitive method for the quantitation of microgram quantities of protein utilizing the principle of protein-dye binding. Anal. Biochem. 1976, 72, 248–254. [Google Scholar] [CrossRef]
- Candiano, G.; Bruschi, M.; Musante, L.; Santucci, L.; Ghiggeri, G.M.; Carnemolla, B.; Orecchia, P.; Zardi, L.; Righetti, P.G. Blue silver: A very sensitive colloidal Coomassie G-250 staining for proteome analysis. Electrophoresis 2004, 25, 1327–1333. [Google Scholar] [CrossRef] [PubMed]
- Carnielli, C.M.; Winck, F.V.; Leme, A.F.P. Functional annotation and biological interpretation of proteomics data. BBA-Proteins Proteom. 2015, 1854, 46–54. [Google Scholar] [CrossRef] [PubMed]


| IP | Protein Name | MW | Changes |
|---|---|---|---|
| 5.92 | Isoform 1 of Serum albumin—ALB | 71317 |  |
| 5.56 | Heat shock-related 70 kDa protein 2—HSP70 | 70263 |  |
| 8.2 | Dihydropyrimidinase-related protein 2—DPYSL2 | 77912 |  |
| 9.79 | Isoform 1 of Myelin basic protein—MBP | 33097 |  |
| 5.21 | Isoform 3 of Spectrin alpha chain, brain—SPTAN1 | 282906 |  |
| 5.35 | V-type proton ATPase catalytic subunit A—ATP6V1A | 68660 |  |
| 5.43 | Glutathione S-transferase P—GSTP1 | 23569 | + |
| 6.33 | Protein DJ-1—PARK7 | 20050 | + |
| 7.96 | Dihydrolipoamide S-acethyltransferase component of pyruvate dehydrogenase complex, mitochondrial—DLAT | 69466 |  |
| Proteins | Functions | References |
|---|---|---|
| Isoform 1 of Serum albumin—ALB | Regulation of colloidal osmotic pressure of the blood. In the brain is indicative of transient alteration of BBB and cell death. | [18,19,20] |
| Heat shock-related 70 kDa protein 2-HSP70 | Chaperones; compensatory mechanism to neurodegeneration. | [21] |
| Dihydropyrimidinase- related protein 2-DPYSL2 | Phosphoprotein involved with process of axonal outgrowth and regeneration of adult neurons. Its regulating the dynamics of microtubules. | [22,23] |
| Isoform 1 of Myelin basic protein-MBP | The presence in the brain is associated with the changes in the mechanisms of myelination and change in the permeability of the blood brain barrier. | [18,19] |
| Isoform 3 of Spectrin alpha chain, brain-SPTAN1 | Responsible for the anchoring the NMDA receptor to the cell membrane. | [24] |
| V-type proton ATPase catalytic subunit A -ATP6V1A | Release of neurotransmitters and acidification of synaptic vesicles after exocytosis for recycling. | [25] |
| Glutathione S- transferase P-GSTP1 | Antioxidant mechanisms; Inactivation of antiepileptic drugs in the liver Related to drug resistance often present in TLE. | [26,27] |
| Protein DJ-1-PARK7 | Neuroprotection against oxidative stress. | [28,29] |
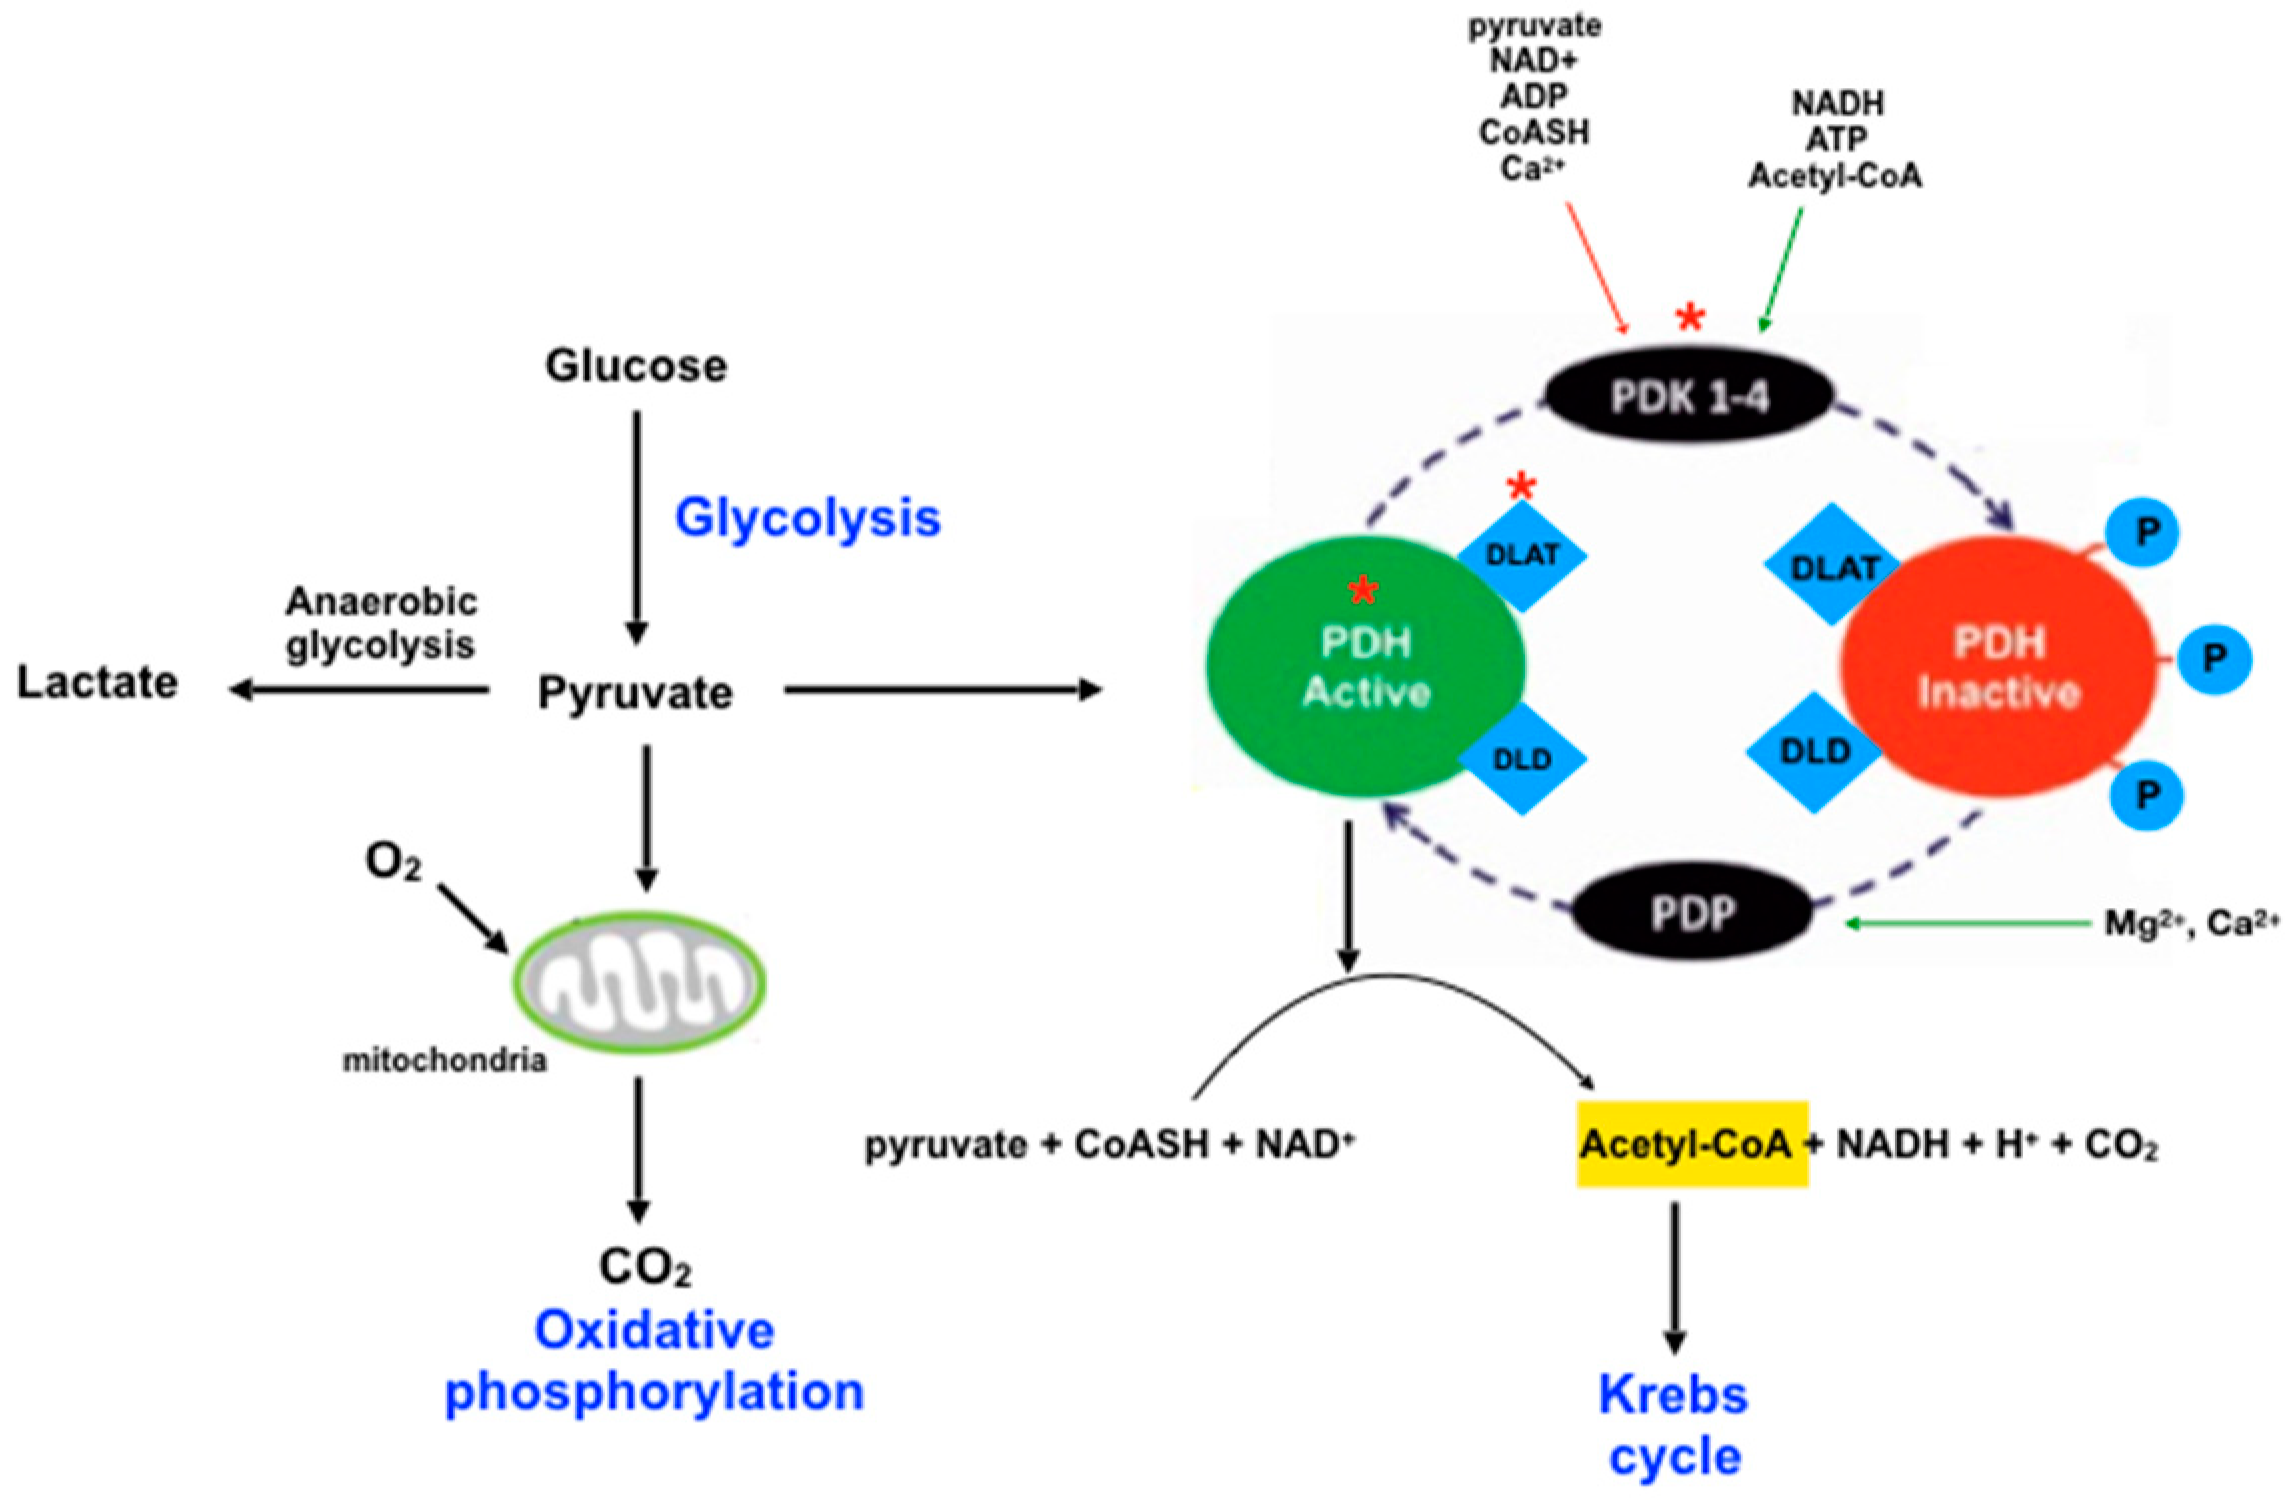
| Dihydrolipoamide S-acethyltransferase component of pyruvate dehydrogenase complex, mitochondrial—DLAT | Catalyzes the overall conversion of pyruvate to acetyl-CoA and CO2; links the glycolytic pathway to the tricarboxylic cycle. | [30] |
| Function | FDR | Genes in Network | Genes in Genome |
|---|---|---|---|
| Regulation of acyl-coa biosynthetic process | 2.61 × 10⁻⁸ | 5 | 12 |
| Acetyl-coa biosynthetic process from pyruvate | 2.61 × 10⁻⁸ | 5 | 12 |
| Regulation of cofactor metabolic process | 2.61 × 10⁻⁸ | 5 | 13 |
| Regulation of acetyl-coa biosynthetic process from pyruvate | 2.61 × 10⁻⁸ | 5 | 12 |
| Regulation of coenzyme metabolic process | 2.61 × 10⁻⁸ | 5 | 13 |
| Acetyl-Coa biosynthetic process | 3.38 × 10⁻⁸ | 5 | 14 |
| Bile acid and bile salt transport | 6.3 × 10⁻⁸ | 5 | 16 |
| Acetyl-Coa metabolic process | 1.47 × 10⁻⁷ | 5 | 19 |
| Regulation of fatty acid metabolic process | 1.89 × 10⁻⁷ | 6 | 49 |
| Pyruvate metabolic process | 6.59 × 10⁻⁷ | 5 | 26 |
| Thioester biosynthetic process | 1.41 × 10⁻⁷ | 5 | 31 |
| Acyl-Coa biosynthetic process | 1.41 × 10⁻⁶ | 5 | 31 |
| Sodium-independent organic anion transport | 2.99 × 10⁻⁶ | 4 | 12 |
| Bile acid metabolic process | 3.08 × 10⁻⁶ | 5 | 37 |
| Acyl-Coa metabolic process | 1.92 × 10⁻⁵ | 5 | 54 |
| Thioester metabolic process | 1.92 × 10⁻⁵ | 5 | 54 |
| Coenzyme biosynthetic process | 3.38 × 10⁻⁵ | 5 | 61 |
| Regulation of cellular ketone metabolic process | 3.54 × 10⁻⁵ | 6 | 129 |
| Mitochondrial matrix | 8.39 × 10⁻⁵ | 7 | 257 |
| Monocarboxylic acid transport | 1.00 × 10⁻⁴ | 5 | 78 |
| Regulation of lipid metabolic process | 1.18 × 10⁻⁴ | 6 | 162 |
| Cofactor biosynthetic process | 1.24 × 10⁻⁴ | 5 | 83 |
| Cellular ketone metabolic process | 1.24 × 10⁻⁴ | 6 | 166 |
| Steroid metabolic process | 3.18 × 10⁻⁴ | 6 | 196 |
| Fatty acid metabolic process | 4.45 × 10⁻⁴ | 6 | 209 |
| Coenzyme metabolic process | 1.11 × 10⁻³ | 5 | 133 |
| Oxidoreductase complex | 2.23 × 10⁻³ | 4 | 68 |
| Carboxylic acid transport | 3.06 × 10⁻³ | 5 | 166 |
| Organic acid transport | 3.13 × 10⁻³ | 5 | 168 |
| Cofactor metabolic process | 3.90 × 10⁻³ | 5 | 177 |
| Hydrogen ion transmembrane transporter activity | 5.86 × 10⁻³ | 3 | 28 |
| Interaction with host | 5.86 × 10⁻³ | 4 | 90 |
| Ferric iron transport | 7.86 × 10⁻³ | 3 | 32 |
| Transferrin transport | 7.86 × 10⁻³ | 3 | 32 |
| Proton-transporting two-sector atpase complex | 7.86 × 10⁻³ | 3 | 32 |
| Trivalent inorganic cation transport | 7.86 × 10⁻³ | 3 | 32 |
| Blood microparticle | 1.03 × 10⁻² | 4 | 108 |
| Iron ion transport | 1.59 × 10⁻² | 3 | 41 |
| Organic anion transport | 1.72 × 10⁻² | 5 | 254 |
| Phagosome maturation | 1.74 × 10⁻² | 3 | 43 |
| Cellular respiration | 2.57 × 10⁻² | 4 | 140 |
| Negative regulation of extrinsic apoptotic signaling pathway | 3.12 × 10⁻² | 3 | 53 |
| Cellular iron ion homeostasis | 3.99 × 10⁻² | 3 | 58 |
| Transition metal ion transport | 4.88 × 10⁻² | 3 | 63 |
| Iron ion homeostasis | 4.88 × 10⁻² | 3 | 63 |
| Cellular transition metal ion homeostasis | 7.85 × 10⁻² | 3 | 75 |
| Proton transport | 7.85 × 10⁻² | 3 | 75 |
| Hydrogen transport | 8.31 × 10⁻² | 3 | 77 |
| Regulation of cellular carbohydrate metabolic process | 9.45 × 10⁻² | 3 | 81 |
| Data | |
|---|---|
| Number of patients | 6 |
| Age at surgery (Mean ± SD) | 42.2 ± 9.9 |
| Gender-females | 2 |
| Age at epilepsy onset-months (mean ± SD) | 14.7 ± 8.3 |
| Years of epilepsy at surgery (mean ± SD) | 18 ± 10 |
| Family history of epilepsy (%) | 33.3 |
| Presence of febrile seizures (%) | 50 |
| Diagnosis of psychiatric disorders | 3 |
| Data | |
|---|---|
| Number of patients | 10 |
| Age at autopsy (Mean ± SD) | 56 ± 18 |
| Gender-females | 4 |
| Postmortem period | <6 h |
| Changes in central nervous system | No |
| Family history of epilepsy (%) | No |
| Diagnosis of psychiatric disorders | No |
© 2018 by the authors. Licensee MDPI, Basel, Switzerland. This article is an open access article distributed under the terms and conditions of the Creative Commons Attribution (CC BY) license (http://creativecommons.org/licenses/by/4.0/).
Share and Cite
Persike, D.S.; Marques-Carneiro, J.E.; Stein, M.L.d.L.; Yacubian, E.M.T.; Centeno, R.; Canzian, M.; Fernandes, M.J.d.S. Altered Proteins in the Hippocampus of Patients with Mesial Temporal Lobe Epilepsy. Pharmaceuticals 2018, 11, 95. https://0-doi-org.brum.beds.ac.uk/10.3390/ph11040095
Persike DS, Marques-Carneiro JE, Stein MLdL, Yacubian EMT, Centeno R, Canzian M, Fernandes MJdS. Altered Proteins in the Hippocampus of Patients with Mesial Temporal Lobe Epilepsy. Pharmaceuticals. 2018; 11(4):95. https://0-doi-org.brum.beds.ac.uk/10.3390/ph11040095
Chicago/Turabian StylePersike, Daniele Suzete, Jose Eduardo Marques-Carneiro, Mariana Leão de Lima Stein, Elza Marcia Targas Yacubian, Ricardo Centeno, Mauro Canzian, and Maria José da Silva Fernandes. 2018. "Altered Proteins in the Hippocampus of Patients with Mesial Temporal Lobe Epilepsy" Pharmaceuticals 11, no. 4: 95. https://0-doi-org.brum.beds.ac.uk/10.3390/ph11040095