Deregulation of Hepatic Mek1/2–Erk1/2 Signaling Module in Iron Overload Conditions
by
 , and
, and
Naveen Kumar Tangudu
1,†, 
Nils Buth
1,†,
Pavel Strnad
2,
Ion C. Cirstea
1 and
Maja Vujić Spasić
1,* 1
Institute of Comparative Molecular Endocrinology, University of Ulm, Ulm 89081, Germany
2
Department of Medicine III and IZKF, University Hospital Aachen, Aachen 52074, Germany
*
Author to whom correspondence should be addressed.
†
These authors contributed equally to this work.
Pharmaceuticals 2019, 12(2), 70; https://0-doi-org.brum.beds.ac.uk/10.3390/ph12020070
Submission received: 25 February 2019
/
Revised: 30 April 2019
/
Accepted: 5 May 2019
/
Published: 7 May 2019
(This article belongs to the Special Issue Iron as Therapeutic Targets in Human Diseases)
Abstract
:The liver, through the production of iron hormone hepcidin, controls body iron levels. High liver iron levels and deregulated hepcidin expression are commonly observed in many liver diseases including highly prevalent genetic iron overload disorders. In spite of a number of breakthrough investigations into the signals that control hepcidin expression, little progress has been made towards investigations into intracellular signaling in the liver under excess of iron. This study examined hepatic signaling pathways underlying acquired and genetic iron overload conditions. Our data demonstrate that hepatic iron overload associates with a decline in the activation of mitogen-activated protein kinase (MAPK)/extracellular signal-regulated kinase (Erk) kinase (Mek1/2) pathway by selectively affecting the phosphorylation of Erk1/2. We propose that Mek1/2-Erk1/2 signaling is uncoupled from iron-Bmp-Smad-mediated hepcidin induction and that it may contribute to a number of liver pathologies in addition to toxic effects of iron. We believe that our findings will advance the understanding of cellular signaling events in the liver during iron overload of different etiologies.
1. Introduction
In vertebrates, the liver is an essential metabolic hub. It hosts numerous biochemical processes and regulates the storage of many essential nutrients, vitamins, and minerals, as well as their release when there is a physiological need for them. The liver is the main parenchymal iron repository and at the same time the principal organ controlling systemic iron fluxes through the production of the iron hormone hepcidin [1]. High hepatic iron levels are commonly observed in many liver diseases including highly prevalent genetic iron overload disorders (i.e., hereditary hemochromatosis), hematologic disorders (i.e., thalassemia and sickle cell disease), chronic hepatitis C, alcoholic liver disease and non-alcoholic fatty liver disease l [2,3]. The main pathological effects of hepatic iron overload include liver fibrosis, cirrhosis and hepatocellular carcinoma.
The sensing of plasma iron levels (i.e., transferrin-bound iron) by liver hepatocytes involves a multiprotein membrane-bound complex consisting of transferrin receptors 1 and 2 (TfR1, TfR2), MHC I-like protein Hfe, hemojuvelin, and the bone morphogenetic protein (Bmp) receptors type I such as activin receptor-like kinase 1 (Alk2/Acvr1) and Alk3/Bmpr1a [4,5,6,7,8,9,10,11,12]. The Bmp-Alk2/3-Smad1/5/8 cascade is currently considered as the central intracellular relay communicating high plasma iron levels to hepcidin, since mice and patients with genetic disruption in the iron-sensing molecules show impaired Bmp/Smad signaling, low hepcidin expression and consequently develop hepatic iron overload [12,13,14,15]. Furthermore, the contribution of the extracellular signal-regulated kinases 1 and 2 (Erk1/2) to hepcidin regulation was proposed: studies in erythroleukemia K562 cells, exposed to holo-transferrin, demonstrated activation of ERK1/2 and p38 MAP kinases, a process that was dependent on TfR2 [16]; consequently, silencing of TfR2 and Hfe in HepG2 cells and in mice resulted in decreased ERK1/2 signaling and low hepcidin expression in the liver [8,17]. It was proposed that ERK1/2 might act in concert with Bmp-Smad signaling to control hepcidin expression [18].
The mitogen-activated protein kinases (MAPKs) are among the largest protein families in eukaryotes that transduce a variety of extracellular signals to regulate a plethora of cellular responses [19,20]. MAPKs consist of many protein kinases but three major protein kinases are extensively studied: the ERK1/2, activated by broad spectrum of extracellular ligands such as mitogens/growth factors and differentiation signals [21], and c-Jun amino terminal kinases (JNK1/2/3) and p38 kinases that are activated by stress stimuli [19,20,22]. MAPK-dependent signal transduction is required to maintain physiological metabolic adaptation while inappropriate MAPK signaling has been increasingly associated with the development of metabolic syndrome [23]. In the liver, the MAPKs play an important role in processes that regulate metabolism [23,24,25,26]. In particular, activation of stress-responsive p38MAPKs and JNKs was associated with hepatic metabolic dysfunction [20,23,26,27,28], whereas constitutive Erk1 or liver-specific Erk2 deficiency in mice was proposed to affect hepatic glucose and lipid metabolism, promote insulin resistance and ER stress [27,29,30].
In this study, we examined the association between hepatic iron overload in mice, caused by parenteral, nutritional and genetic iron overload, and the activity of Mek1/2-Erk1/2 signaling. Our data demonstrate decreased Mek1/2-Erk1/2 signaling output in iron overloaded conditions, suggesting that Mek1/2-Erk1/2 signaling is uncoupled from Bmp-Smad1/5/8-mediated hepcidin induction and that it may play an important role in liver diseases characterized by hepatic iron excess.
2. Results and Discussion
2.1. Classical and Stress-Induced MAPKs Activation in Iron-Loaded Livers
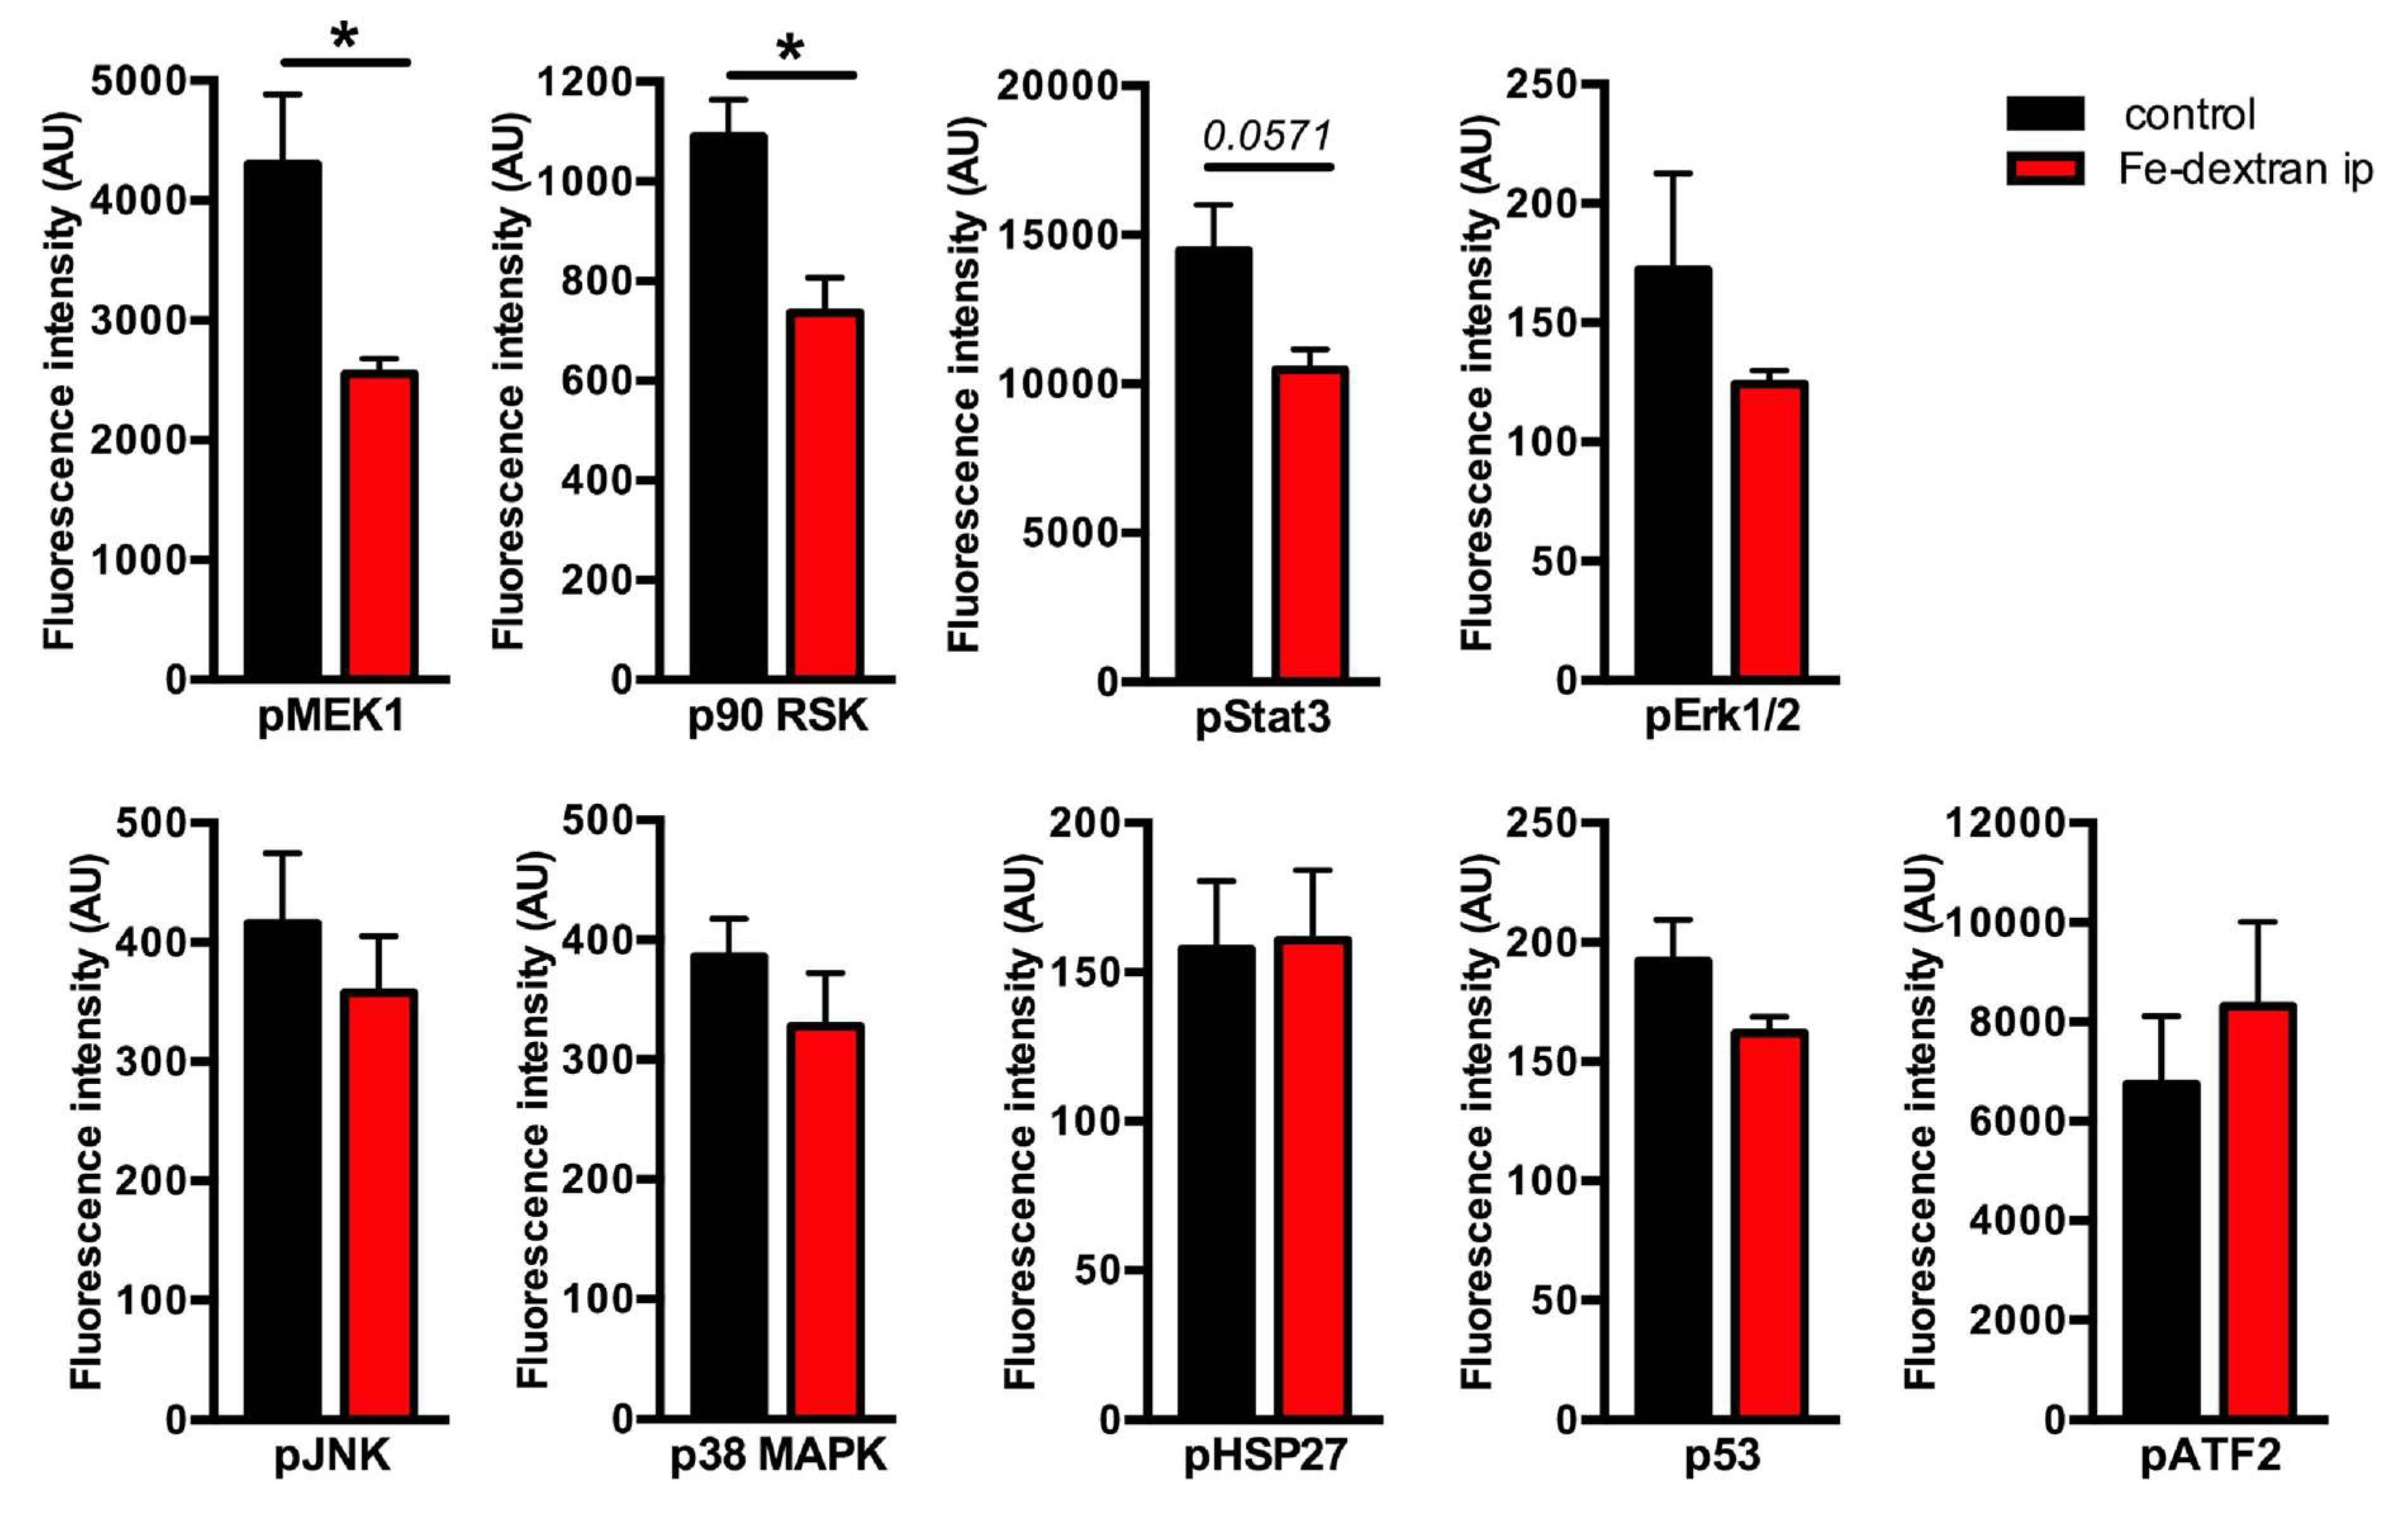
The aim of this study was to investigate the activity of intracellular signaling pathways in the livers under excessive iron overload. To this end, we used our previously established mouse model of parenteral iron overload, which is characterized by severe hepatic iron overload, high circulating iron levels, and increased hepcidin mRNA expression [15]. We measured the phosphorylation status of nine intracellular proteins including Mek1 (Ser217/Ser221) and Erk1/2 (Thr202/Tyr204, Thr185/Tyr187), as classical MAPK backbone components, stress-responsive MAPKs, such as JNK (Thr183/Tyr185) and p38 MAPK (Thr180/Tyr182), and effector molecules of MAPKs including p90 RSK (Ser380), Stat3 (Ser727), ATF-2 (Thr71), HSP27 (Ser78), and p53 (Ser15), using Bio-Plex Pro Cell Signaling MAPK Panel 9-plex (BioRad Laboratories, Germany). This analysis revealed a decrease in the phosphorylation levels of Mek1 and p90 RSK in iron-loaded livers, and only marginally in case of Stat3 (p < 0.0571); similarly, the levels of pErk1/2 showed a trend towards a decrease however the data were under the level of statistical significance (Figure 1). The levels of pJNK, p38MAPK, pHSP27, p53, and pATF-2 showed no statistically significant differences (Figure 1).
Based on these results, we postulated that the presence of hepatic iron overload might associate with selective impairment of the Mek1/2-Erk1/2 pathway and its downstream pStat3 and pp90 RSK targets. This idea is supported by recent investigations showing selective activation of JNK and the p38 MAPK signaling activity under cellular iron depletion [31]. Moreover, in response to growth factors, Erk1/2, but not JNK or p38, specifically phosphorylate Stat3 at Ser727, which is also stimulated by interleukine-6 cytokine, however, in contrast to growth factors, the latter process occurs independent of Erk1/2 [32].
2.2. Association of Mitogen-activated Protein Kinases (MAPK) Activity with Hepatic Iron Overload
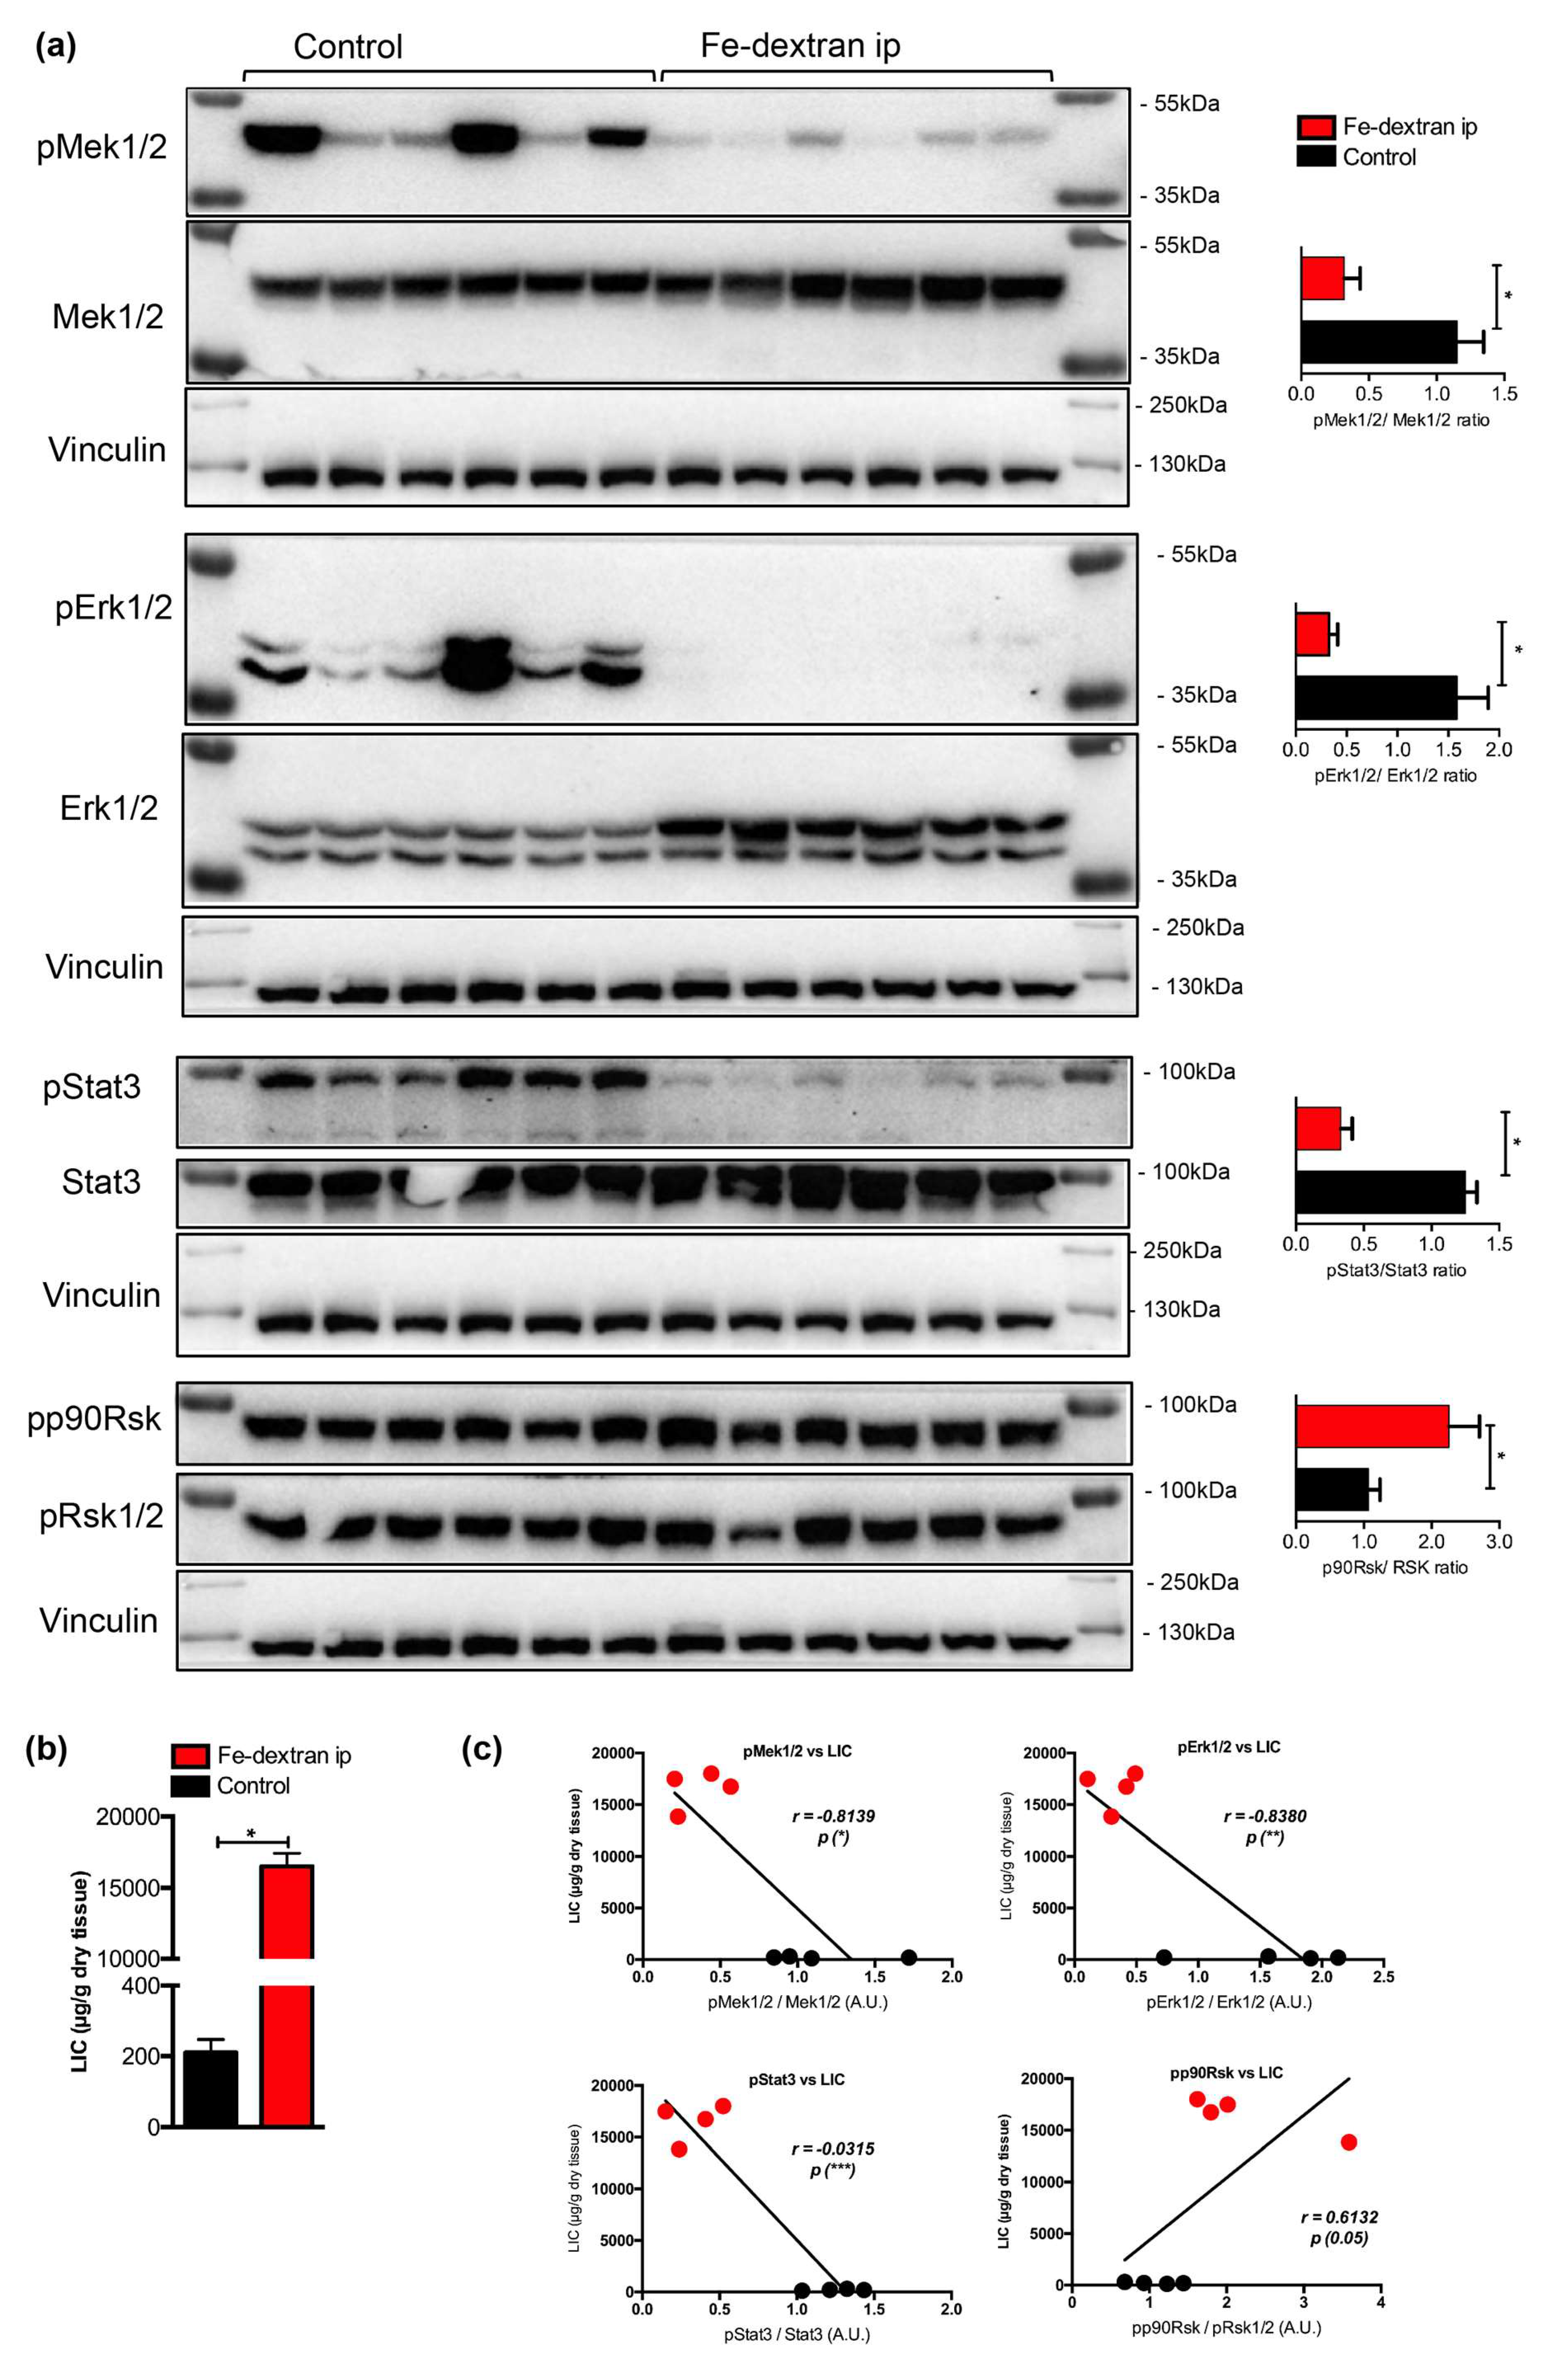
To test the above hypothesis we evaluated phosphorylation levels of Mek1/2, Erk1/2, Stat3 and p90 Rsk proteins in iron-loaded livers using immunoblotting analysis. This analysis revealed a significant decrease in the phosphorylation levels of Mek1/2, Erk1/2, and Stat3 (by 3.6-, 4.8-, and 3.8-fold, respectively), while the levels of p90Rsk were increased by 2.1-fold (Figure 2a).
2.3. Nutritional Iron Overload is Characterized by Low Hepatic Mek1/2-Erk1/2-Stat3 Signaling
We next questioned whether a decrease in the Mek1/2-Erk1/2-Stat3 activity, measured during parenteral iron overload, is present in conditions of nutritional iron overload. We thus examined the phosphorylation status of Mek1/2-Erk1/2-Stat3 in the livers of wild type mice undergoing nutritional iron overload, induced by feeding mice with 3% carbonyl iron containing diet for six months starting at one month of age, as we previously described [33]. We show that hepatic iron overload, induced by iron-rich diet, associated with a 2.7-, 3.4-, and 1.7-fold decrease in the phosphorylation levels of Mek1/2-Erk1/2-Stat3 proteins, respectively, while the levels of p90Rsk were unchanged (Figure 3). However the data were only marginally under the level of statistical significance (p < 0.0571), which is, in our opinion, caused by stringent statistical analysis we applied (unpaired, nonparametric, Mann–Whitney test; n = 3–4 mice per group). Collectively, our data imply that hepatic response of mice receiving parenteral or dietary iron overload associates with a selective decline in the activity of Mek1/2-Erk1/2-Stat3 branch.
Future studies are needed to determine whether a decrease in phosphorylation of Mek1/2-Erk1/2 might be caused by diminished tyrosine kinase receptors (such as epidermal growth factor receptor, EGFR) mediated signaling activity and whether its activity may correlate with changes in the levels of extracellular ligands that can bind EGFR, such as EGF, transforming growth factor alpha, amphiregulin, heparin-binding EGF, and others. In addition, it will be informative to measure the levels of growth hormone (GH), as defective GH signaling impairs activation of EGFR and ERK signaling and affects liver regeneration [34].
2.4. Low Hepatic Mek1/2-Erk1/2 Signaling is Present in Hfe-/- Mice in Spite of Low Bmp-Smad Signaling
So far, our data indicate a decrease in pMek1/2-pErk1/2-pStat3 signaling under excessive systemic and hepatic iron overload. Contrary to Mek1/2-Erk1/2, the activity of Bmp-Smad signaling was shown to increase following iron overload subsequently causing increase in the expression of hepcidin and genes known to be coregulated with hepcidin [15]. Given that previous studies suggest co-involvement of Erk1/2 and Bmp/Smad signaling for induction of hepcidin in cells [18], it seemed logical to investigate the Mek1/2-Erk1/2 signaling activity in conditions characterized by hepatic iron overload and low hepcidin expression. To this end, we employed Hfe-deficient mice, a well-established mouse model of genetic iron-overload, which due to the lack of Hfe, an upstream hepcidin regulator, showed impaired Bmp-Smad signaling, low hepcidin expression, and increased hepatic iron stores [13,14,15]. We detected that the activation of Mek1/2-Erk1/2, measured by phosphorylation status using immunoblot analysis, was on average 2-fold lower in the livers of Hfe-/- mice (with marginal significance of p = 0.0571), whereas the levels of pStat3 and pp90Rsk were not significantly changed (Figure 4). These data suggest that a decrease in Mek1/2-Erk1/2 signaling is uncoupled from Bmp-Smad signaling activity and Smad-mediated hepcidin regulation.
2.5. Low Hepatic Mek1/2-Erk1/2 Signaling is Present in Hepcidin-Deficient Mice and is Further Aggravated by Iron Excess
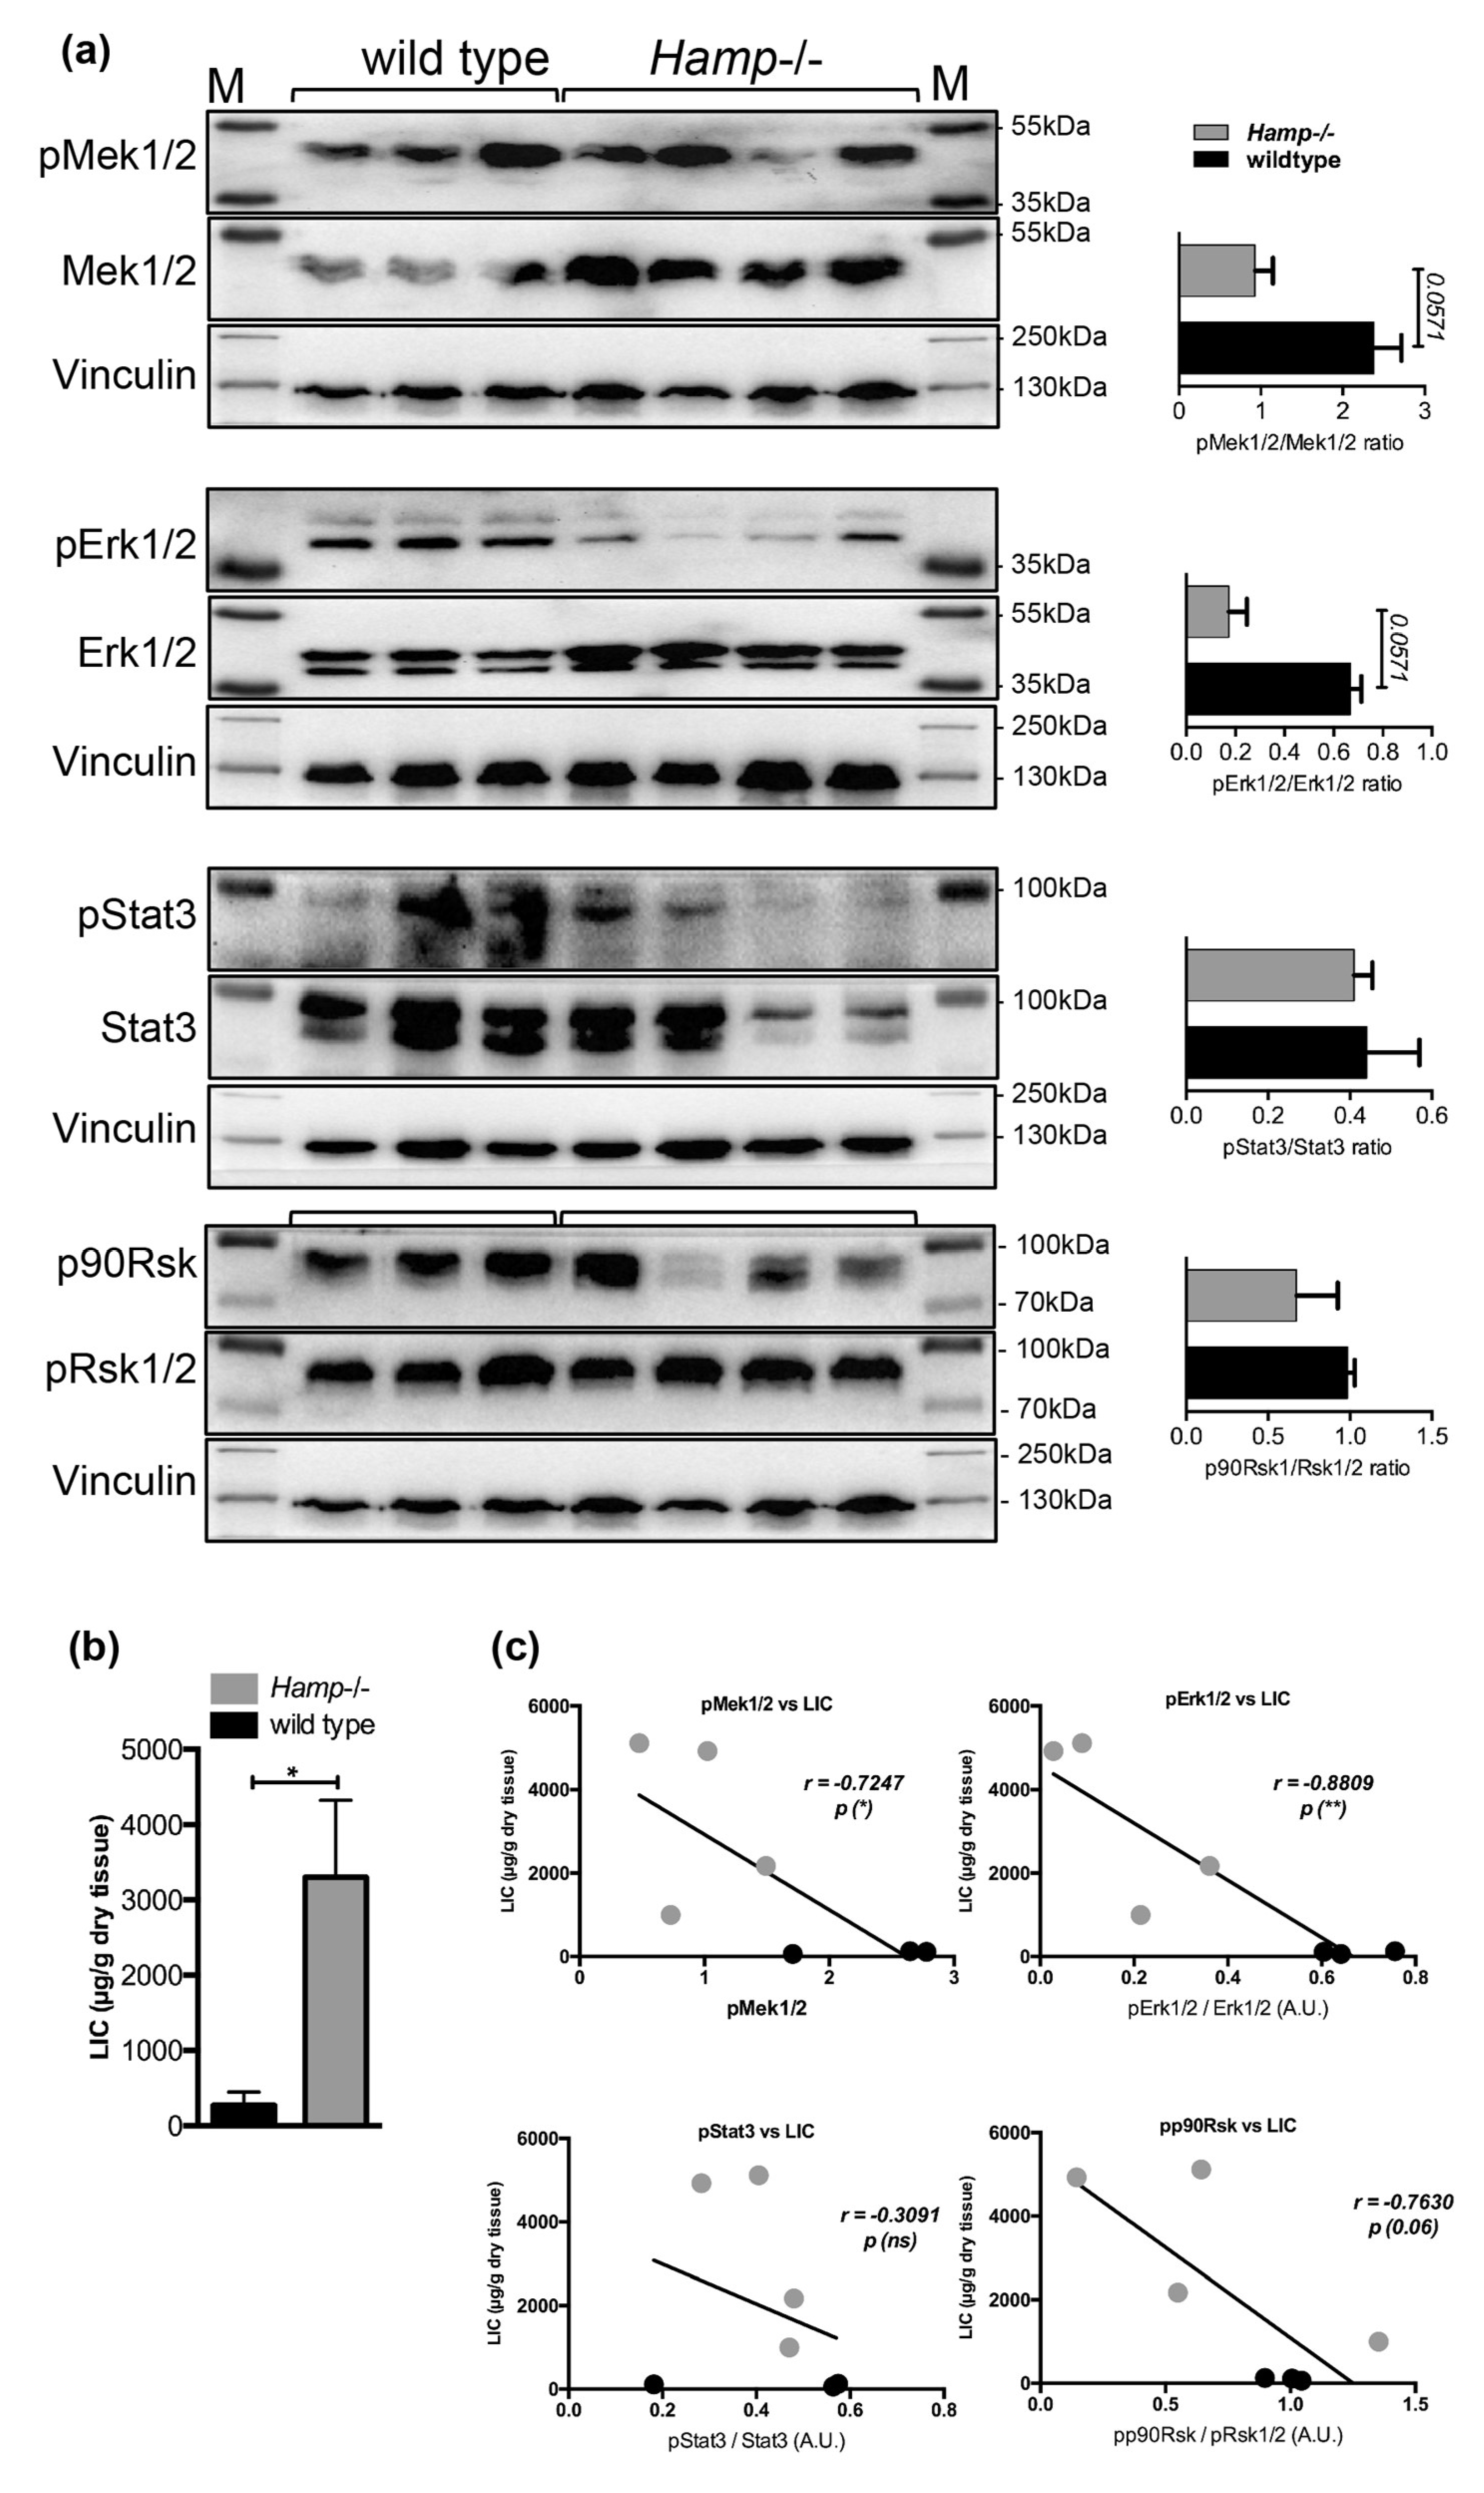
We next investigated Mek1/2-Erk1/2 activation status in the livers of hepcidin knock-out mice (Hamp-/-), which are deficient for hepcidin expression but maintain an appropriate Bmp-Smad signaling activity as a response to liver iron overload [15]. Similarly to the observation in the livers of Hfe-/- mice, a 2.5- and 3.8-fold decrease in the levels of pMek1/2-pErk1/2 proteins were measured in the livers of Hamp-/- mice (with marginal significance of p = 0.0571), while the pStat3 and pp90Rsk levels were not significantly changed (Figure 5a–c). Interestingly, the activation of Mek1/2, Erk1/2, and Stat3, measured by their phosphorylated levels, was suppressed by 34-, 7.5-, and 1.5-fold, respectively (with marginal significance of p = 0.0571), while the levels of pp90Rsk were unchanged in Hamp-/- mice fed an iron-rich diet for six months (Figure 5d–f), which caused the development of chronic liver injury as we previously demonstrated [33].
Interestingly, the initially observed increase in pp90Rsk levels following iron-dextran injections in mice (Figure 2a,c) was not detected in the livers of mice maintained on an iron-rich diet nor in Hfe-/- or Hamp-/- mice. A possible explanation might be the differences in the route of iron application (i.p injections versus nutritional/enteral iron administration) and the duration of iron loading (3-weeks of iron-dextran injections versus six months of iron-rich diet). We suspect that fast influx of iron and excessive liver iron loading following i.p. iron-dextran injections might differentially affect cellular and humoral responses than nutritional iron administration or genetic iron overload.
Taken together, our data reinforce the view that attenuation of Mek1/2-Erk1/2 phosphorylation is a function of hepatic iron overload. Given the variety of iron-overload models used in this study, we speculate that changes in Mek1/2-Erk1/2 signaling may be categorized as initiating mechanism predisposing liver cells to toxic insults. Among them, inflammation, hepatic oxidative stress including the production of highly reactive lipid peroxidation products and iron-catalyzed oxidant stress [35,36] could ultimately lead towards the progression of a chronic liver disease. This hypothesis is supported by recent studies demonstrated that inhibition of ERK1/2 signaling sensitized the cells to chemotaxic stimuli [37].
The collective data let to a working model (Figure 6), in which high hepatic iron burden associates with a decrease in phosphorylation levels of Mek1/2-Erk1/2. This in turn may contribute to a number of liver pathologies in addition to toxic effects of iron.
Data presented in this study raise a number of questions as to whether (i) low Mek1/2-Erk1/2 activity occurs as a selective response to high hepatic iron levels or is triggered by high transferrin and/or non-transferrin-bound iron, (ii) in which hepatic cells (hepatocytes or nonparenchymal cells) and in which cellular compartments does Erk1/2 function, (iii) what is the level of Mek1/2-Erk1/2 cross‑talk with parallel pathways such as the PI3K/AKT/mTOR pathway in iron-loaded livers, and (iv) what are the consequences of inhibition of the Erk1/2 pathway in iron-loaded livers on hepatic gene transcription?
Finally, our findings may be of relevance to other conditions where hepatic iron levels are increased such as alcoholic liver disease, characterized by low hepcidin expression, suppressed hepatic Erk1/2 activity and liver injury [27,38,39,40,41,42,43]. In addition, hepatic iron overload is present in approximately one-third of patients with nonalcoholic fatty liver disease [44,45,46,47], which is recognized as the most common chronic liver disease that can progress to non-alcoholic steatohepatitis and liver cancer [48,49,50]. Hepatic iron overload is also observed in patients with chronic hepatitis C virus infections (and rarely in chronic hepatitis B infections) and in end-stage liver disease [3,46,47,51,52,53,54]. Whether hepatic iron overload and the presence of suppressed Mek1/2-Erk1/2 signaling may either accelerate disease progression or whether maintaining low Mek1/2-Erk1/2 signaling may be protective from the induction of c-Myc and c-Jun as a part of increased proliferation, and therefore reduce the incidence of liver damage, are certainly important questions to address in the future. An equally interesting aspect would be to monitor Mek1/2-Erk1/2 activation from early steps of iron overload until development of liver pathologies and establish whether the activity of MAPK module is accordingly modulated. Understanding the underlying mechanisms associated with hepatic iron overload and progressive liver failure may provide new modalities for therapeutic interventions. We believe that the data provided here will advance our understanding of cellular signaling events in the liver during iron overload of different etiologies.
3. Materials and Methods
3.1. Mice and Treatments
Wild type Hfe-/- and Hamp-/- mutant mice, all males, were kept under a standard mouse diet containing 180 mg/kg iron (Ssniff, Soest, Germany). For the analysis livers were used from previously described wild-type mice undergoing intra peritoneal (i.p.) injection of iron-dextran solution [15,33] and from Hamp-/- and wild type mice fed with 3% carbonyl iron (Sigma, Germany) for 6 months [15,33]. Animal experiments were approved and performed in accordance to the Ulm University Animal Care Committee and German Low for Welfare of laboratory animals in Baden-Württemberg, Germany (Project ID: 35/9185.81-3 / 972 / 1143).
3.2. Phosphoprotein Analysis in Liver Lysates
Protein lysates (10 µg in 50 µL) were prepared from liver tissues using Bio-Plex Cell Lysis Kit (BioRad Laboratories, Munich, Germany). The levels of intracellular phosphoproteins were measured using Bio-Plex Pro Cell Signaling MAPK Panel, 9-plex (BioRad Laboratories, Munich, Germany) according to the manufacturer’s instructions. The data were analyzed using Bio-Plex Manager 6.1 Software Package.
3.3. Protein Isolation and Immunoblot Analysis
Protein extracts were prepared from flash-frozen tissue after homogenization in RIPA lysis buffer (Incomplete RIPA buffer, 7× protease inhibitor cocktail, 200mM sodium orthovandate, 1M sodium fluoride, 100mM PMSF) as previously described [15]. Total proteins (30–50 µg) were subjected to Western blot analysis with the following antibodies; anti-pMek1/2, anti-Mek1/2, anti-pErk1/2, anti-Erk1/2, anti-pp90Rsk, anti-pRsk1/2, anti-pStat3, and anti-Stat3 (all rabbit, Cell Signaling Technology, MA, USA; 1:1000 concentration). Mouse anti-vinculin (Santa Cruz, CA, USA; 1:2000) and mouse anti-β-actin (Sigma Aldrich, Missouri, USA; 1:10,000) were used as loading controls. Furthermore, membranes were washed and incubated with anti-rabbit or anti-mouse (Invitrogen, CA, USA; 1:5000) horseradish peroxidase-conjugated antibody. Western blot images were acquired using EMD Millipore Luminata HRP chemiluminescence substrate (Millipore, MA, USA) and signal acquired in Bio-Rad chemiluminescence detector (Bio-Rad Laboratories, CA, USA). The signals were semiquantified using image J (ImageJ; www://rsb.info.nih.gov/ij/).
3.4. Statistical Analysis
Data were analyzed using GraphPad Prism software and results are shown as mean ± standard error of mean. For the statistical analysis, a nonparametric distribution and the Mann–Whitney U test were used. Linear regression and Pearson correlation coefficients were computed for every data set with 95% confidence intervals. Statistically significant differences are indicated as p ˂ 05 (*), p ˂ 01 (**), and p ˂ 005 (***).
Author Contributions
N.K.T. and N.B. performed the experiments; P.S. and I.C.C. provided resources and edited the manuscript; and M.V.S. designed the study, analyzed the data, and wrote the manuscript.
Funding
This research was funded by the Deutsche Forschungsgemeinschaft (DFG) grant number VU75/2-1 and by the Ulm University to M.V.S. P.S. is supported by the Deutsche Forschungsgemeinschaft (DFG) Konsortium SFB/TRR57 ’Liver fibrosis. I.C.C. is supported by the Deutsche Forschungsgemeinschaft (DFG) grant number CI216/2-1 and Bundesministerium für Bildung und Forschung (BMBF) grant number 01GM1519F (GeNeRaRe).
Acknowledgments
We thank the staff of the Animal Facility at the Ulm University.
Conflicts of Interest
The authors declare no conflicts of interest.
References
- Lesbordes-Brion, J.C.; Viatte, L.; Bennoun, M.; Lou, D.Q.; Ramey, G.; Houbron, C.; Hamard, G.; Kahn, A.; Vaulont, S. Targeted disruption of the hepcidin 1 gene results in severe hemochromatosis. Blood 2006, 108, 1402–1405. [Google Scholar] [CrossRef] [PubMed] [Green Version]
- Deugnier, Y.; Turlin, B. Pathology of hepatic iron overload. World J. Gastroenterol. 2007, 13, 4755–4760. [Google Scholar] [CrossRef]
- Kowdley, K.V. Iron Overload in Patients with Chronic Liver Disease. Gastroenterol. Hepatol. 2016, 12, 695–698. [Google Scholar]
- Feder, J.N.; Gnirke, A.; Thomas, W.; Tsuchihashi, Z.; Ruddy, D.A.; Basava, A.; Dormishian, F.; Domingo, R., Jr.; Ellis, M.C.; Fullan, A.; et al. A novel MHC class I-like gene is mutated in patients with hereditary haemochromatosis. Nat. Genet. 1996, 13, 399–408. [Google Scholar] [CrossRef]
- Levy, J.E.; Jin, O.; Fujiwara, Y.; Kuo, F.; Andrews, N.C. Transferrin receptor is necessary for development of erythrocytes and the nervous system. Nat. Genet. 1999, 21, 396–399. [Google Scholar] [CrossRef] [PubMed]
- Vujic Spasic, M.; Kiss, J.; Herrmann, T.; Galy, B.; Martinache, S.; Stolte, J.; Grone, H.J.; Stremmel, W.; Hentze, M.W.; Muckenthaler, M.U. Hfe acts in hepatocytes to prevent hemochromatosis. Cell Metab. 2008, 7, 173–178. [Google Scholar] [CrossRef]
- Wallace, D.F.; Summerville, L.; Subramaniam, V.N. Targeted disruption of the hepatic transferrin receptor 2 gene in mice leads to iron overload. Gastroenterology 2007, 132, 301–310. [Google Scholar] [CrossRef]
- Wallace, D.F.; Summerville, L.; Crampton, E.M.; Frazer, D.M.; Anderson, G.J.; Subramaniam, V.N. Combined deletion of Hfe and transferrin receptor 2 in mice leads to marked dysregulation of hepcidin and iron overload. Hepatology 2009, 50, 1992–2000. [Google Scholar] [CrossRef]
- Roetto, A.; Daraio, F.; Alberti, F.; Porporato, P.; Cali, A.; De Gobbi, M.; Camaschella, C. Hemochromatosis due to mutations in transferrin receptor 2. Blood Cells Mol. Dis. 2002, 29, 465–470. [Google Scholar] [CrossRef]
- Niederkofler, V.; Salie, R.; Arber, S. Hemojuvelin is essential for dietary iron sensing, and its mutation leads to severe iron overload. J. Clin. Investig. 2005, 115, 2180–2186. [Google Scholar] [CrossRef] [PubMed]
- Babitt, J.L.; Huang, F.W.; Wrighting, D.M.; Xia, Y.; Sidis, Y.; Samad, T.A.; Campagna, J.A.; Chung, R.T.; Schneyer, A.L.; Woolf, C.J.; et al. Bone morphogenetic protein signaling by hemojuvelin regulates hepcidin expression. Nat. Genet. 2006, 38, 531–539. [Google Scholar] [CrossRef] [PubMed]
- Steinbicker, A.U.; Bartnikas, T.B.; Lohmeyer, L.K.; Leyton, P.; Mayeur, C.; Kao, S.M.; Pappas, A.E.; Peterson, R.T.; Bloch, D.B.; Yu, P.B.; et al. Perturbation of hepcidin expression by BMP type I receptor deletion induces iron overload in mice. Blood 2011, 118, 4224–4230. [Google Scholar] [CrossRef] [PubMed]
- Ryan, J.D.; Ryan, E.; Fabre, A.; Lawless, M.W.; Crowe, J. Defective bone morphogenic protein signaling underlies hepcidin deficiency in HFE hereditary hemochromatosis. Hepatology 2010, 52, 1266–1273. [Google Scholar] [CrossRef] [Green Version]
- Corradini, E.; Rozier, M.; Meynard, D.; Odhiambo, A.; Lin, H.Y.; Feng, Q.; Migas, M.C.; Britton, R.S.; Babitt, J.L.; Fleming, R.E. Iron regulation of hepcidin despite attenuated Smad1,5,8 signaling in mice without transferrin receptor 2 or Hfe. Gastroenterology 2011, 141, 1907–1914. [Google Scholar] [CrossRef] [PubMed]
- Vujic Spasic, M.; Sparla, R.; Mleczko-Sanecka, K.; Migas, M.C.; Breitkopf-Heinlein, K.; Dooley, S.; Vaulont, S.; Fleming, R.E.; Muckenthaler, M.U. Smad6 and Smad7 are co-regulated with hepcidin in mouse models of iron overload. Biochim. Biophys. Acta 2013, 1832, 76–84. [Google Scholar] [CrossRef] [PubMed] [Green Version]
- Calzolari, A.; Raggi, C.; Deaglio, S.; Sposi, N.M.; Stafsnes, M.; Fecchi, K.; Parolini, I.; Malavasi, F.; Peschle, C.; Sargiacomo, M.; et al. TfR2 localizes in lipid raft domains and is released in exosomes to activate signal transduction along the MAPK pathway. J. Cell Sci. 2006, 119, 4486–4498. [Google Scholar] [CrossRef] [PubMed] [Green Version]
- Poli, M.; Luscieti, S.; Gandini, V.; Maccarinelli, F.; Finazzi, D.; Silvestri, L.; Roetto, A.; Arosio, P. Transferrin receptor 2 and HFE regulate furin expression via mitogen-activated protein kinase/extracellular signal-regulated kinase (MAPK/Erk) signaling. Implications for transferrin-dependent hepcidin regulation. Haematologica 2010, 95, 1832–1840. [Google Scholar] [CrossRef] [PubMed] [Green Version]
- Ramey, G.; Deschemin, J.C.; Vaulont, S. Cross-talk between the mitogen activated protein kinase and bone morphogenetic protein/hemojuvelin pathways is required for the induction of hepcidin by holotransferrin in primary mouse hepatocytes. Haematologica 2009, 94, 765–772. [Google Scholar] [CrossRef] [Green Version]
- Cargnello, M.; Roux, P.P. Activation and function of the MAPKs and their substrates, the MAPK-activated protein kinases. Microbiol. Mol. Boil. Rev. 2011, 75, 50–83. [Google Scholar] [CrossRef] [PubMed]
- Lawan, A.; Bennett, A.M. Mitogen-Activated Protein Kinase Regulation in Hepatic Metabolism. Trends Endocrinol. Metab. 2017, 28, 868–878. [Google Scholar] [CrossRef] [PubMed]
- Roskoski, R., Jr. ERK1/2 MAP kinases: Structure, function, and regulation. Pharmacol. Res. 2012, 66, 105–143. [Google Scholar] [CrossRef] [PubMed]
- Sabio, G.; Davis, R.J. TNF and MAP kinase signalling pathways. Semin. Immunol. 2014, 26, 237–245. [Google Scholar] [CrossRef] [Green Version]
- Gehart, H.; Kumpf, S.; Ittner, A.; Ricci, R. MAPK signalling in cellular metabolism: Stress or wellness? EMBO Rep. 2010, 11, 834–840. [Google Scholar] [CrossRef] [PubMed]
- Sumara, G.; Formentini, I.; Collins, S.; Sumara, I.; Windak, R.; Bodenmiller, B.; Ramracheya, R.; Caille, D.; Jiang, H.; Platt, K.A.; et al. Regulation of PKD by the MAPK p38delta in insulin secretion and glucose homeostasis. Cell 2009, 136, 235–248. [Google Scholar] [CrossRef] [PubMed]
- Barger, P.M.; Browning, A.C.; Garner, A.N.; Kelly, D.P. p38 mitogen-activated protein kinase activates peroxisome proliferator-activated receptor alpha: A potential role in the cardiac metabolic stress response. J. Boil. Chem. 2001, 276, 44495–44501. [Google Scholar] [CrossRef]
- Manieri, E.; Sabio, G. Stress kinases in the modulation of metabolism and energy balance. J. Mol. Endocrinol. 2015, 55, R11–R22. [Google Scholar] [CrossRef] [Green Version]
- Bost, F.; Aouadi, M.; Caron, L.; Binetruy, B. The role of MAPKs in adipocyte differentiation and obesity. Biochimie 2005, 87, 51–56. [Google Scholar] [CrossRef] [PubMed] [Green Version]
- Samuel, V.T.; Shulman, G.I. Nonalcoholic Fatty Liver Disease as a Nexus of Metabolic and Hepatic Diseases. Cell Metab. 2018, 27, 22–41. [Google Scholar] [CrossRef] [PubMed]
- Khan, A.S.; Subramaniam, S.; Dramane, G.; Khelifi, D.; Khan, N.A. ERK1 and ERK2 activation modulates diet-induced obesity in mice. Biochimie 2017, 137, 78–87. [Google Scholar] [CrossRef]
- Kujiraoka, T.; Satoh, Y.; Ayaori, M.; Shiraishi, Y.; Arai-Nakaya, Y.; Hakuno, D.; Yada, H.; Kuwada, N.; Endo, S.; Isoda, K.; et al. Hepatic extracellular signal-regulated kinase 2 suppresses endoplasmic reticulum stress and protects from oxidative stress and endothelial dysfunction. J. Am. Heart Assoc. 2013, 2, e000361. [Google Scholar] [CrossRef]
- Yu, Y.; Richardson, D.R. Cellular iron depletion stimulates the JNK and p38 MAPK signaling transduction pathways, dissociation of ASK1-thioredoxin, and activation of ASK1. J. Boil. Chem. 2011, 286, 15413–15427. [Google Scholar] [CrossRef]
- Chung, J.; Uchida, E.; Grammer, T.C.; Blenis, J. STAT3 serine phosphorylation by ERK-dependent and -independent pathways negatively modulates its tyrosine phosphorylation. Mol. Cell. Boil. 1997, 17, 6508–6516. [Google Scholar] [CrossRef]
- Lunova, M.; Goehring, C.; Kuscuoglu, D.; Mueller, K.; Chen, Y.; Walther, P.; Deschemin, J.C.; Vaulont, S.; Haybaeck, J.; Lackner, C.; et al. Hepcidin knockout mice fed with iron-rich diet develop chronic liver injury and liver fibrosis due to lysosomal iron overload. J. Hepatol. 2014, 61, 633–641. [Google Scholar] [CrossRef] [PubMed]
- Zerrad-Saadi, A.; Lambert-Blot, M.; Mitchell, C.; Bretes, H.; Collin de l’Hortet, A.; Baud, V.; Chereau, F.; Sotiropoulos, A.; Kopchick, J.J.; Liao, L.; et al. GH receptor plays a major role in liver regeneration through the control of EGFR and ERK1/2 activation. Endocrinology 2011, 152, 2731–2741. [Google Scholar] [CrossRef]
- Poli, G.; Schaur, R.J. 4-Hydroxynonenal in the pathomechanisms of oxidative stress. IUBMB Life 2000, 50, 315–321. [Google Scholar] [CrossRef] [PubMed]
- Tsukamoto, H.; Horne, W.; Kamimura, S.; Niemela, O.; Parkkila, S.; Yla-Herttuala, S.; Brittenham, G.M. Experimental liver cirrhosis induced by alcohol and iron. J. Clin. Investig. 1995, 96, 620–630. [Google Scholar] [CrossRef]
- Jazirehi, A.R.; Vega, M.I.; Chatterjee, D.; Goodglick, L.; Bonavida, B. Inhibition of the Raf-MEK1/2-ERK1/2 signaling pathway, Bcl-xL down-regulation, and chemosensitization of non-Hodgkin’s lymphoma B cells by Rituximab. Cancer Res. 2004, 64, 7117–7126. [Google Scholar] [CrossRef]
- Rouault, T.A. Hepatic iron overload in alcoholic liver disease: Why does it occur and what is its role in pathogenesis? Alcohol 2003, 30, 103–106. [Google Scholar] [CrossRef]
- Ioannou, G.N.; Dominitz, J.A.; Weiss, N.S.; Heagerty, P.J.; Kowdley, K.V. The effect of alcohol consumption on the prevalence of iron overload, iron deficiency, and iron deficiency anemia. Gastroenterology 2004, 126, 1293–1301. [Google Scholar] [CrossRef]
- Harrison-Findik, D.D.; Klein, E.; Crist, C.; Evans, J.; Timchenko, N.; Gollan, J. Iron-mediated regulation of liver hepcidin expression in rats and mice is abolished by alcohol. Hepatology 2007, 46, 1979–1985. [Google Scholar] [CrossRef] [Green Version]
- Aroor, A.R.; Shukla, S.D. MAP kinase signaling in diverse effects of ethanol. Life Sci. 2004, 74, 2339–2364. [Google Scholar] [CrossRef] [PubMed]
- Sampey, B.P.; Stewart, B.J.; Petersen, D.R. Ethanol-induced modulation of hepatocellular extracellular signal-regulated kinase-1/2 activity via 4-hydroxynonenal. J. Boil. Chem. 2007, 282, 1925–1937. [Google Scholar] [CrossRef] [PubMed]
- Chen, J.; Ishac, E.J.; Dent, P.; Kunos, G.; Gao, B. Effects of ethanol on mitogen-activated protein kinase and stress-activated protein kinase cascades in normal and regenerating liver. Biochem. J. 1998, 334 Pt 3, 669–676. [Google Scholar] [CrossRef] [Green Version]
- Marmur, J.; Beshara, S.; Eggertsen, G.; Onelov, L.; Albiin, N.; Danielsson, O.; Hultcrantz, R.; Stal, P. Hepcidin levels correlate to liver iron content, but not steatohepatitis, in non-alcoholic fatty liver disease. BMC Gastroenterol. 2018, 18, 78. [Google Scholar] [CrossRef] [PubMed]
- Datz, C.; Felder, T.K.; Niederseer, D.; Aigner, E. Iron homeostasis in the metabolic syndrome. Eur. J. Clin. Investig. 2013, 43, 215–224. [Google Scholar] [CrossRef]
- Kowdley, K.V.; Belt, P.; Wilson, L.A.; Yeh, M.M.; Neuschwander-Tetri, B.A.; Chalasani, N.; Sanyal, A.J.; Nelson, J.E.; Network, N.C.R. Serum ferritin is an independent predictor of histologic severity and advanced fibrosis in patients with nonalcoholic fatty liver disease. Hepatology 2012, 55, 77–85. [Google Scholar] [CrossRef] [PubMed]
- Nelson, J.E.; Klintworth, H.; Kowdley, K.V. Iron metabolism in Nonalcoholic Fatty Liver Disease. Curr. Gastroenterol. Rep. 2012, 14, 8–16. [Google Scholar] [CrossRef]
- Younossi, Z.; Henry, L. Contribution of Alcoholic and Nonalcoholic Fatty Liver Disease to the Burden of Liver-Related Morbidity and Mortality. Gastroenterology 2016, 150, 1778–1785. [Google Scholar] [CrossRef]
- Ma, C.; Zhang, Q.; Greten, T.F. Nonalcoholic fatty liver disease promotes hepatocellular carcinoma through direct and indirect effects on hepatocytes. FEBS J. 2018, 285, 752–762. [Google Scholar] [CrossRef]
- Michelotti, G.A.; Machado, M.V.; Diehl, A.M. NAFLD, NASH and liver cancer. Nat. Rev. Gastroenterol. Hepatol. 2013, 10, 656–665. [Google Scholar] [CrossRef]
- Fracanzani, A.L.; Valenti, L.; Bugianesi, E.; Vanni, E.; Grieco, A.; Miele, L.; Consonni, D.; Fatta, E.; Lombardi, R.; Marchesini, G.; et al. Risk of nonalcoholic steatohepatitis and fibrosis in patients with nonalcoholic fatty liver disease and low visceral adiposity. J. Hepatol. 2011, 54, 1244–1249. [Google Scholar] [CrossRef] [PubMed] [Green Version]
- Manousou, P.; Kalambokis, G.; Grillo, F.; Watkins, J.; Xirouchakis, E.; Pleguezuelo, M.; Leandro, G.; Arvaniti, V.; Germani, G.; Patch, D.; et al. Serum ferritin is a discriminant marker for both fibrosis and inflammation in histologically proven non-alcoholic fatty liver disease patients. Liver Int. 2011, 31, 730–739. [Google Scholar] [CrossRef] [PubMed] [Green Version]
- Fujita, N.; Sugimoto, R.; Takeo, M.; Urawa, N.; Mifuji, R.; Tanaka, H.; Kobayashi, Y.; Iwasa, M.; Watanabe, S.; Adachi, Y.; et al. Hepcidin expression in the liver: Relatively low level in patients with chronic hepatitis C. Mol. Med. 2007, 13, 97–104. [Google Scholar] [CrossRef] [PubMed]
- Nishina, S.; Hino, K.; Korenaga, M.; Vecchi, C.; Pietrangelo, A.; Mizukami, Y.; Furutani, T.; Sakai, A.; Okuda, M.; Hidaka, I.; et al. Hepatitis C virus-induced reactive oxygen species raise hepatic iron level in mice by reducing hepcidin transcription. Gastroenterology 2008, 134, 226–238. [Google Scholar] [CrossRef]
Figure 1.
Identification of activated proteins in iron overloaded livers by Bio-Plex Pro Cell Signaling MAPK Panel 9-plex. Phosphorylation status of nine intracellular phosphoproteins was measured in the livers of iron-dextran injected mice and compared to controls. Data were analyzed using GraphPad Prism software and results are shown as mean ± SEM (standard error of mean). For the statistical analysis, a nonparametric distribution and the unpaired Mann–Whitney U Test were used. * p-values < 0.05; AU: arbitrary units; n = 4; 4 per group.

Figure 2.
(a) Immunoblot analysis and relative quantification (shown in histograms on right) of pMEK1, pERK1/2, pStat3, and pp90Rsk in the livers of iron-dextran injected and control mice (n = 6; 6 mice per group). (b) Liver iron content (LIC) of control and iron-dextran injected mice. (c) Correlation analysis between LIC and the levels of pMek1/2/Mek1/2, pErk1/2/Erk1/2, pStat3/Stat3, and pp90Rsk/pRsk1/2 in the livers of iron-dextran injected and control mice. M: Page Ruler Plus Prestained Protein Ladder (Thermo Scientific). Data were analyzed using GraphPad Prism software and results are shown as mean ± SEM (standard error of mean). For the statistical analysis, a nonparametric distribution and the unpaired Mann–Whitney U Test were used. Linear regression and Pearson correlation coefficients were computed for every data set with 95% confidence intervals. * p values < 0.05.

Figure 3.
(a) Representative immunoblot analysis and relative quantification (shown in histograms on right) of pMek1/2, pErk1/2, pStat3, and pp90Rsk in the livers of mice maintained on an iron rich diet (IRD) and standard diet (control) (n = 3–4 mice per group). (b) Liver iron content (LIC) of control and of mice maintained on an iron rich diet (n = 3–4 mice per group). (c) Correlation analysis between LIC and the levels of pMek1/2/Mek1/2, pErk1/2/Erk1/2, pStat3/Stat3, and pp90Rsk/pRsk1/2 in the livers of mice maintained on an iron rich diet (IRD) and standard diet (control) (n = 3–4 mice per group). M: Page Ruler Plus Prestained Protein Ladder (Thermo Scientific). Data were analyzed using GraphPad Prism software and results are shown as mean ± SEM (standard error of mean). For the statistical analysis, a nonparametric distribution and the unpaired Mann–Whitney U Test were used. Linear regression and Pearson correlation coefficients were computed for every data set with 95% confidence intervals. * p-values < 0.05.
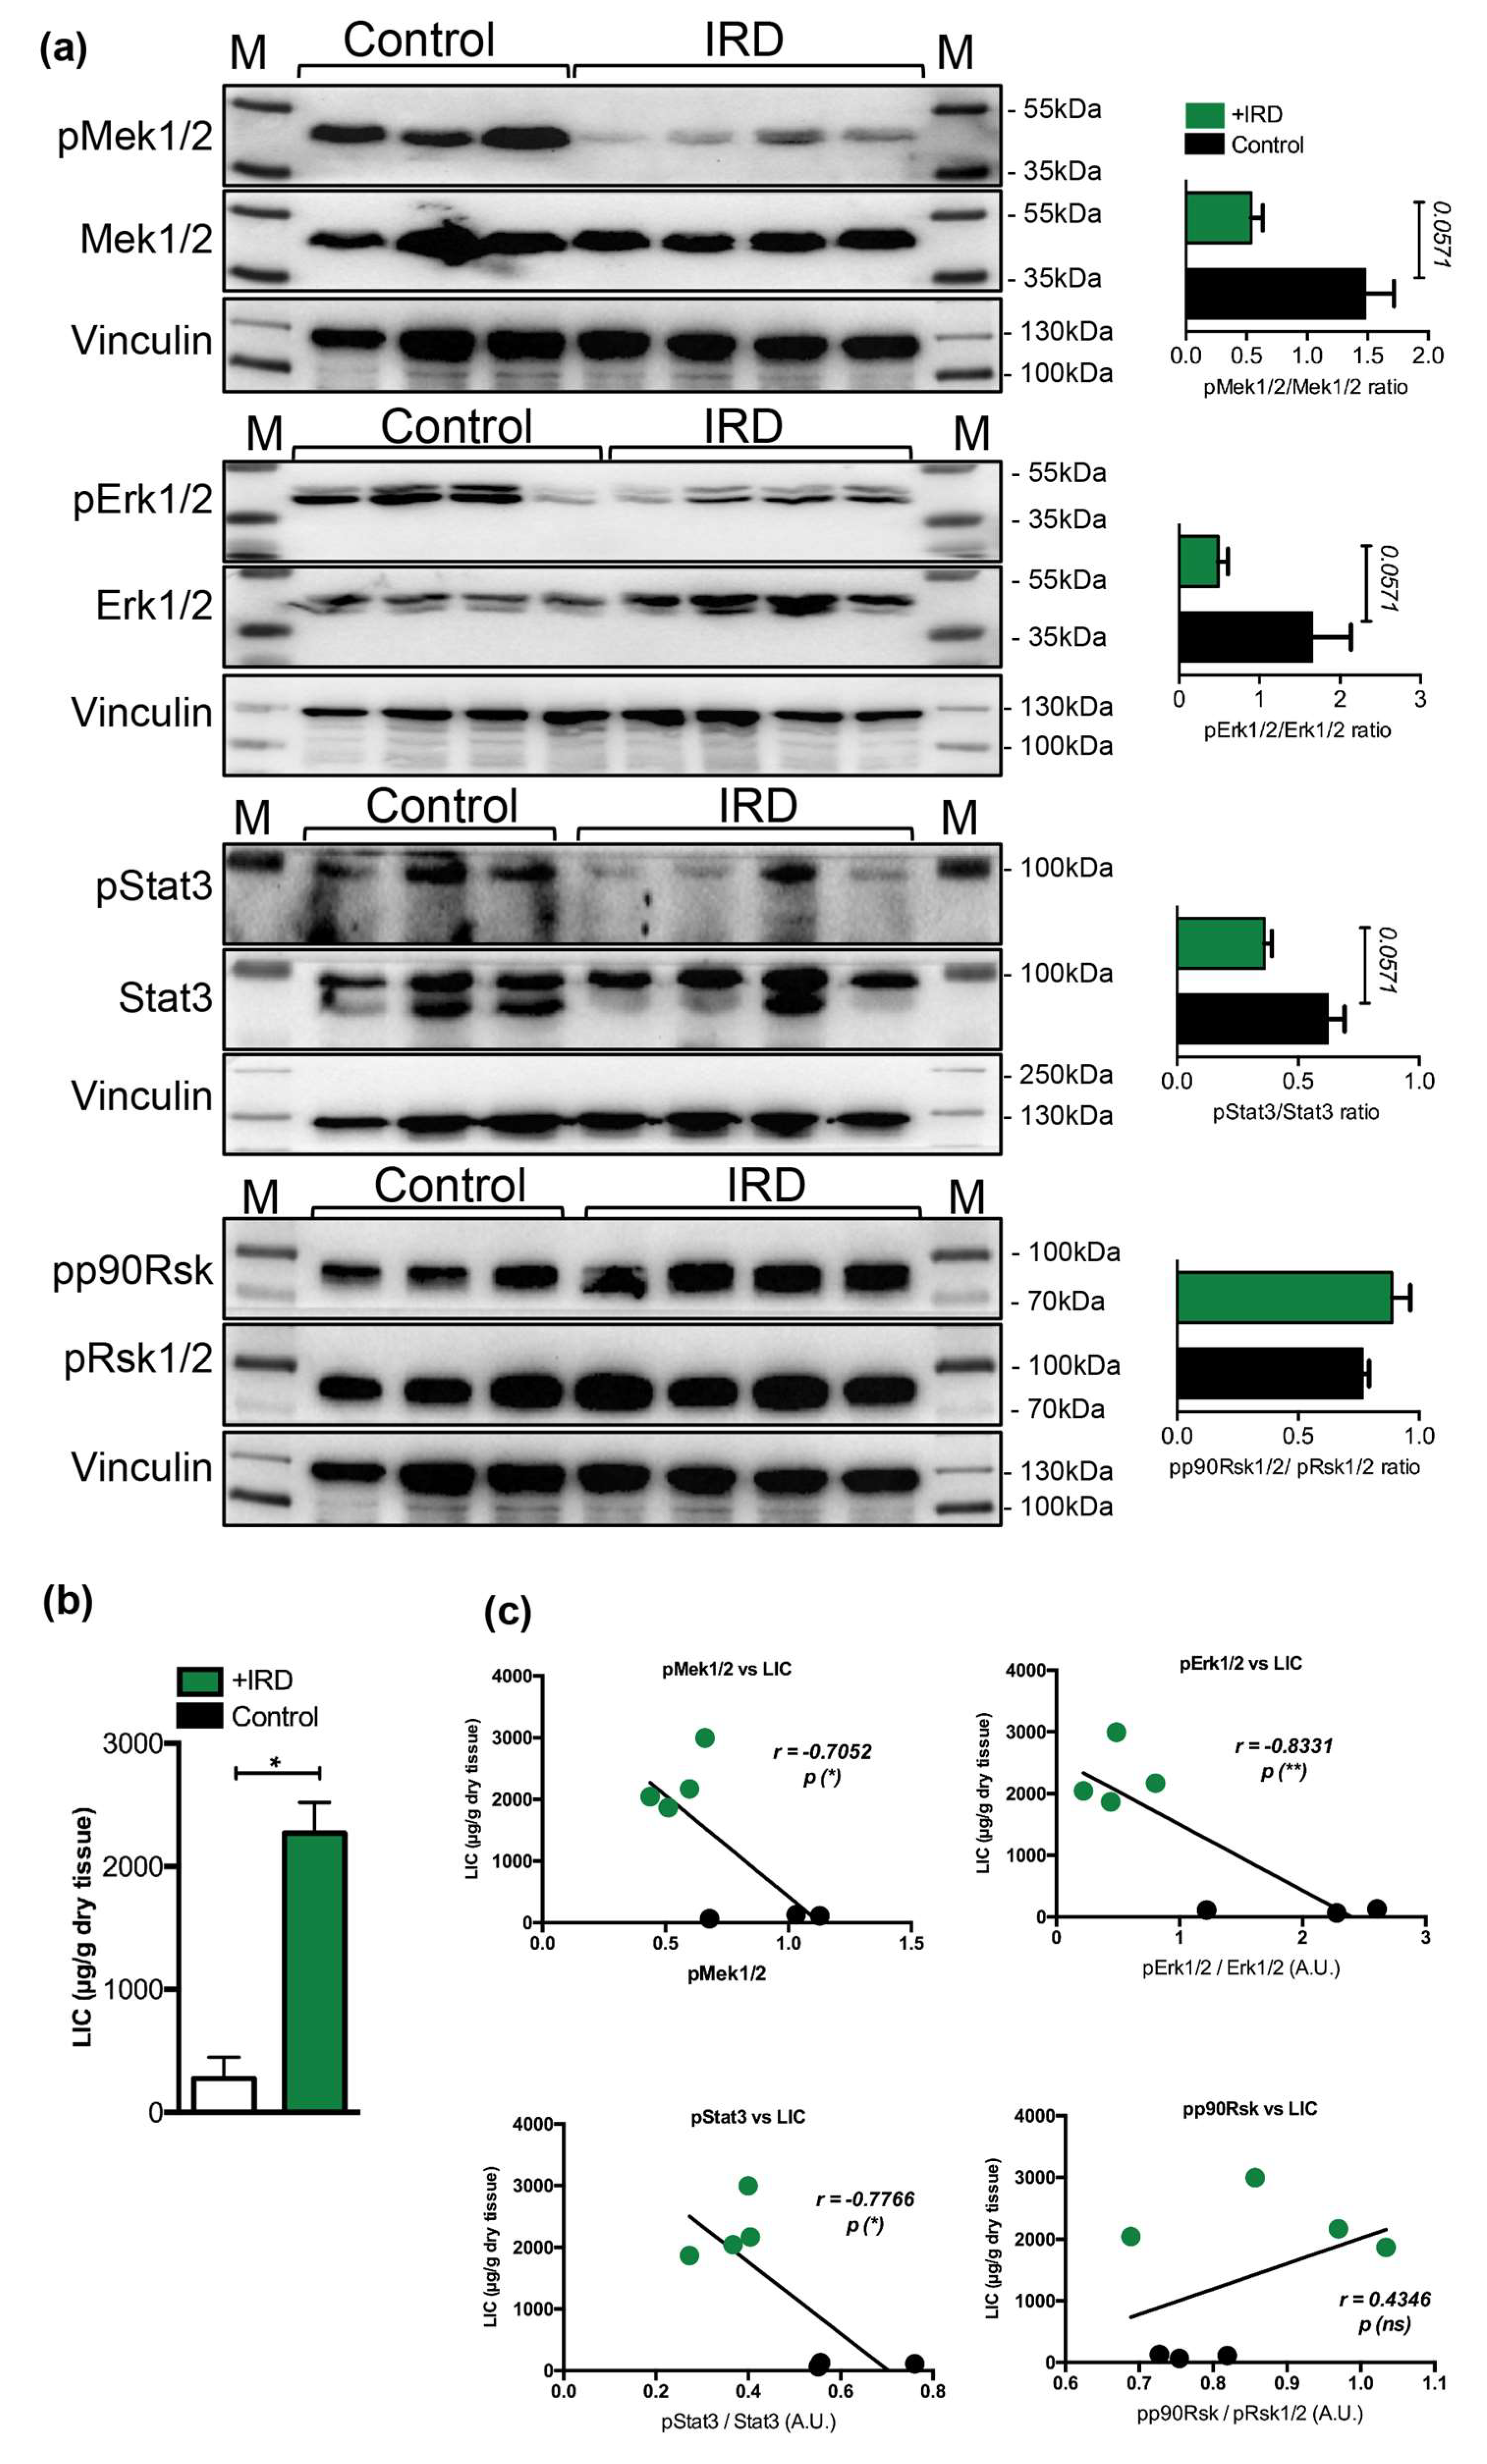
Figure 4.
(a) Representative immunoblot analysis and relative quantification (shown in histograms on right) of pMek1/2, pErk1/2, pStat3 and pp90Rsk in the livers of Hfe+/+ control and Hfe-/- mutant mice (n = 8;10 mice per group). (b) Liver iron content (LIC) of Hfe+/+ and Hfe-/- mice (n = 4;4 mice per group). (c) Correlation analysis between LIC and the levels of pMek1/2/Mek1/2, pErk1/2/Erk1/2, pStat3/Stat3, and pp90Rsk/pRsk1/2 in the livers of Hfe+/+ and Hfe-/- mice (n = 4;4 mice per group). M: Page Ruler Plus Prestained Protein Ladder (Thermo Scientific). Data were analyzed using GraphPad Prism software and results are shown as mean ± SEM (standard error of mean). For the statistical analysis, a nonparametric distribution and the unpaired Mann–Whitney U Test were used. Linear regression and Pearson correlation coefficients were computed for every data set with 95% confidence intervals. * p-values <0.05.
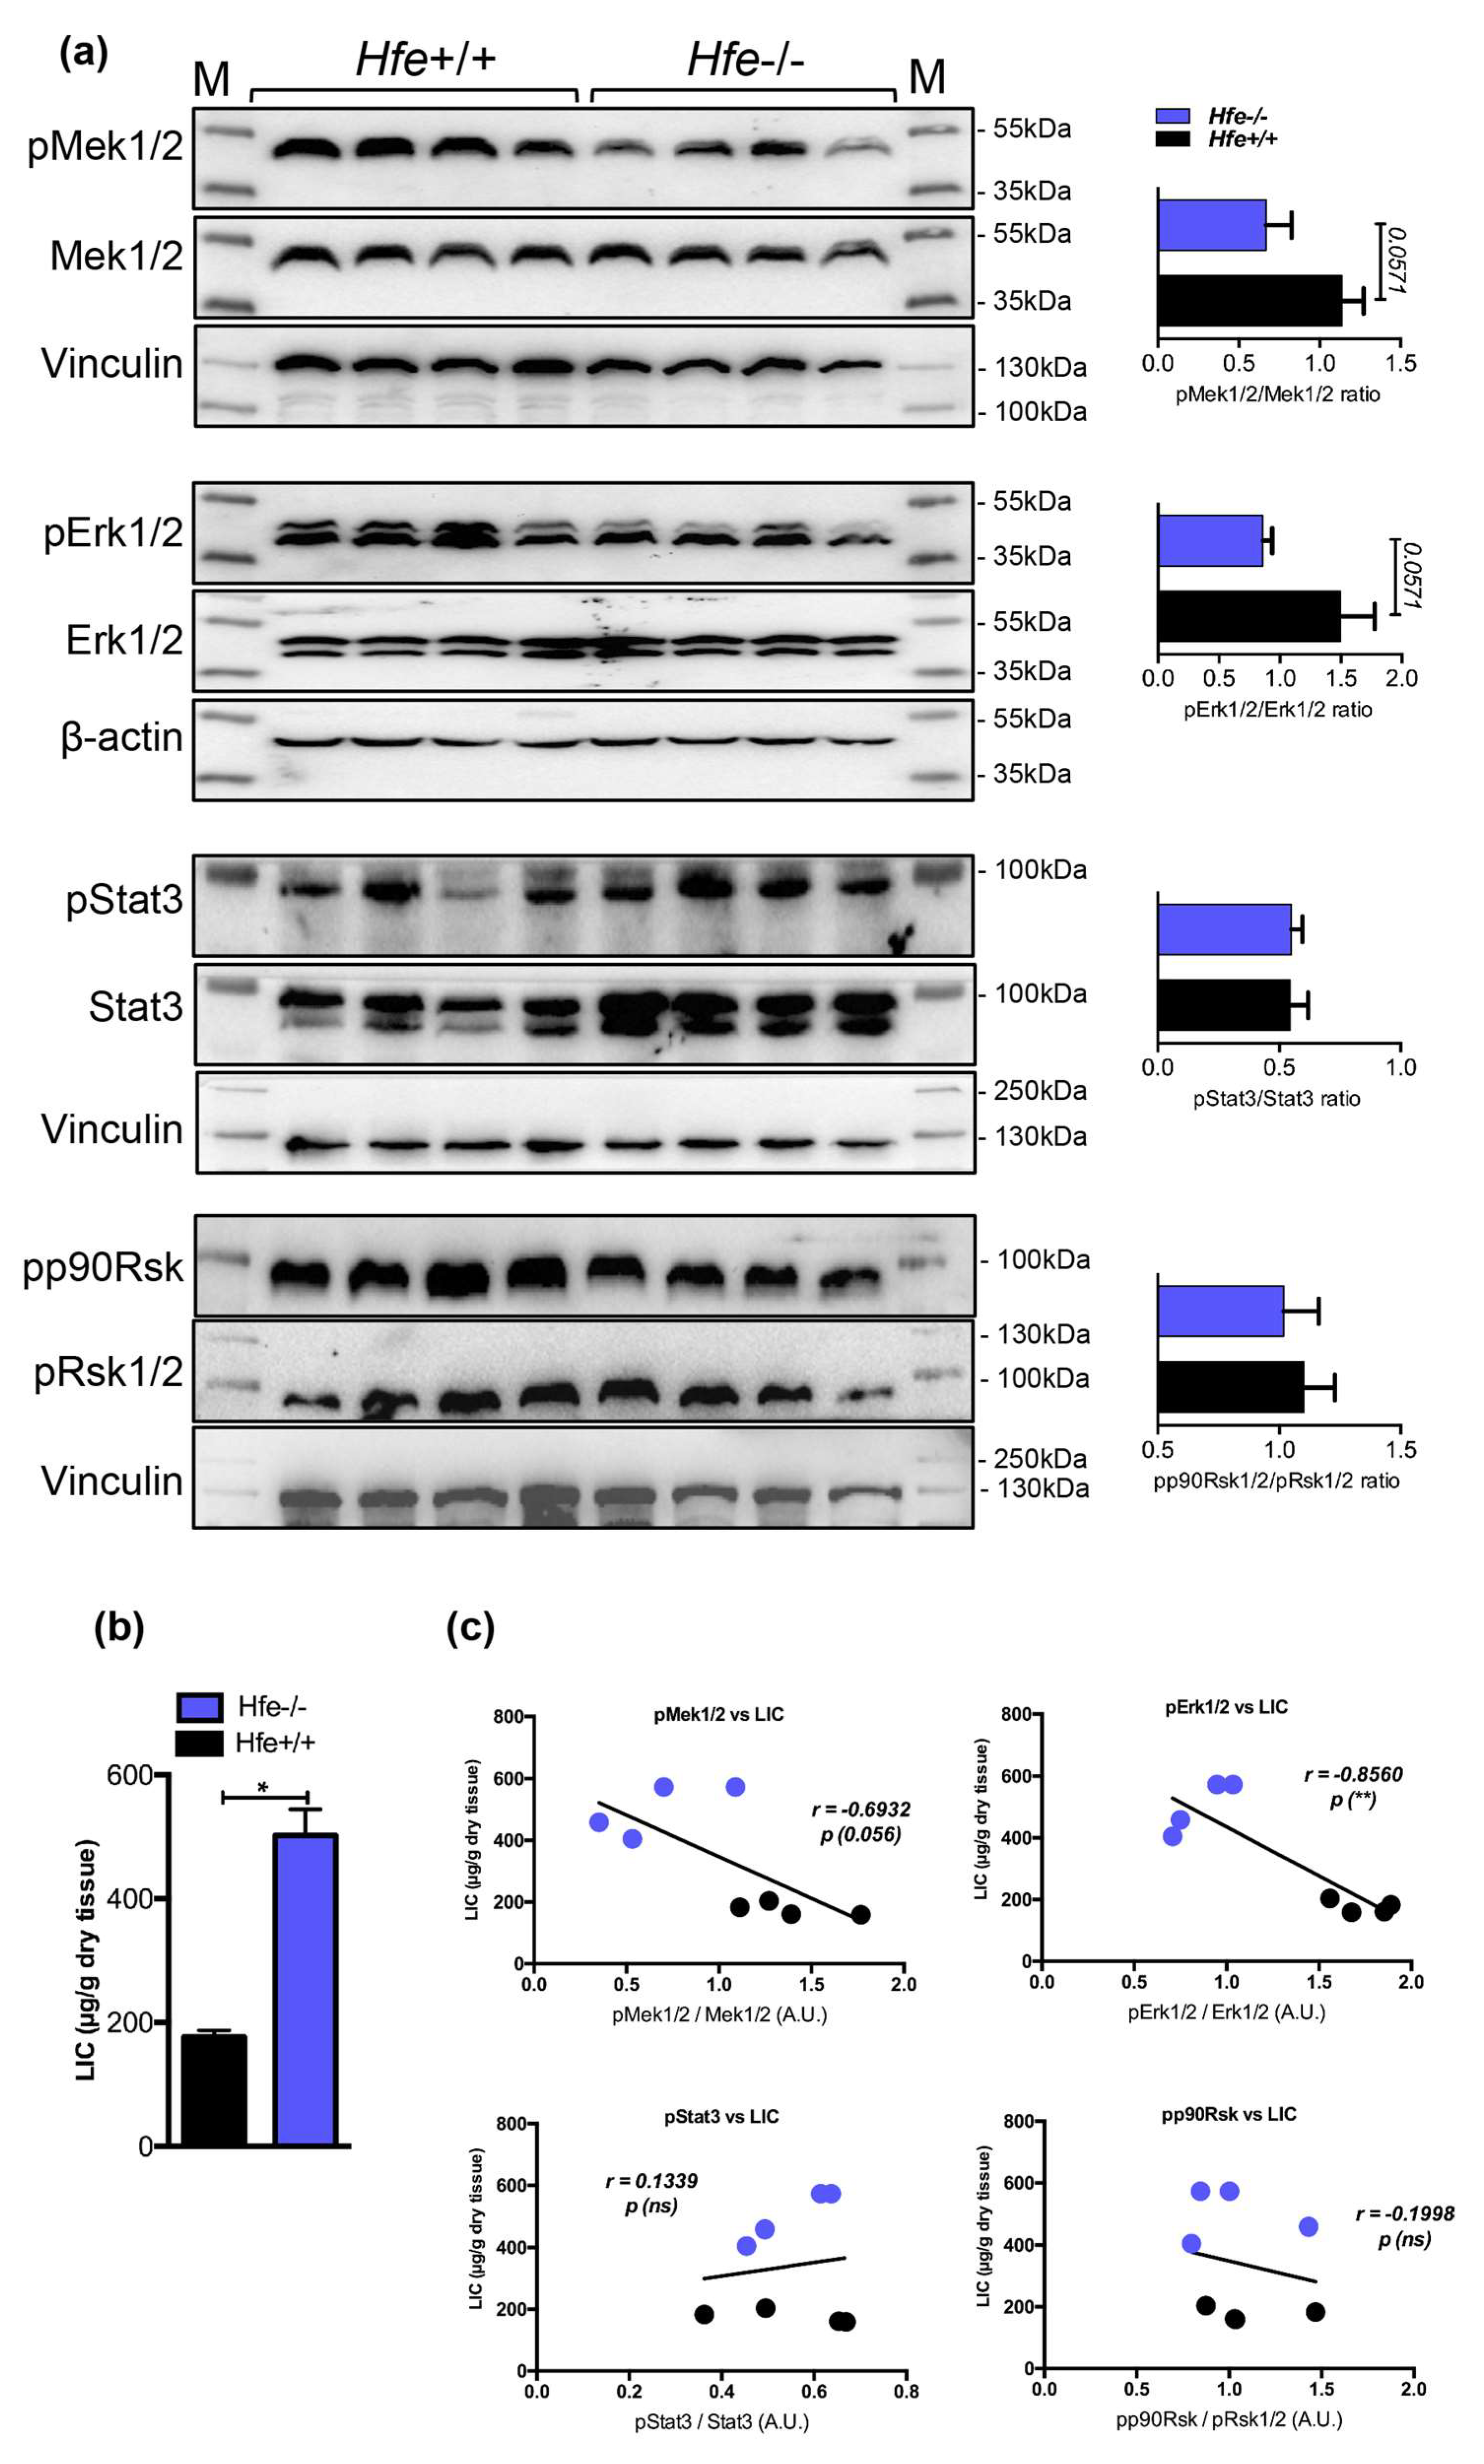
Figure 5.
Immunoblot analysis and relative quantification (shown in histograms on right) of pMek1/2, pErk1/2, pStat3 and pp90Rsk in the livers of (a) control and Hamp-/- mice and (d) Hamp-/- mice maintained on an iron-rich diet (IRD) (n = 3;4;4 mice per group). Liver iron content (LIC) in (b) control, Hamp-/- and (e) Hamp-/- mice maintained on an iron-rich diet (n = 3;4;4 mice per group). Correlation analysis between LIC and the levels of pMek1/2/Mek1/2, pErk1/2/Erk1/2, pStat3/Stat3, and pp90Rsk/pRsk1/2 in the livers of (c) control, Hamp-/- and (f) Hamp-/- mice maintained on an iron rich diet (IRD) (n = 3; 4;4 mice per group). M: Page Ruler Plus Prestained Protein Ladder (Thermo Scientific). Data were analyzed using GraphPad Prism software and results are shown as mean ± SEM (standard error of mean). For the statistical analysis, a nonparametric distribution and the unpaired Mann–Whitney U Test were used. Linear regression and Pearson correlation coefficients were computed for every data set with 95% confidence intervals. * p-values <0.05.


Figure 6.
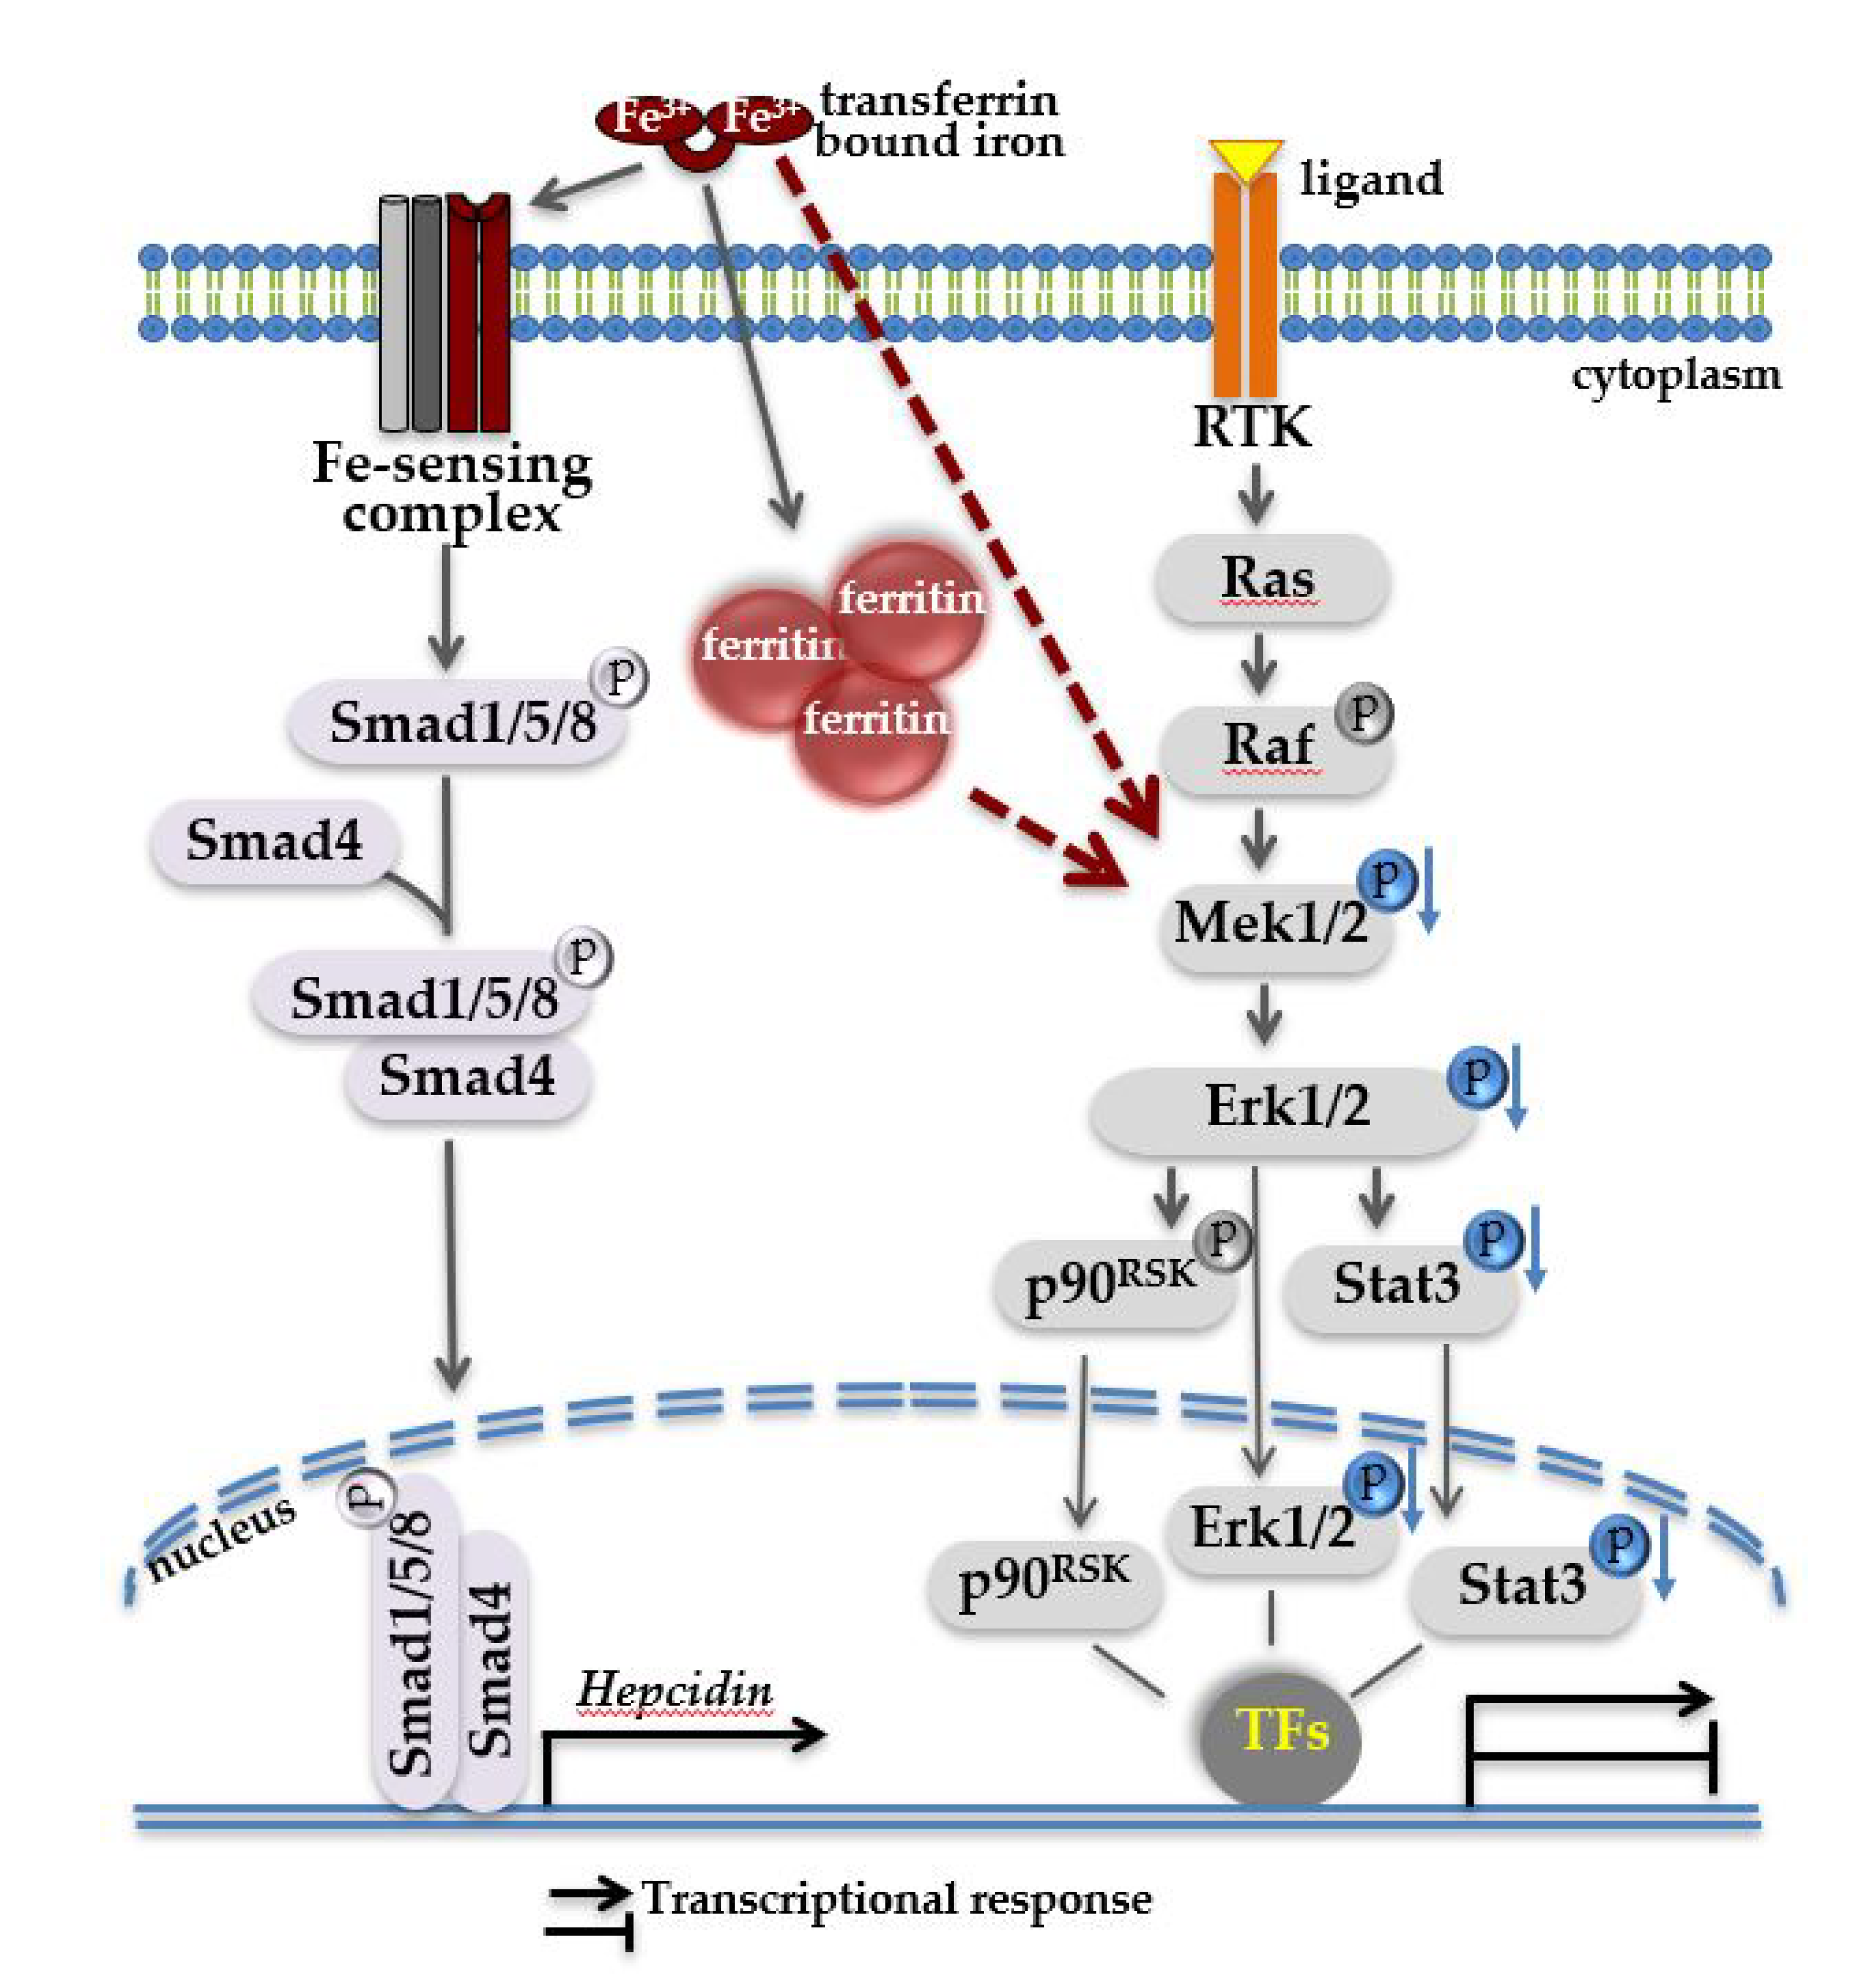
Proposed model of two signaling pathways operating in iron-loaded livers. Systemic iron overload results in heavy iron deposition in the liver, illustrated here in form of high ferritin. Under these conditions, high levels of circulating transferrin-bound iron is sensed by cell membrane multiprotein iron-sensing complex, resulting in the activation of intracellular Bmp-Smad signaling cascade and increased hepcidin transcription in the nucleus. Independent of Bmp-Smad-mediated hepcidin activation, through a yet unknown mechanism (proposed here by red arrows), a decrease in phosphorylation of Mek1/2-Erk1/2-Stat3 (indicated in blue) occurs which in turn may affect the property of pErk1/2 and pStat3 signaling molecules to regulate gene transcription, alone or in cooperation with other transcription factors (TFs). A decrease in the activity of Mek1/2-Erk1/2 signaling cascade can be considered as liver response to iron overload. We propose that a decrease in Mek1/2-Erk1/2 signaling activity may accelerate liver pathologies in addition to toxic effects of iron.
Figure 6.
Proposed model of two signaling pathways operating in iron-loaded livers. Systemic iron overload results in heavy iron deposition in the liver, illustrated here in form of high ferritin. Under these conditions, high levels of circulating transferrin-bound iron is sensed by cell membrane multiprotein iron-sensing complex, resulting in the activation of intracellular Bmp-Smad signaling cascade and increased hepcidin transcription in the nucleus. Independent of Bmp-Smad-mediated hepcidin activation, through a yet unknown mechanism (proposed here by red arrows), a decrease in phosphorylation of Mek1/2-Erk1/2-Stat3 (indicated in blue) occurs which in turn may affect the property of pErk1/2 and pStat3 signaling molecules to regulate gene transcription, alone or in cooperation with other transcription factors (TFs). A decrease in the activity of Mek1/2-Erk1/2 signaling cascade can be considered as liver response to iron overload. We propose that a decrease in Mek1/2-Erk1/2 signaling activity may accelerate liver pathologies in addition to toxic effects of iron.

© 2019 by the authors. Licensee MDPI, Basel, Switzerland. This article is an open access article distributed under the terms and conditions of the Creative Commons Attribution (CC BY) license (http://creativecommons.org/licenses/by/4.0/).
Share and Cite
MDPI and ACS Style
Tangudu, N.K.; Buth, N.; Strnad, P.; Cirstea, I.C.; Spasić, M.V. Deregulation of Hepatic Mek1/2–Erk1/2 Signaling Module in Iron Overload Conditions. Pharmaceuticals 2019, 12, 70. https://0-doi-org.brum.beds.ac.uk/10.3390/ph12020070
AMA Style
Tangudu NK, Buth N, Strnad P, Cirstea IC, Spasić MV. Deregulation of Hepatic Mek1/2–Erk1/2 Signaling Module in Iron Overload Conditions. Pharmaceuticals. 2019; 12(2):70. https://0-doi-org.brum.beds.ac.uk/10.3390/ph12020070
Chicago/Turabian StyleTangudu, Naveen Kumar, Nils Buth, Pavel Strnad, Ion C. Cirstea, and Maja Vujić Spasić. 2019. "Deregulation of Hepatic Mek1/2–Erk1/2 Signaling Module in Iron Overload Conditions" Pharmaceuticals 12, no. 2: 70. https://0-doi-org.brum.beds.ac.uk/10.3390/ph12020070
Note that from the first issue of 2016, this journal uses article numbers instead of page numbers. See further details here.