1. Introduction
Infection is a frequent complication during the natural clinical evolution of rheumatoid arthritis (RA), contributing to disease-associated morbidity and mortality [
1]. Age-adjusted mortality in RA might be increased about twofold when compared to the general population, and infectious diseases are one of the leading causes of death [
2]. This infection risk has been found to be influenced by several disease-related conditions, patient-associated comorbidities, and the immunomodulatory drugs used. Scores of disease activity, such as the disease activity score 28 (DAS-28), have been found to correlate with infection risk [
1,
3]. Corticosteroids, synthetic disease-modifying anti-rheumatic drugs (DMARDs), and biologic DMARDs may also suppress the immune response, which might translate into an additional risk for infection [
2,
4].
In the complex pathophysiology of RA, interleukin-6 (IL-6) overproduction is of major relevance. IL-6 is a pleiotropic cytokine with a role in eliciting the acute-phase response in the liver, B-cell proliferation and antibody production, and T-cell differentiation and cytotoxicity [
5]. Chronic inflammatory states, such as the one present in RA, through increased levels of IL-6 and other cytokines, result in an increased transcription of the HAMP gene in the liver, which encodes hepcidin [
6]. After binding to its receptor in hepatocytes, IL-6 induces a Janus kinase 1 (JAK1)-mediated phosphorylation of STAT3, which in turn activates the transcription of the HAMP gene [
6]. Hepcidin is an iron regulatory hormone [
7] whose best-documented activity is binding to and promoting endocytosis and degradation of ferroportin, the only known iron exporter expressed in cells involved in iron metabolism [
7,
8,
9]. High concentrations of circulating hepcidin, characteristic of inflammatory states, results in low expression of ferroportin in duodenal enterocytes, hepatocytes, Kupffer cells, and splenic macrophages, decreasing iron export to the extracellular fluid and plasma [
7,
8]. The result, called hypoferremia of inflammation, has been proposed to be evolutionarily advantageous [
9]. Three adaptive functions have been proposed for the hypoferremia of inflammation: inhibition of extracellular bacterial growth by sequestering available iron (considering that most infectious agents need to scavenge iron from the host to multiply); protection from the toxicity caused by high levels of iron and heme released during tissue necrosis and erythrocyte destruction; and increased transferrin capacity to bind to iron released during infection and inflammation [
6,
8].
Considering the IL-6 overproduction observed in RA, one of the biologic DMARDs used successfully for its treatment is tocilizumab, a humanized anti-IL-6 receptor (anti-IL-6R) monoclonal antibody designed to block IL-6 signaling [
10]. In patients with RA treated with tocilizumab, infection is considered the most frequent adverse event and respiratory infections are the most frequently documented [
11,
12,
13]. Although clinical trials initially reported low infection rates associated with tocilizumab therapy in patients with RA [
11,
12,
13], some observational studies of real-life registries have found higher infection rates [
5]. Comparisons of infection rates between anti-IL-6R and antitumor necrosis factor α (TNFα) therapy have also been conducted, with some observational cohort studies finding a higher infection rate in tocilizumab [
14,
15].
The IL-6 signal blockade may suppress hypoferremia of inflammation [
5]. It has been demonstrated that blocking IL-6 or TNFα pathways with tocilizumab or anti-TNFα monoclonal antibodies resulted in significantly lower serum hepcidin and significantly higher serum iron [
16]. However, the effect on hepcidin was noted to be stronger in patients treated with tocilizumab when compared with patients treated with anti-TNFα monoclonal antibodies [
16]. Analysis of the relationship between these parameters and infection risk observed in this type of patients has never been evaluated before.
The objective of the present study was to ascertain whether changes in iron metabolism induced by anti-IL-6R biologic therapy were associated with an increased risk of infection.
2. Results
This was a prospective longitudinal study of patients with a diagnosis of RA and treated with an anti-IL-6R biologic. RA patients treated with an anti-TNFα were also included as a control group. Both groups had a 24-month follow-up, with serum samples collected every semester and any infections during this period registered by clinical interview.
A total of 15 patients were included, with a mean age of 51.0 ± 4.1 and 73.3% (n = 11) female. All patients completed the follow-up time without censoring. Mean disease duration was 10.8 ± 9.5 years. Regarding biologic DMARD therapy, 10 patients were treated with an anti-IL-6R monoclonal antibody (tocilizumab) and 5 with an anti-TNFα monoclonal antibody (either infliximab, golimumab, or adalimumab). Baseline characteristics and additional drugs used at any time during follow-up are summarized in
Table 1 and
Table 2, respectively. Corticosteroid daily dosages were relatively low (median = 5 mg/day, IQR 5–10 mg/day, maximum of 20 mg/day, in prednisolone-equivalent dosages).
2.1. Iron Metabolism
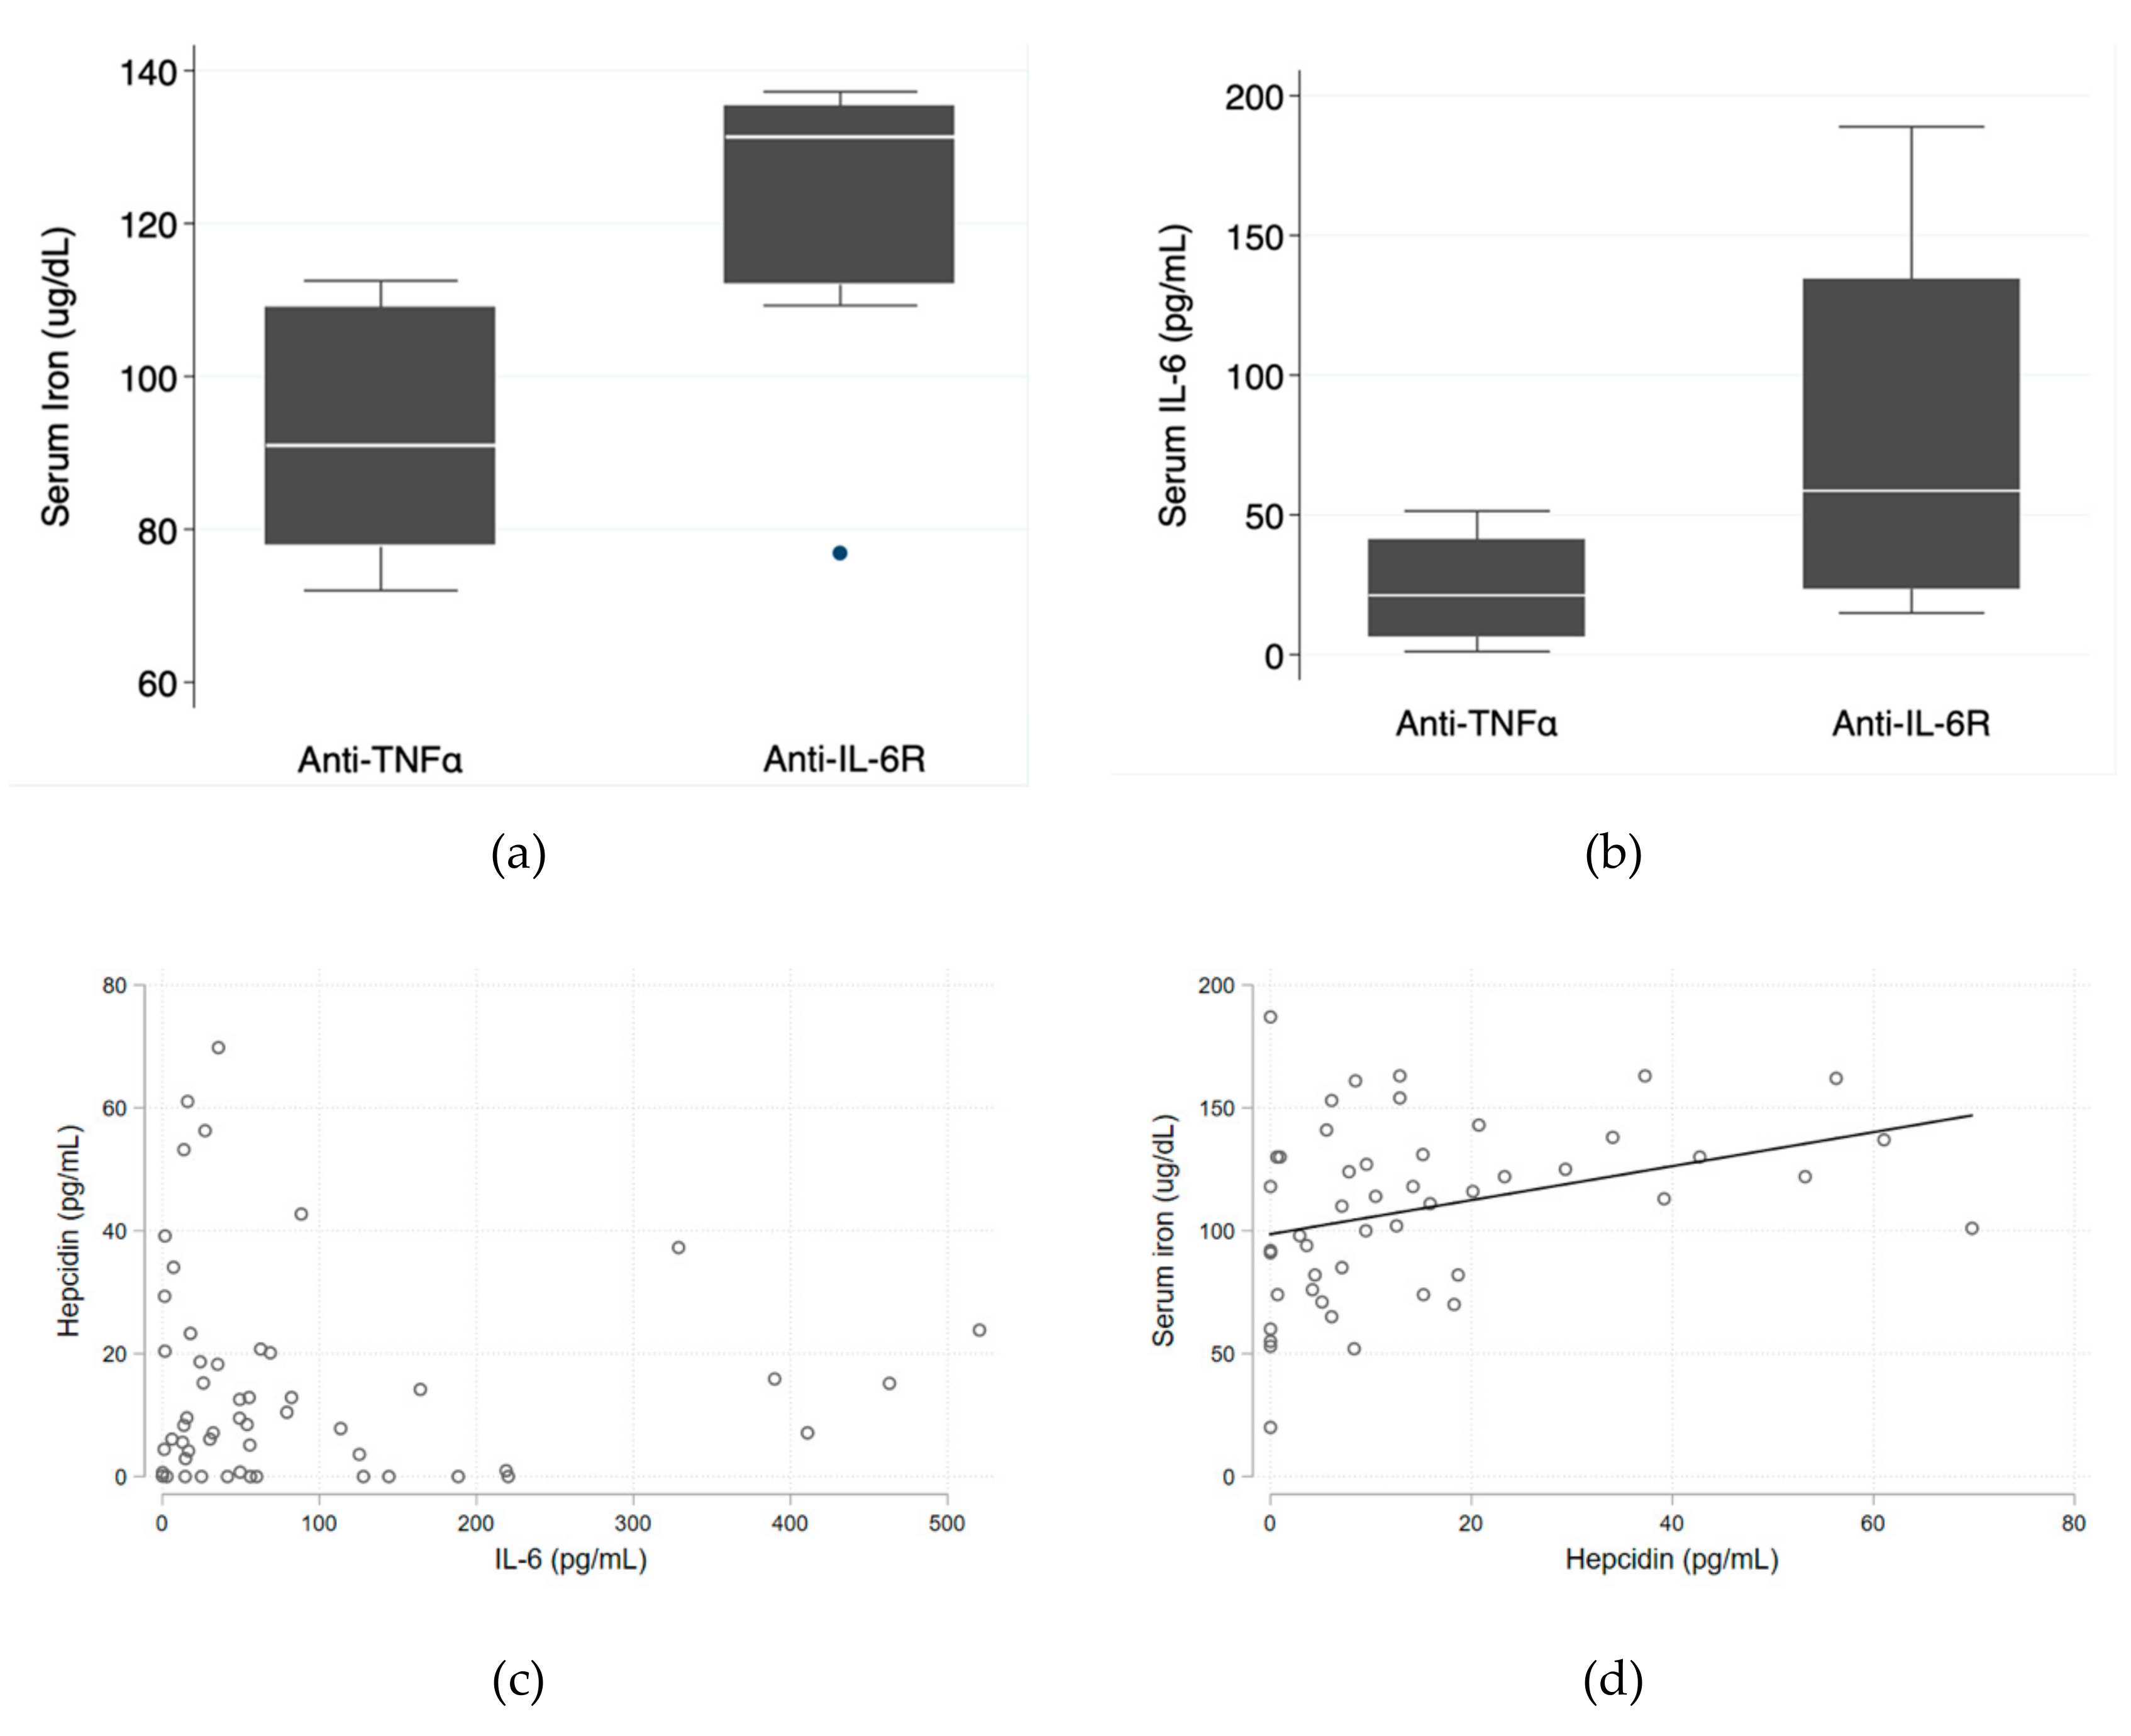
Median serum iron levels were significantly higher in the anti-IL-6R group (131.3 ug/dL (IQR 112.0–135.3 ug/dL) vs. 91.0 ug/dL (IQR 77.8–109.0 ug/dL); p = 0.028). Median serum IL-6 levels were also higher in the anti-IL-6R group (58.6 pg/mL (IQR 23.5–134.4 pg/mL) vs. 21.2 pg/mL (IQR 6.4–41.0 pg/mL); p = 0.090)—
Figure 1a,b—which is consistent with the known mechanism of action of tocilizumab and corroborates good patient adherence. The relationship between serum IL-6 and hepcidin levels tended to be inverse (
Figure 1c) and there was a direct positive relationship between hepcidin and serum iron levels (
p = 0.018)—
Figure 1d.
2.2. Infection Risk
During follow-up, a total of 29 infections were registered, 89.66% (n = 26) in the anti-IL-6R group and 10.34% (n = 3) in the anti-TNFα group. The types of infections are summarized in
Table 3. Definitive microbiological identification of the infectious agents was not extensively pursued. The type of infectious agent (bacterial, viral, or fungal) was mainly presumptive considering clinical, analytical, and epidemiological data. Three infections were considered serious, 1 in the anti-IL-6R group and 2 in the anti-TNFα group. All serious infections were pneumonias requiring inpatient intravenous therapy. None of the infections resulted in death.
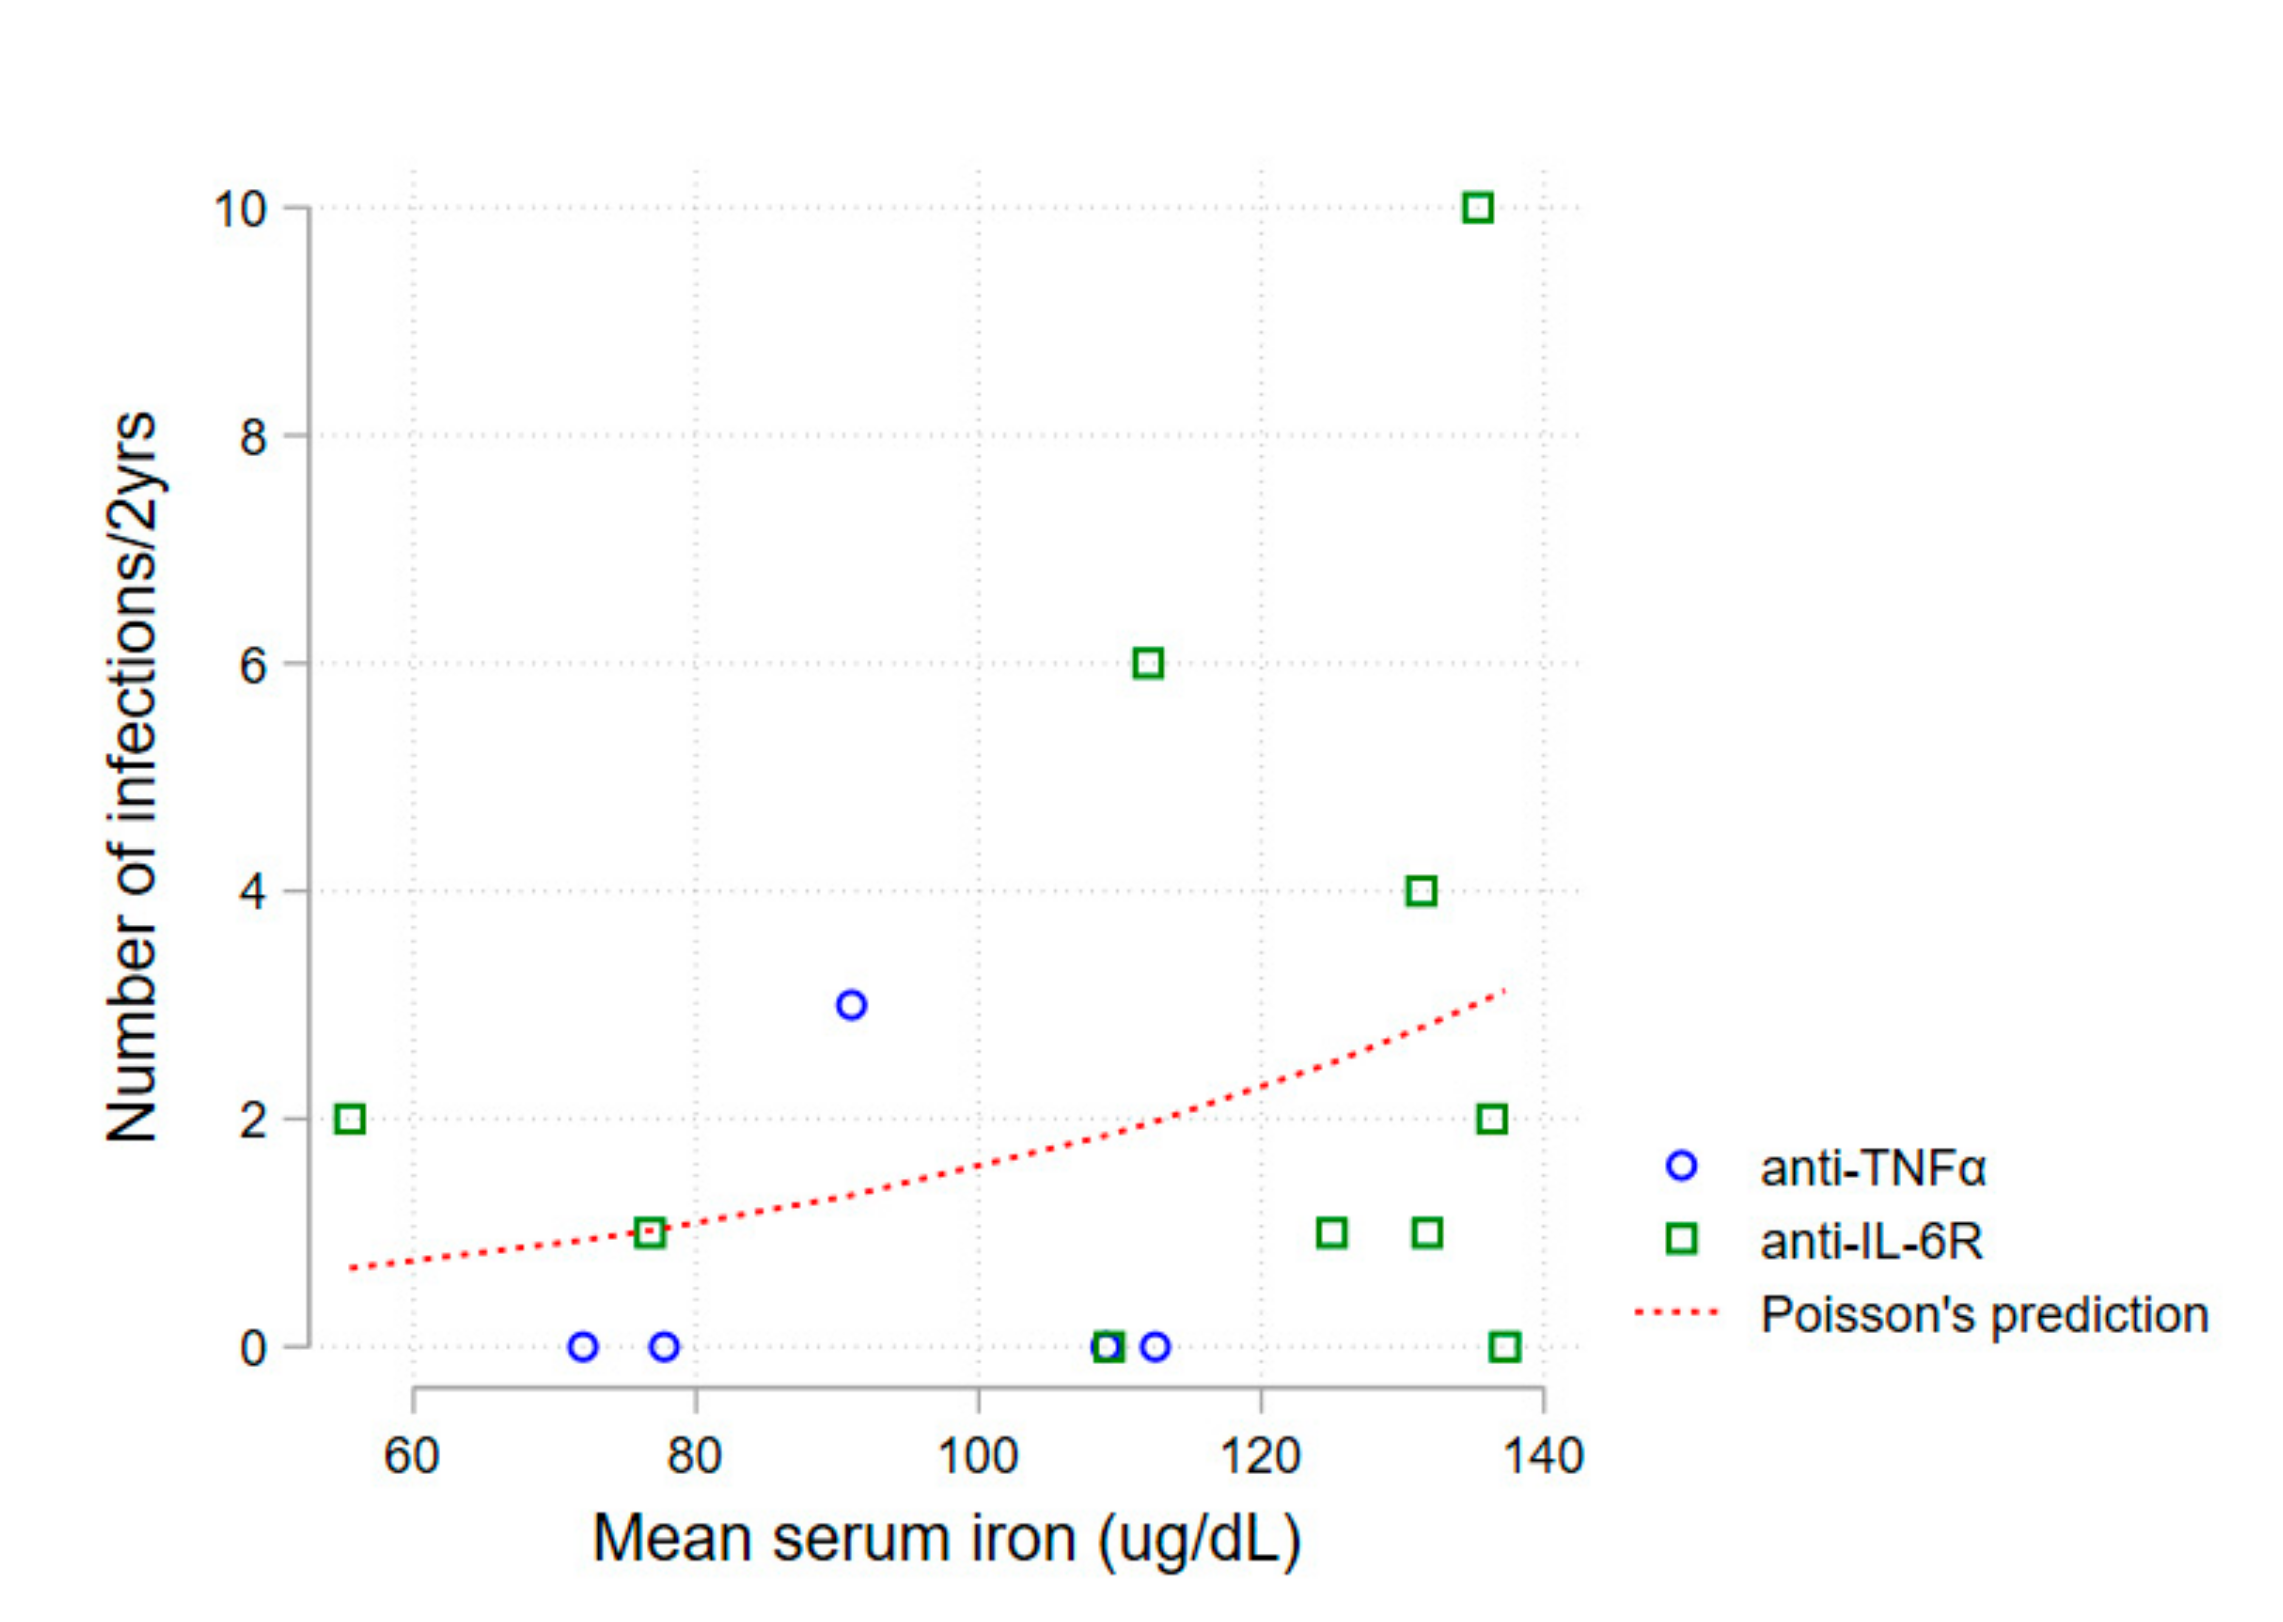
A first non-adjusted analysis of mean serum iron levels and number of infections during follow-up revealed an association between higher serum iron and a higher number of infections (Poisson regression,
p = 0.030)—
Figure 2.
Next, a multiple failure-time survival analysis was performed through fitting of an Anderson-Gill Cox proportional hazards regression model. Univariate analysis of patient’s characteristics identified a higher risk of infection in the presence of diabetes mellitus and a lower risk of infection in the presence of corticosteroid therapy—
Table 4.
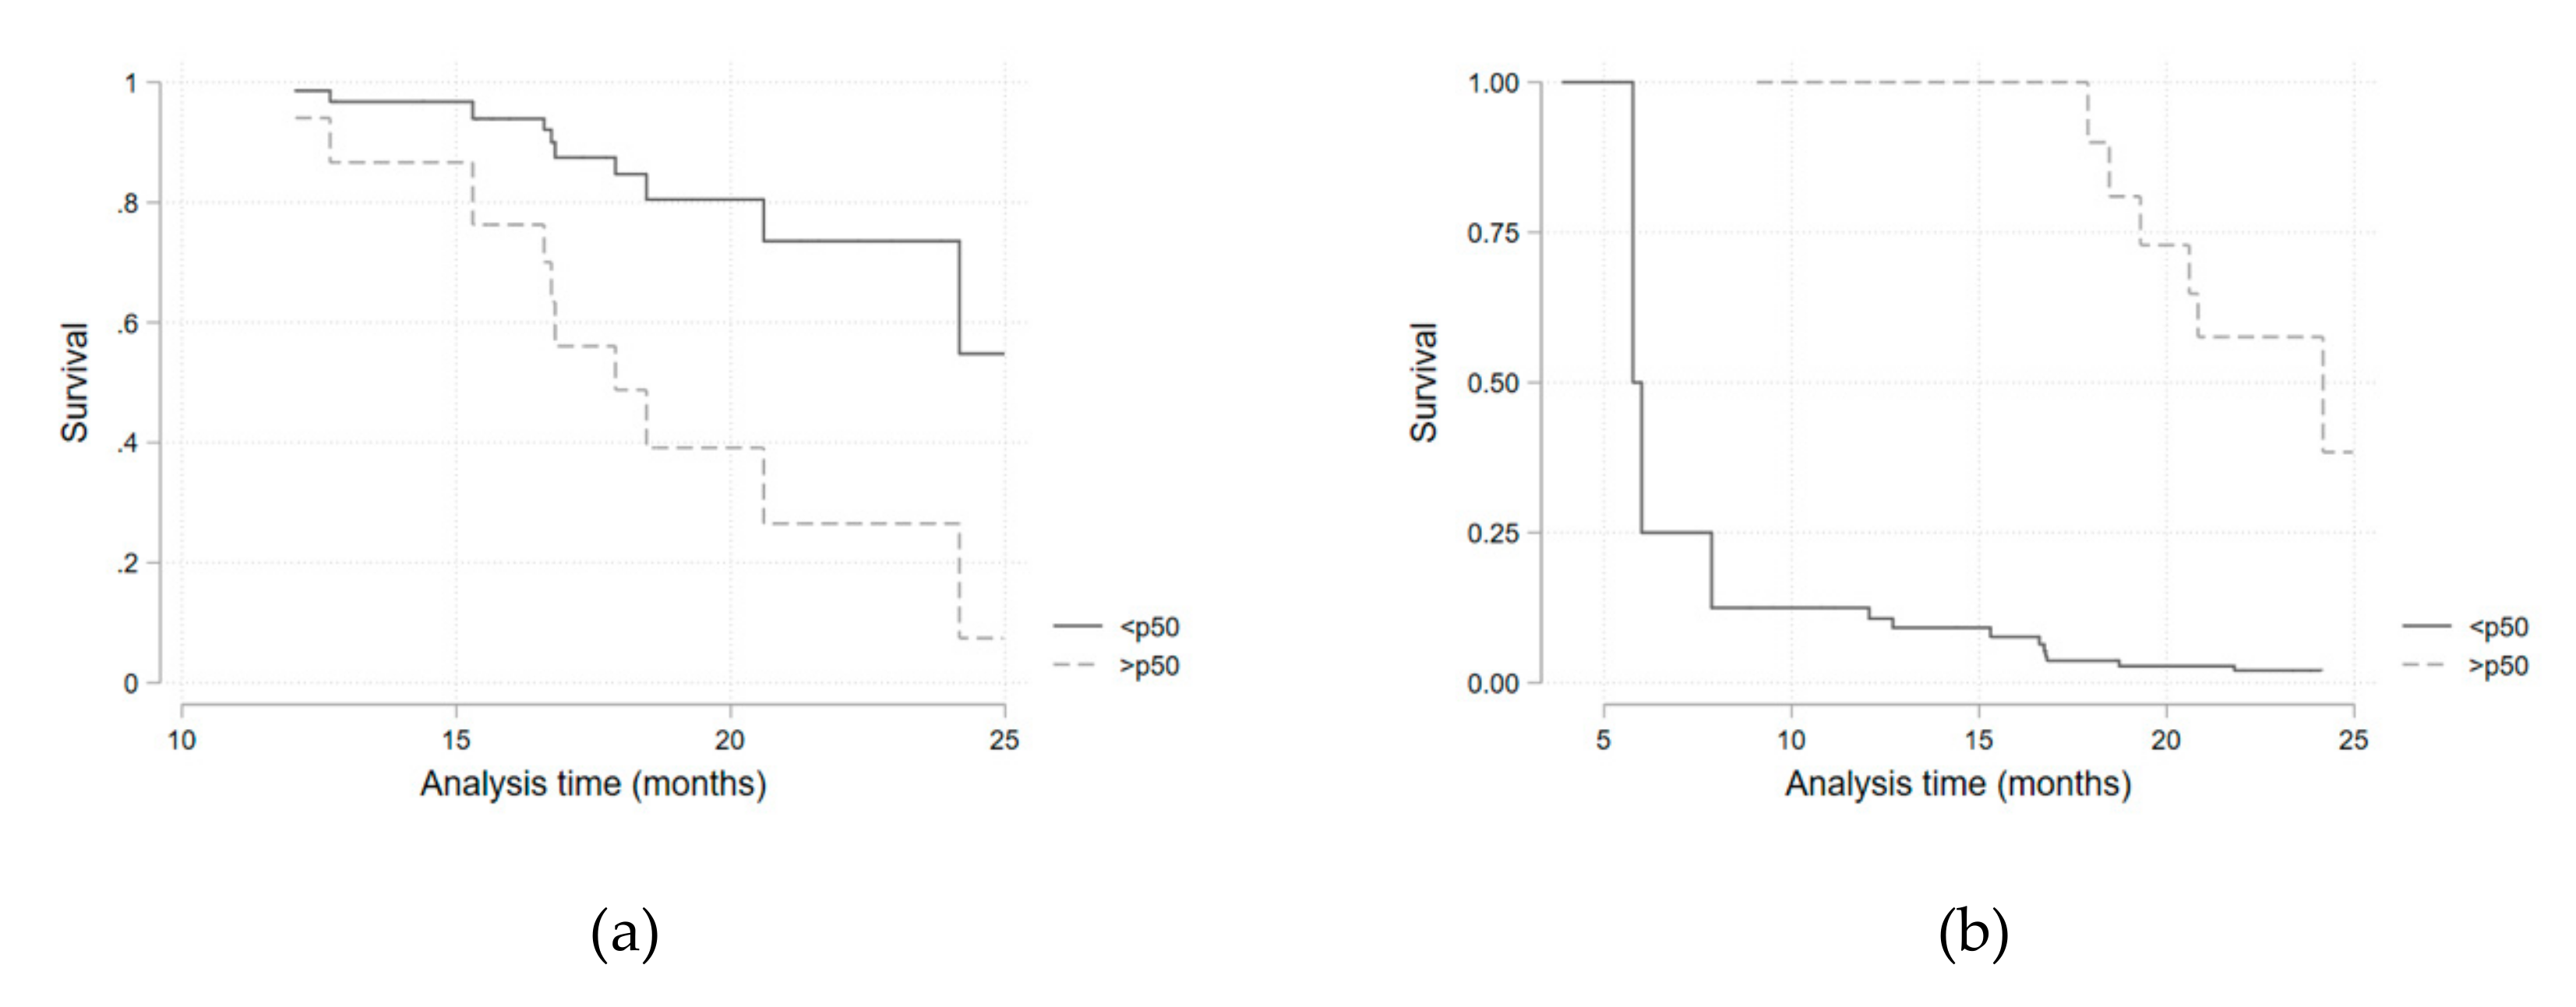
Considering the potential confounding variables identified in the univariate analysis, a multivariate survival regression model, adjusted for the presence of diabetes mellitus and for corticosteroid therapy, was fitted for each of the iron metabolism variables (
Table 5,
Figure 3). Hazard ratios for being above the median of each parameter distribution was considered. Transferrin saturation above the median value (>32.1%) was associated with a higher infection risk (HR 4.3; 95%CI 1.0–19.69;
p = 0.05). This result was similar when a sub-analysis was performed in the anti-IL-6R group (HR 6.46; 95%CI 1.05–39.72;
p = 0.044). Ferritin above the median value (>72 mg/dL) presented as a protective factor (HR 0.16; 95%CI 0.05–0.53;
p = 0.003). As serum iron above the median value was, although non-significantly, still strongly associated with a higher infection risk (HR = 3.2 for all patients), we performed a quartile sub-analysis that showed a consistently higher risk of infection for each higher quartile (
Table 6,
Figure 4).
3. Discussion
This was a prospective longitudinal pilot study designed to evaluate whether changes in iron metabolism induced by anti-IL-6R biologic therapy were independently associated with an increased risk of infection in patients with RA. Higher infection risk was associated with higher serum iron and transferrin saturation.
Baseline characteristics were as expected for a cohort of patients with RA. Gender, median age, disease duration, and co-morbidities of patients on anti-IL-6R therapy did not differ when compared with a subgroup of patients on anti-TNFα. Non-biologic DMARD therapy use was also similar, with the exception of a significantly higher sulfasalazine use in the anti-TNFα group. Posterior analysis did not find a higher relative risk of infection in sulfasalazine users, and this difference was not considered relevant.
As expected, patients on anti-IL-6R monoclonal antibody therapy tended to have higher levels of free serum IL-6 than patients on anti-TNFα. These data are in accordance with drug pharmacodynamics and result from a diminished serum clearance of receptor-bound IL-6. The relationship between serum IL-6 and hepcidin levels seemed to be inverse, most probably as a result of a reduced IL-6 receptor-JAK1-STAT3 signal for HAMP gene transcription due to the IL-6-receptor blockade. Therefore, higher IL-6 serum levels (and consequently, a higher IL-6 receptor blockade) were associated with a lower hepcidin concentration. This was expected to have resulted in less endocytosis and degradation of ferroportin in duodenal enterocytes, hepatocytes, Kupffer cells, and splenic macrophages, higher iron efflux and, consequently, higher serum iron levels in patients on anti-IL-6R therapy. However, an unexpected positive linear correlation between serum iron and hepcidin was obtained, and higher levels of hepcidin were associated with higher levels of serum iron. This relationship may have been affected by the presence of unmeasured confounding regulatory factors of hepcidin production or may have derived from the stimulatory effect that serum iron has on hepcidin transcription in hepatocytes, through a mechanism of extracellular iron sensing [
6].
In the univariate analysis of patient and disease-related characteristics, diabetes mellitus was the only statistically significant risk predictor for infection. The relationship between diabetes and infection risk is well-known in the general population and is expected to be similar in patients on biologic DMARD therapy. Corticosteroid therapy, on the other hand, tended to constitute a protective independent factor for infection occurrence in this study. It is commonly accepted that corticosteroid use increases infection risk [
2], but it should be noted that the median daily dose per patient in our study was 5 mg/day. Such low dosages may have an immunomodulatory rather than an immunosuppressive effect, such that controlling chronic inflammation may translate into a lower infection risk. In light of this, survival analysis was adjusted for these two variables.
The relationship found between higher serum iron levels and transferrin saturation, and a higher infection risk was initially proposed and expected. Infective microorganisms use available iron as a catalytic component of enzymes that mediate many redox reactions, making it crucial for energy production and proliferation [
6]. Concentration of iron in plasma and extracellular fluid decreases dramatically within hours of infection or other inflammatory stimuli through a cytokine-driven increase in hepcidin concentration [
8]. This adaptative function of hepcidin is of particular importance when most common extracellular infective microorganisms are considered [
8]. For intracellular agents (e.g.,
Legionella pneumophila and
Mycobacterium tuberculosis) the hepcidin–ferroportin axis may play an opposing role, as iron release from infected cells into plasma could deprive microorganisms of the iron they need to grow [
8]. Even without a definitive microbiologic identification, the infections reported here have a very low probability of being caused by intracellular organisms, based on clinical and epidemiological data. Furthermore, assistant physicians considered the majority of infections as being caused by extracellular bacteria and treated them accordingly and successfully. Infections were, as stated in previously published work [
15], mainly respiratory, and none were considered serious. Transferrin saturation presented as a significant predictive factor for infection occurrence when above 32.1% (median). Although not statistically significant, a very consistent and progressive increase in the hazard ratio for each quartile of serum iron levels (when compared with the first quartile) was obtained. The reduced number of patients included may have contributed to a loss of statistical power. Additionally, a statistically significant protective effect of ferritin on infection risk was obtained. Higher serum ferritin probably reflects higher cellular ferritin and iron storage as a consequence of ferroportin degradation and lower serum iron availability.
This study has some limitations. Blood sampling was not performed before biologic therapy was initiated, which limited the evaluation of the dynamic evolution of iron-related parameters. A small number of patients were included, and the anti-TNFα control group was smaller than the anti-IL-6R group, which might have limited statistical power. However, to the best of our knowledge, this investigation is the first to evaluate the relationship between iron metabolism and infection risk in patients with RA on anti-IL-6R biologic therapy, and it has consistently demonstrated that a trend in iron metabolism for a higher extracellular iron availability predicts infection occurrence. Given its intrinsically potent immunosuppressor effect, we would not suggest that elevated iron availability is the only mechanism through which tocilizumab increases infection risk, but our results show that it should be considered as a relevant contributing factor. Studies with larger cohorts are needed to confirm these data.
4. Materials and Methods
4.1. Study Design and Patient Eligibility
We conducted an observational prospective longitudinal study of patients with seropositive RA treated at the Systemic Immune-Mediated Diseases Unit in Portugal, under biologic DMARD therapy with either anti-IL-6R or anti-TNFα. All patients gave written informed consent for participation in the study, which was conducted in accordance with the Declaration of Helsinki, and after approval by the Ethics Committee of Hospital Professor Doutor Fernando Fonseca. Patients entered the study at the start of biological therapy and were followed up for 24 months. All blood samples were collected in the morning without fasting. Patients were 18 years old or older. Exclusion criteria were pregnancy; chronic kidney disease KDIGO classification 4 or higher; chronic liver disease Child–Pugh B or higher; cancer; transfusion therapy, iron or erythropoietin supplementation during or three months before starting biologic therapy; primary or secondary immunodeficiency not related with the immunomodulatory therapy; refusal or inability to sign informed consent.
4.2. Assessments
We collected demographic, clinical, and therapy-related data such as comorbidities, disease activity, and type and time of exposure to additional non-biologic immunomodulatory therapy. Disease activity was measured with the DAS28 score [
17] at the time of each blood sample collection.
Hepcidin and IL-6 plasma concentrations were measured using commercial ELISA kits (DY8307 and DY206, respectively—R&D systems, Minneapolis, MN, USA). All other biochemical and hematological parameters were measured using standard laboratory techniques. Blood samples from infection episodes were excluded.
4.3. Outcomes
The primary outcome was occurrence of infection during the first 24 months of biologic therapy. Infections were identified through clinical interviews during each regular follow-up visit at our clinic. Infections were grouped into respiratory (including upper and lower respiratory tract infections); genitourinary (including cystitis), pyelonephritis, and vulvovaginitis; skin and soft tissue (including cellulitis), erysipelas, abscesses, and wound infections; ear infections (including otitis media and externa); gastrointestinal infections (including acute gastroenteritis); and eye infections (such as purulent conjunctivitis). Serious infections were defined as requiring hospitalization or intravenous antibiotics.
4.4. Statistical Analysis
Differences in dichotomous variables between treatment groups were assessed by Spearman’s or Chi-square tests as appropriate. Continuous variables were compared using t-tests or Mann–Whitney tests as appropriate, judging normality by a Shapiro–Wilk test. As an initial analysis, the number of infection events was counted and directly compared between patients, as all patients had the same follow-up time (24 months), and the association with mean serum iron values was tested using a Poisson’s regression. Next, a survival analysis considering multiple failure-time data, with all patients starting follow-up at the start of biologic drug administration (time 0). No censoring events resulted in all patients being followed until the end of the 24 months. An Anderson–Gill Cox regression model was used to assess each independent covariate to the outcome of interest (infection rate) to check for potential confounders. Variables with a p-value of <0,1 were selected for inclusion in the multivariate model for each of the components of iron kinetics available. The association of each variable of interest (serum iron, transferrin, transferrin saturation, total iron binding capacity, ferritin, hepcidin, and IL-6) was performed by stratifying it to above/below the median. Kaplan–Meier survival curves were developed for significant associations. Sub-analyses with a quartile stratification was also possible. Analyses were conducted with the use of STATA software, version 14.0 (StataCorp).


