Fenofibrate Nanocrystal Composite Microparticles for Intestine-Specific Oral Drug Delivery System

Abstract
:1. Introduction
2. Materials and Methods
2.1. Materials
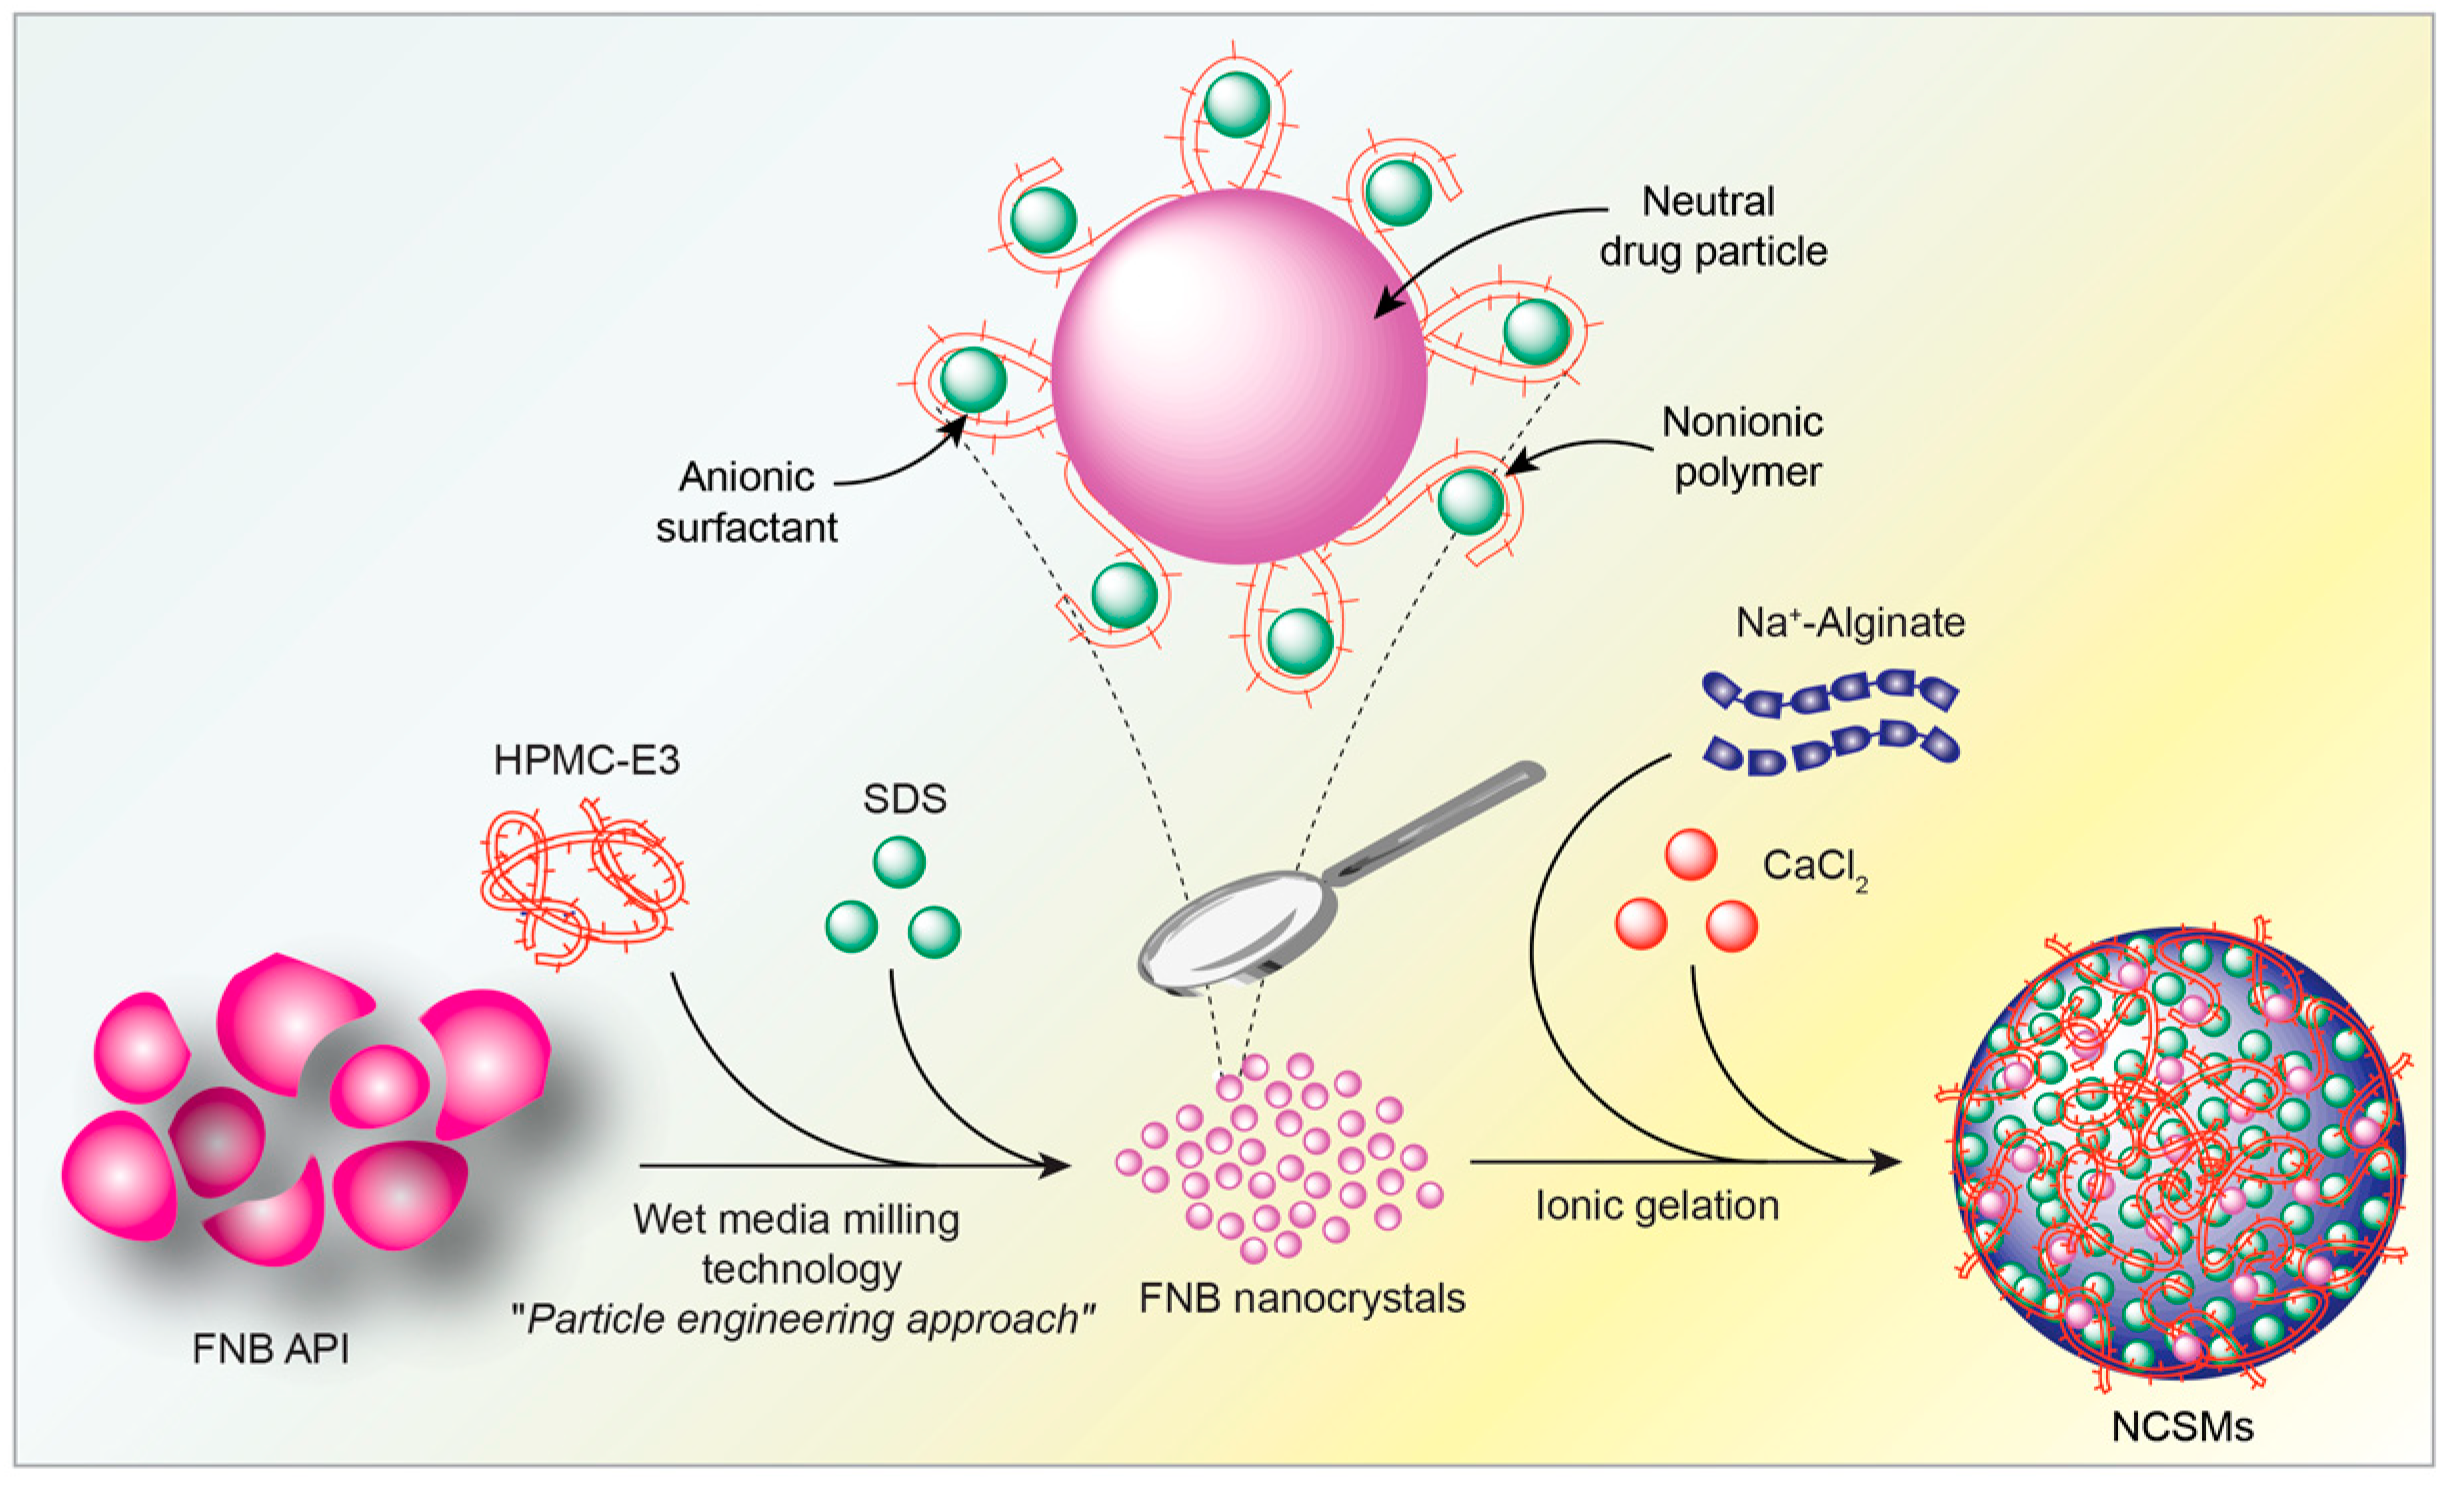
2.2. Preparation of NCSMs
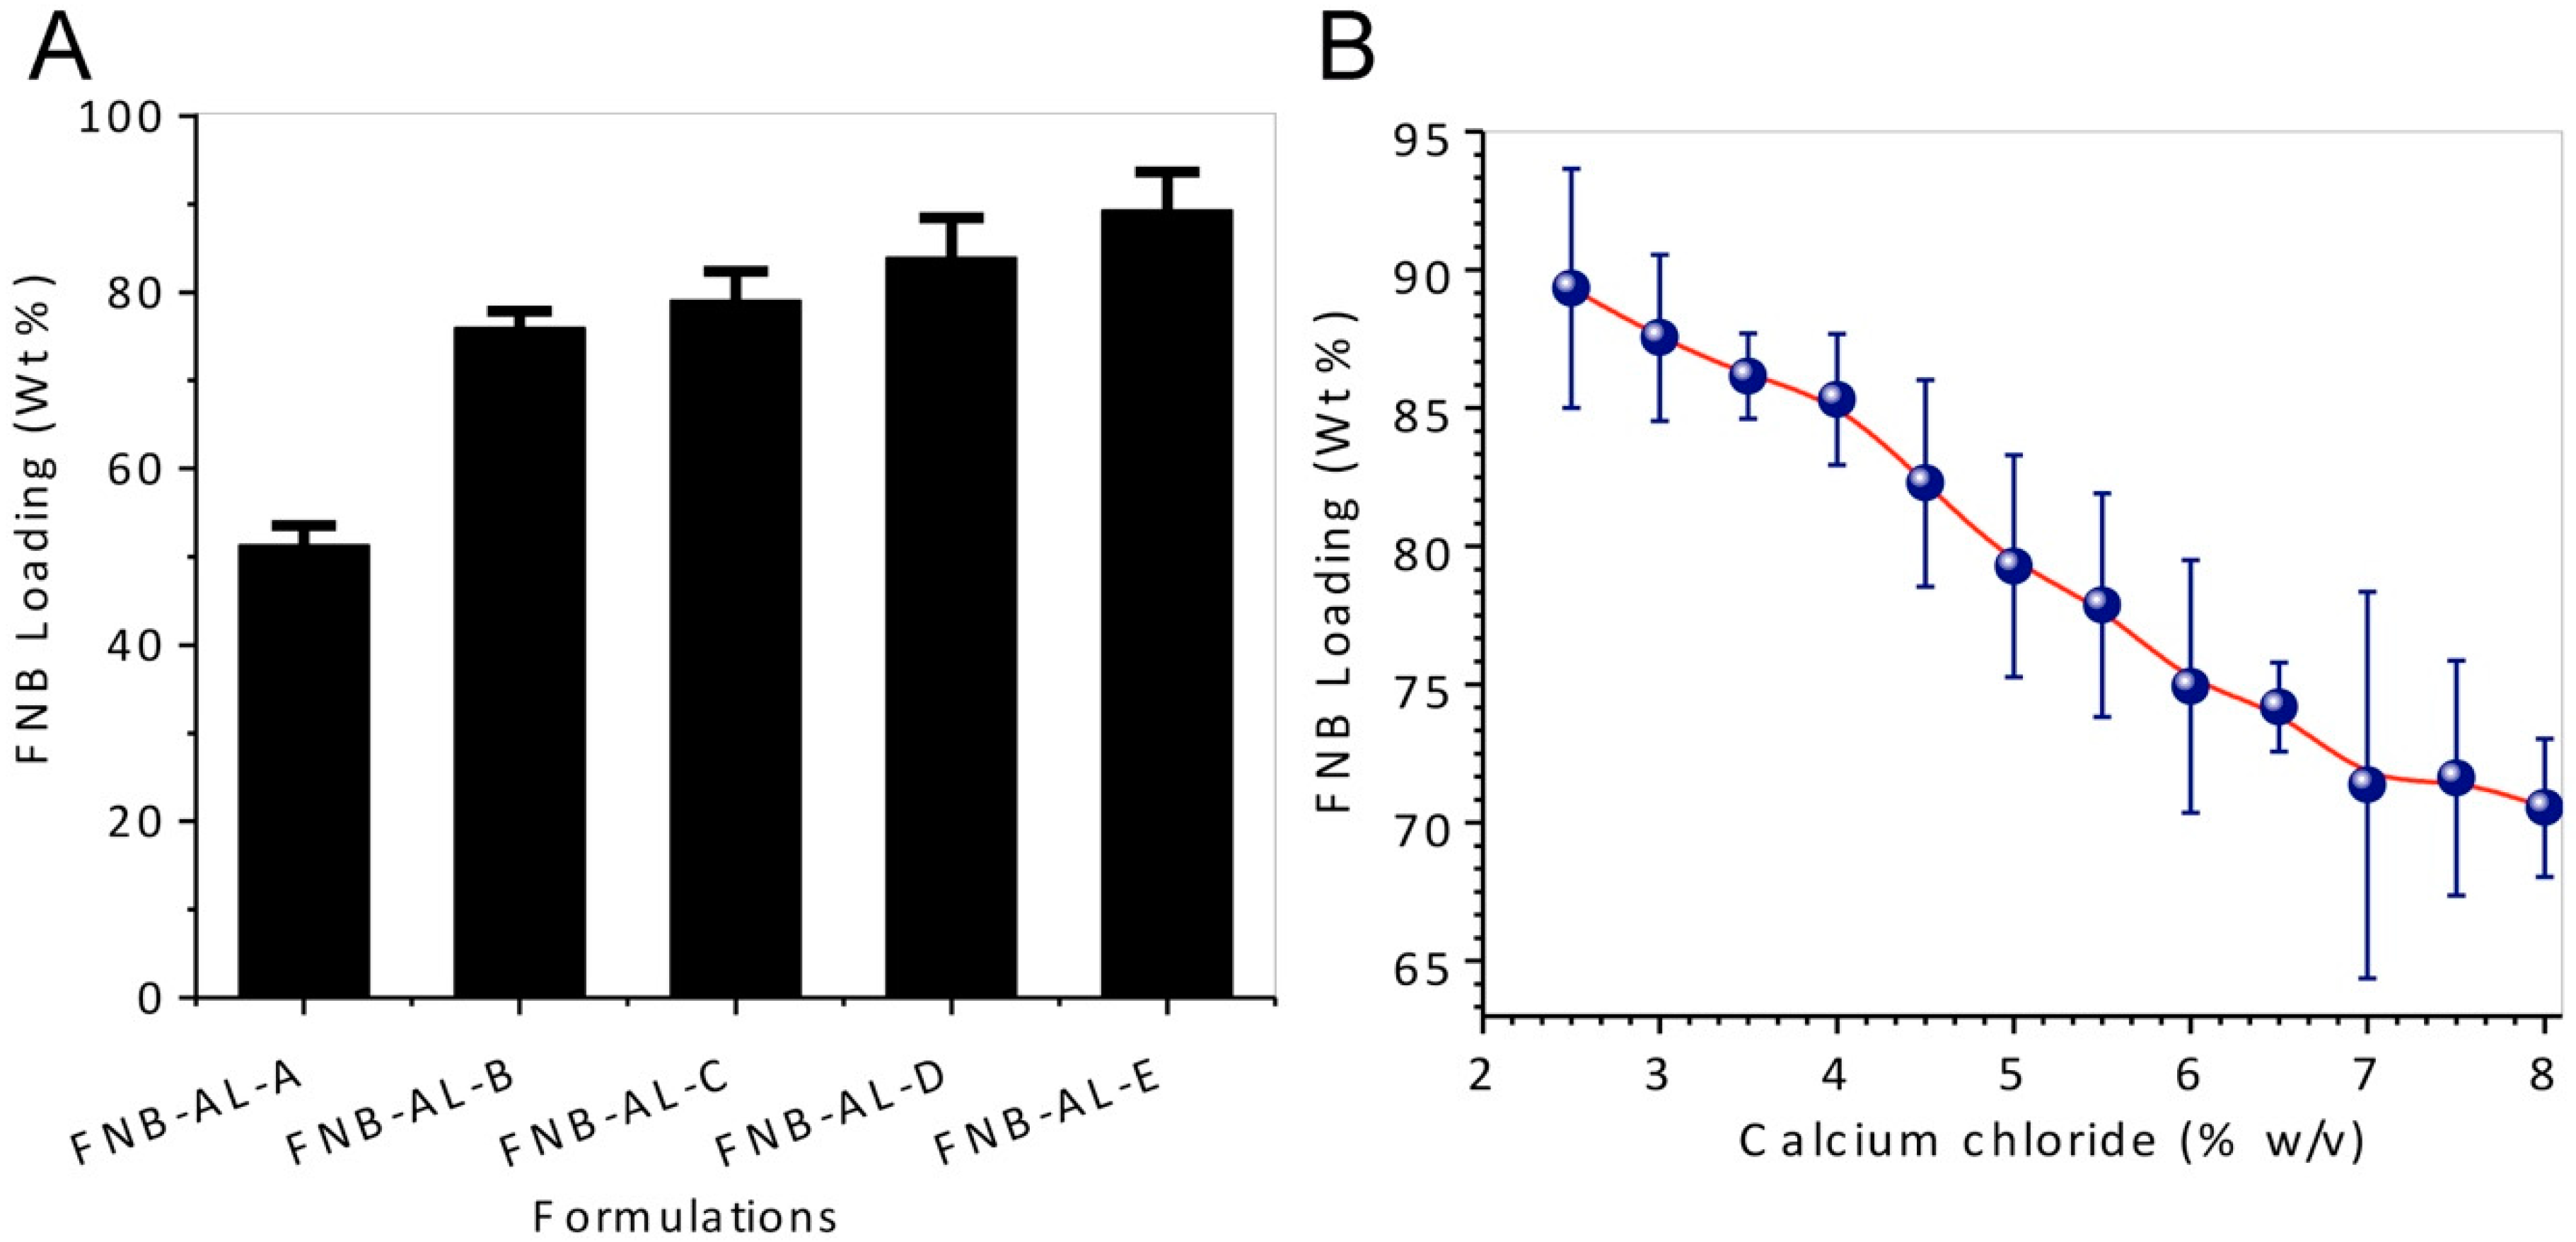
2.3. Determination of Drug Content
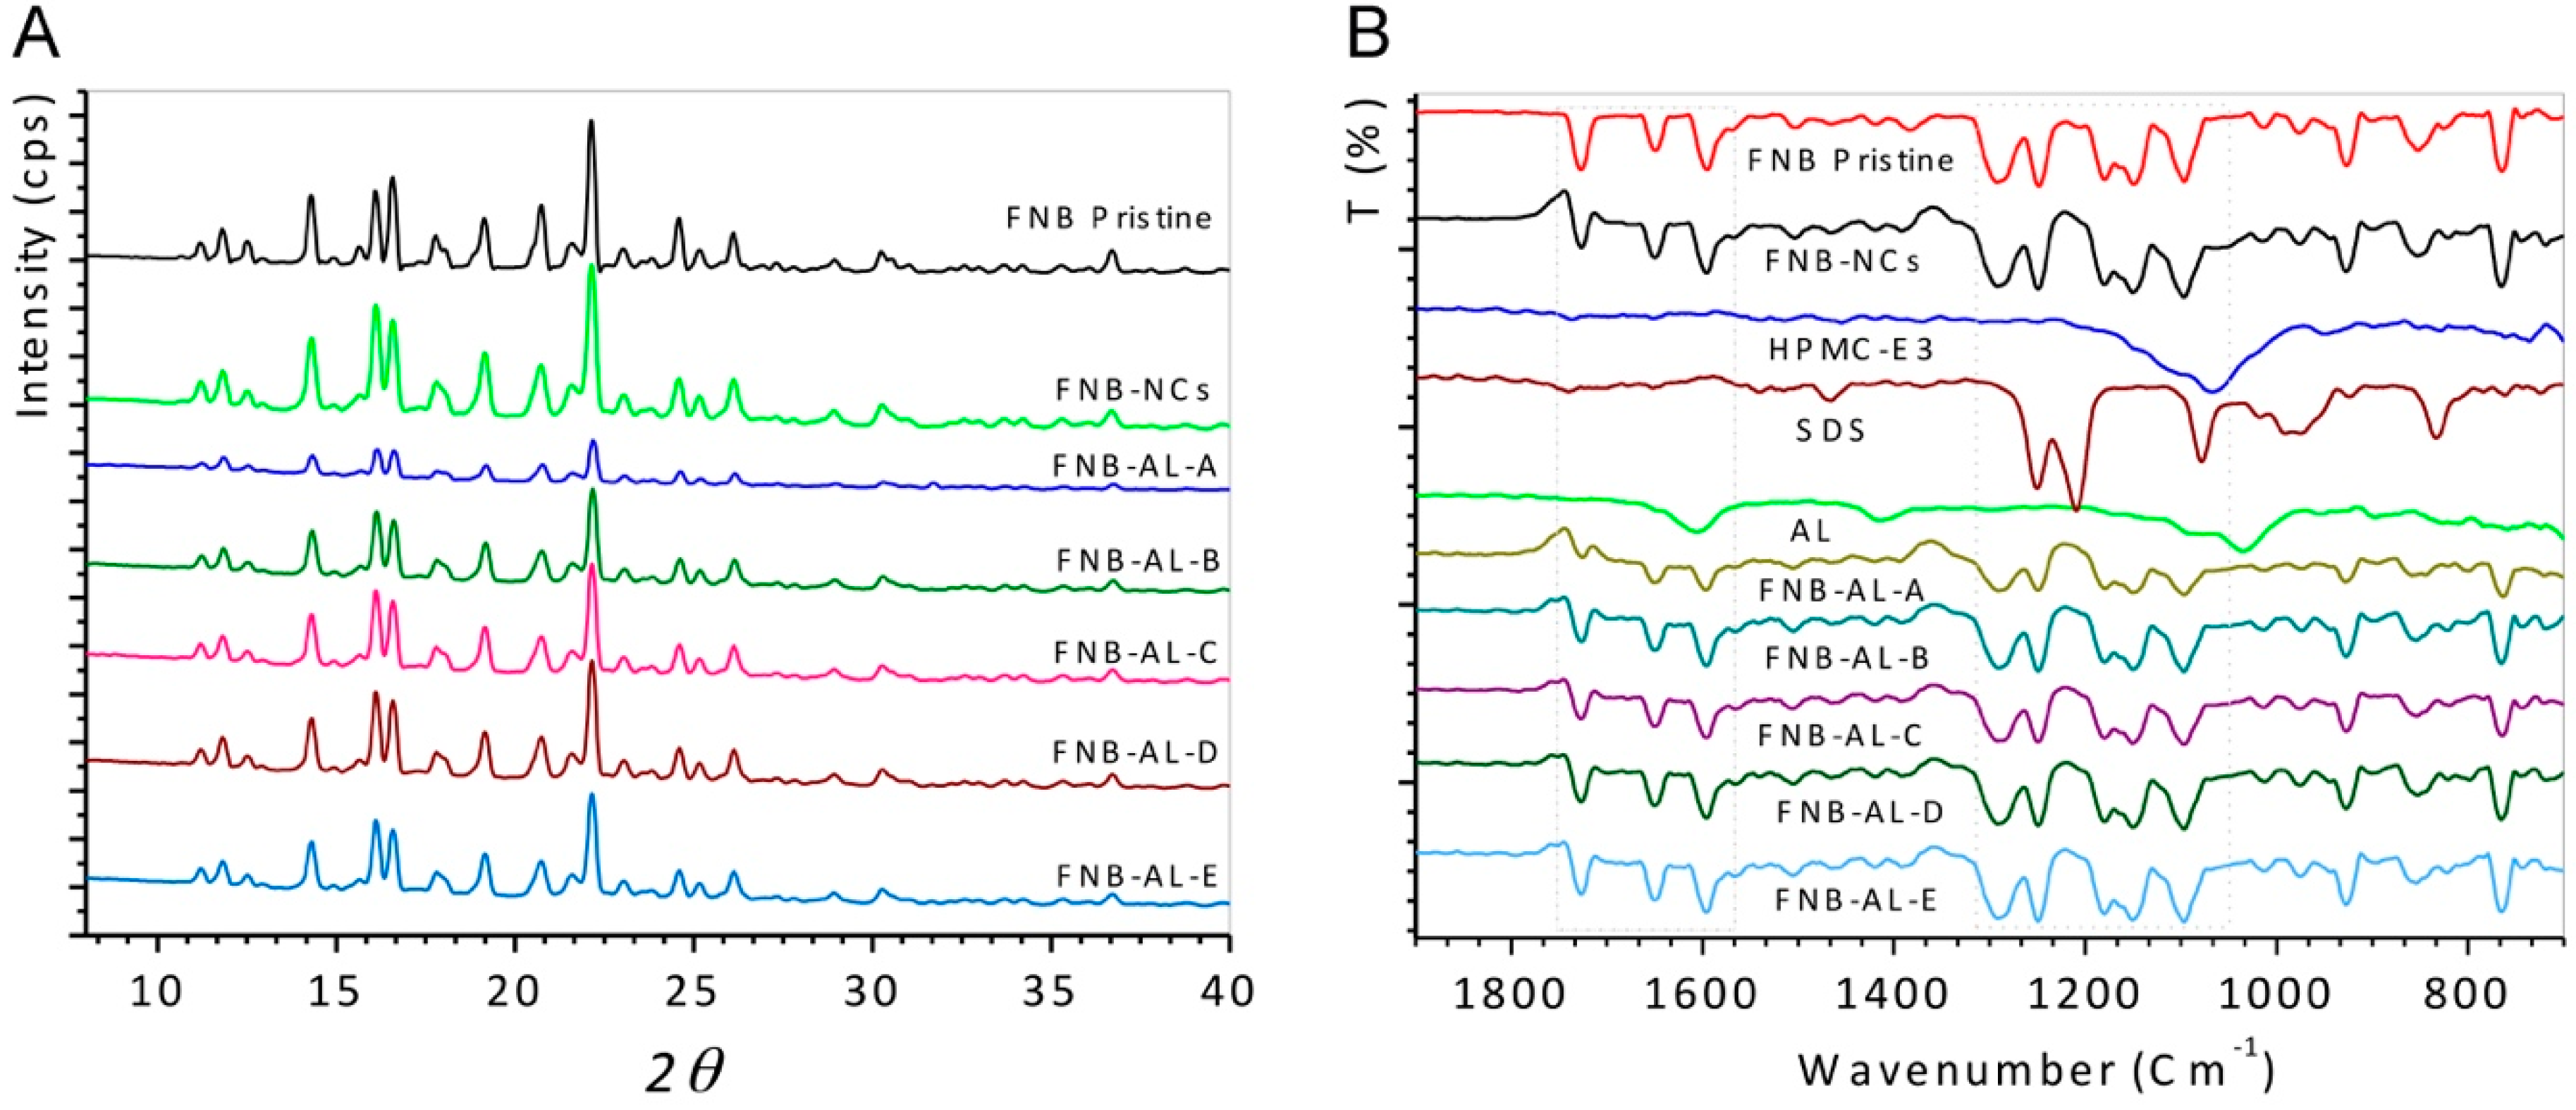
2.4. XRD
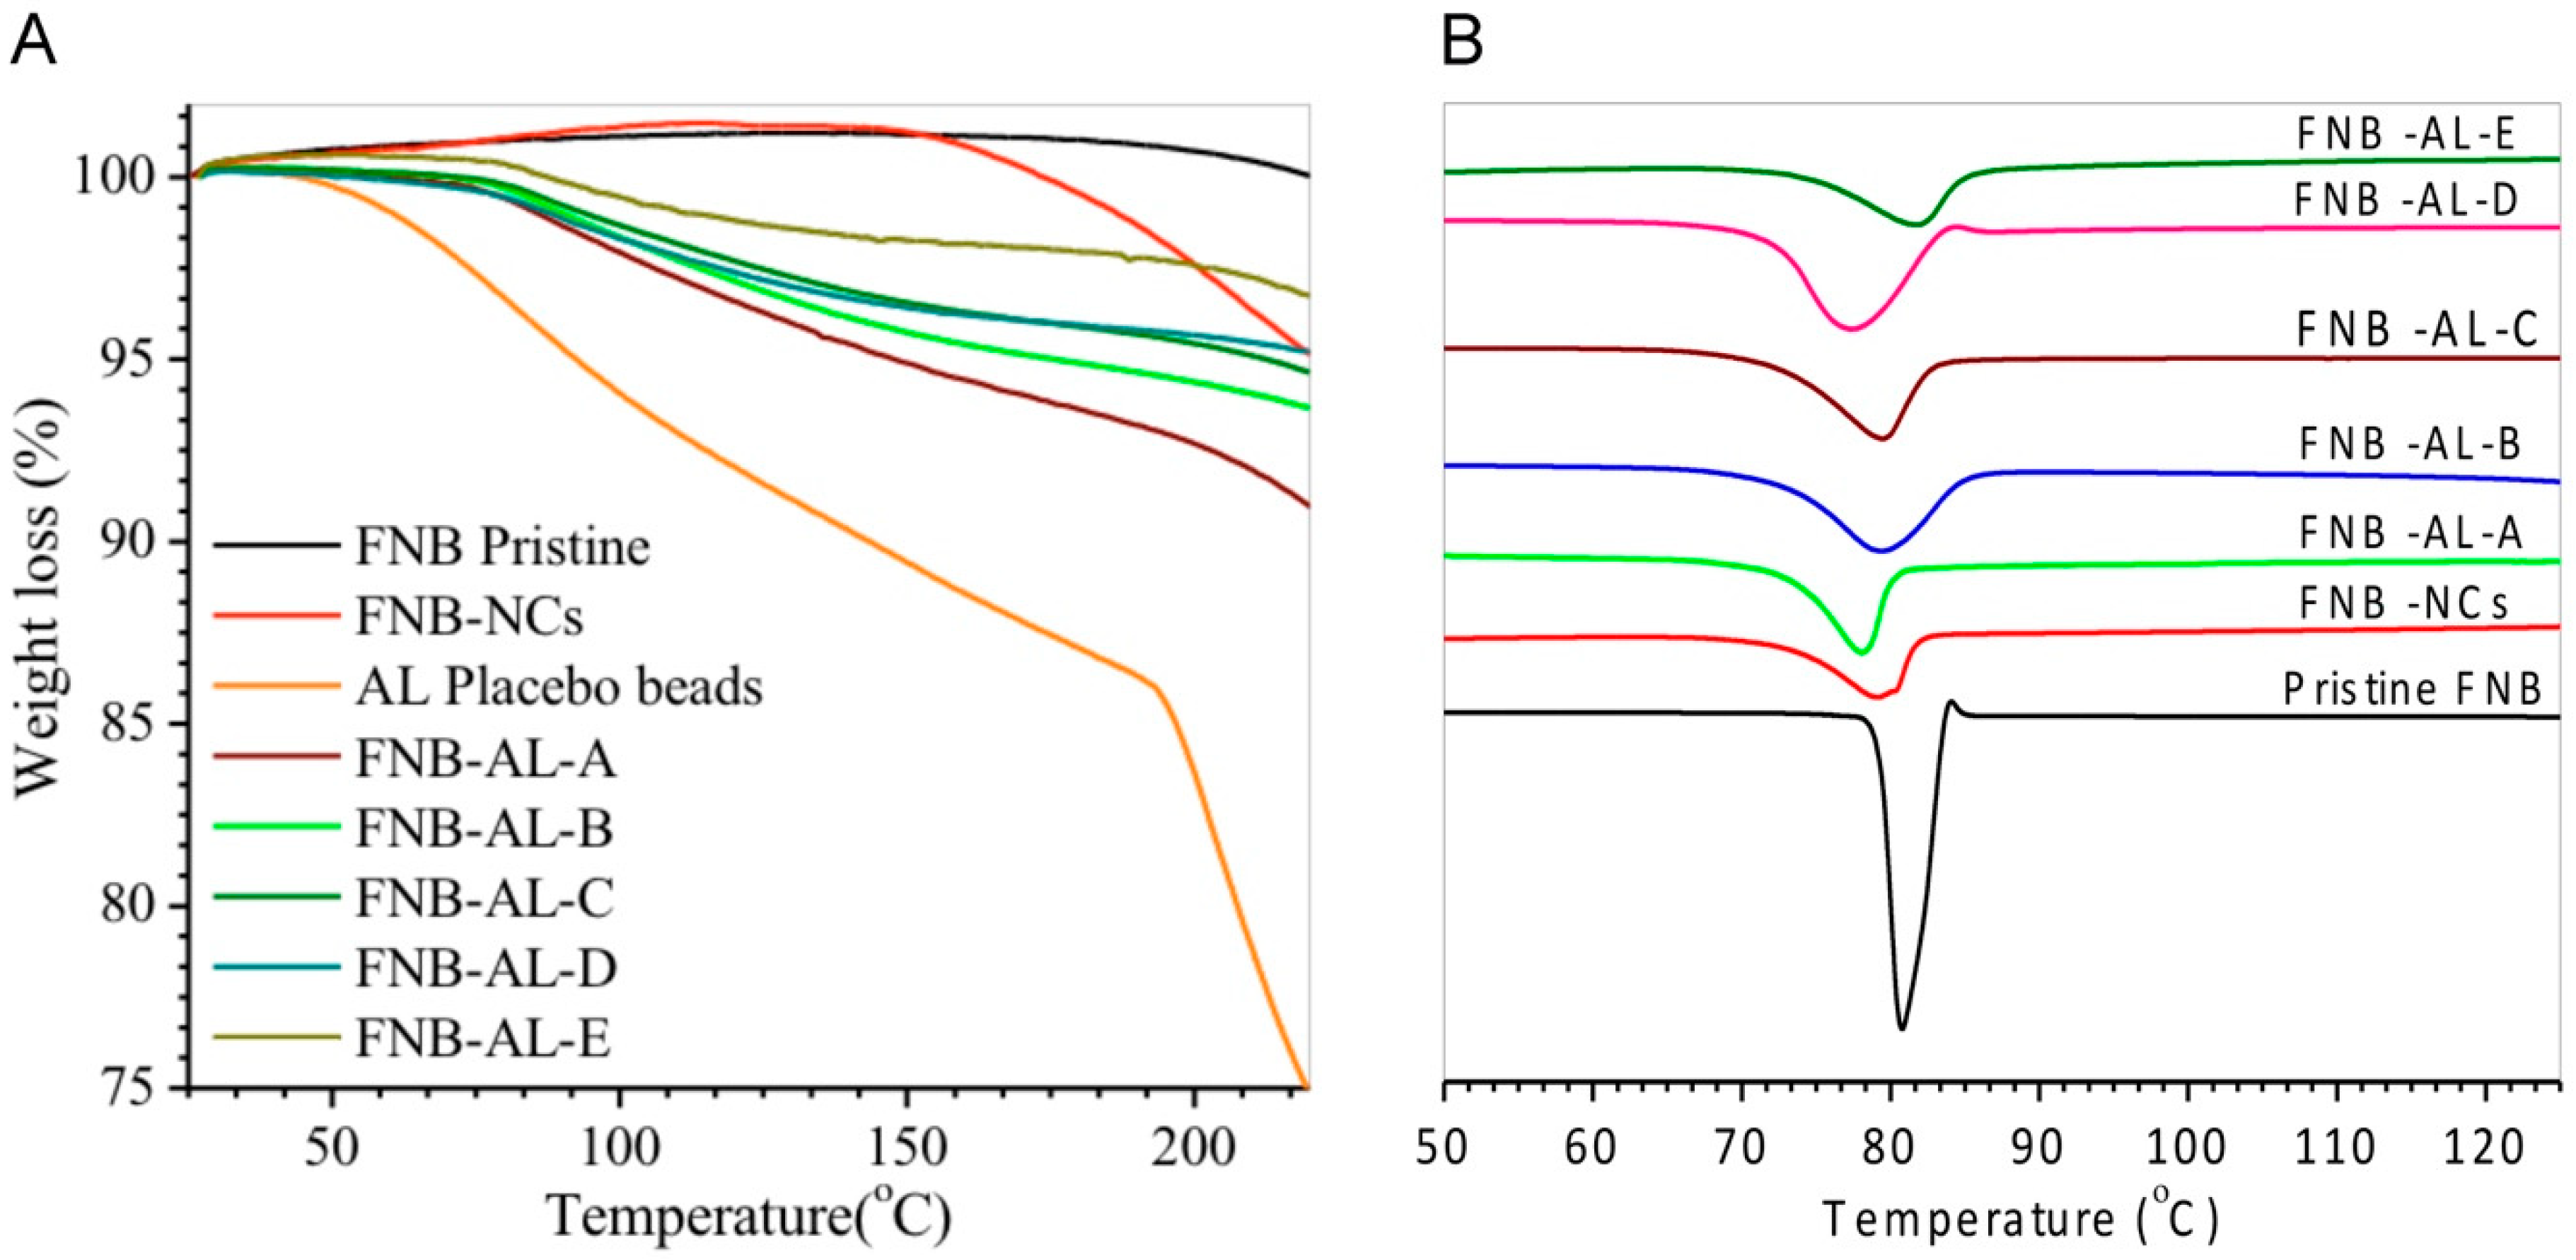
2.5. TGA
2.6. DSC
2.7. FTIR
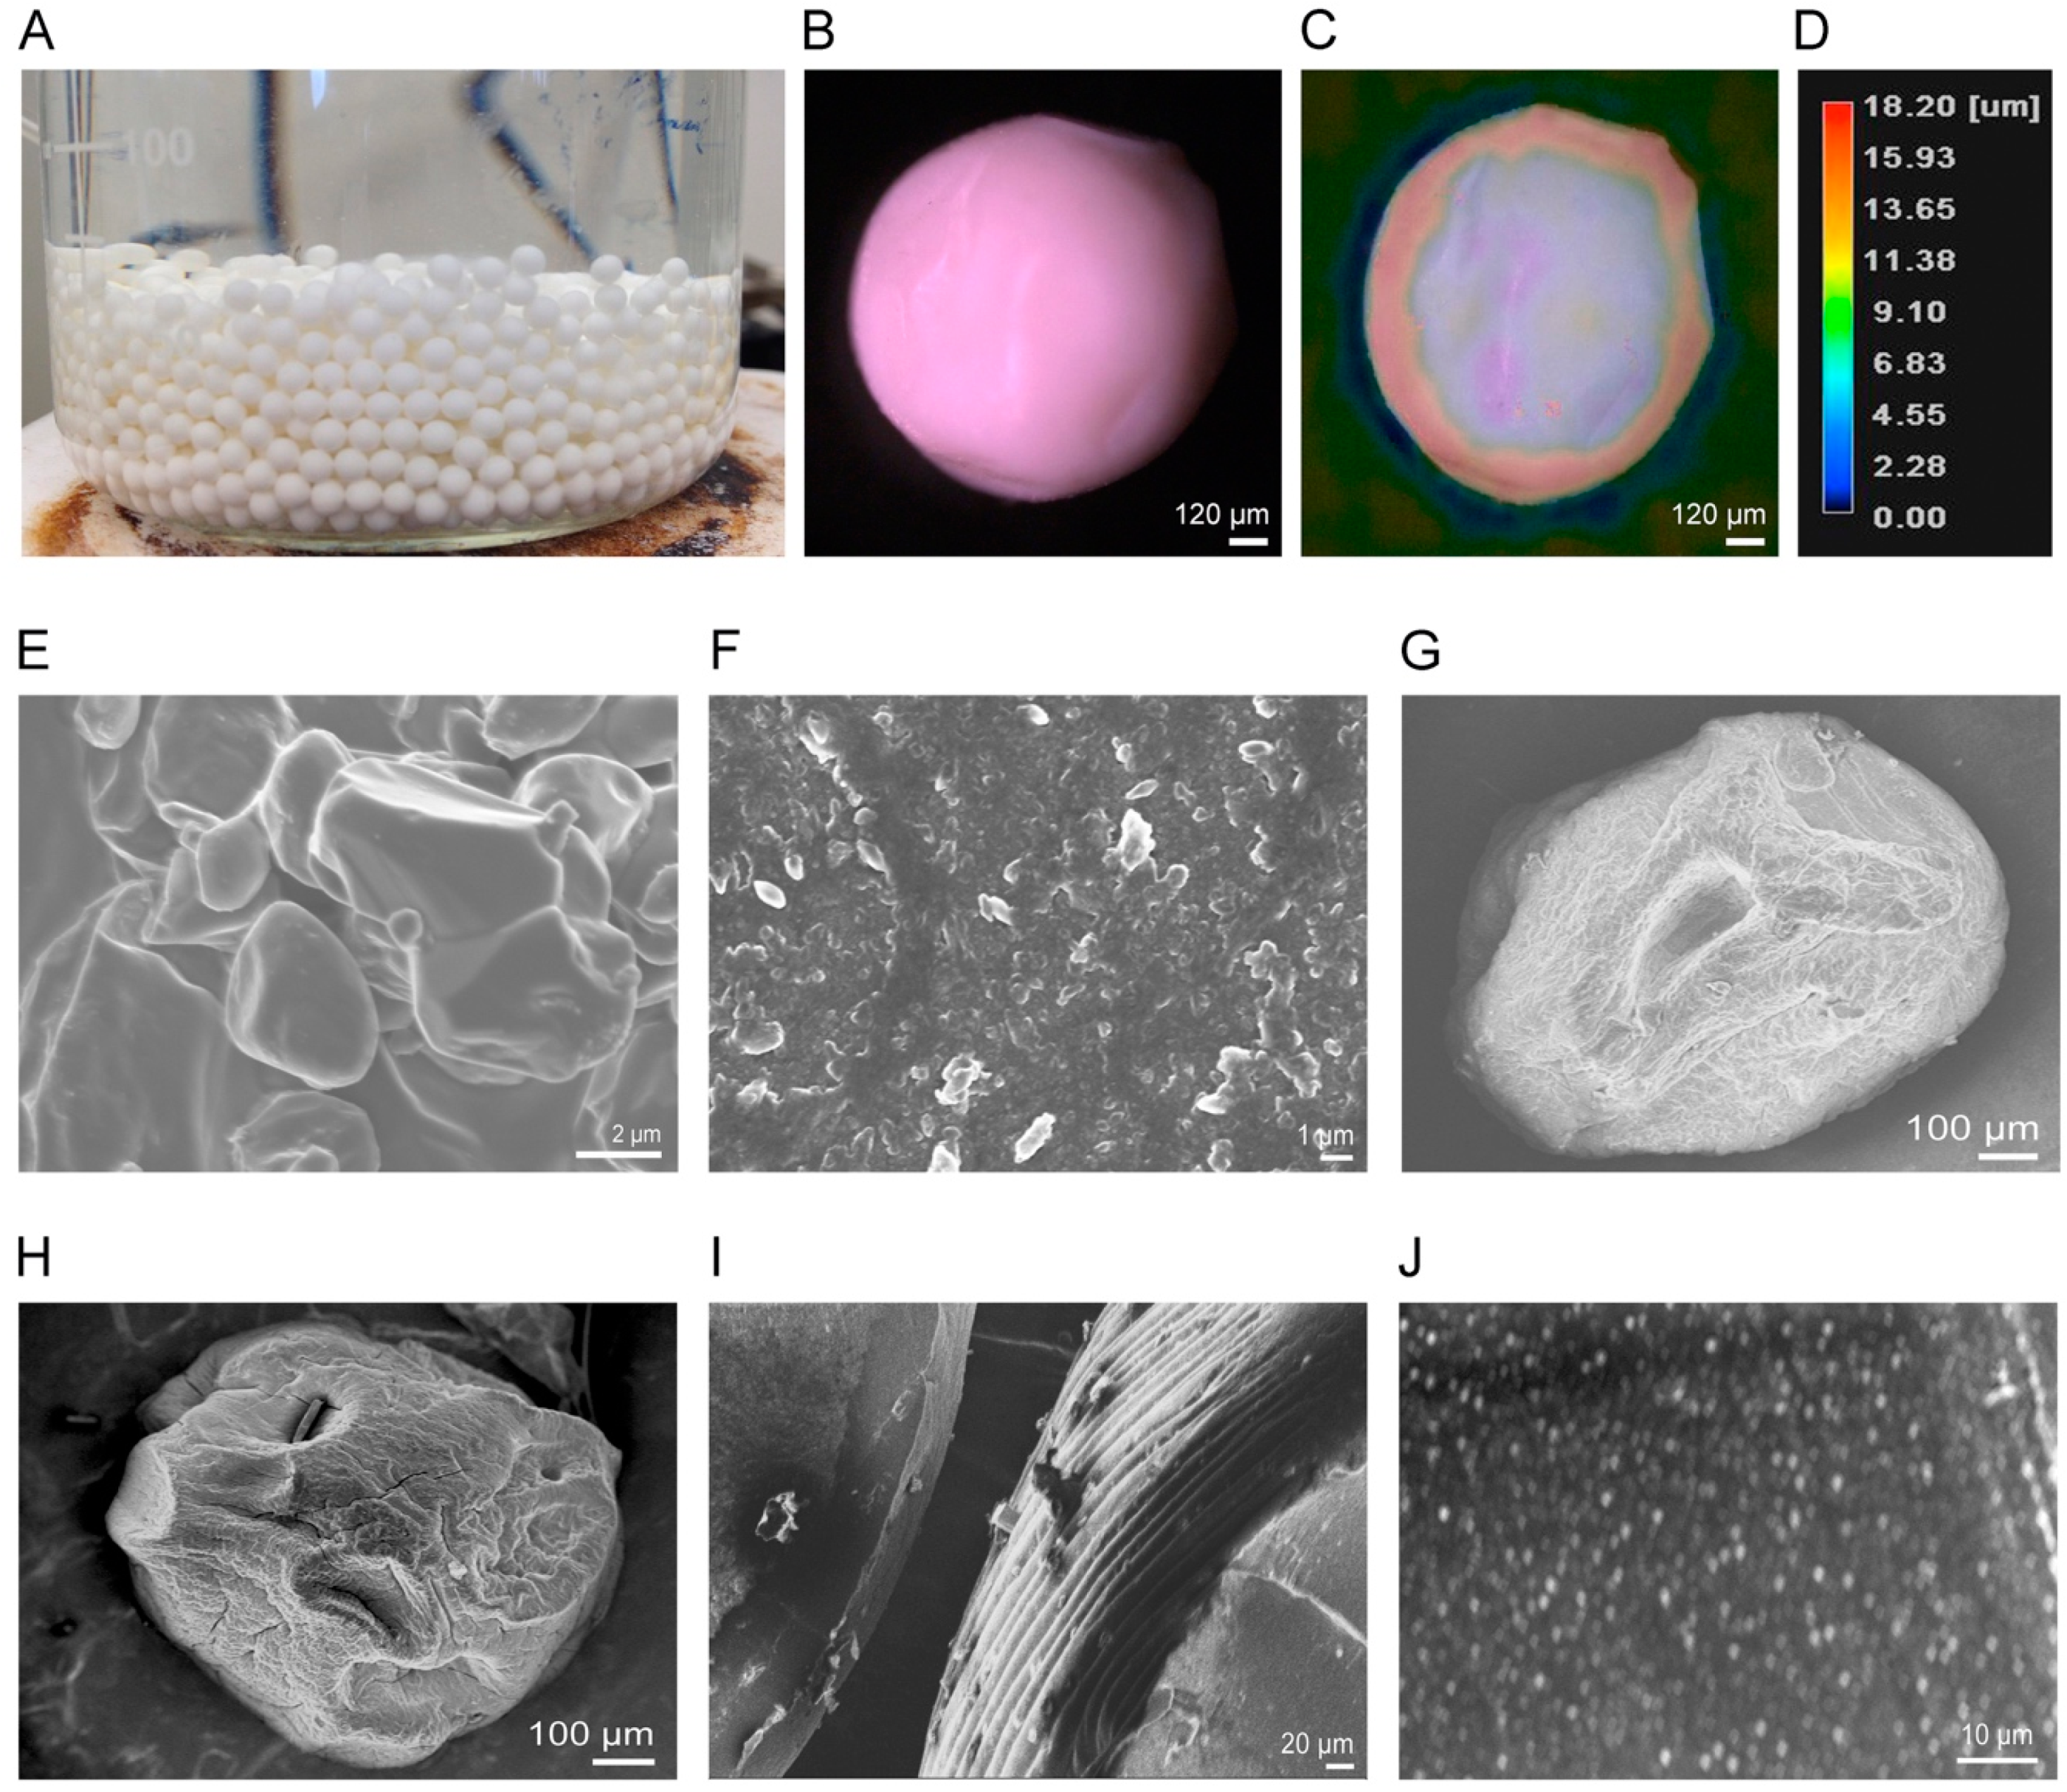
2.8. Morphology Analysis
2.9. UV–Visible Spectroscopy
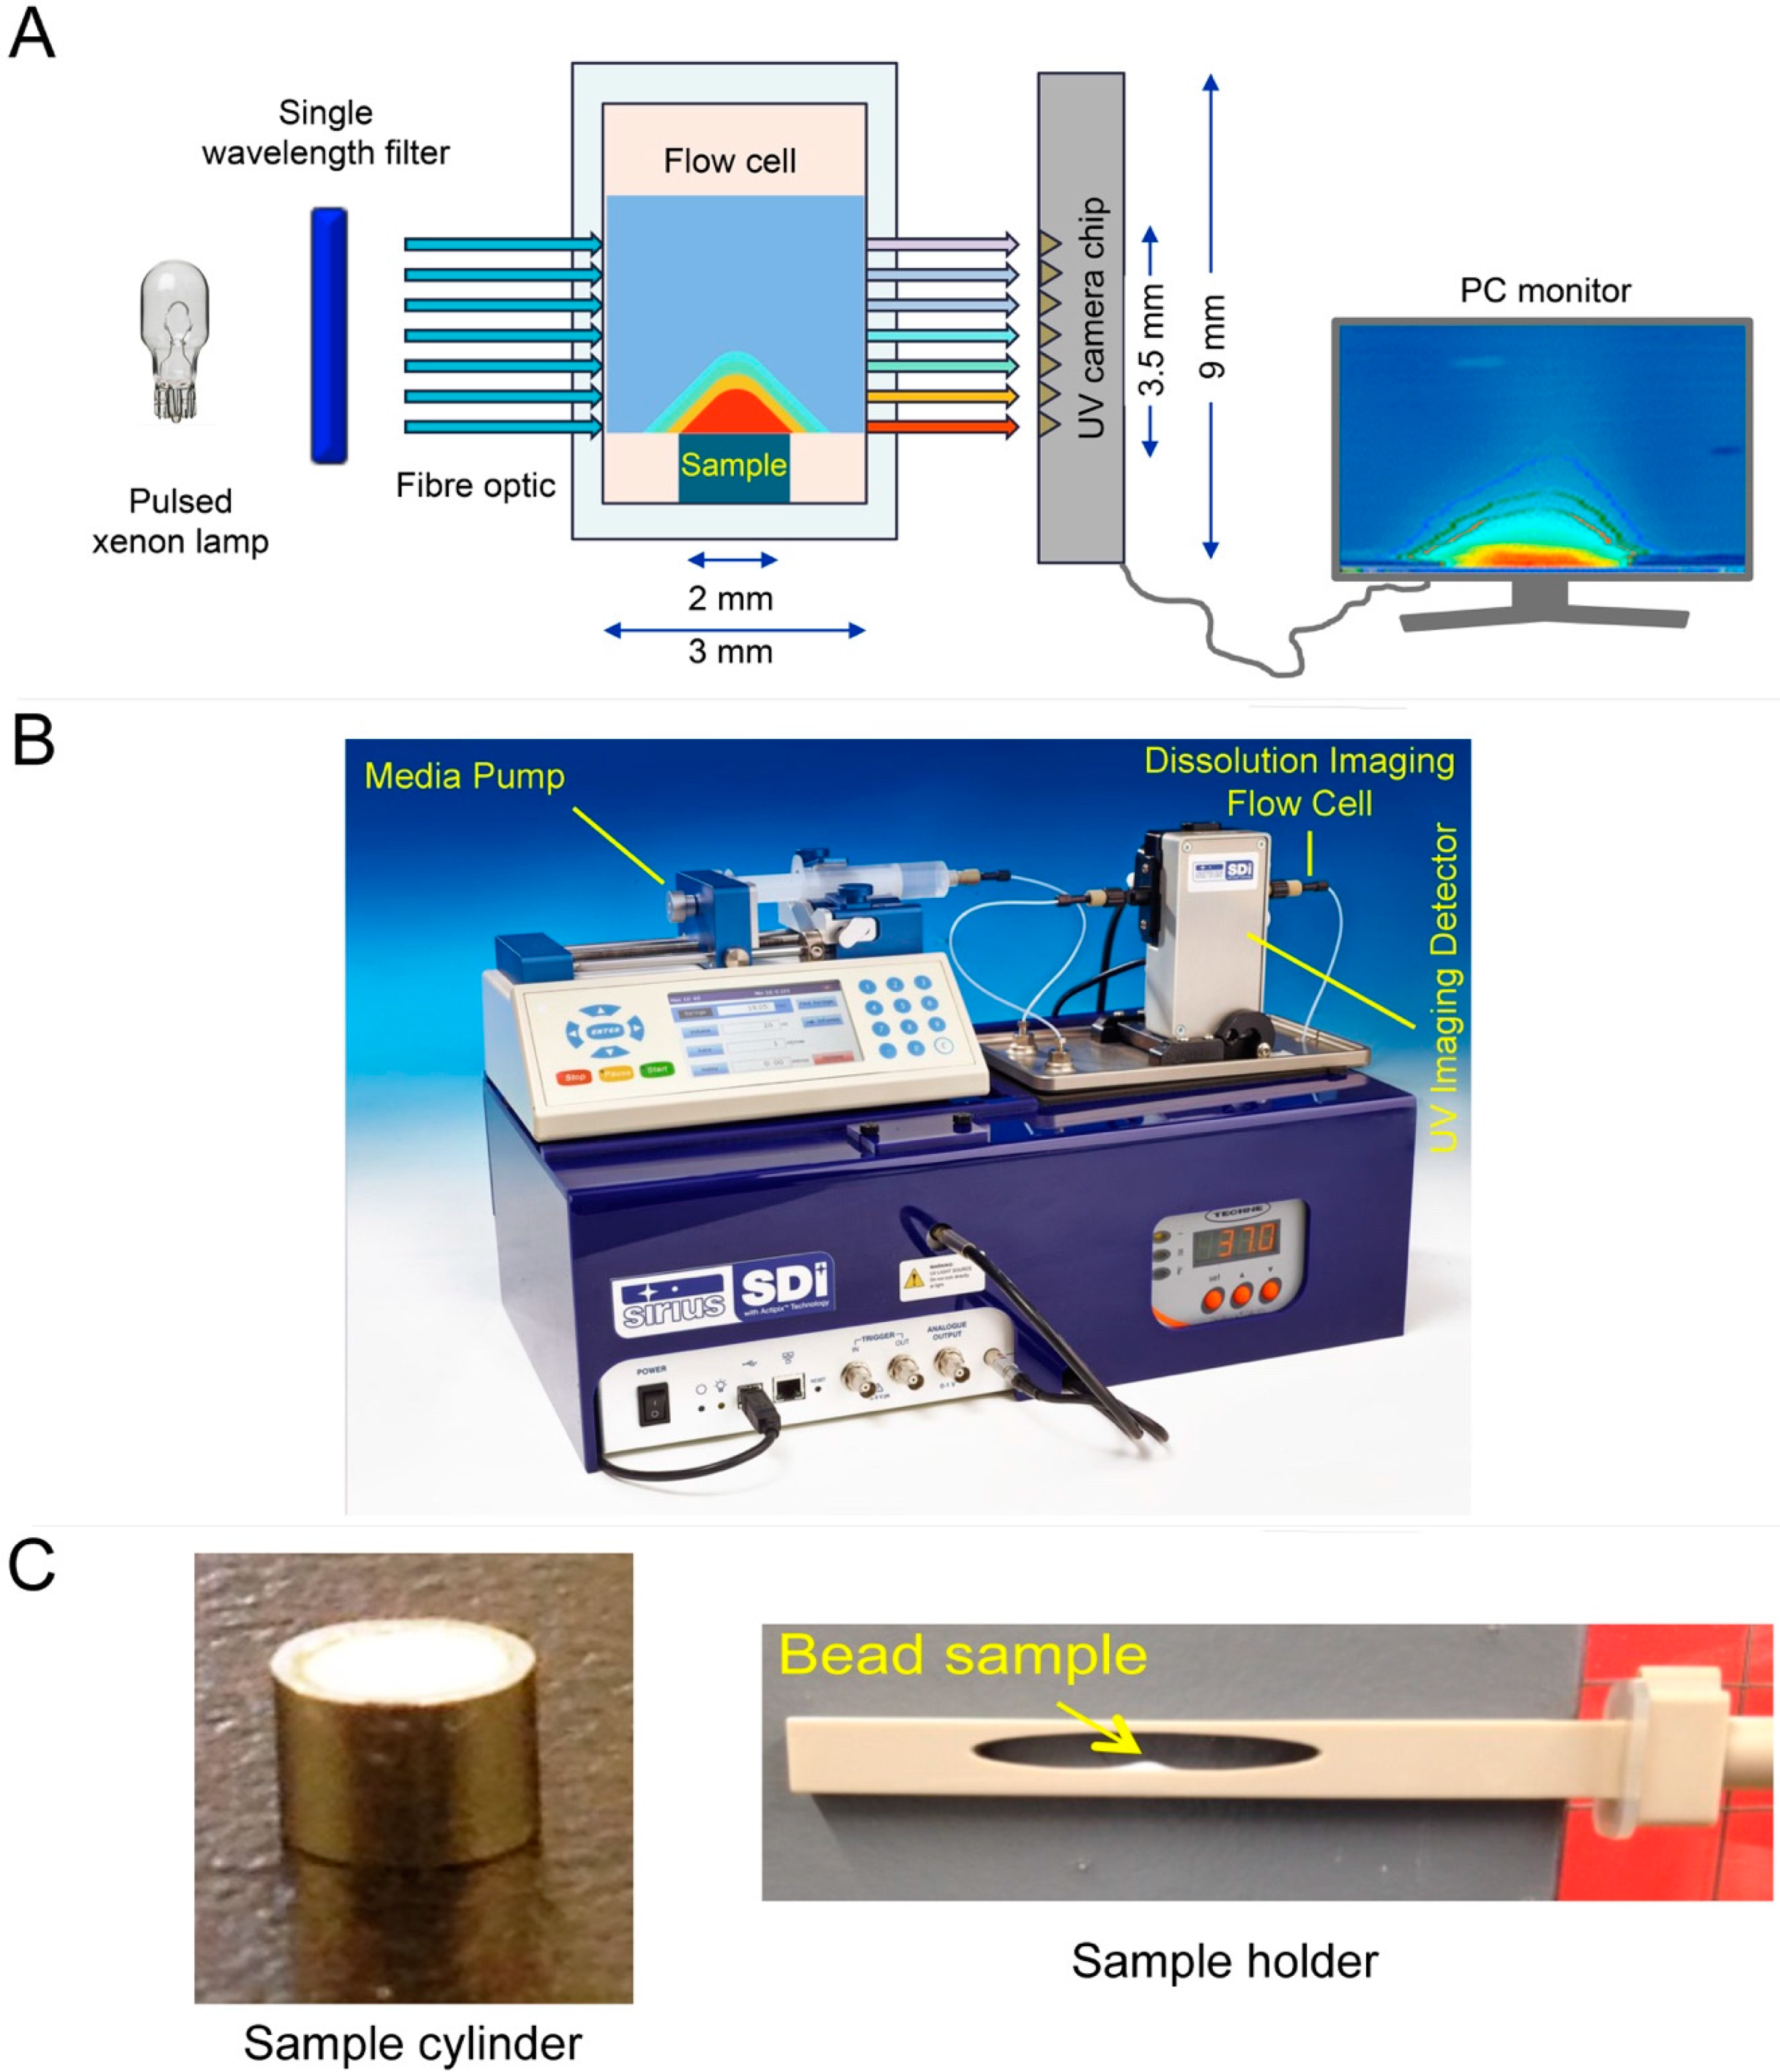
2.10. In Vitro Drug Release Test
3. Results and Discussion
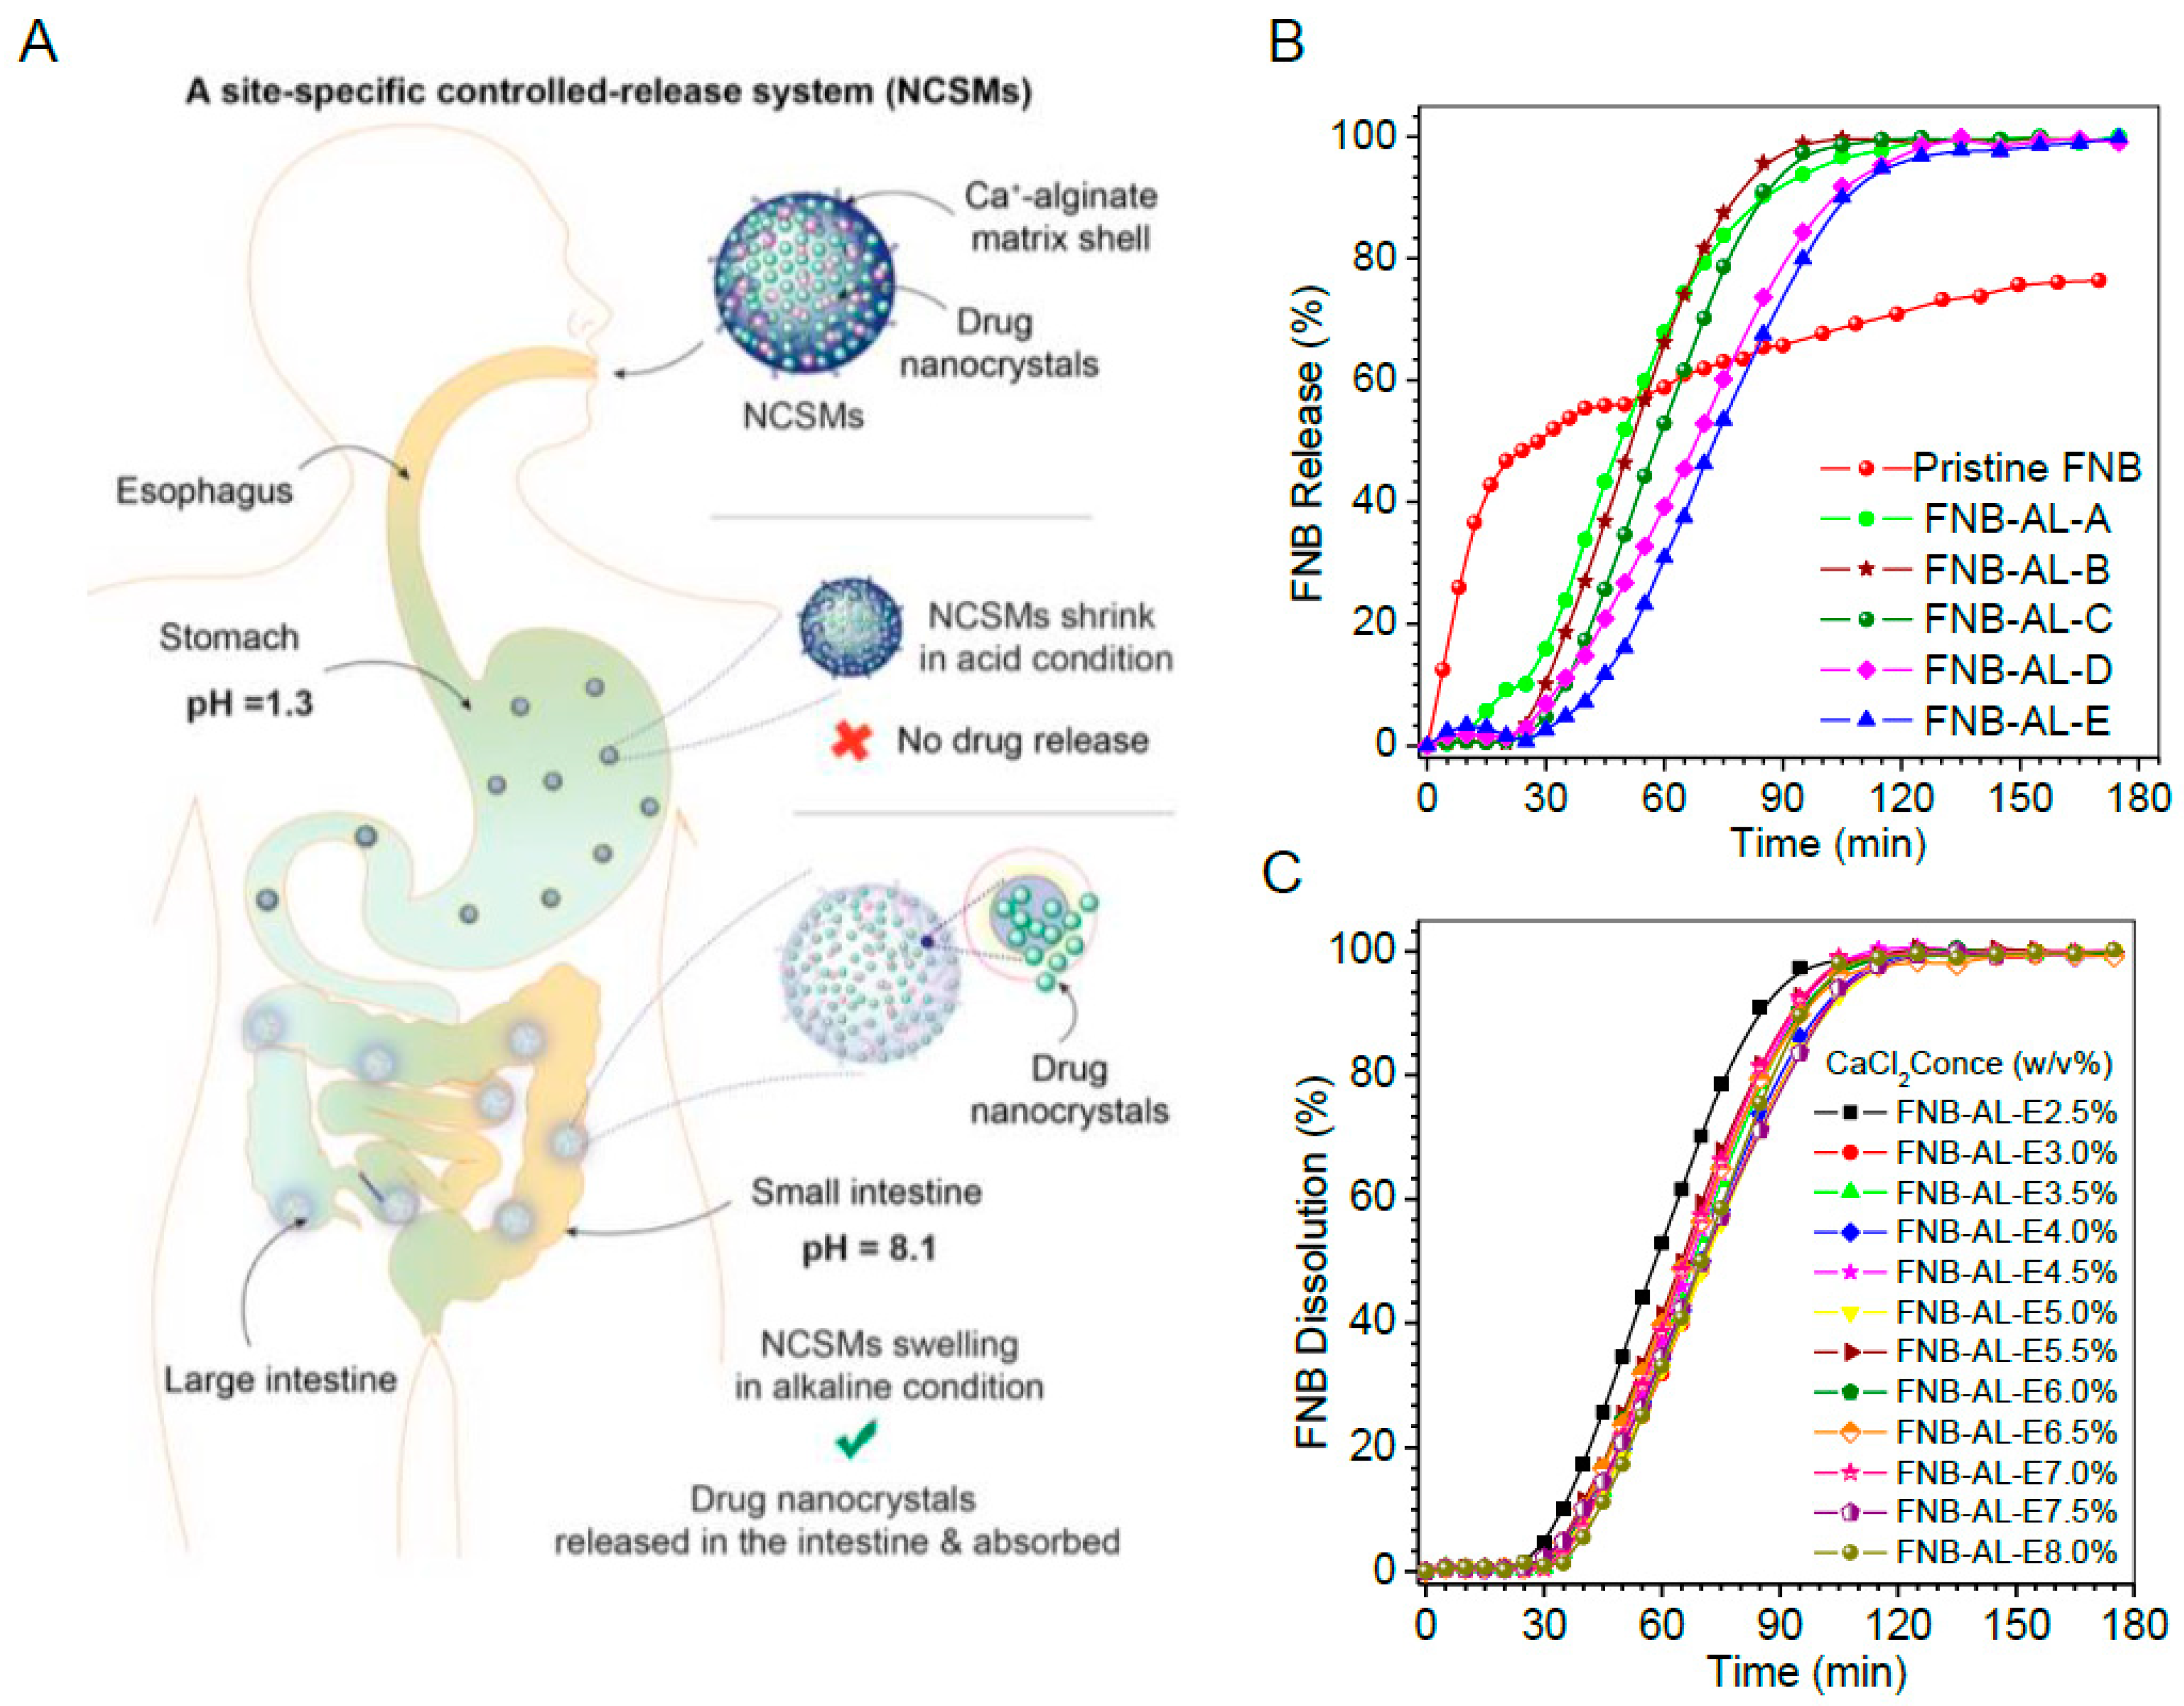
3.1. Preparation of NCSMs
3.2. Solid-State Characterization
3.2.1. X-ray Diffractograms
3.2.2. ATR-FTIR Spectroscopy Analysis
3.2.3. Thermal Analysis
3.3. Morphological Characterization
3.4. In Vitro Release Studies
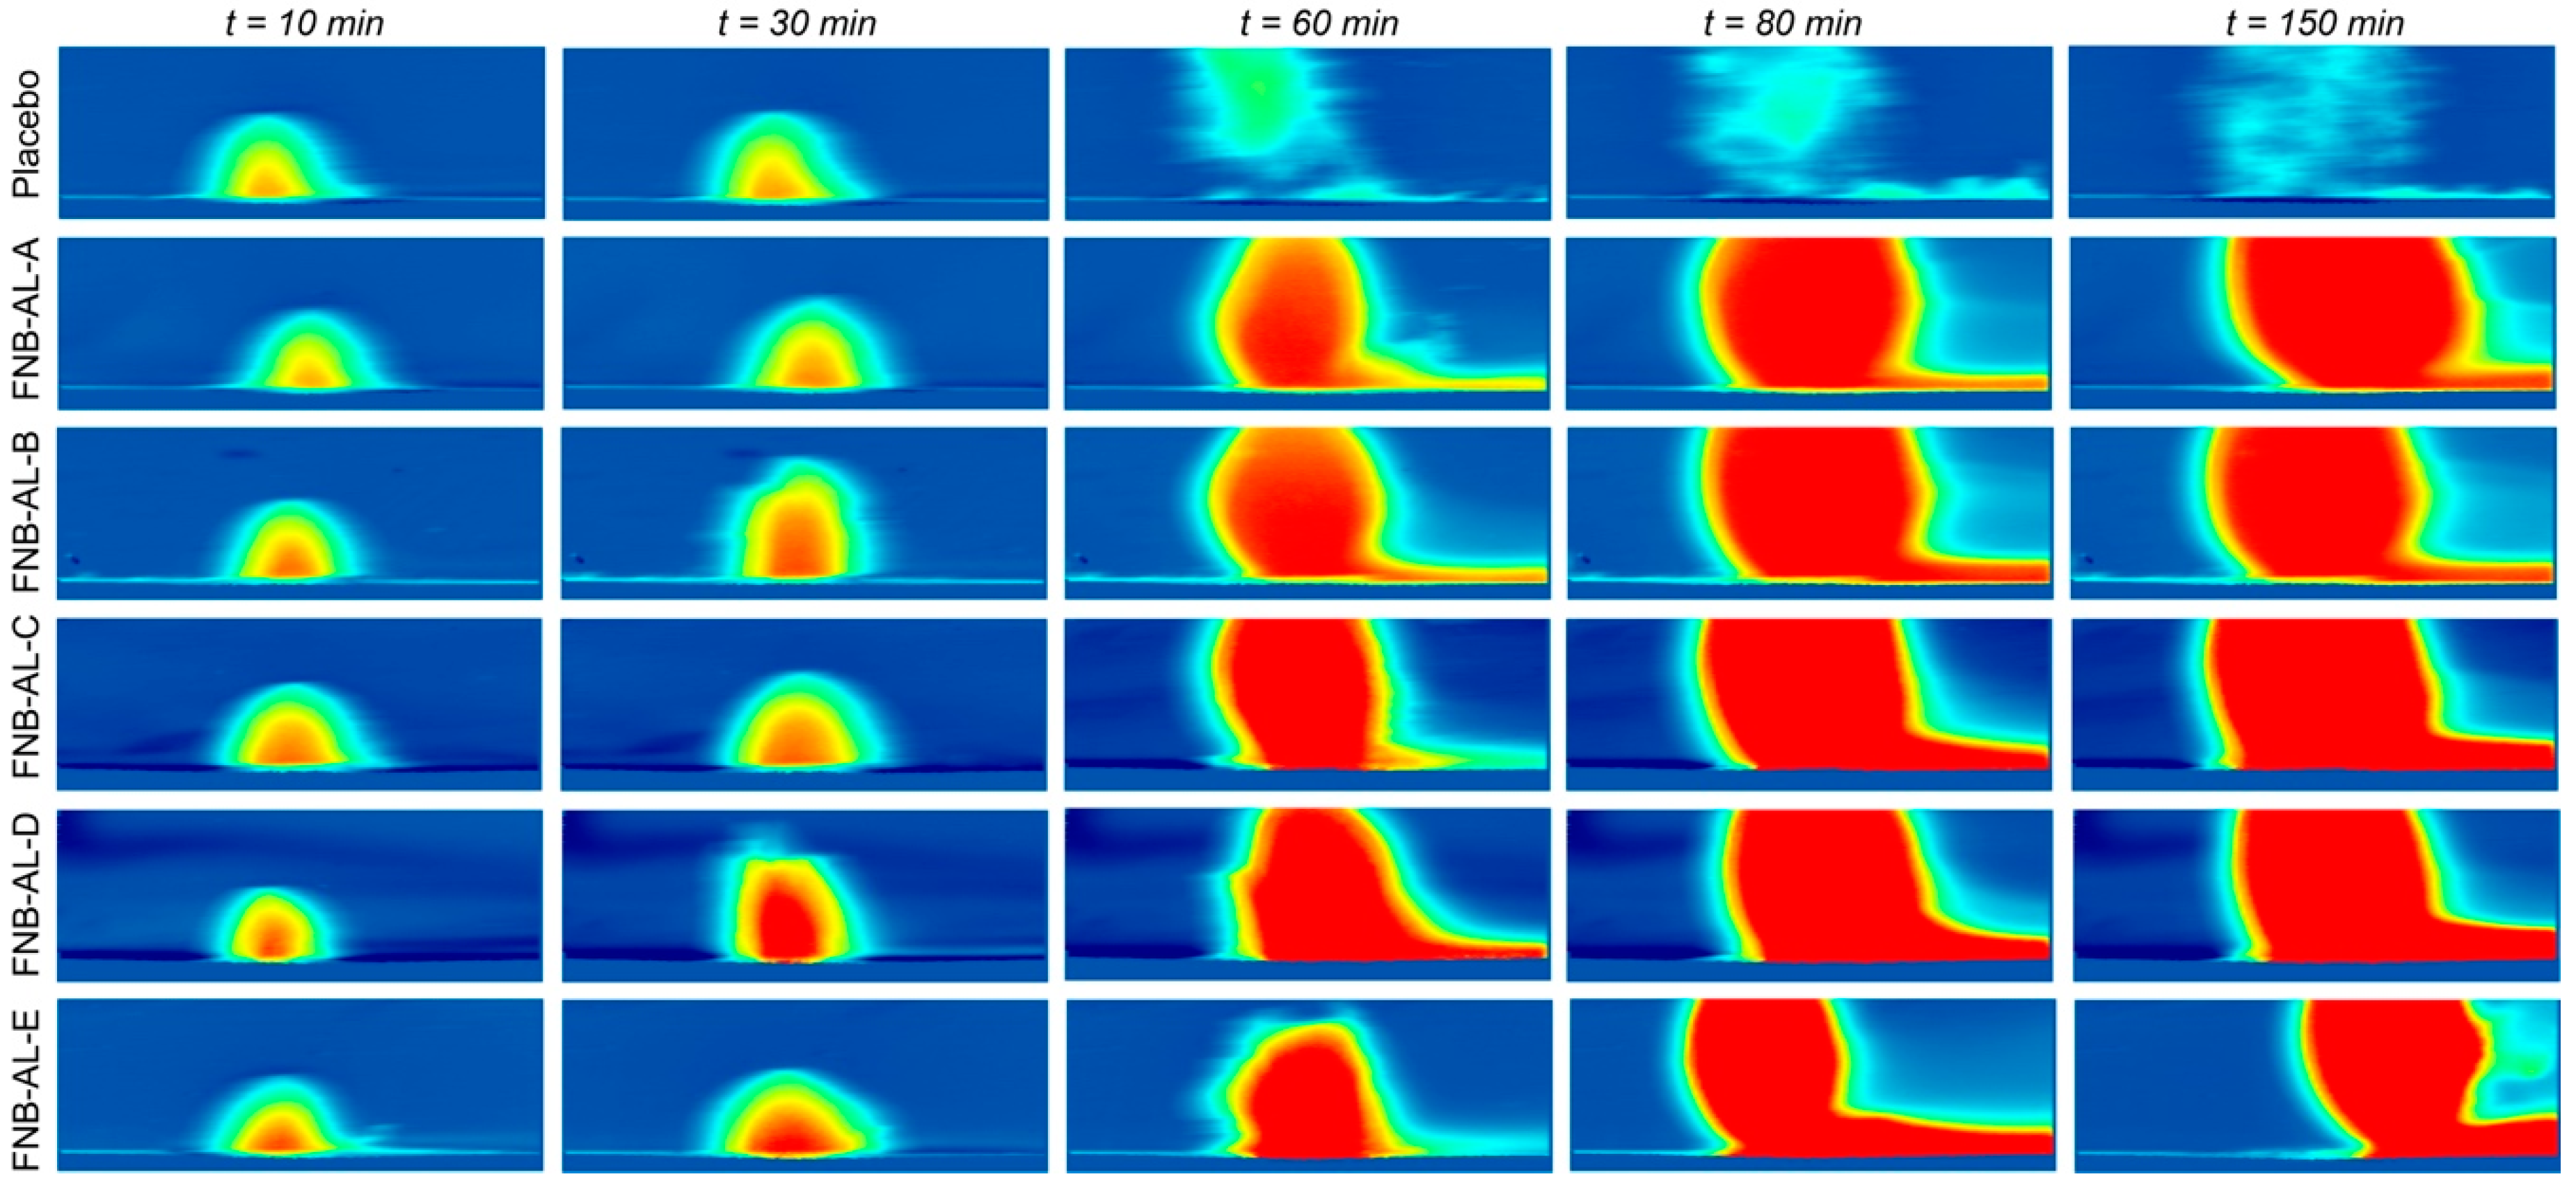
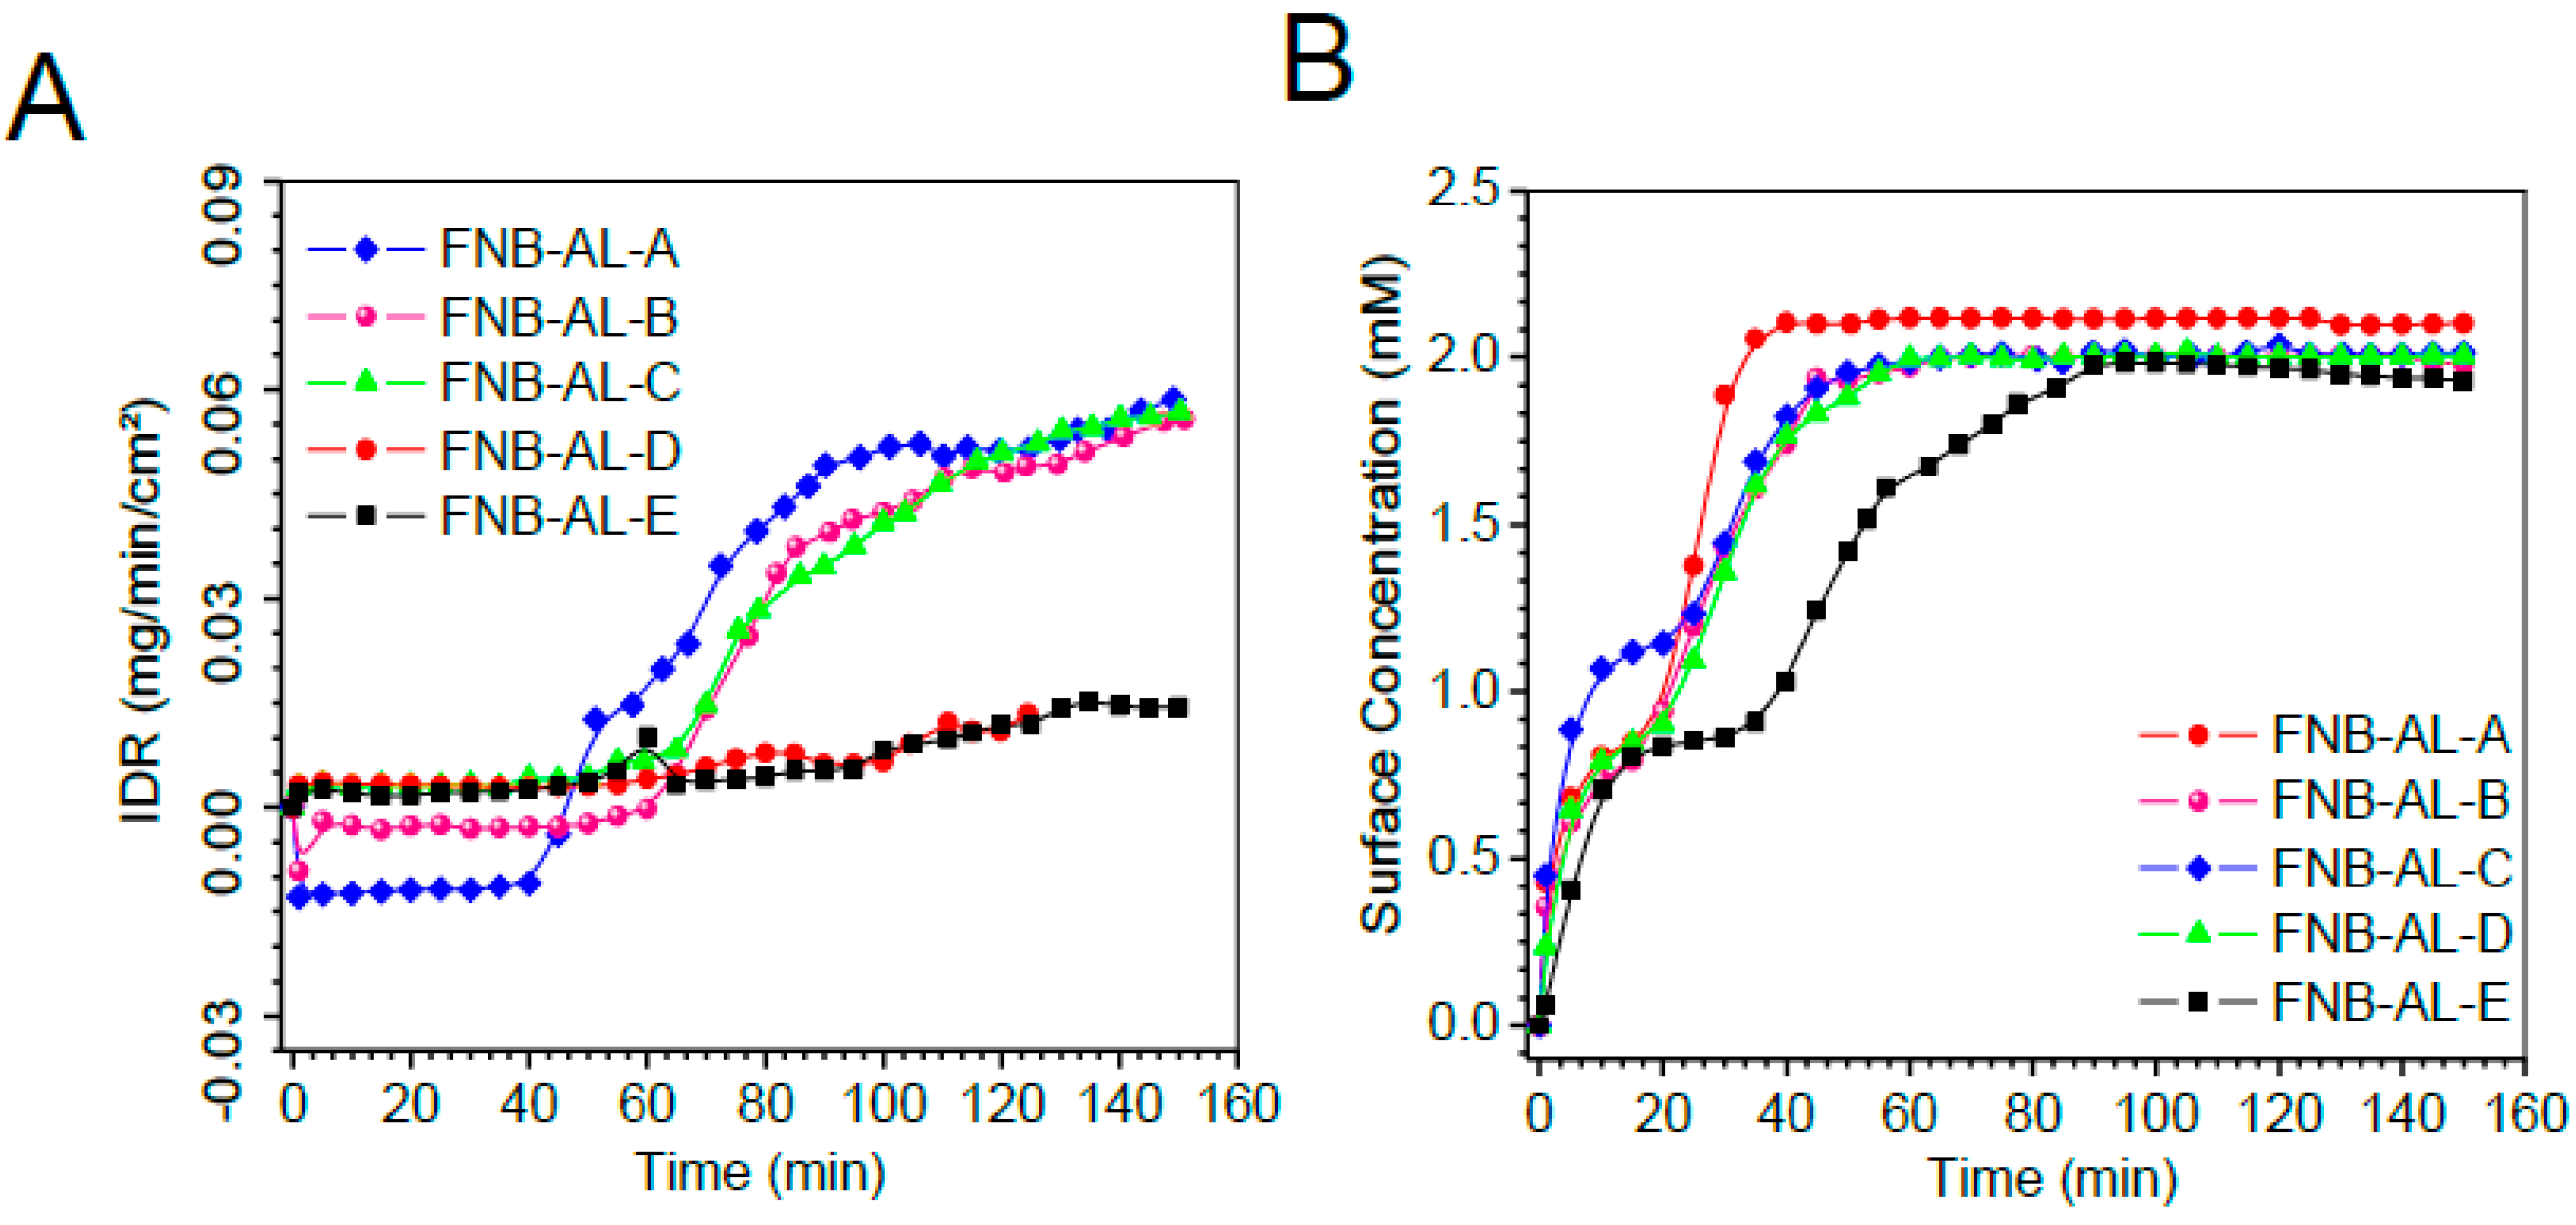
3.5. In Situ Real-Time Drug Dissolution Analysis
4. Conclusions
Supplementary Materials
Author Contributions
Funding
Acknowledgments
Conflicts of Interest
References
- Liu, L.; Fishman, M.L.; Kost, J.; Hicks, K.B. Pectin-based systems for colon-specific drug delivery via oral route. Biomaterials 2003, 24, 3333–3343. [Google Scholar] [CrossRef]
- Cyriac, J.M.; James, E. Switch over from intravenous to oral therapy: A concise overview. J. Pharmacol. Pharmacother. 2014, 5, 83–87. [Google Scholar] [CrossRef] [PubMed] [Green Version]
- Sievens-Figueroa, L.; Bhakay, A.; Jerez-Rozo, J.I.; Pandya, N.; Romañach, R.J.; Michniak-Kohn, B.; Iqbal, Z.; Bilgili, E.; Davé, R.N. Preparation and characterization of hydroxypropyl methyl cellulose films containing stable BCS Class II drug nanoparticles for pharmaceutical applications. Int. J. Pharm. 2012, 423, 496–508. [Google Scholar] [CrossRef] [PubMed]
- Shen, B.-D.; Shen, C.-Y.; Yuan, X.-D.; Bai, J.-X.; Lv, Q.-Y.; Xu, H.; Dai, L.; Yu, C.; Han, J.; Yuan, H.-L. Development and characterization of an orodispersible film containing drug nanoparticles. Eur. J. Pharm. Biopharm. 2013, 85, 1348–1356. [Google Scholar] [CrossRef] [PubMed]
- Ghosh, I.; Bose, S.; Vippagunta, R.; Harmon, F. Nanosuspension for improving the bioavailability of a poorly soluble drug and screening of stabilizing agents to inhibit crystal growth. Int. J. Pharm. 2011, 409, 260–268. [Google Scholar] [CrossRef] [PubMed]
- Afolabi, A.; Akinlabi, O.; Bilgili, E. Impact of process parameters on the breakage kinetics of poorly water-soluble drugs during wet stirred media milling: A microhydrodynamic view. Eur. J. Pharm. Sci. 2014, 51, 75–86. [Google Scholar] [CrossRef] [PubMed]
- Bhakay, A.; Azad, M.; Vizzotti, E.; Dave, R.N.; Bilgili, E. Enhanced recovery and dissolution of griseofulvin nanoparticles from surfactant-free nanocomposite microparticles incorporating wet-milled swellable dispersants. Drug Dev. Ind. Pharm. 2014, 40, 1509–1522. [Google Scholar] [CrossRef]
- Kayaert, P.; Anné, M.; Van den Mooter, G. Bead layering as a process to stabilize nanosuspensions: Influence of drug hydrophobicity on nanocrystal reagglomeration following in-vitro release from sugar beads. J. Pharm. Pharmacol. 2011, 63, 1446–1453. [Google Scholar] [CrossRef]
- Kevadiya, B.D.; Joshi, G.V.; Bajaj, H.C. Layered bionanocomposites as carrier for procainamide. Int. J. Pharm. 2010, 388, 280–286. [Google Scholar] [CrossRef]
- Takano, R.; Furumoto, K.; Shiraki, K.; Takata, N.; Hayashi, Y.; Aso, Y.; Yamashita, S. Rate-Limiting Steps of Oral Absorption for Poorly Water-Soluble Drugs in Dogs; Prediction from a Miniscale Dissolution Test and a Physiologically-Based Computer Simulation. Pharm. Res. 2008, 25, 2334–2344. [Google Scholar] [CrossRef]
- Gao, P.; Shi, Y. Characterization of Supersaturatable Formulations for Improved Absorption of Poorly Soluble Drugs. AAPS J. 2012, 14, 703–713. [Google Scholar] [CrossRef] [PubMed] [Green Version]
- Carlert, S. Investigation and Prediction of Small Intestinal Precipitation of Poorly Soluble Drugs: A Study Involving in silico, in vitro and in vivo Assessment. Ph.D. Thesis, Acta Universitatis Upsaliensis, Uppsala, Sweden, 2012. [Google Scholar]
- Friend, D.R.; Pangburn, S. Site-specific drug delivery. Med. Res. Rev. 1987, 7, 53–106. [Google Scholar] [CrossRef] [PubMed]
- Sangalli, M.E.; Maroni, A.; Zema, L.; Busetti, C.; Giordano, F.; Gazzaniga, A. In vitro and in vivo evaluation of an oral system for time and/or site-specific drug delivery. J. Control. Release 2001, 73, 103–110. [Google Scholar] [CrossRef]
- Tomlinson, E. Theory and practice of site-specific drug delivery. Adv. Drug Deliv. Rev. 1988, 1, 271–272. [Google Scholar] [CrossRef]
- Tziomalos, K.; Athyros, V.G. Fenofibrate: A novel formulation (Triglide™) in the treatment of lipid disorders: A review. Int. J. Nanomed. 2006, 1, 129–147. [Google Scholar] [CrossRef]
- Kevadiya, B.; Barvaliya, M.; Zhang, L.; Anovadiya, A.; Brahmbhatt, H.; Paul, P.; Tripathi, C. Fenofibrate Nanocrystals Embedded in Oral Strip-Films for Bioavailability Enhancement. Bioengineering 2018, 5, 16. [Google Scholar] [CrossRef]
- Chen, Y.; Lu, Y.; Chen, J.; Lai, J.; Sun, J.; Hu, F.; Wu, W. Enhanced bioavailability of the poorly water-soluble drug fenofibrate by using liposomes containing a bile salt. Int. J. Pharm. 2009, 376, 153–160. [Google Scholar] [CrossRef] [PubMed]
- Kevadiya, B.D.; Joshi, G.V.; Patel, H.A.; Ingole, P.G.; Mody, H.M.; Bajaj, H.C. Montmorillonite-Alginate Nanocomposites as a Drug Delivery System: Intercalation and In Vitro Release of Vitamin B1 and Vitamin B6. J. Biomater. Appl. 2010, 25, 161–177. [Google Scholar] [CrossRef]
- Bhakay, A.; Rahman, M.; Dave, R.N.; Bilgili, E. Bioavailability Enhancement of Poorly Water-Soluble Drugs via Nanocomposites: Formulation(-)Processing Aspects and Challenges. Pharmaceutics 2018, 10, 86. [Google Scholar] [CrossRef]
- Azad, M.; Moreno, J.; Bilgili, E.; Dave, R. Fast dissolution of poorly water-soluble drugs from fluidized bed coated nanocomposites: Impact of carrier size. Int. J. Pharm. 2016, 513, 319–331. [Google Scholar] [CrossRef]
- Krull, S.M.; Ammirata, J.; Bawa, S.; Li, M.; Bilgili, E.; Dave, R.N. Critical Material Attributes of Strip Films Loaded With Poorly Water-Soluble Drug Nanoparticles: II. Impact of Polymer Molecular Weight. J. Pharm. Sci. 2017, 106, 619–628. [Google Scholar] [CrossRef] [PubMed]
- Krull, S.M.; Moreno, J.; Li, M.; Bilgili, E.; Dave, R.N. Critical material attributes (CMAs) of strip films loaded with poorly water-soluble drug nanoparticles: III. Impact of drug nanoparticle loading. Int. J. Pharm. 2017, 523, 33–41. [Google Scholar] [CrossRef] [PubMed] [Green Version]
- Krull, S.M.; Patel, H.V.; Li, M.; Bilgili, E.; Dave, R.N. Critical material attributes (CMAs) of strip films loaded with poorly water-soluble drug nanoparticles: I. Impact of plasticizer on film properties and dissolution. Eur. J. Pharm. Sci. 2016, 92, 146–155. [Google Scholar] [CrossRef] [PubMed] [Green Version]
- Kevadiya, B.D.; Patel, T.A.; Jhala, D.D.; Thumbar, R.P.; Brahmbhatt, H.; Pandya, M.P.; Rajkumar, S.; Jena, P.K.; Joshi, G.V.; Gadhia, P.K.; et al. Layered inorganic nanocomposites: A promising carrier for 5-fluorouracil (5-FU). Eur. J. Pharm. Biopharm. 2012, 81, 91–101. [Google Scholar] [CrossRef] [PubMed]
- Sriamornsak, P.; Thirawong, N.; Puttipipatkhachorn, S. Emulsion gel beads of calcium pectinate capable of floating on the gastric fluid: Effect of some additives, hardening agent or coating on release behavior of metronidazole. Eur. J. Pharm. Sci. 2005, 24, 363–373. [Google Scholar] [CrossRef] [PubMed]
- Augst, A.D.; Kong, H.J.; Mooney, D.J. Alginate hydrogels as biomaterials. Macromol. Biosci. 2006, 6, 623–633. [Google Scholar] [CrossRef] [PubMed]
- Lee, K.Y.; Mooney, D.J. Alginate: Properties and biomedical applications. Prog. Polym. Sci. 2012, 37, 106–126. [Google Scholar] [CrossRef] [PubMed] [Green Version]
- Shanmuga Priya, D.; Suriyaprabha, R.; Yuvakkumar, R.; Rajendran, V. Chitosan-incorporated different nanocomposite HPMC films for food preservation. J. Nanopart. Res. 2014, 16, 2248. [Google Scholar] [CrossRef]
- Möller, H.; Grelier, S.; Pardon, P.; Coma, V. Antimicrobial and Physicochemical Properties of Chitosan−HPMC-Based Films. J. Agric. Food Chem. 2004, 52, 6585–6591. [Google Scholar] [CrossRef]
- Somashekarappa, H.; Prakash, Y.; Hemalatha, K.; Demappa, T.; Somashekar, R. Preparation and Characterization of HPMC/PVP Blend Films Plasticized with Sorbitol. Indian J. Mater. Sci. 2013, 7. [Google Scholar] [CrossRef]
- Sahoo, S.; Chakraborti, C.K.; Behera, P.K. Spectroscopic investigations of a Ciprofloxacin/HPMC mucoadhesive suspension. Int. J. Appl. Pharm. 2012, 4, 1–8. [Google Scholar]
- Viana, R.B.; da Silva, A.B.F.; Pimentel, A.S. Infrared Spectroscopy of Anionic, Cationic, and Zwitterionic Surfactants. Adv. Phys. Chem. 2012, 14. [Google Scholar] [CrossRef]
- Siva kothapally, P.K.B.; Harish, G. Formulation and evaluation of fenofibrate tablets prepared by employing bioavailability enhancement technique. Indian J. Res. Pharm. Biotechnol. 2013, 1, 602–608. [Google Scholar]
- Bhise, S. Effect of Hydroxypropyl β-Cyclodextrin Inclusion Complexation on Solubility of Fenofibrate. Int. J. Res. Pharm. Biomed. Sci. 2011, 2, 596–604. [Google Scholar]
- Sammalkorpi, M.; Karttunen, M.; Haataja, M. Ionic Surfactant Aggregates in Saline Solutions: Sodium Dodecyl Sulfate (SDS) in the Presence of Excess Sodium Chloride (NaCl) or Calcium Chloride (CaCl2). J. Phys. Chem. B 2009, 113, 5863–5870. [Google Scholar] [CrossRef] [PubMed]


| Formulation Code | AL:NC Ratio (w/w) | Drug Loading (wt %) | NCSM Size (µm) ± SD * | Moisture Content (%) |
|---|---|---|---|---|
| FNB Pristine | -- | 100 | 12 ± 5 | - |
| FNB-NCs | 100 | 90.30 | 0.28 ± 0.2 | - |
| AL Placebo | -- | -- | 760 ± 50.0 | - |
| FNB-AL-A | 1:2.70 | 51.34 | 900 ± 80.0 | 2.6 |
| FNB-AL-B | 1:6.77 | 75.97 | 1100 ± 130 | 1.8 |
| FNB-AL-C | 1:10.15 | 79.07 | 1200 ± 140 | 1.2 |
| FNB-AL-D | 1:13.55 | 83.94 | 1200 ± 110 | 1.7 |
| FNB-AL-E | 1:16.93 | 89.32 | 1200 ± 250 | 2.1 |
© 2019 by the authors. Licensee MDPI, Basel, Switzerland. This article is an open access article distributed under the terms and conditions of the Creative Commons Attribution (CC BY) license (http://creativecommons.org/licenses/by/4.0/).
Share and Cite
Kevadiya, B.D.; Chen, L.; Zhang, L.; Thomas, M.B.; Davé, R.N. Fenofibrate Nanocrystal Composite Microparticles for Intestine-Specific Oral Drug Delivery System. Pharmaceuticals 2019, 12, 109. https://0-doi-org.brum.beds.ac.uk/10.3390/ph12030109
Kevadiya BD, Chen L, Zhang L, Thomas MB, Davé RN. Fenofibrate Nanocrystal Composite Microparticles for Intestine-Specific Oral Drug Delivery System. Pharmaceuticals. 2019; 12(3):109. https://0-doi-org.brum.beds.ac.uk/10.3390/ph12030109
Chicago/Turabian StyleKevadiya, Bhavesh D., Liang Chen, Lu Zhang, Midhun B. Thomas, and Rajesh N. Davé. 2019. "Fenofibrate Nanocrystal Composite Microparticles for Intestine-Specific Oral Drug Delivery System" Pharmaceuticals 12, no. 3: 109. https://0-doi-org.brum.beds.ac.uk/10.3390/ph12030109