Unraveling Hepcidin Plasma Protein Binding: Evidence from Peritoneal Equilibration Testing

 , , ,
, , ,
Abstract
:1. Introduction
2. Results
3. Discussion
4. Materials and Methods
4.1. Sample Collection
4.2. Laboratory Measurements
4.3. Ethics
4.4. Calculations and Statistical Analysis
Author Contributions
Funding
Acknowledgments
Conflicts of Interest
Appendix A
Laboratory Chemistry Measurements
Measurement of Hepcidin in Serum and Peritoneal Dialysate
Measurement of Total Cortisol and Total Testosterone in Serum
Measurement of Free Cortisol in Serum by Equilibrium Dialysis—Liquid Chromatography Tandem Mass Spectrometry (LC-MS/MS)
Measurement of Total Cortisol and Total Testosterone in Peritoneal Dialysate
References
- Girelli, D.; Nemeth, E.; Swinkels, D.W. Hepcidin in the diagnosis of iron disorders. Blood 2016, 127, 2809–2813. [Google Scholar] [CrossRef] [PubMed]
- Ekins, R. Measurement of free hormones in blood. Endocr. Rev. 1990, 11, 5–46. [Google Scholar] [CrossRef] [PubMed]
- Ekins, R. The free hormone hypothesis and measurement of free hormones. Clin. Chem. 1992, 38, 1289–1293. [Google Scholar]
- Mendel, C.M. The free hormone hypothesis: A physiologically based mathematical model. Endocr. Rev. 1989, 10, 232–274. [Google Scholar] [CrossRef] [PubMed]
- Faix, J.D. Principles and pitfalls of free hormone measurements. Best Pract. Res. Clin. Endocrinol. Metab. 2013, 27, 631–645. [Google Scholar] [CrossRef] [PubMed]
- Bae, Y.J.; Kratzsch, J. Corticosteroid-binding globulin: Modulating mechanisms of bioavailability of cortisol and its clinical implications. Best Pract. Res. Clin. Endocrinol. Metab. 2015, 29, 761–772. [Google Scholar] [CrossRef]
- Thienpont, L.M.; Van Uytfanghe, K.; Poppe, K.; Velkeniers, B. Determination of free thyroid hormones. Best Pract. Res. Clin. Endocrinol. Metab. 2013, 27, 689–700. [Google Scholar] [CrossRef]
- Morley, J.E.; Patrick, P.; Perry, H.M. Evaluation of assays available to measure free testosterone. Metabolism 2002, 51, 554–559. [Google Scholar] [CrossRef]
- Shea, J.; Wong, P.; Chen, Y. Free Testosterone: Clinical Utility and Important Analytical Aspects of Measurement. Adv. Clin. Chem. 2014, 63, 59–84. [Google Scholar]
- Peslova, G.; Petrak, J.; Kuzelova, K.; Hrdy, I.; Halada, P.; Kuchel, P.W.; Soe-Lin, S.; Ponka, P.; Sutak, R.; Becker, E.; et al. Hepcidin, the hormone of iron metabolism, is bound specifically to alpha-2-macroglobulin in blood. Blood 2009, 113, 6225–6236. [Google Scholar] [CrossRef]
- Huang, M.L.; Austin, C.J.; Sari, M.A.; Rahmanto, Y.S.; Ponka, P.; Vyoral, D.; Richardson, D.R. Hepcidin bound to alpha2-macroglobulin reduces ferroportin-1 expression and enhances its activity at reducing serum iron levels. J. Biol. Chem. 2013, 288, 25450–25465. [Google Scholar] [CrossRef] [PubMed]
- Itkonen, O.; Stenman, U.H.; Parkkinen, J.; Soliymani, R.; Baumann, M.; Hamalainen, E. Binding of hepcidin to plasma proteins. Clin. Chem. 2012, 58, 1158–1160. [Google Scholar] [CrossRef] [PubMed]
- Diepeveen, L.E.; Laarakkers, C.M.M.; Martos, G.; Pawlak, M.E.; Uguz, F.F.; Verberne, K.; van Swelm, R.P.L.; Klaver, S.; de Haan, A.F.J.; Pitts, K.R.; et al. Provisional standardization of hepcidin assays: Creating a traceability chain with a primary reference material, candidate reference method and a commutable secondary reference material. Clin. Chem. Lab. Med. 2019, 57, 864–872. [Google Scholar] [CrossRef] [PubMed]
- Crielaard, B.J.; Lammers, T.; Rivella, S. Targeting iron metabolism in drug discovery and delivery. Nat. Rev. Drug Discov. 2017, 16, 400–423. [Google Scholar] [CrossRef] [PubMed] [Green Version]
- Bowers, W.F.; Fulton, S.; Thompson, J. Ultrafiltration vs. equilibrium dialysis for determination of free fraction. Clin. Pharmacokinet. 1984, 9 (Suppl. 1), 49–60. [Google Scholar] [CrossRef] [PubMed]
- Khanna, R. Solute and Water Transport in Peritoneal Dialysis: A Case-Based Primer. Am. J. Kidney Dis. 2017, 69, 461–472. [Google Scholar] [CrossRef] [PubMed]
- Twardowski, Z.J.; Nolph, K.D.; Khanna, R.; Prowant, B.F.; Ryan, L.P.; Moore, H.L.; Nielsen, M.P. Peritoneal equilibration test. Perit. Dial. Bull. 1987, 7, 138–147. [Google Scholar]
- Ho-dac-Pannekeet, M.M.; Schouten, N.; Langendijk, M.J.; Hiralall, J.K.; de Waart, D.R.; Struijk, D.G.; Krediet, R.T. Peritoneal transport characteristics with glucose polymer based dialysate. Kidney Int. 1996, 50, 979–986. [Google Scholar] [CrossRef] [PubMed] [Green Version]
- Trivedi, H.; Khanna, R.; Lo, W.K.; Prowant, B.F.; Nolph, K.D. Reproducibility of the peritoneal equilibration test in CAPD patients. ASAIO J. 1994, 40, M892-5. [Google Scholar] [CrossRef]
- Krediet, R.T.; Boeschoten, E.W.; Struijk, D.G.; Arisz, L. Differences in the peritoneal transport of water, solutes and proteins between dialysis with two- and with three-litre exchanges. Nephrol. Dial. Transplant. 1988, 3, 198–204. [Google Scholar]
- Teitelbaum, I.; Burkart, J. Peritoneal dialysis. Am. J. Kidney Dis. 2003, 42, 1082–1096. [Google Scholar] [CrossRef] [PubMed]
- Kagan, A.; Bar-Khayim, Y.; Schafer, Z.; Fainaru, M. Kinetics of peritoneal protein loss during CAPD: I. Different characteristics for low and high molecular weight proteins. Kidney Int. 1990, 37, 971–979. [Google Scholar] [CrossRef] [PubMed] [Green Version]
- Kabanda, A.; Goffin, E.; Bernard, A.; Lauwerys, R.; van Ypersele de Strihou, C. Factors influencing serum levels and peritoneal clearances of low molecular weight proteins in continuous ambulatory peritoneal dialysis. Kidney Int. 1995, 48, 1946–1952. [Google Scholar] [CrossRef] [PubMed] [Green Version]
- Struijk, D.G. Monitoring of the peritoneal membrane. NDT Plus 2008, 1, 29–35. [Google Scholar] [CrossRef] [PubMed]
- Bammens, B.; Evenepoel, P.; Verbeke, K.; Vanrenterghem, Y. Removal of middle molecules and protein-bound solutes by peritoneal dialysis and relation with uremic symptoms. Kidney Int. 2003, 64, 2238–2243. [Google Scholar] [CrossRef] [PubMed]
- Bhasin, S.; Cunningham, G.R.; Hayes, F.J.; Matsumoto, A.M.; Snyder, P.J.; Swerdloff, R.S.; Montori, V.M. Testosterone therapy in men with androgen deficiency syndromes: An Endocrine Society clinical practice guideline. J. Clin. Endocrinol. Metab. 2010, 95, 2536–2559. [Google Scholar] [CrossRef] [PubMed]
- Frantz, A.G.; Rabkin, M.T. Human Growth Hormone. N. Engl. J. Med. 1964, 271, 1375–1381. [Google Scholar] [CrossRef]
- Hua, Q. Insulin: A small protein with a long journey. Protein Cell 2010, 1, 537–551. [Google Scholar] [CrossRef]
- Clerico, A.; Del Ry, S.; Giannessi, D. Measurement of cardiac natriuretic hormones (atrial natriuretic peptide, brain natriuretic peptide, and related peptides) in clinical practice: The need for a new generation of immunoassay methods. Clin. Chem. 2000, 46, 1529–1534. [Google Scholar]
- Malandrino, N.; Smith, R.J. Synthesis, secretion, and transport of peptide hormones. In Principles of Endocrinology and Hormone Action; Belfiroe, A., LeRoith, D., Eds.; Springer International Publishing: New York, NY, USA, 2018; Volume 1, pp. 29–42. [Google Scholar]
- Kronenberg, H. Williams Textbook of Endocrinology, 13th ed.; Elsevier: Amsterdam, The Netherlands, 2016; Chapter 1; pp. 1–11. [Google Scholar]
- van Swelm, R.P.; Wetzels, J.F.; Verweij, V.G.; Laarakkers, C.M.; Pertijs, J.C.; van der Wijst, J.; Thevenod, F.; Masereeuw, R.; Swinkels, D.W. Renal Handling of Circulating and Renal-Synthesized Hepcidin and Its Protective Effects against Hemoglobin-Mediated Kidney Injury. J. Am. Soc. Nephrol. 2016, 27, 2720–2732. [Google Scholar] [CrossRef]
- Nemeth, E.; Rivera, S.; Gabayan, V.; Keller, C.; Taudorf, S.; Pedersen, B.K.; Ganz, T. IL-6 mediates hypoferremia of inflammation by inducing the synthesis of the iron regulatory hormone hepcidin. J. Clin. Investig. 2004, 113, 1271–1276. [Google Scholar] [CrossRef] [PubMed] [Green Version]
- Rivera, S.; Liu, L.; Nemeth, E.; Gabayan, V.; Sorensen, O.E.; Ganz, T. Hepcidin excess induces the sequestration of iron and exacerbates tumor-associated anemia. Blood 2005, 105, 1797–1802. [Google Scholar] [CrossRef] [PubMed]
- Kemna, E.; Pickkers, P.; Nemeth, E.; van der Hoeven, H.; Swinkels, D. Time-course analysis of hepcidin, serum iron, and plasma cytokine levels in humans injected with LPS. Blood 2005, 106, 1864–1866. [Google Scholar] [CrossRef] [PubMed]
- Rivera, S.; Nemeth, E.; Gabayan, V.; Lopez, M.A.; Farshidi, D.; Ganz, T. Synthetic hepcidin causes rapid dose-dependent hypoferremia and is concentrated in ferroportin-containing organs. Blood 2005, 106, 2196–2199. [Google Scholar] [CrossRef] [PubMed] [Green Version]
- Moretti, D.; Goede, J.S.; Zeder, C.; Jiskra, M.; Chatzinakou, V.; Tjalsma, H.; Melse-Boonstra, A.; Brittenham, G.; Swinkels, D.W.; Zimmermann, M.B. Oral iron supplements increase hepcidin and decrease iron absorption from daily or twice-daily doses in iron-depleted young women. Blood 2015, 126, 1981–1989. [Google Scholar] [CrossRef] [PubMed]
- Hunter, H.N.; Fulton, D.B.; Ganz, T.; Vogel, H.J. The solution structure of human hepcidin, a peptide hormone with antimicrobial activity that is involved in iron uptake and hereditary hemochromatosis. J. Biol. Chem. 2002, 277, 37597–37603. [Google Scholar] [CrossRef]
- Galesloot, T.E.; Vermeulen, S.H.; Geurts-Moespot, A.J.; Klaver, S.M.; Kroot, J.J.; van Tienoven, D.; Wetzels, J.F.; Kiemeney, L.A.; Sweep, F.C.; den Heijer, M.; et al. Serum hepcidin: Reference ranges and biochemical correlates in the general population. Blood 2011, 117, 218–225. [Google Scholar] [CrossRef]
- Kemna, E.H.; Tjalsma, H.; Podust, V.N.; Swinkels, D.W. Mass spectrometry-based hepcidin measurements in serum and urine: Analytical aspects and clinical implications. Clin. Chem. 2007, 53, 620–628. [Google Scholar] [CrossRef]
- Ganz, T.; Olbina, G.; Girelli, D.; Nemeth, E.; Westerman, M. Immunoassay for human serum hepcidin. Blood 2008, 112, 4292–4297. [Google Scholar] [CrossRef] [Green Version]
- Schaap, C.C.; Hendriks, J.C.; Kortman, G.A.; Klaver, S.M.; Kroot, J.J.; Laarakkers, C.M.; Wiegerinck, E.T.; Tjalsma, H.; Janssen, M.C.; Swinkels, D.W. Diurnal rhythm rather than dietary iron mediates daily hepcidin variations. Clin. Chem. 2013, 59, 527–535. [Google Scholar] [CrossRef]
- Kroot, J.J.; Hendriks, J.C.; Laarakkers, C.M.; Klaver, S.M.; Kemna, E.H.; Tjalsma, H.; Swinkels, D.W. (Pre)analytical imprecision, between-subject variability, and daily variations in serum and urine hepcidin: Implications for clinical studies. Anal. Biochem. 2009, 389, 124–129. [Google Scholar] [CrossRef] [PubMed]
- Chan, S.; Debono, M. Replication of cortisol circadian rhythm: New advances in hydrocortisone replacement therapy. Ther. Adv. Endocrinol. Metab. 2010, 1, 129–138. [Google Scholar] [CrossRef] [PubMed]
- Santana, M.T.; Cerini, C.; Burtey, S. Emerging Roles of Aryl Hydrocarbon Receptors in the Altered Clearance of Drugs during Chronic Kidney Disease. Toxins 2019, 11, 209. [Google Scholar] [CrossRef] [PubMed]
- Evans, P.; Cindrova-Davies, T.; Muttukrishna, S.; Burton, G.J.; Porter, J.; Jauniaux, E. Hepcidin and iron species distribution inside the first-trimester human gestational sac. Mol. Hum. Reprod. 2011, 17, 227–232. [Google Scholar] [CrossRef] [PubMed]
- Krediet, R.T.; Struijk, D.G.; Koomen, G.C.; Hoek, F.J.; Arisz, L. The disappearance of macromolecules from the peritoneal cavity during continuous ambulatory peritoneal dialysis (CAPD) is not dependent on molecular size. Perit. Dial. Int. 1990, 10, 147–152. [Google Scholar] [PubMed]
- Finn, T.E.; Nunez, A.C.; Sunde, M.; Easterbrook-Smith, S.B. Serum albumin prevents protein aggregation and amyloid formation and retains chaperone-like activity in the presence of physiological ligands. J. Biol. Chem. 2012, 287, 21530–21540. [Google Scholar] [CrossRef] [PubMed]
- Kroot, J.J.; Kemna, E.H.; Bansal, S.S.; Busbridge, M.; Campostrini, N.; Girelli, D.; Hider, R.C.; Koliaraki, V.; Mamalaki, A.; Olbina, G.; et al. Results of the first international round robin for the quantification of urinary and plasma hepcidin assays: Need for standardization. Haematologica 2009, 94, 1748–1752. [Google Scholar] [CrossRef]
- Kroot, J.J.; van Herwaarden, A.E.; Tjalsma, H.; Jansen, R.T.; Hendriks, J.C.; Swinkels, D.W. Second round robin for plasma hepcidin methods: First steps toward harmonization. Am. J. Hematol. 2012, 87, 977–983. [Google Scholar] [CrossRef]
- Hohlbaum, A.M.; Gille, H.; Trentmann, S.; Kolodziejczyk, M.; Rattenstetter, B.; Laarakkers, C.M.; Katzmann, G.; Christian, H.J.; Andersen, N.; Allersdorfer, A.; et al. Sustained plasma hepcidin suppression and iron elevation by Anticalin-derived hepcidin antagonist in cynomolgus monkey. Br. J. Pharmacol. 2018, 175, 1054–1065. [Google Scholar] [CrossRef] [Green Version]
- Boyce, M.; Warrington, S.; Cortezi, B.; Zollner, S.; Vauleon, S.; Swinkels, D.W.; Summo, L.; Schwoebel, F.; Riecke, K. Safety, pharmacokinetics and pharmacodynamics of the anti-hepcidin Spiegelmer lexaptepid pegol in healthy subjects. Br. J. Pharmacol. 2016, 173, 1580–1588. [Google Scholar] [CrossRef]
- van Eijk, L.T.; John, A.S.E.; Schwoebel, F.; Summo, L.; Vauléon, S.; Zöllner, S.; Laarakkers, C.M.; Kox, M.; van der Hoeven, J.G.; Swinkels, D.W.; et al. Effect of the antihepcidin Spiegelmer lexaptepid on inflammation-induced decrease in serum iron in humans. Blood 2014, 124, 2643–2646. [Google Scholar] [CrossRef] [PubMed] [Green Version]
- Cooke, K.S.; Hinkle, B.; Salimi-Moosavi, H.; Foltz, I.; King, C.; Rathanaswami, P.; Winters, A.; Steavenson, S.; Begley, C.G.; Molineux, G.; et al. A fully human anti-hepcidin antibody modulates iron metabolism in both mice and nonhuman primates. Blood 2013, 122, 3054–3061. [Google Scholar] [CrossRef] [PubMed] [Green Version]
- Laarakkers, C.M.; Wiegerinck, E.T.; Klaver, S.; Kolodziejczyk, M.; Gille, H.; Hohlbaum, A.M.; Tjalsma, H.; Swinkels, D.W. Improved mass spectrometry assay for plasma hepcidin: Detection and characterization of a novel hepcidin isoform. PLoS ONE 2013, 8, 75518. [Google Scholar] [CrossRef] [PubMed]
- NCCLS; Tholen, D.W.; Kroll, M.; Astles, J.R.; Caffo, A.L.; Happe, T.M.; Krouwer, J.; Lasky, F. Evaluation of the Linearity of Quantitative Measurement Procedures: A Statistical Approach; Approved Guideline; Clinical Laboratory Standard Institute: Wayne, PA, USA, 2003. [Google Scholar]


| ID | Age (yrs) | Gender (M/F) | Underlying Disease | Use of Prednisone 1 | Creatinine Clearance (L/week/1.73 m2) Total (residual) | Start Time PET (a.m.) |
|---|---|---|---|---|---|---|
| 1 | 73 | F | Primary amyloidosis | No | 61.1 (32.3) | 10:00 |
| 2 | 82 | M | Renal vascular disease due to hypertension | No | 56.4 (25.7) | 09:30 |
| 3 | 55 | F | Lupus erythematosus | 1 × 7.5 mg | 99.3 (73.7) | 10:00 |
| 4 | 74 | M | Renal vascular disease due to hypertension | No | 68.2 (34.5) | 08:30 |
| 5 | 72 | M | IgA nephropathy | No | 118.2 (69.6) | 10:00 |
| 6 | 64 | M | Renal vascular disease type unspecified | 1 × 7.5 mg | 70.5 (37.1) | 12:00 |
| 7 | 66 | M | Diabetes mellitus type 2 | No | 100.8 (63.9) | 10:15 |
| 8 | 53 | M | Chronic renal failure etiology unknown/uncertain | No | 71.7 (43.2) | 12:00 |
| 9 | 76 | M | Renal vascular disease due to hypertension | No | 114.0 (75.7) | 12:00 |
| 10 | 72 | M | Renal vascular disease type unspecified | No | 128.6 (100.0) | 10:00 |
| 11 | 55 | F | IgA nephropathy | 2 × 5 mg | 122.6 (77.8) | 11:30 |
| 12 | 61 | F | Renal vascular disease type unspecified | 1 × 5 mg | 129.5 (96.7) | 11:00 |
| 13 | 64 | F | Diabetes mellitus type 2 | No | 101.8 (35.9) | 09:30 |
| 14 | 77 | M | Renal vascular disease due to hypertension | No | 118.1 (73.1) | 09:00 |
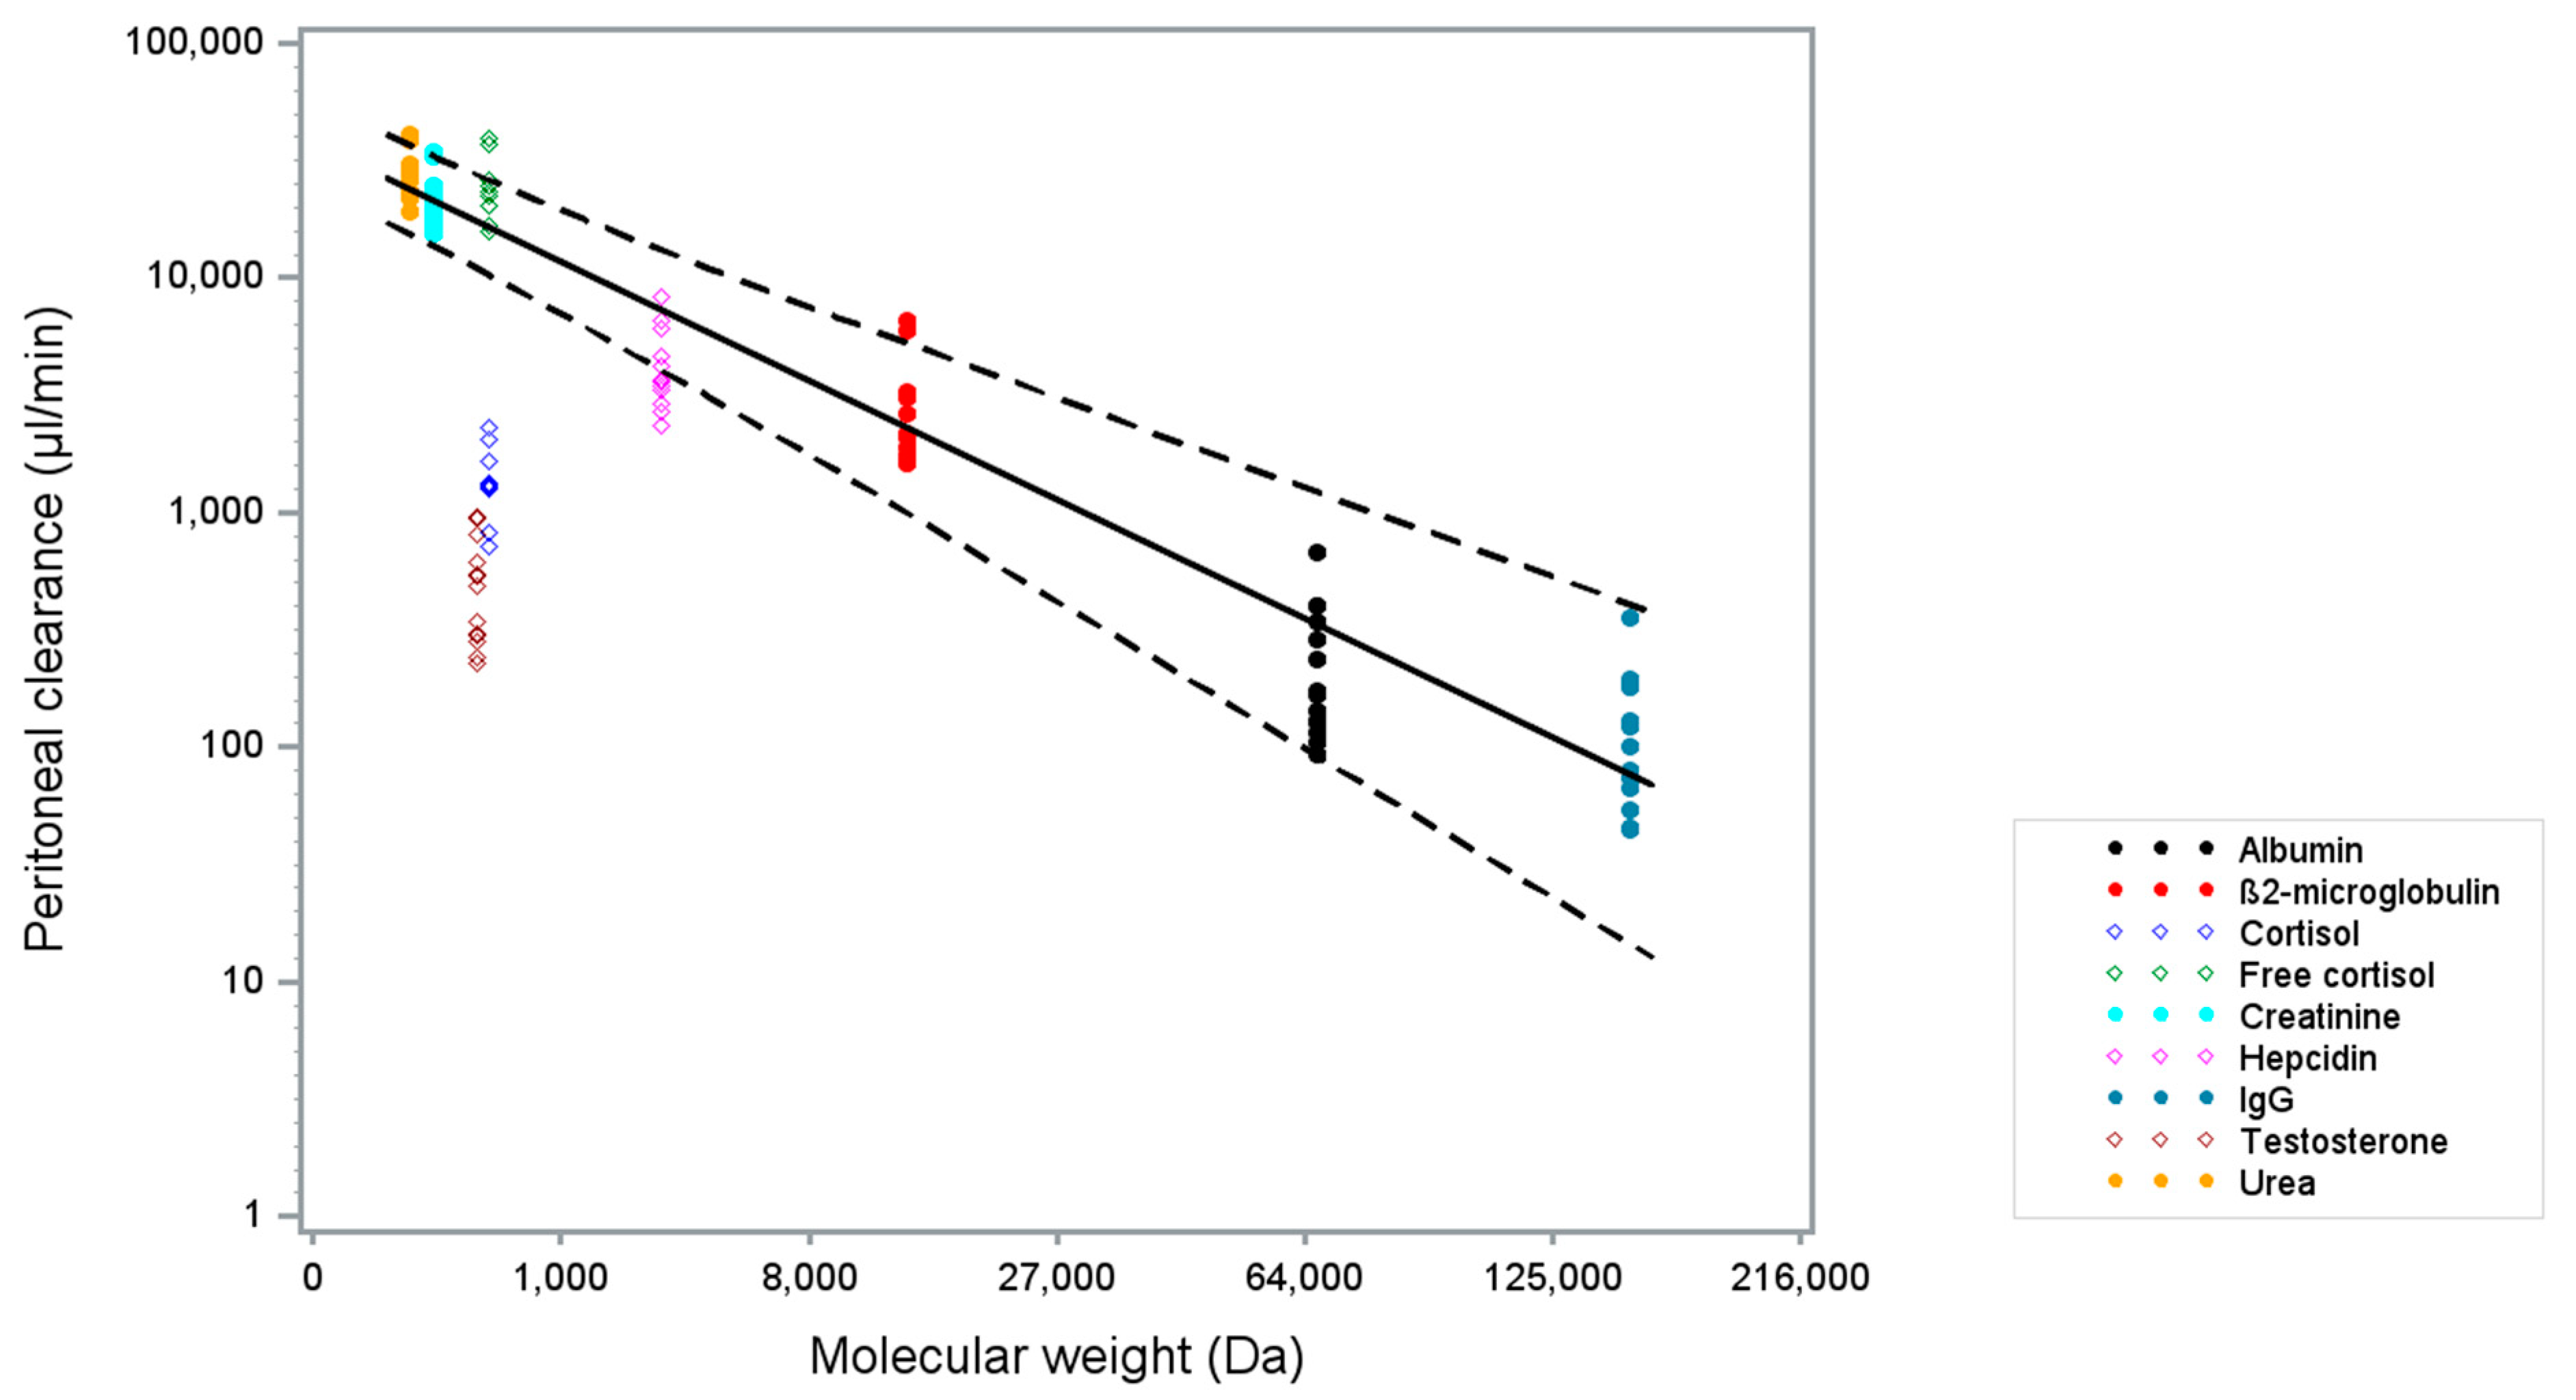
| Solute | MW (Da) | [Plasma] t = 0 h Mean (sd) | [Dialysate] 1 t = 1 h Mean (sd) | Peritoneal Clearance (µL/min) t = 0–1 h Mean (sd) | N |
|---|---|---|---|---|---|
| Urea (mmol/L) | 60.0 | 21.5 (6.6) | 15.0 (6.1) | 26,959.1 (6211.8) | 14 |
| Creatinine (µmol/L) | 113.1 | 542.0 (172.6) | 296.9 (119.9) | 21,499.6 (5861.6) | 14 |
| Testosterone, total (nmol/L) 2 | 288.0 | 8.6 (7.3) | 0.1 (0.1) | 507.7 (260.5) | 13 3 |
| Cortisol, total (nmol/L) 4 | 362.5 | 229.1 (134.4) | 8.4 (5.8) | 1439.0 (490.8) | 10 5 |
| Cortisol, free (nmol/L) | 362.5 | 12.7 (7.7) | 8.4 (5.8) | 25,030.8 (8123.9) | 9 5,6 |
| Hepcidin (nmol/L) | 2789.4 | 10.6 (9.1) | 1.2 (1.1) | 4337.5 (1713.1) | 13 7 |
| β2-microglobulin (mg/L) | 13,713.0 | 18.7 (5.0) | 1.4 (0.9) | 2804.0 (1587.8) | 14 |
| Albumin (g/L) | 66437.0 | 32.1 (4.9) | 0.2 (0.1) | 242.3 (164.2) | 14 |
| IgG (mg/L) | 150,000.0 | 7496.0 (1730.3) | 23.1 (12.7) | 129.3 (84.7) | 14 |
© 2019 by the authors. Licensee MDPI, Basel, Switzerland. This article is an open access article distributed under the terms and conditions of the Creative Commons Attribution (CC BY) license (http://creativecommons.org/licenses/by/4.0/).
Share and Cite
Diepeveen, L.E.; Laarakkers, C.M.; Peters, H.P.E.; van Herwaarden, A.E.; Groenewoud, H.; IntHout, J.; Wetzels, J.F.; van Swelm, R.P.L.; Swinkels, D.W. Unraveling Hepcidin Plasma Protein Binding: Evidence from Peritoneal Equilibration Testing. Pharmaceuticals 2019, 12, 123. https://0-doi-org.brum.beds.ac.uk/10.3390/ph12030123
Diepeveen LE, Laarakkers CM, Peters HPE, van Herwaarden AE, Groenewoud H, IntHout J, Wetzels JF, van Swelm RPL, Swinkels DW. Unraveling Hepcidin Plasma Protein Binding: Evidence from Peritoneal Equilibration Testing. Pharmaceuticals. 2019; 12(3):123. https://0-doi-org.brum.beds.ac.uk/10.3390/ph12030123
Chicago/Turabian StyleDiepeveen, Laura E., Coby M. Laarakkers, Hilde P.E. Peters, Antonius E. van Herwaarden, Hans Groenewoud, Joanna IntHout, Jack F. Wetzels, Rachel P.L. van Swelm, and Dorine W. Swinkels. 2019. "Unraveling Hepcidin Plasma Protein Binding: Evidence from Peritoneal Equilibration Testing" Pharmaceuticals 12, no. 3: 123. https://0-doi-org.brum.beds.ac.uk/10.3390/ph12030123