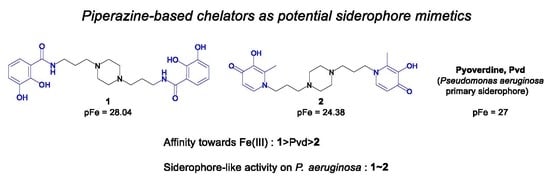
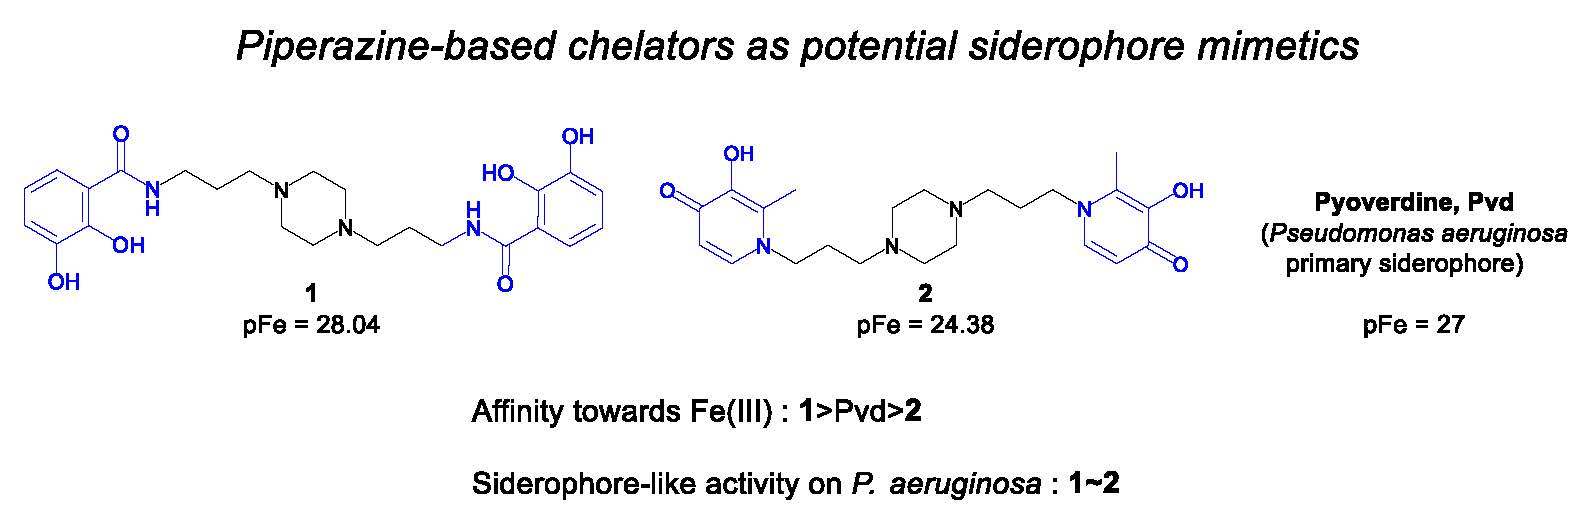
Study of Iron Piperazine-Based Chelators as Potential Siderophore Mimetics

 , , ,
, , ,
Abstract
:
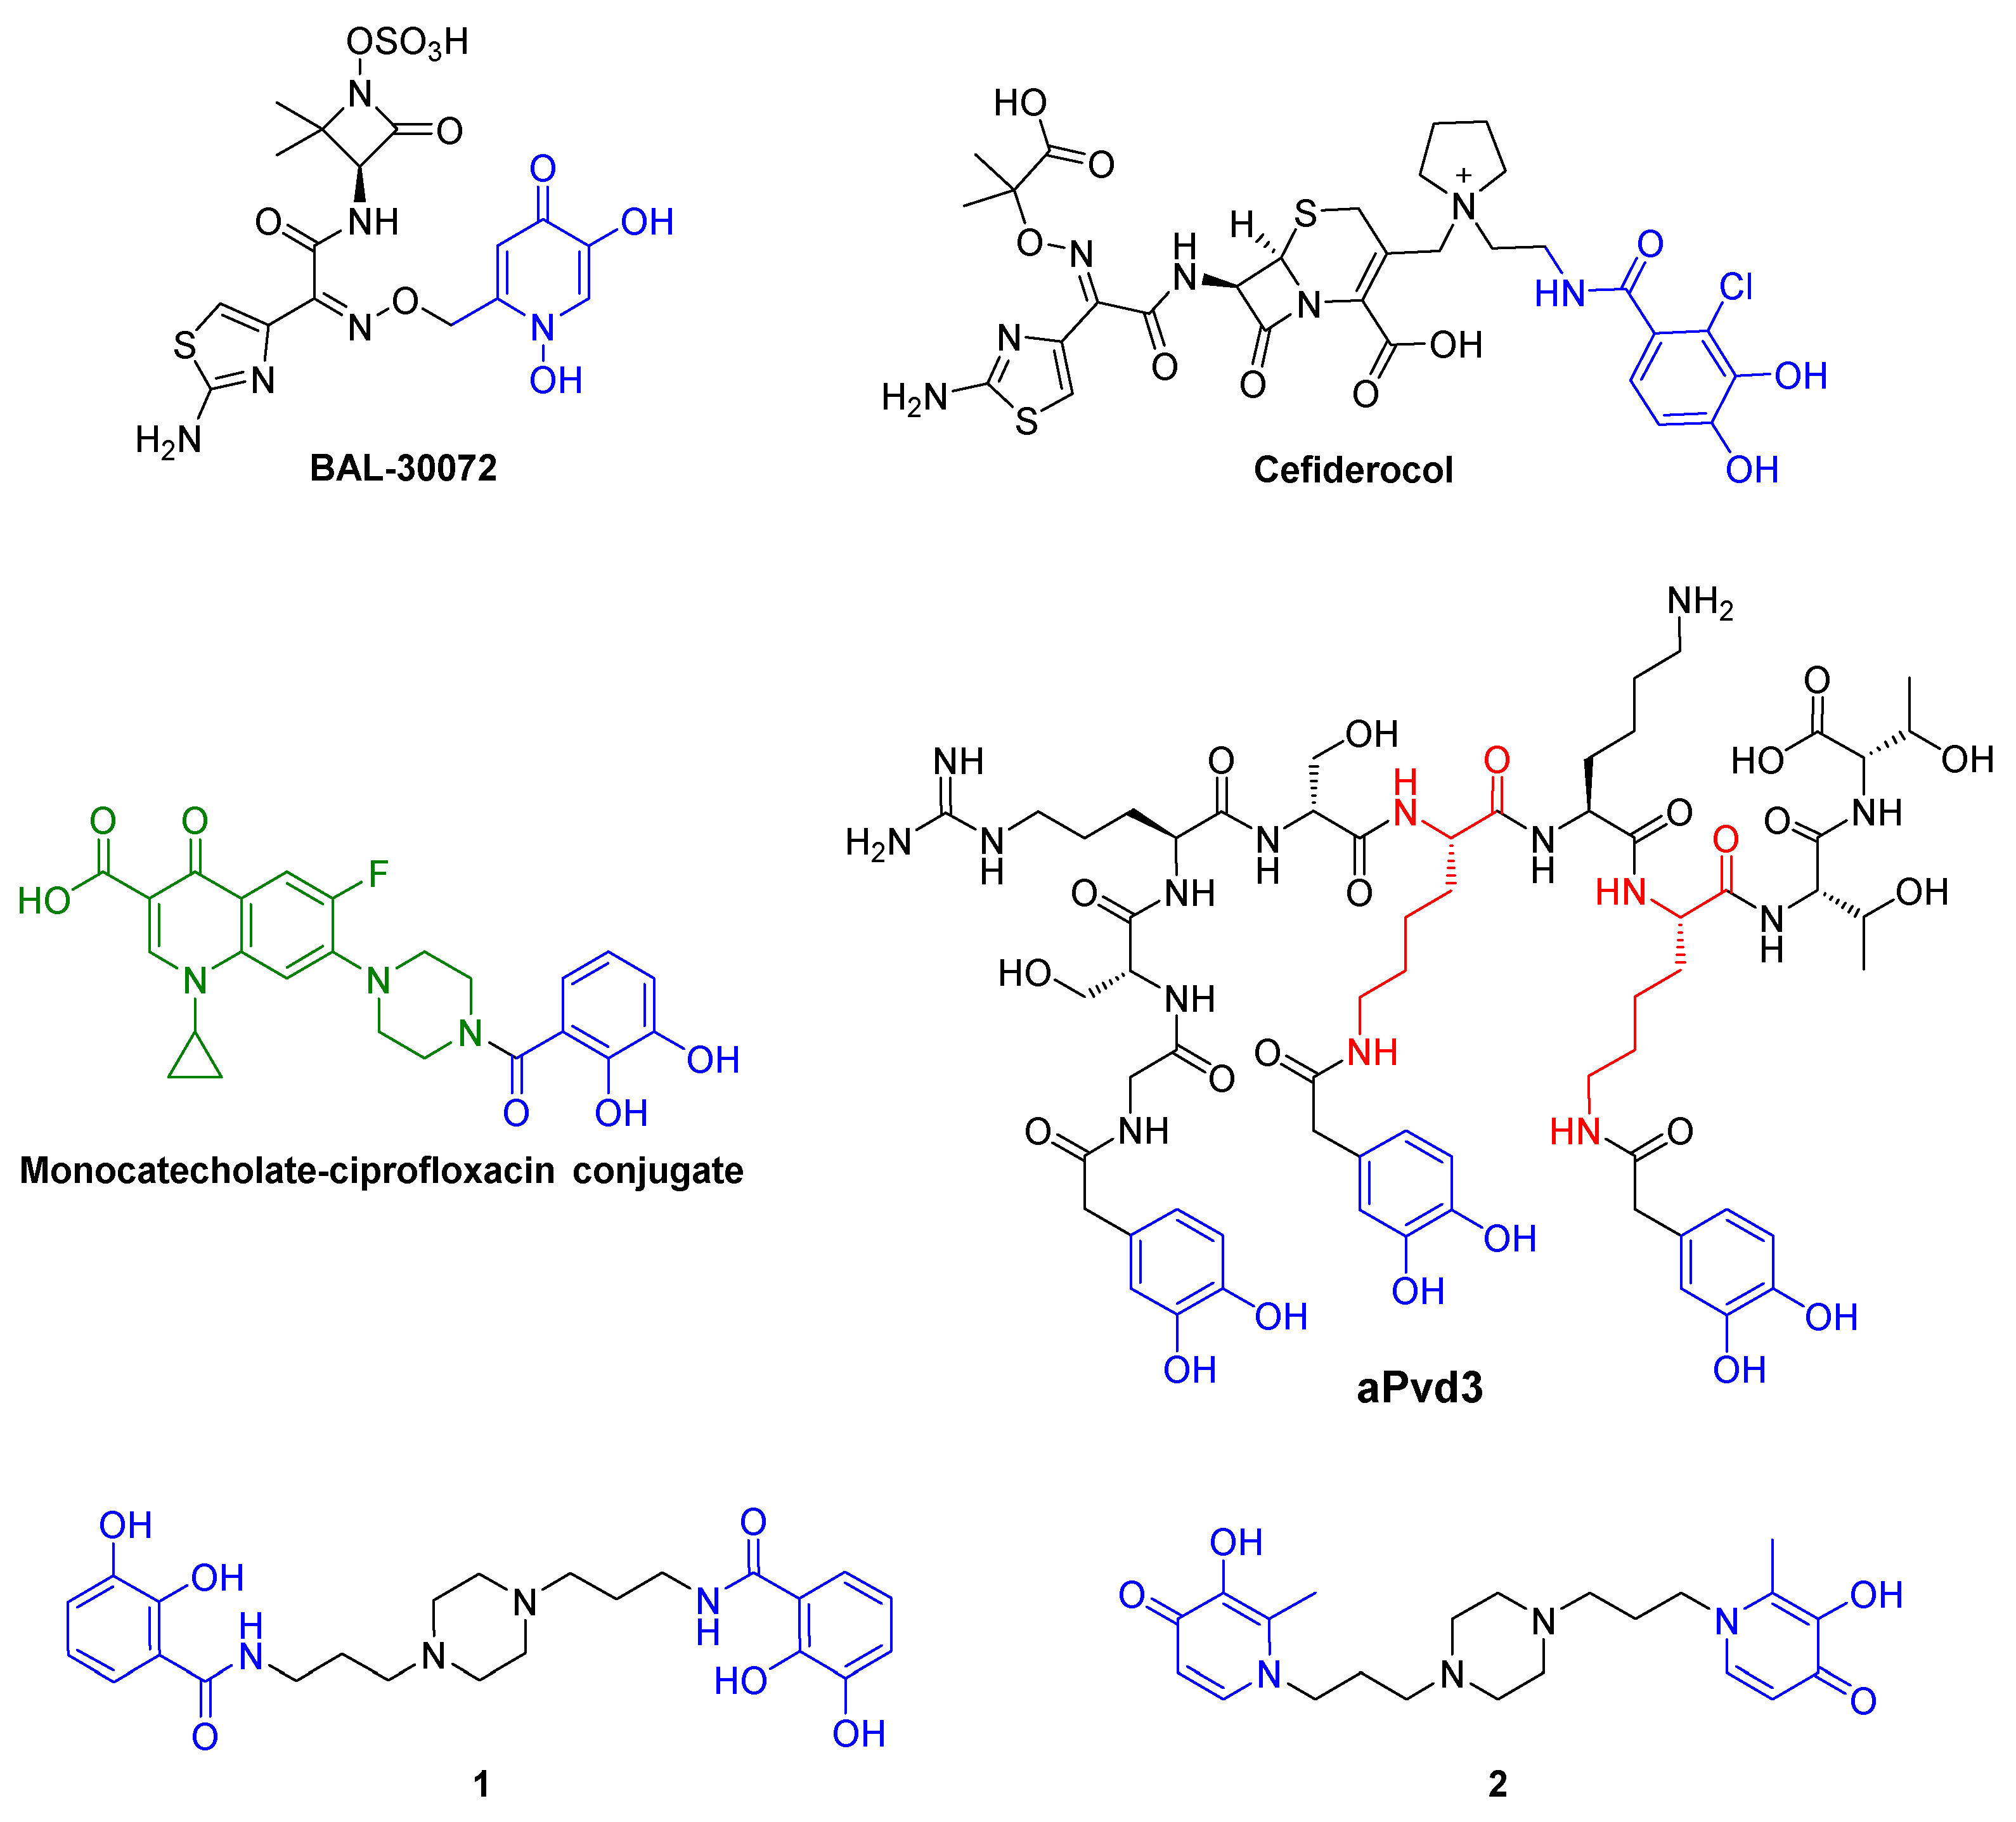
1. Introduction
2. Results and Discussion
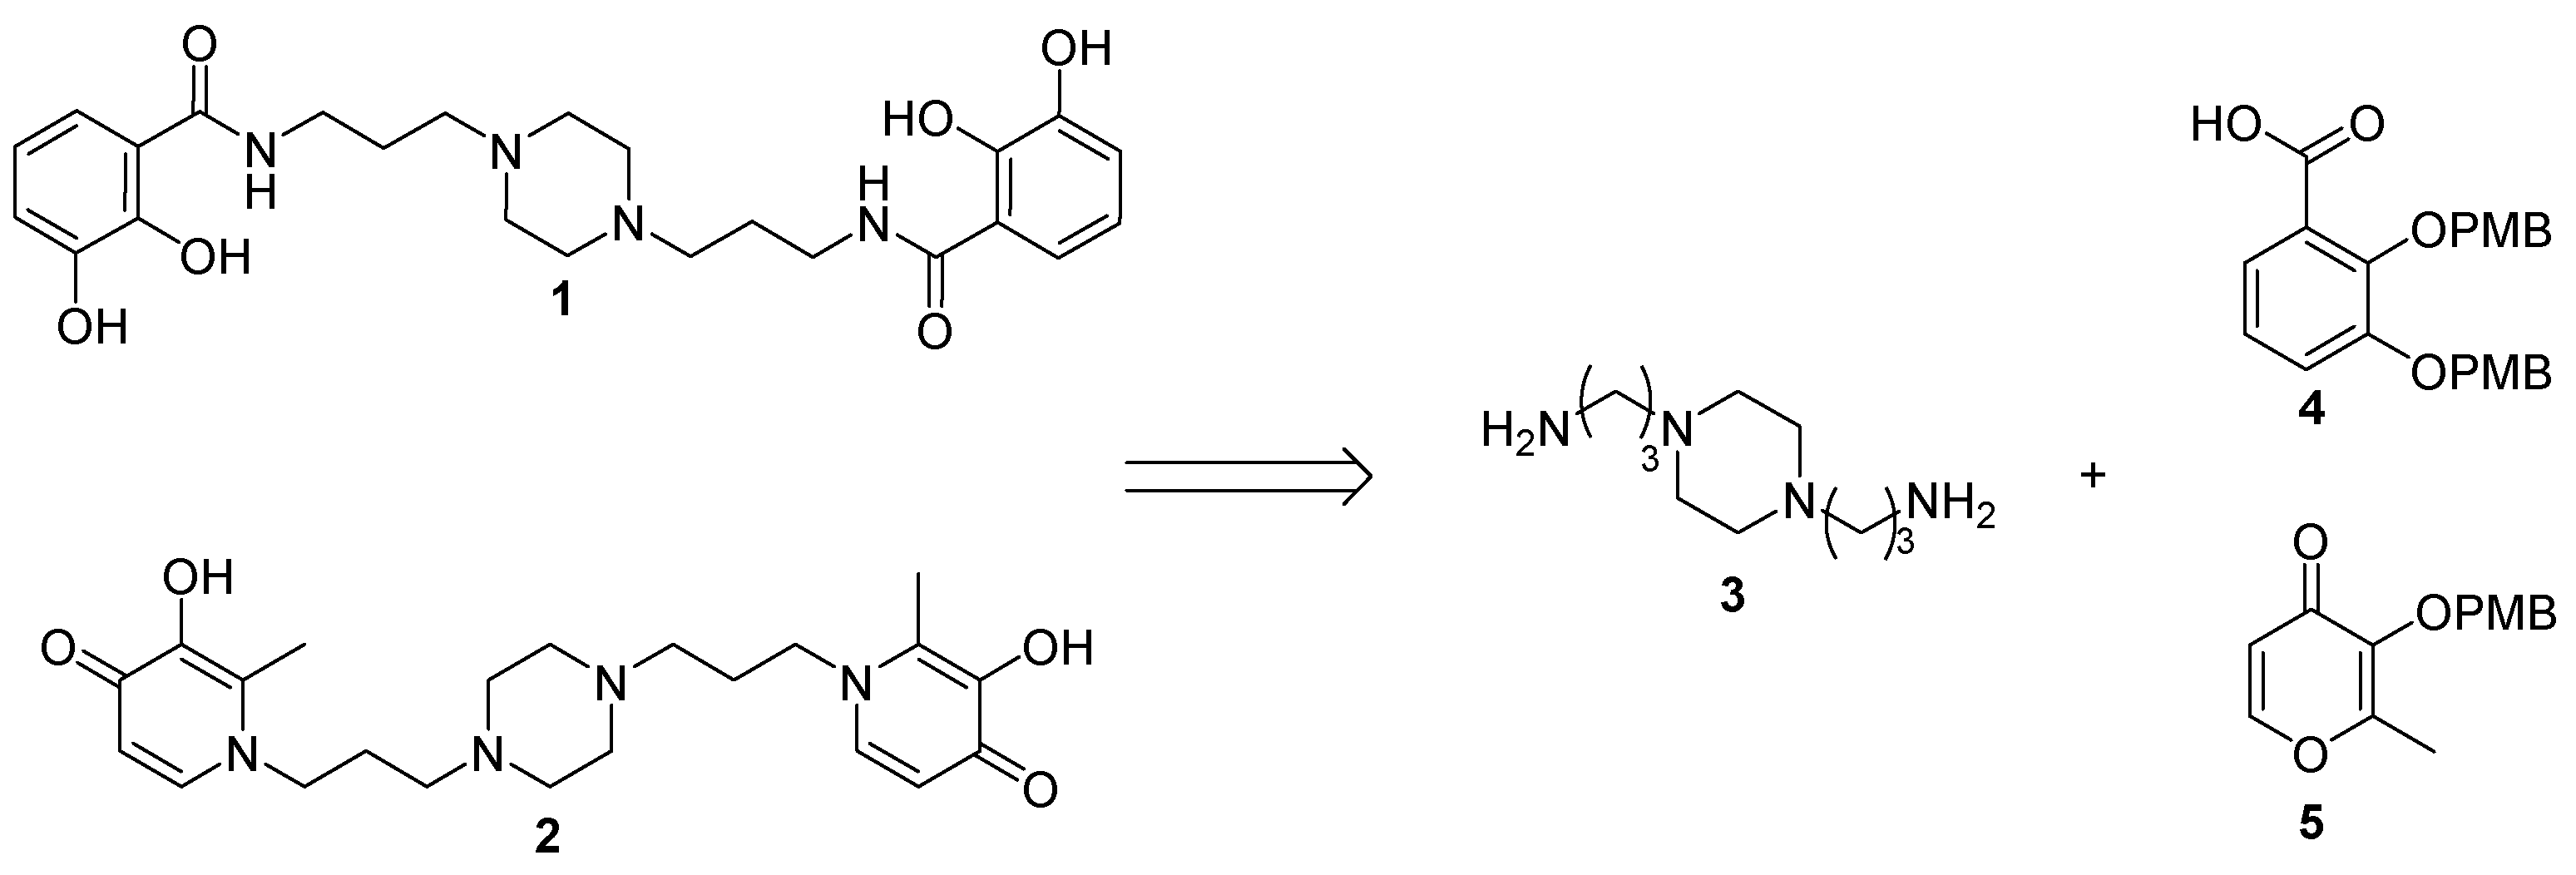
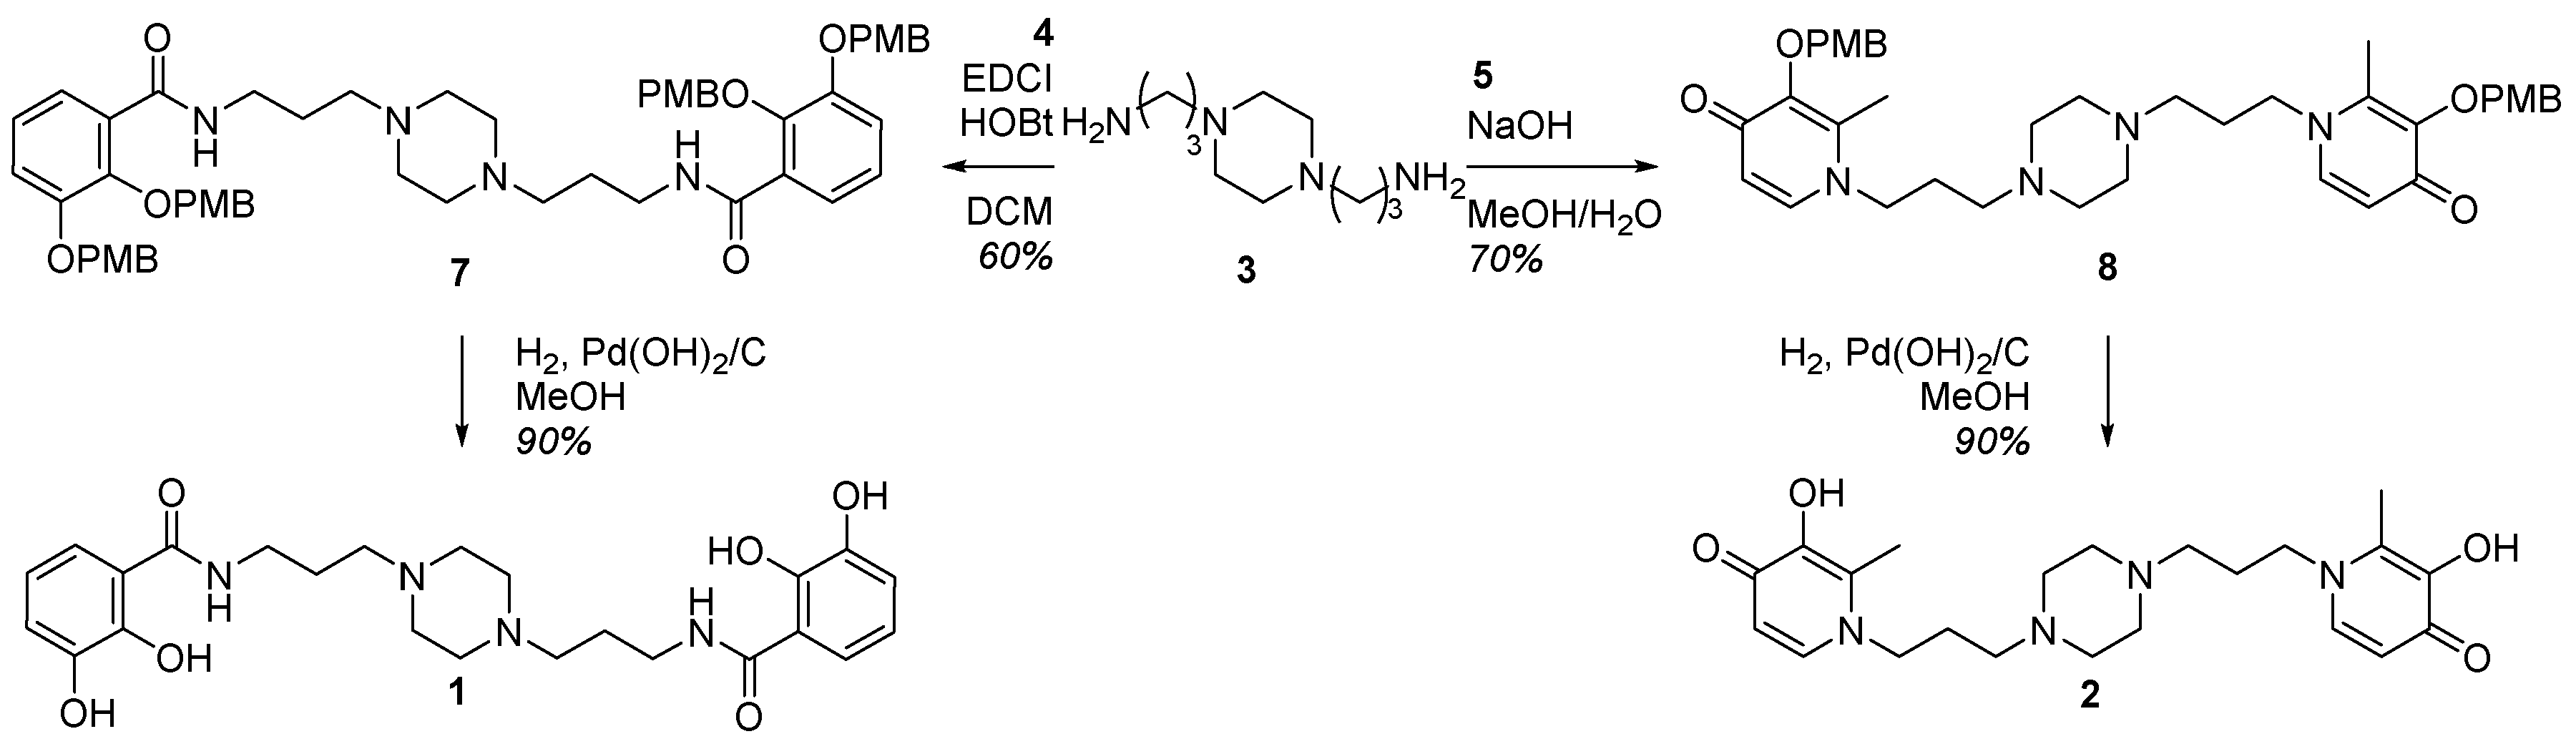
2.1. Siderophore Mimetics 1 and 2 Synthesis
2.1.1. Synthesis of the Bidentate Ligand Precursors 4 and 5
2.1.2. Synthesis of the Iron Chelators 1 and 2
2.2. Physicochemical Studies
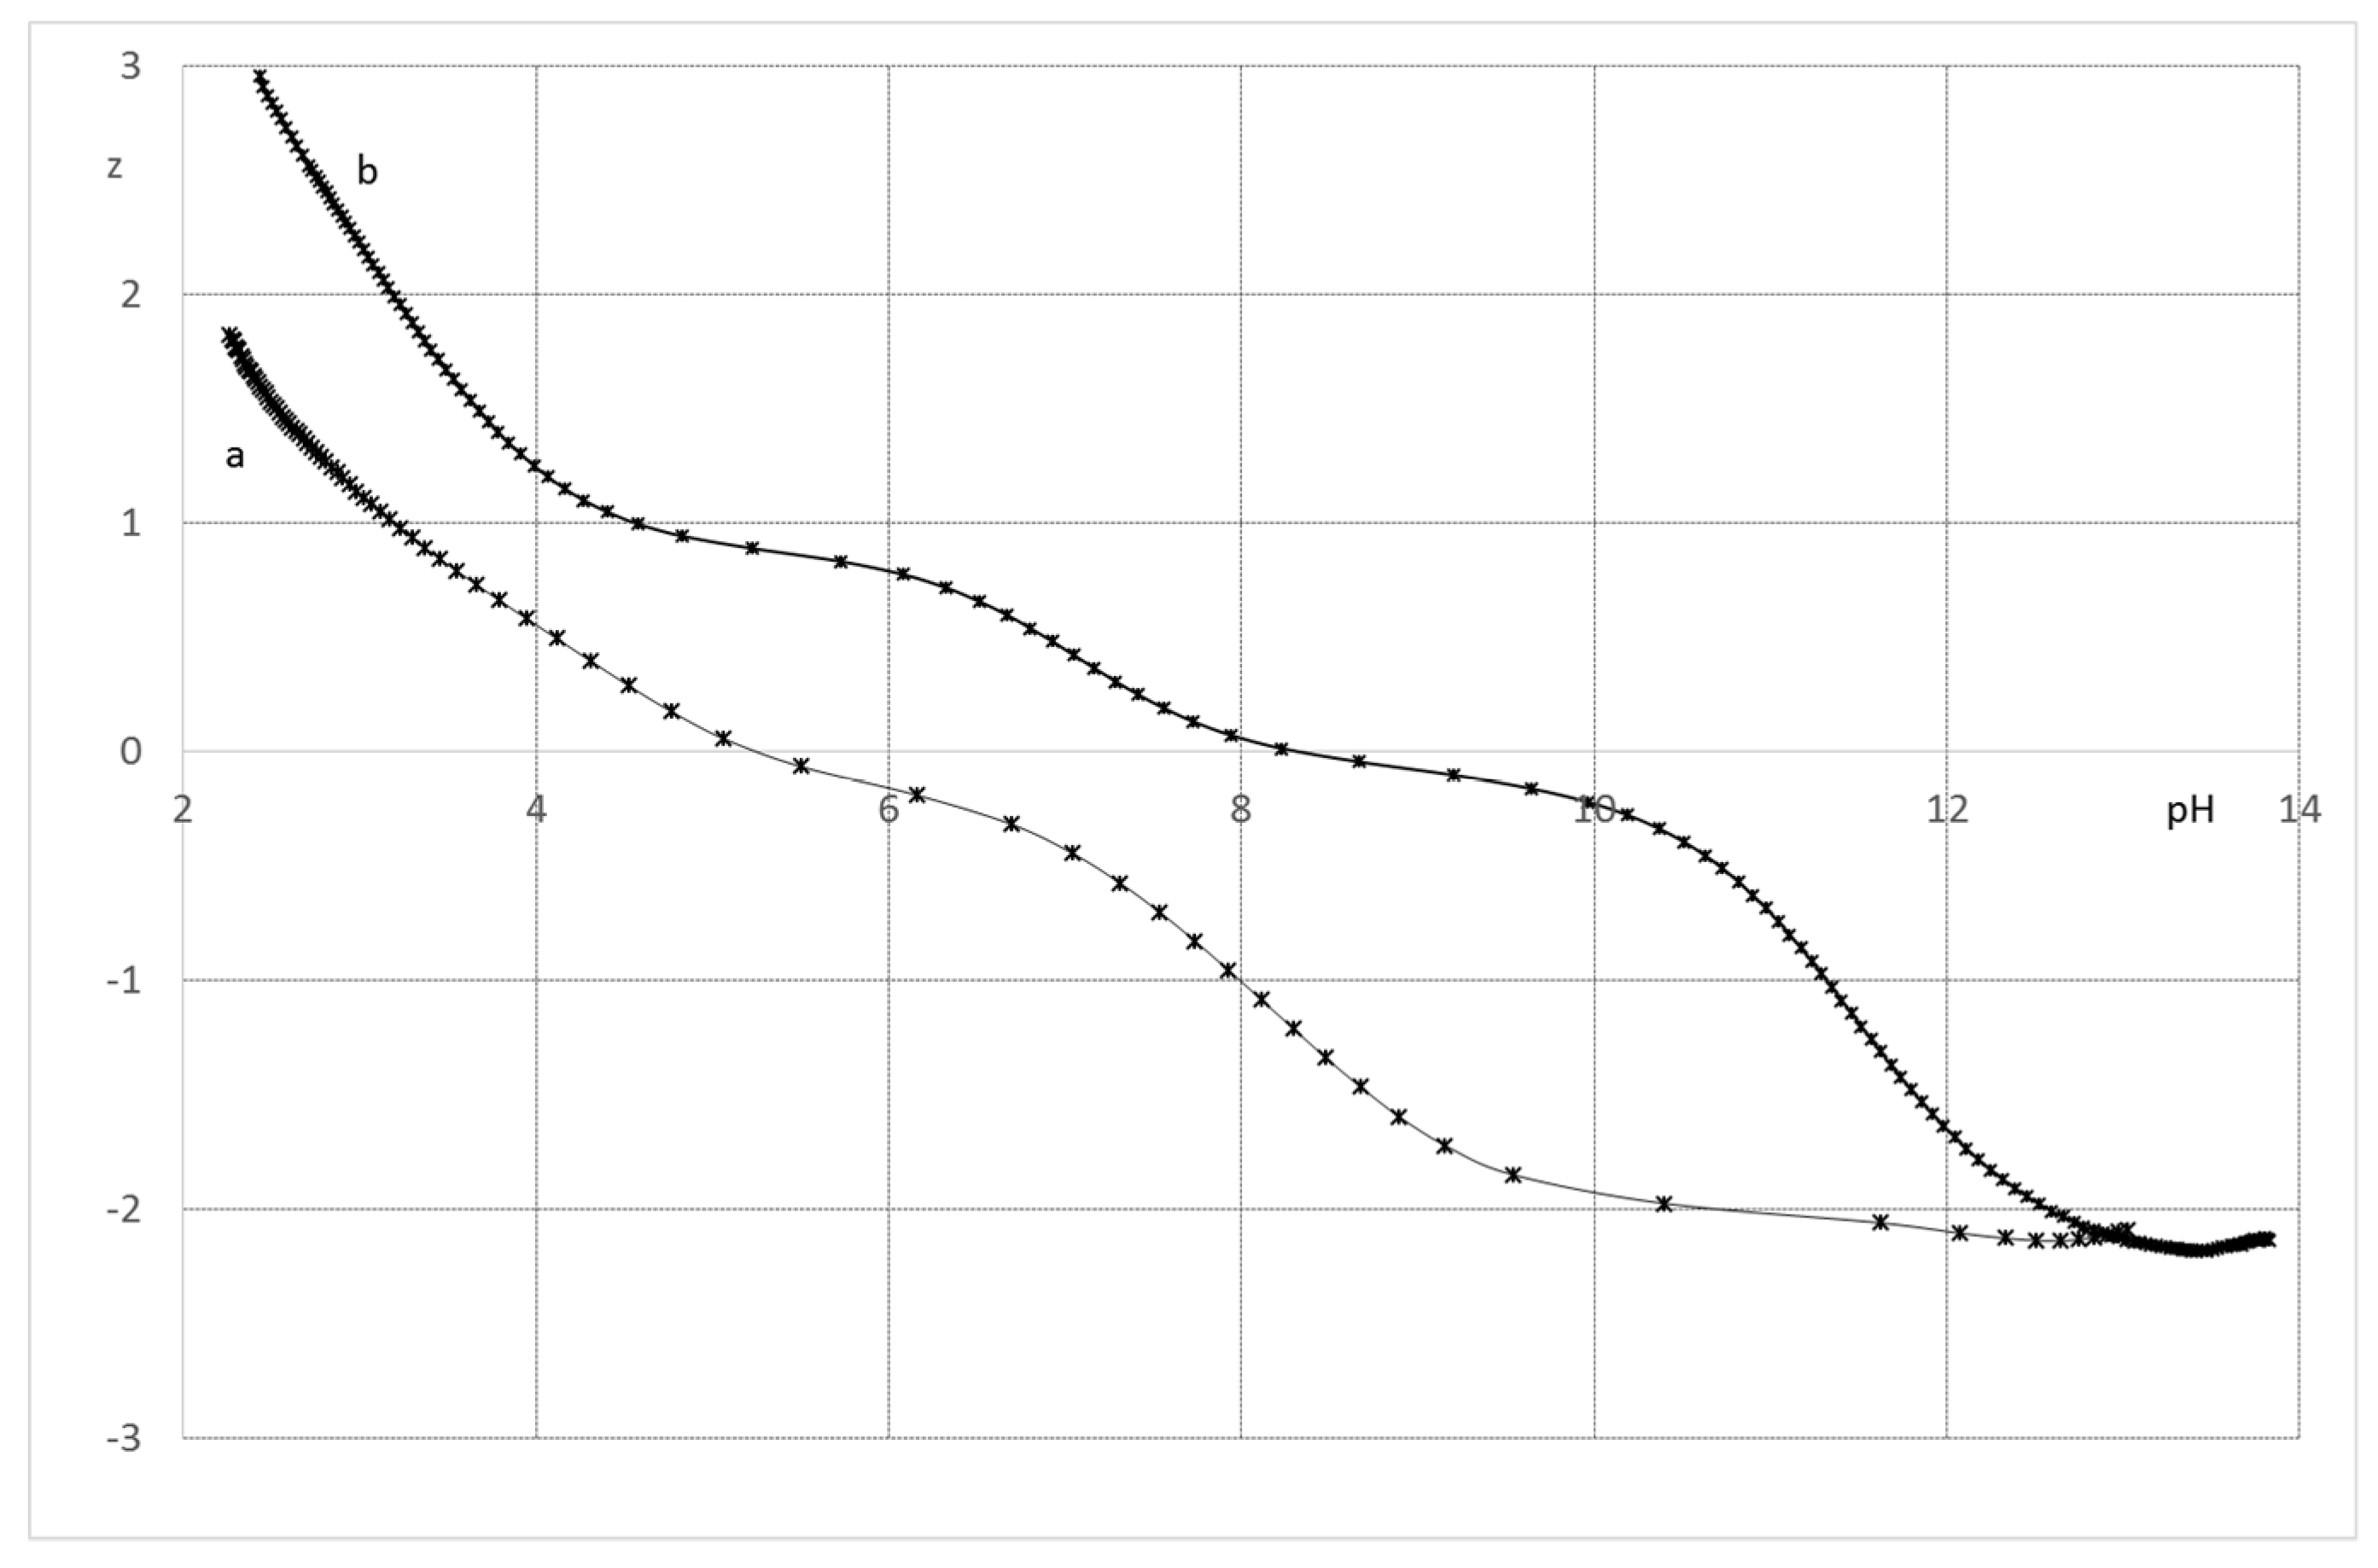
2.2.1. System H+/1(2)
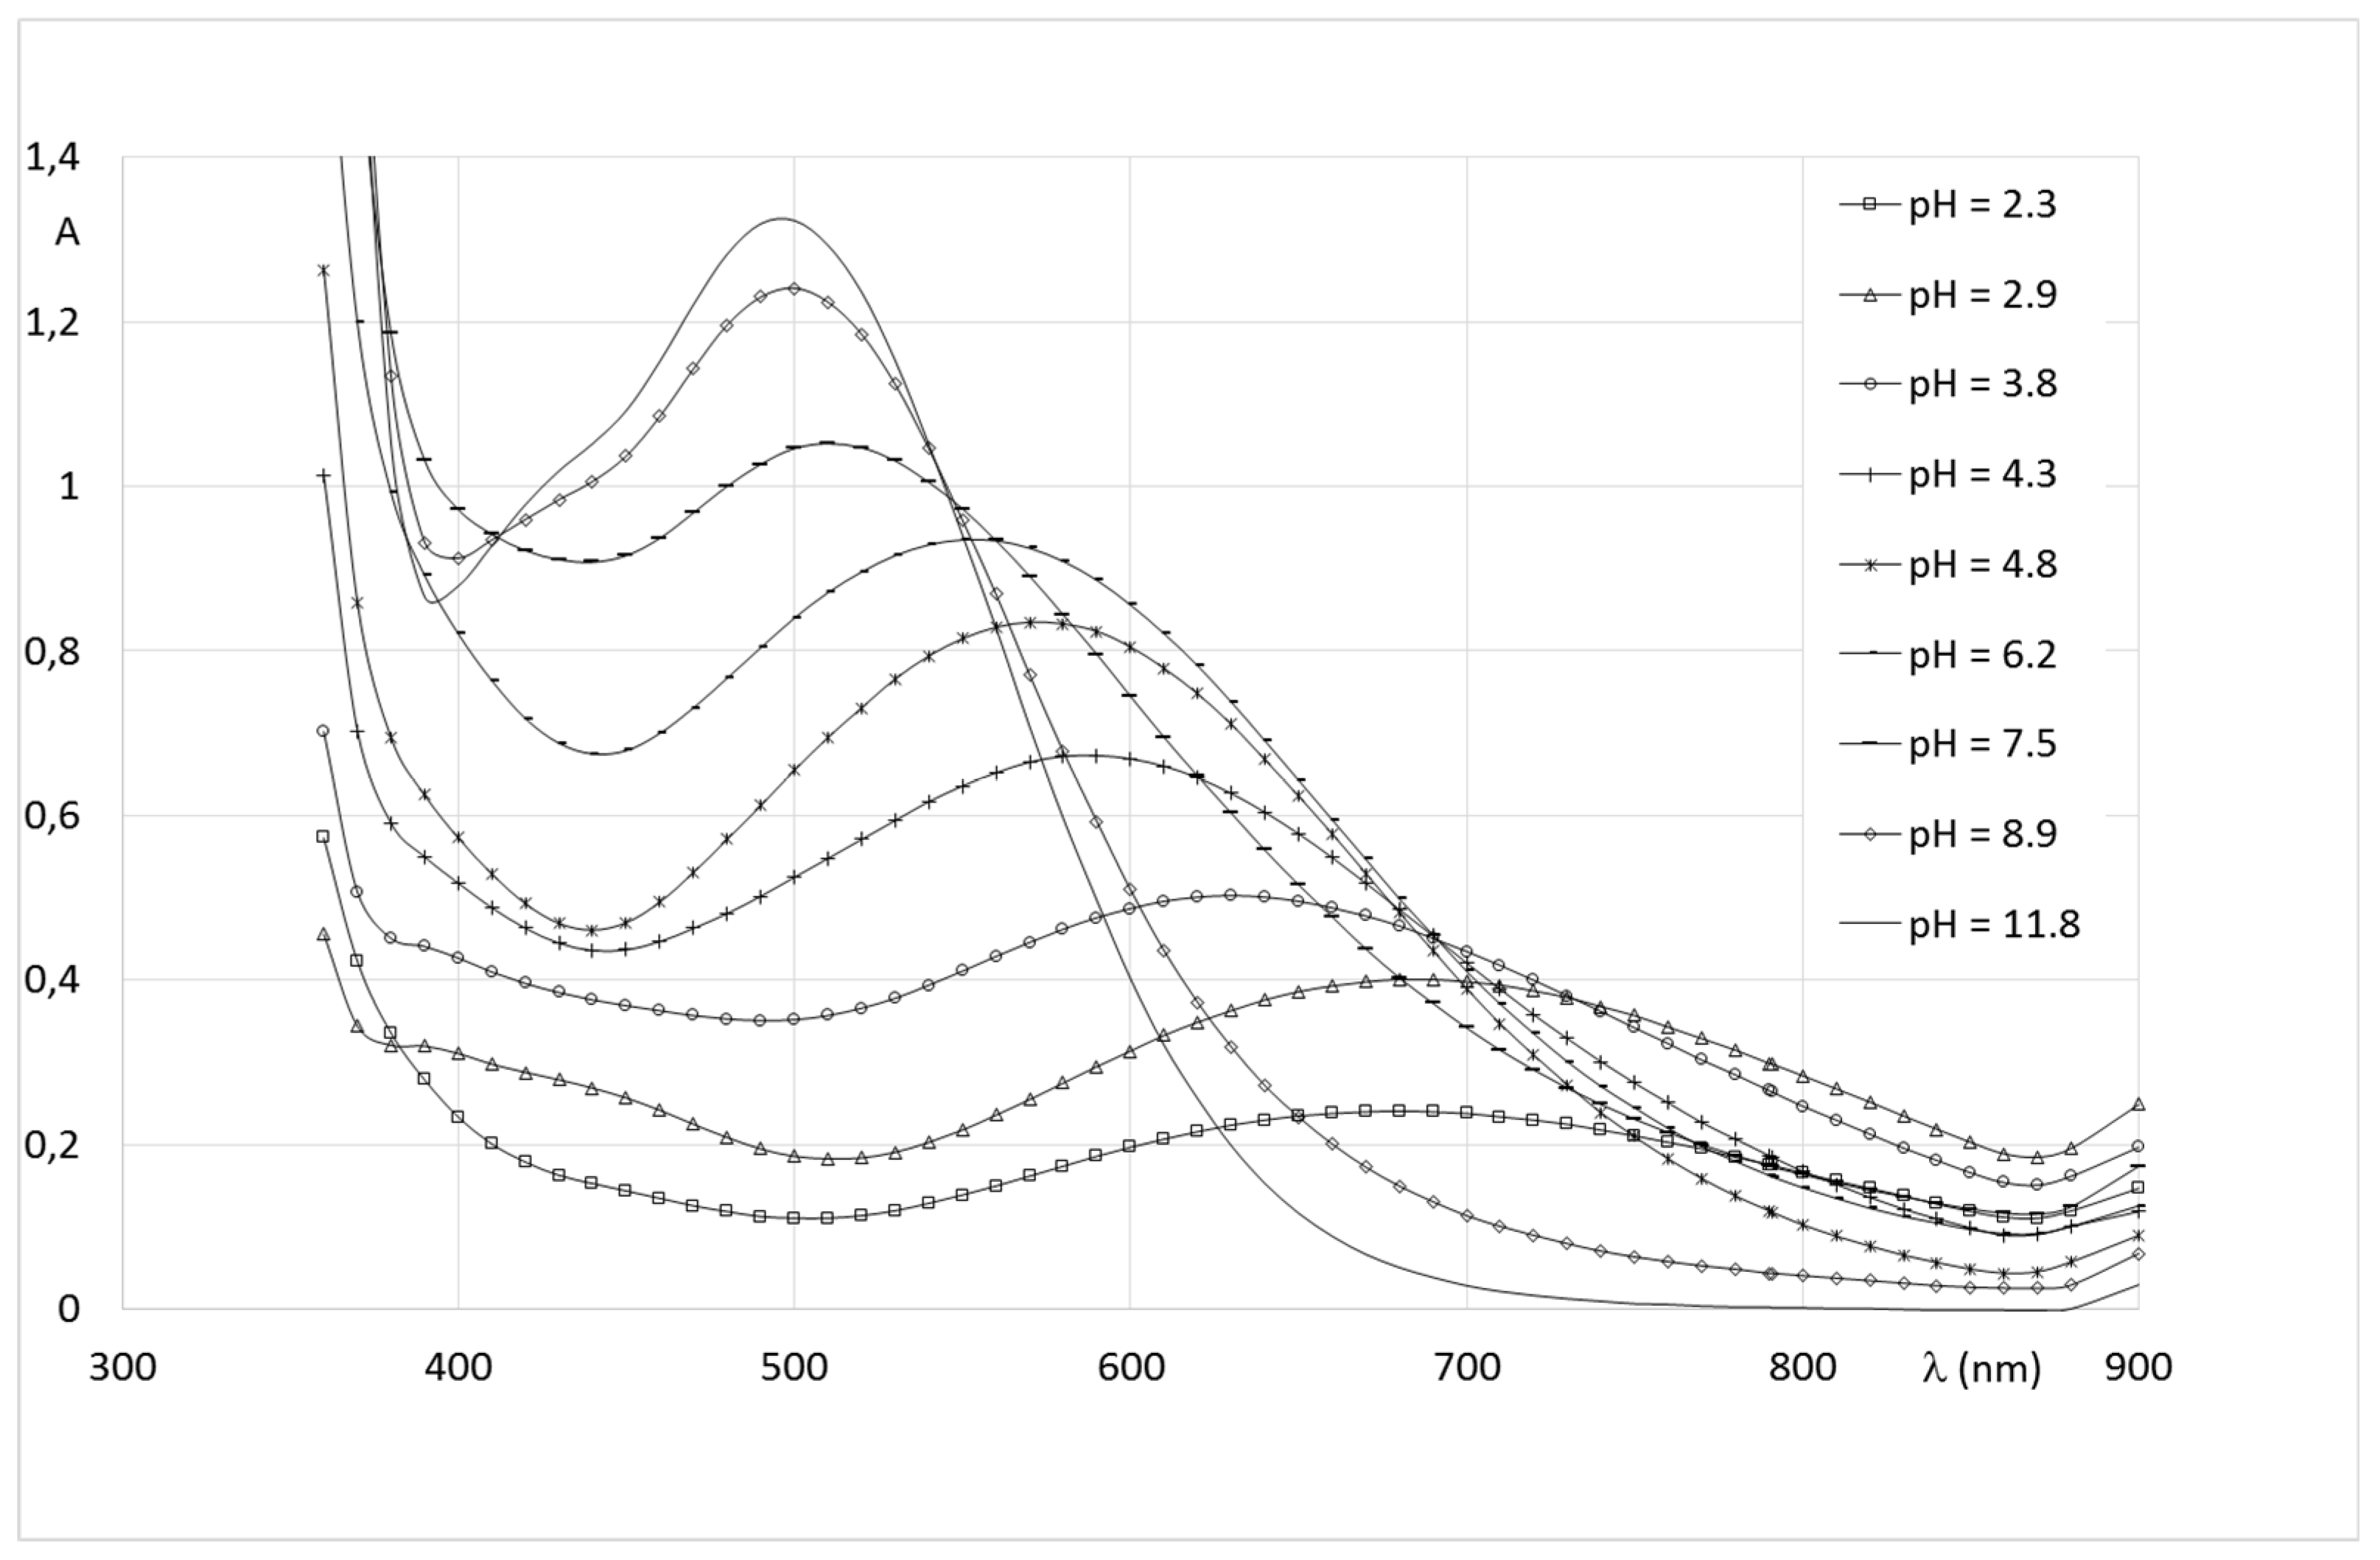
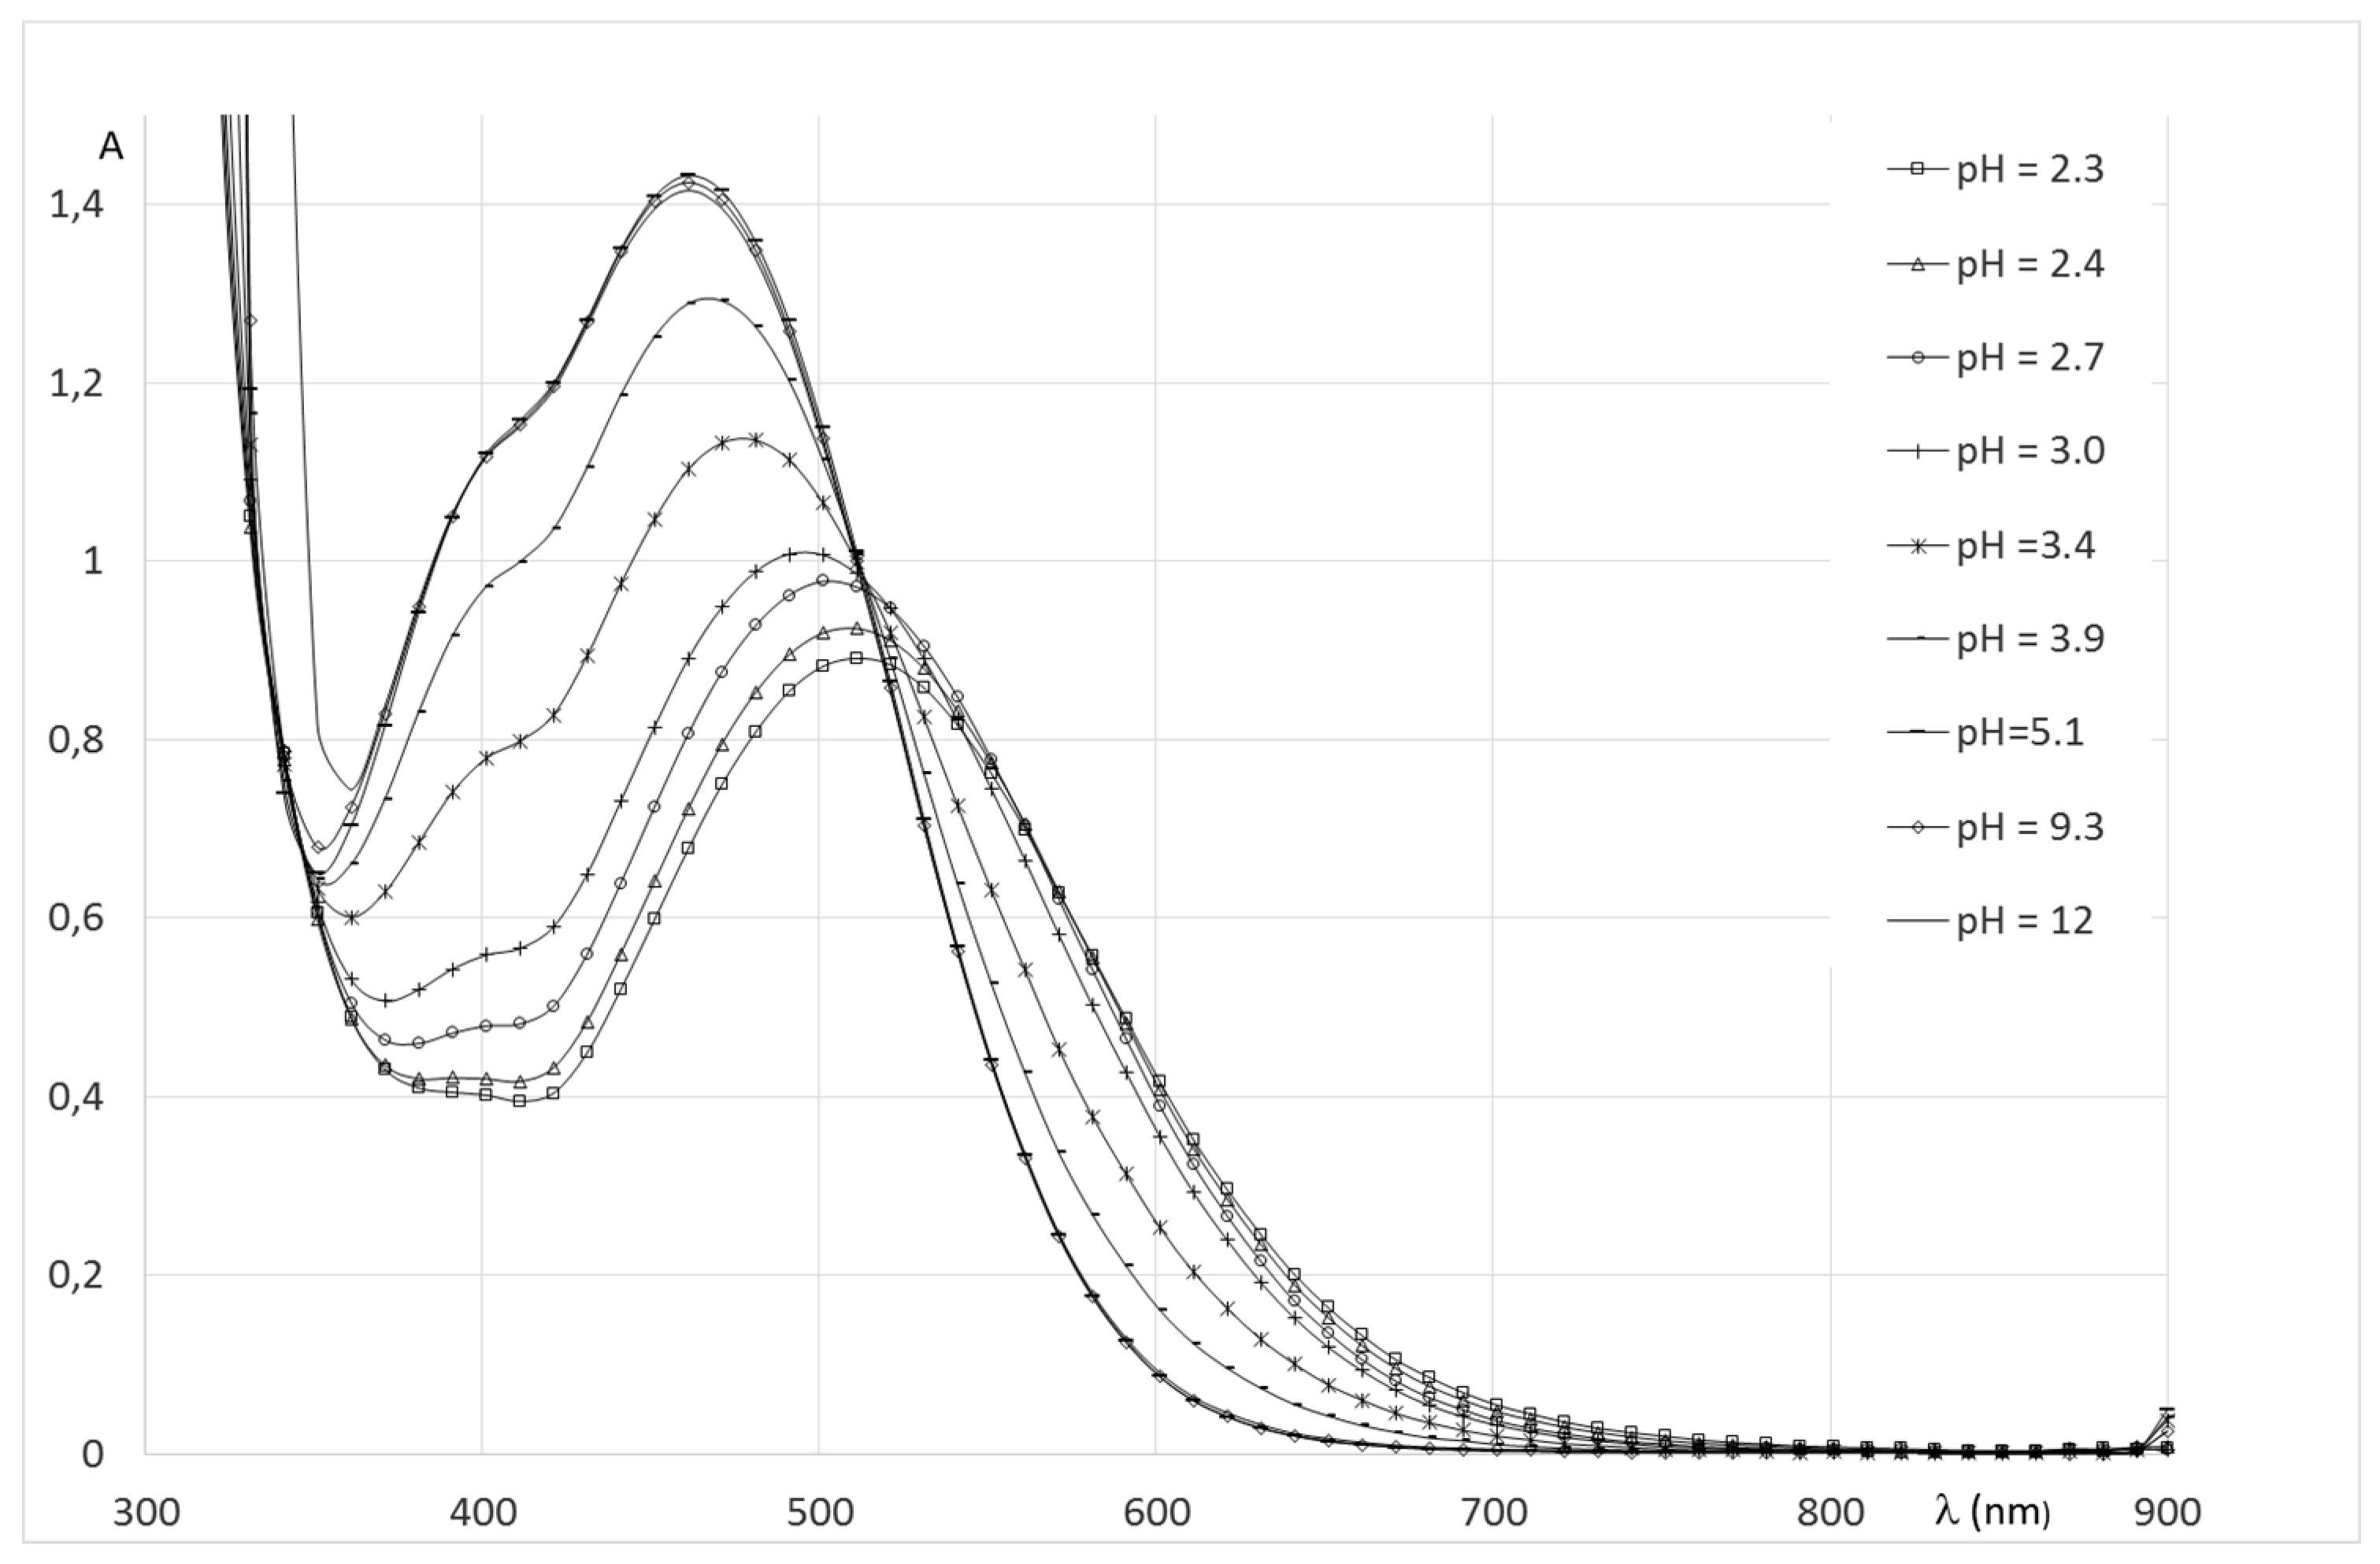
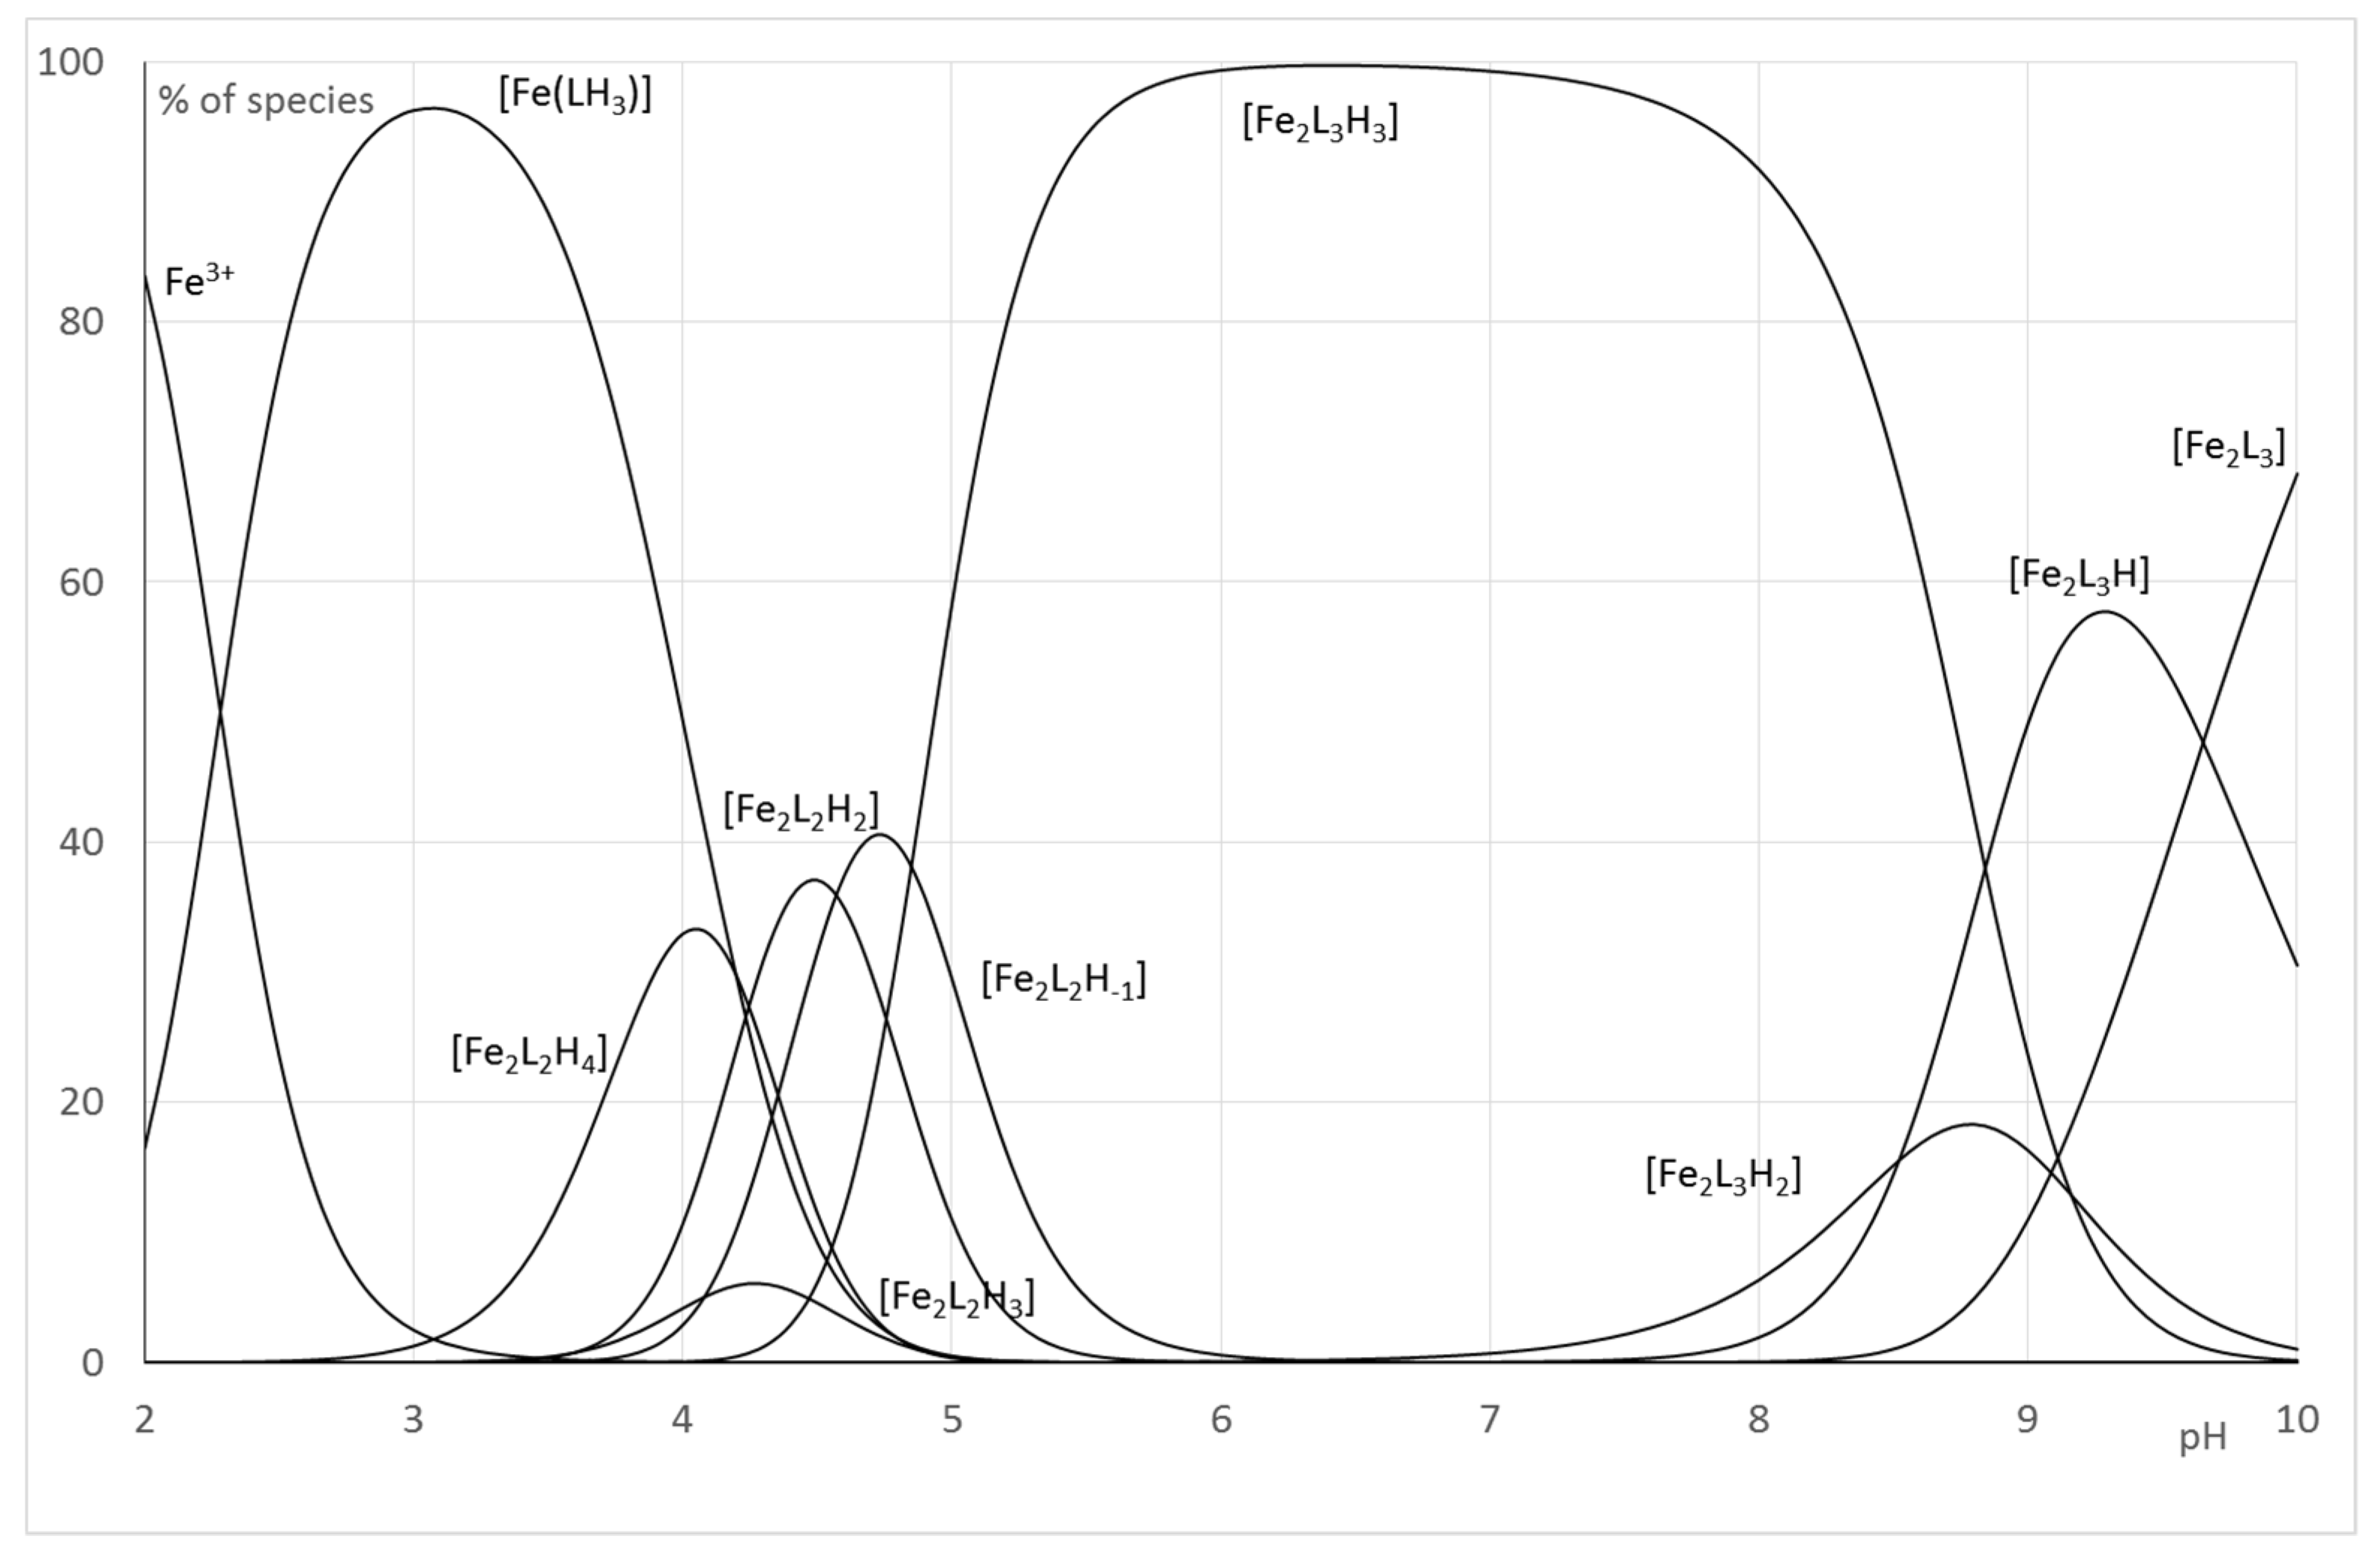
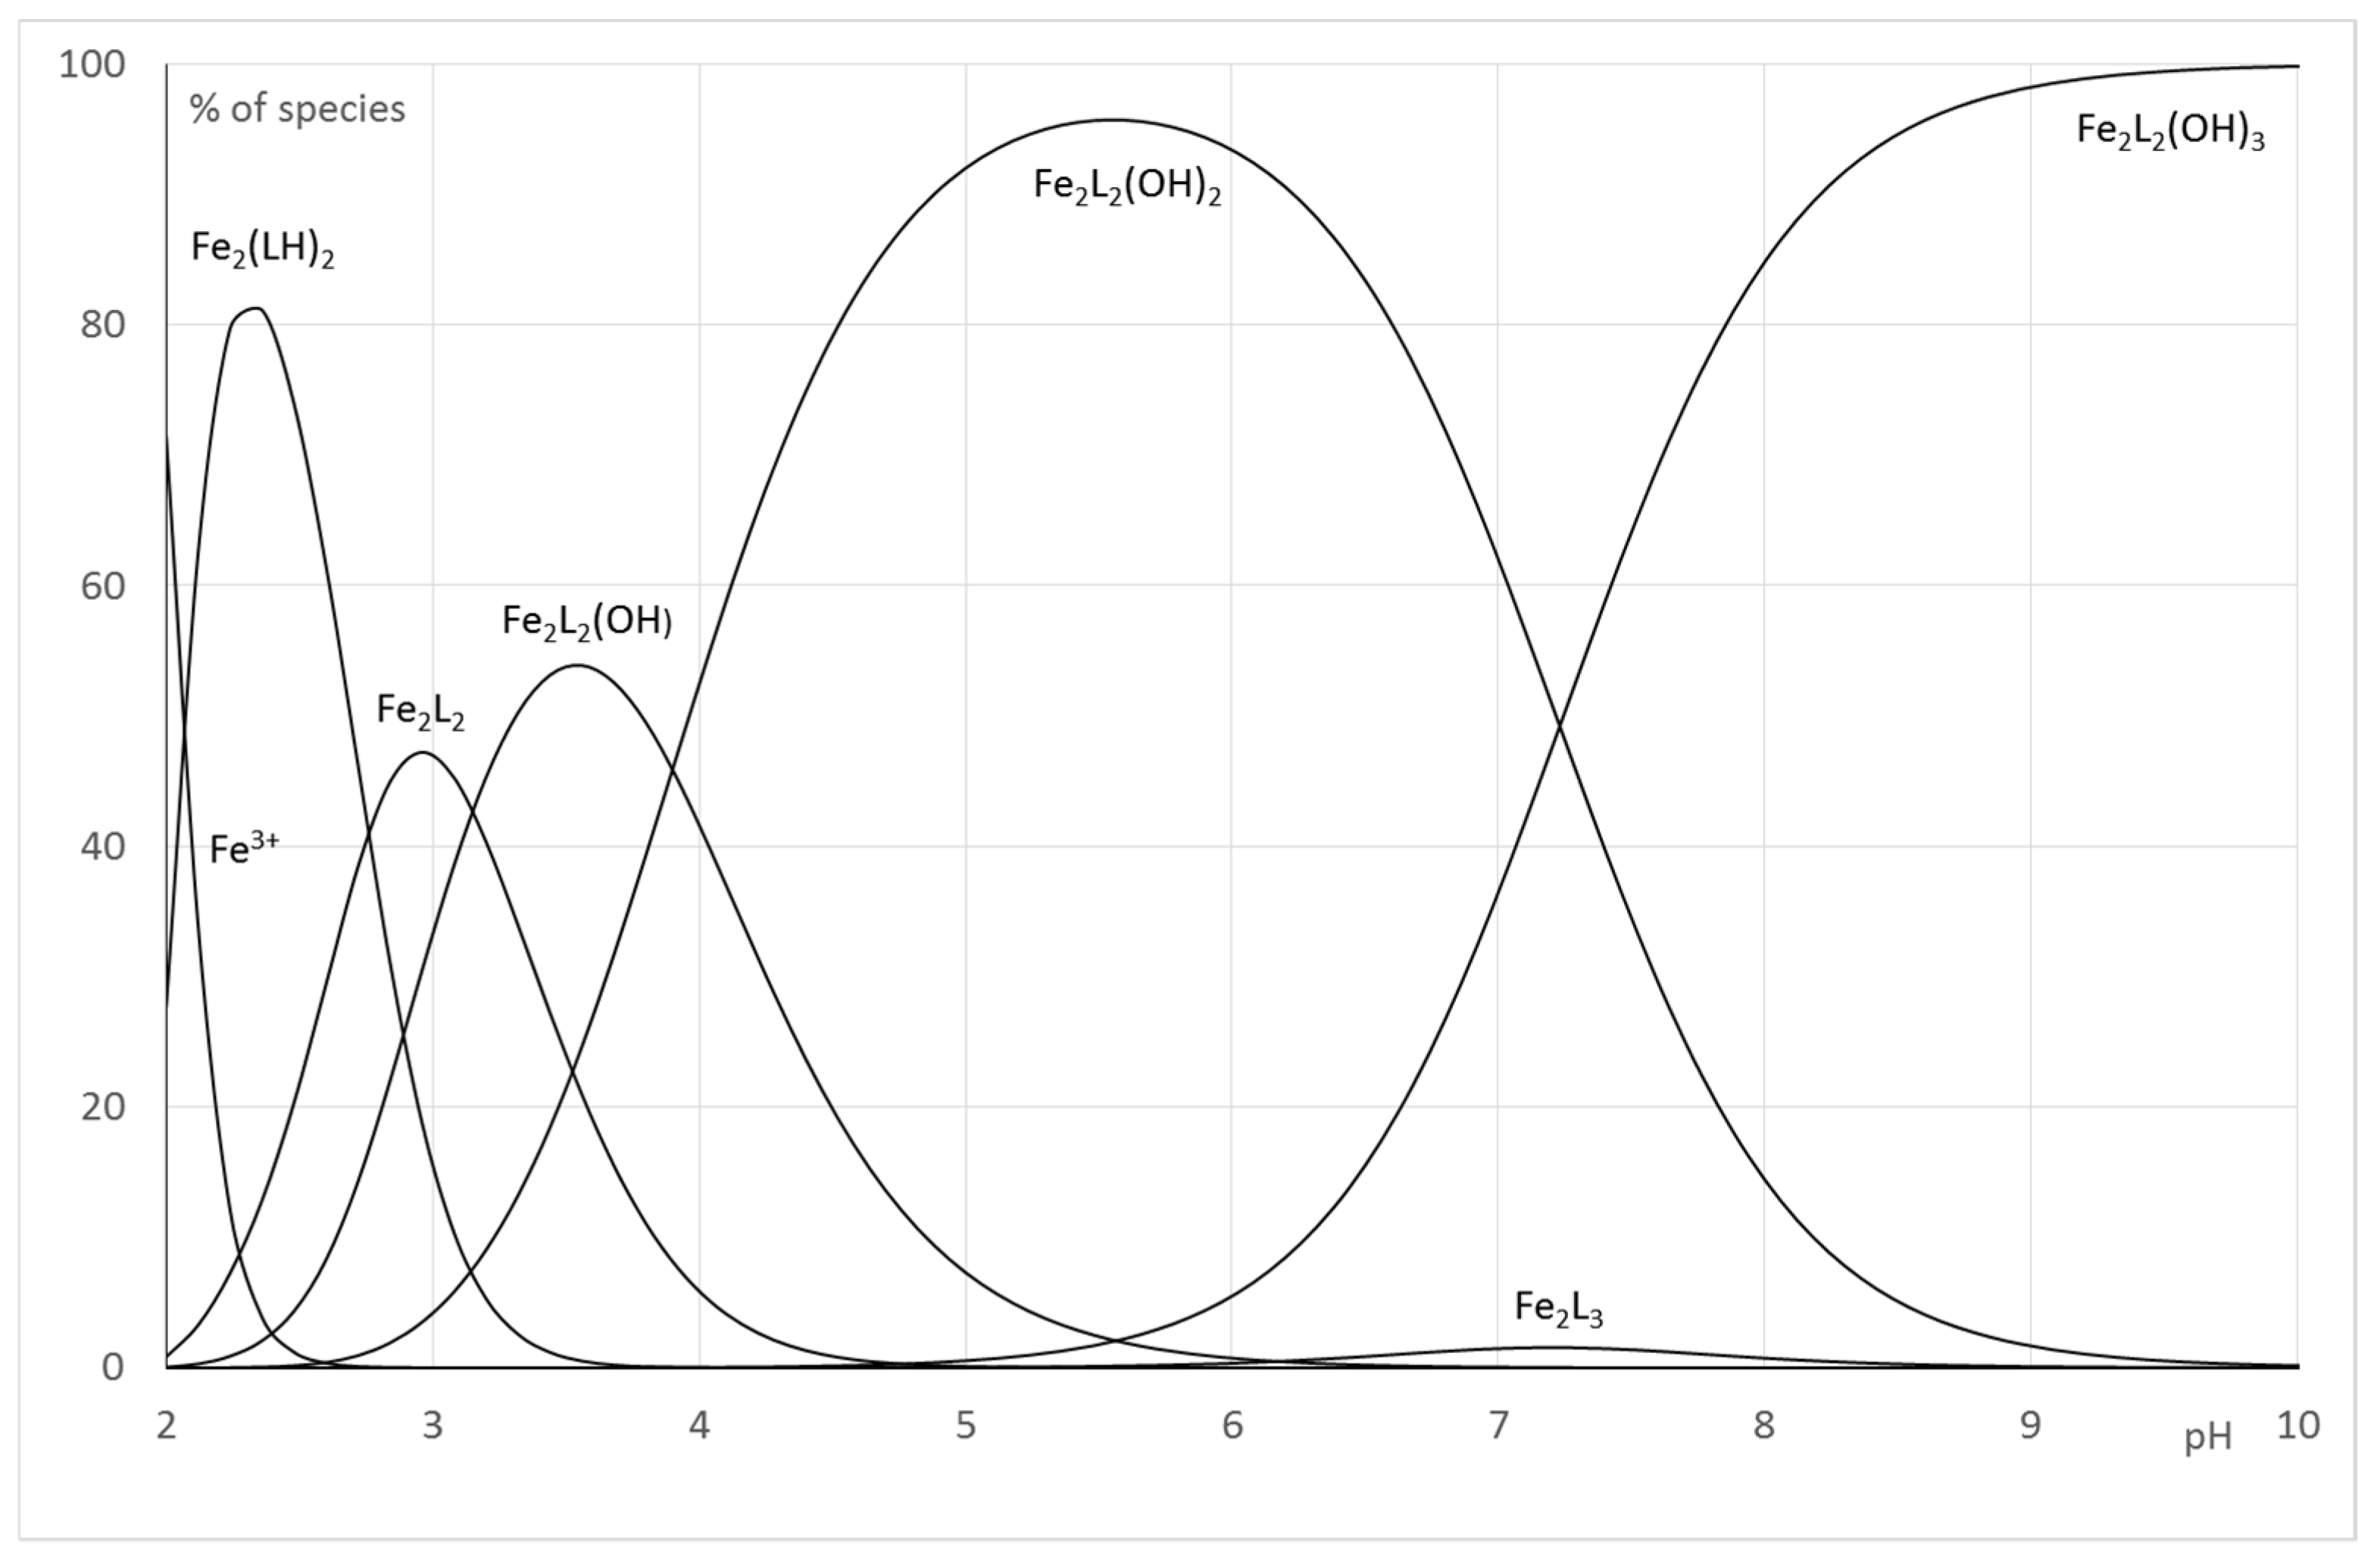
2.2.2. System Fe(III)/1(2)
2.3. Antibacterial Activities
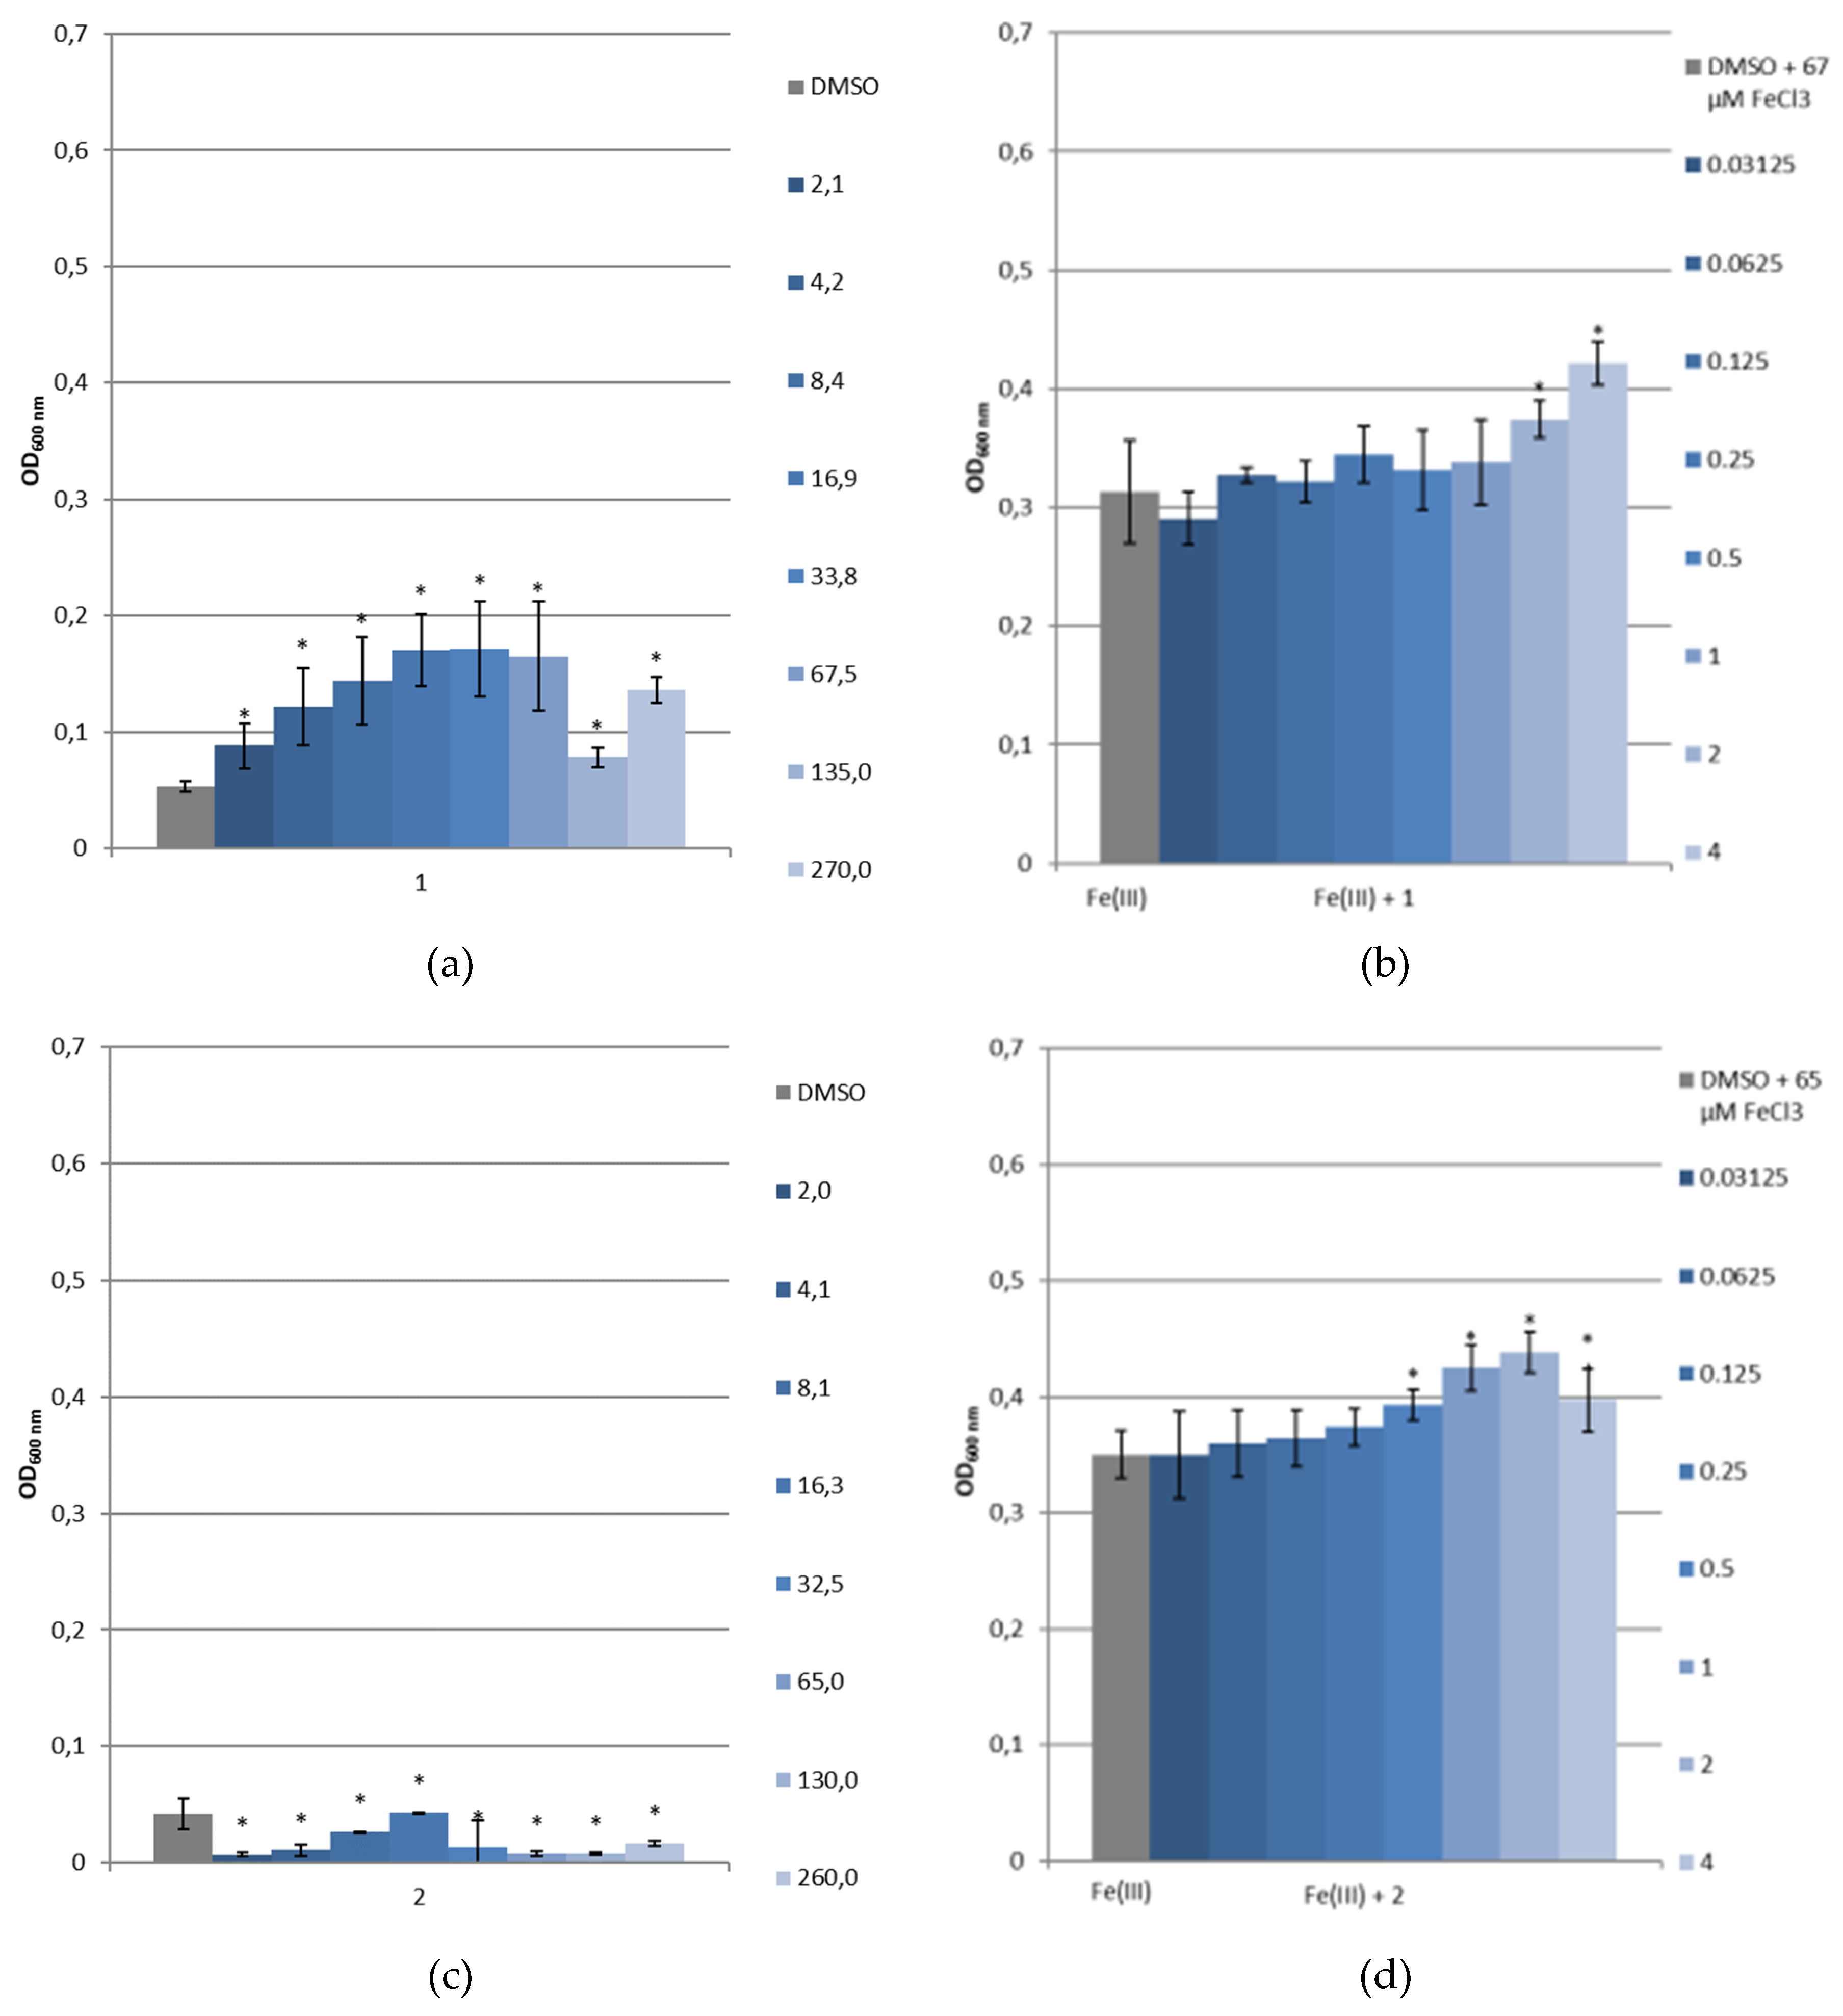
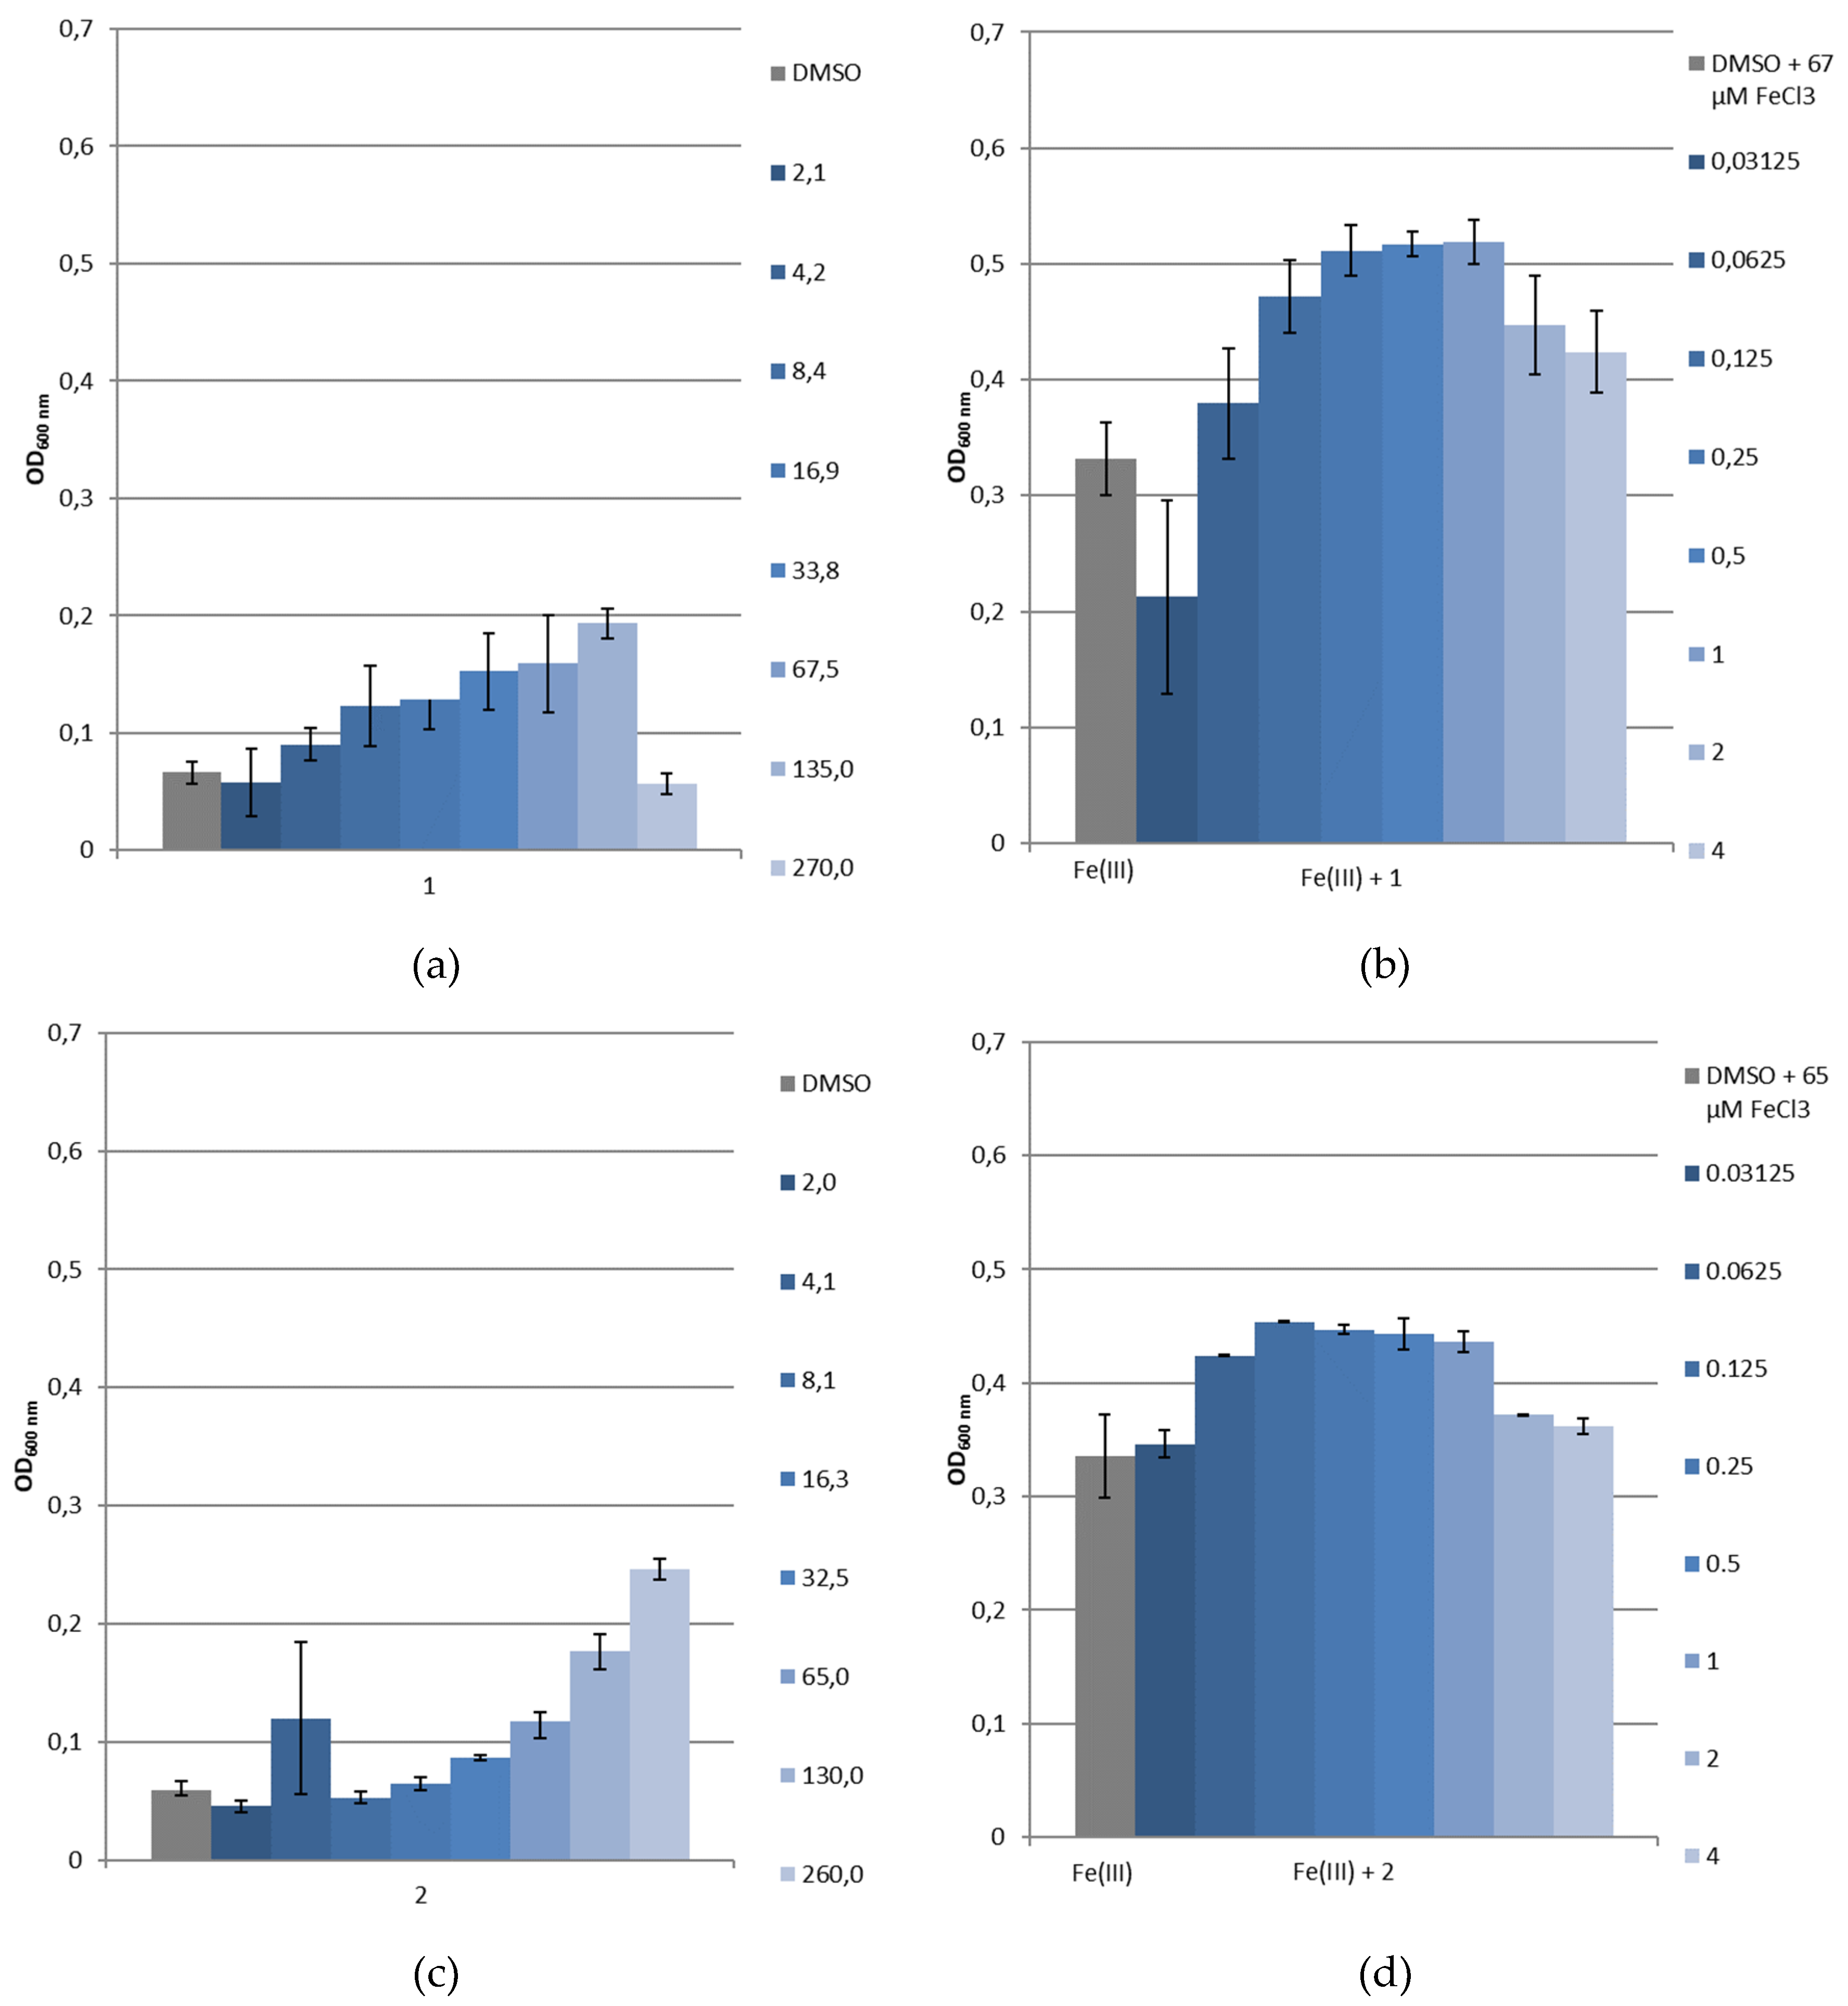
2.4. Siderophore-Like Activities
3. Materials and Methods
3.1. Synthesis
3.2. Physicochemical Studies
3.2.1. Generalities
3.2.2. ESI-MS
3.2.3. Computation
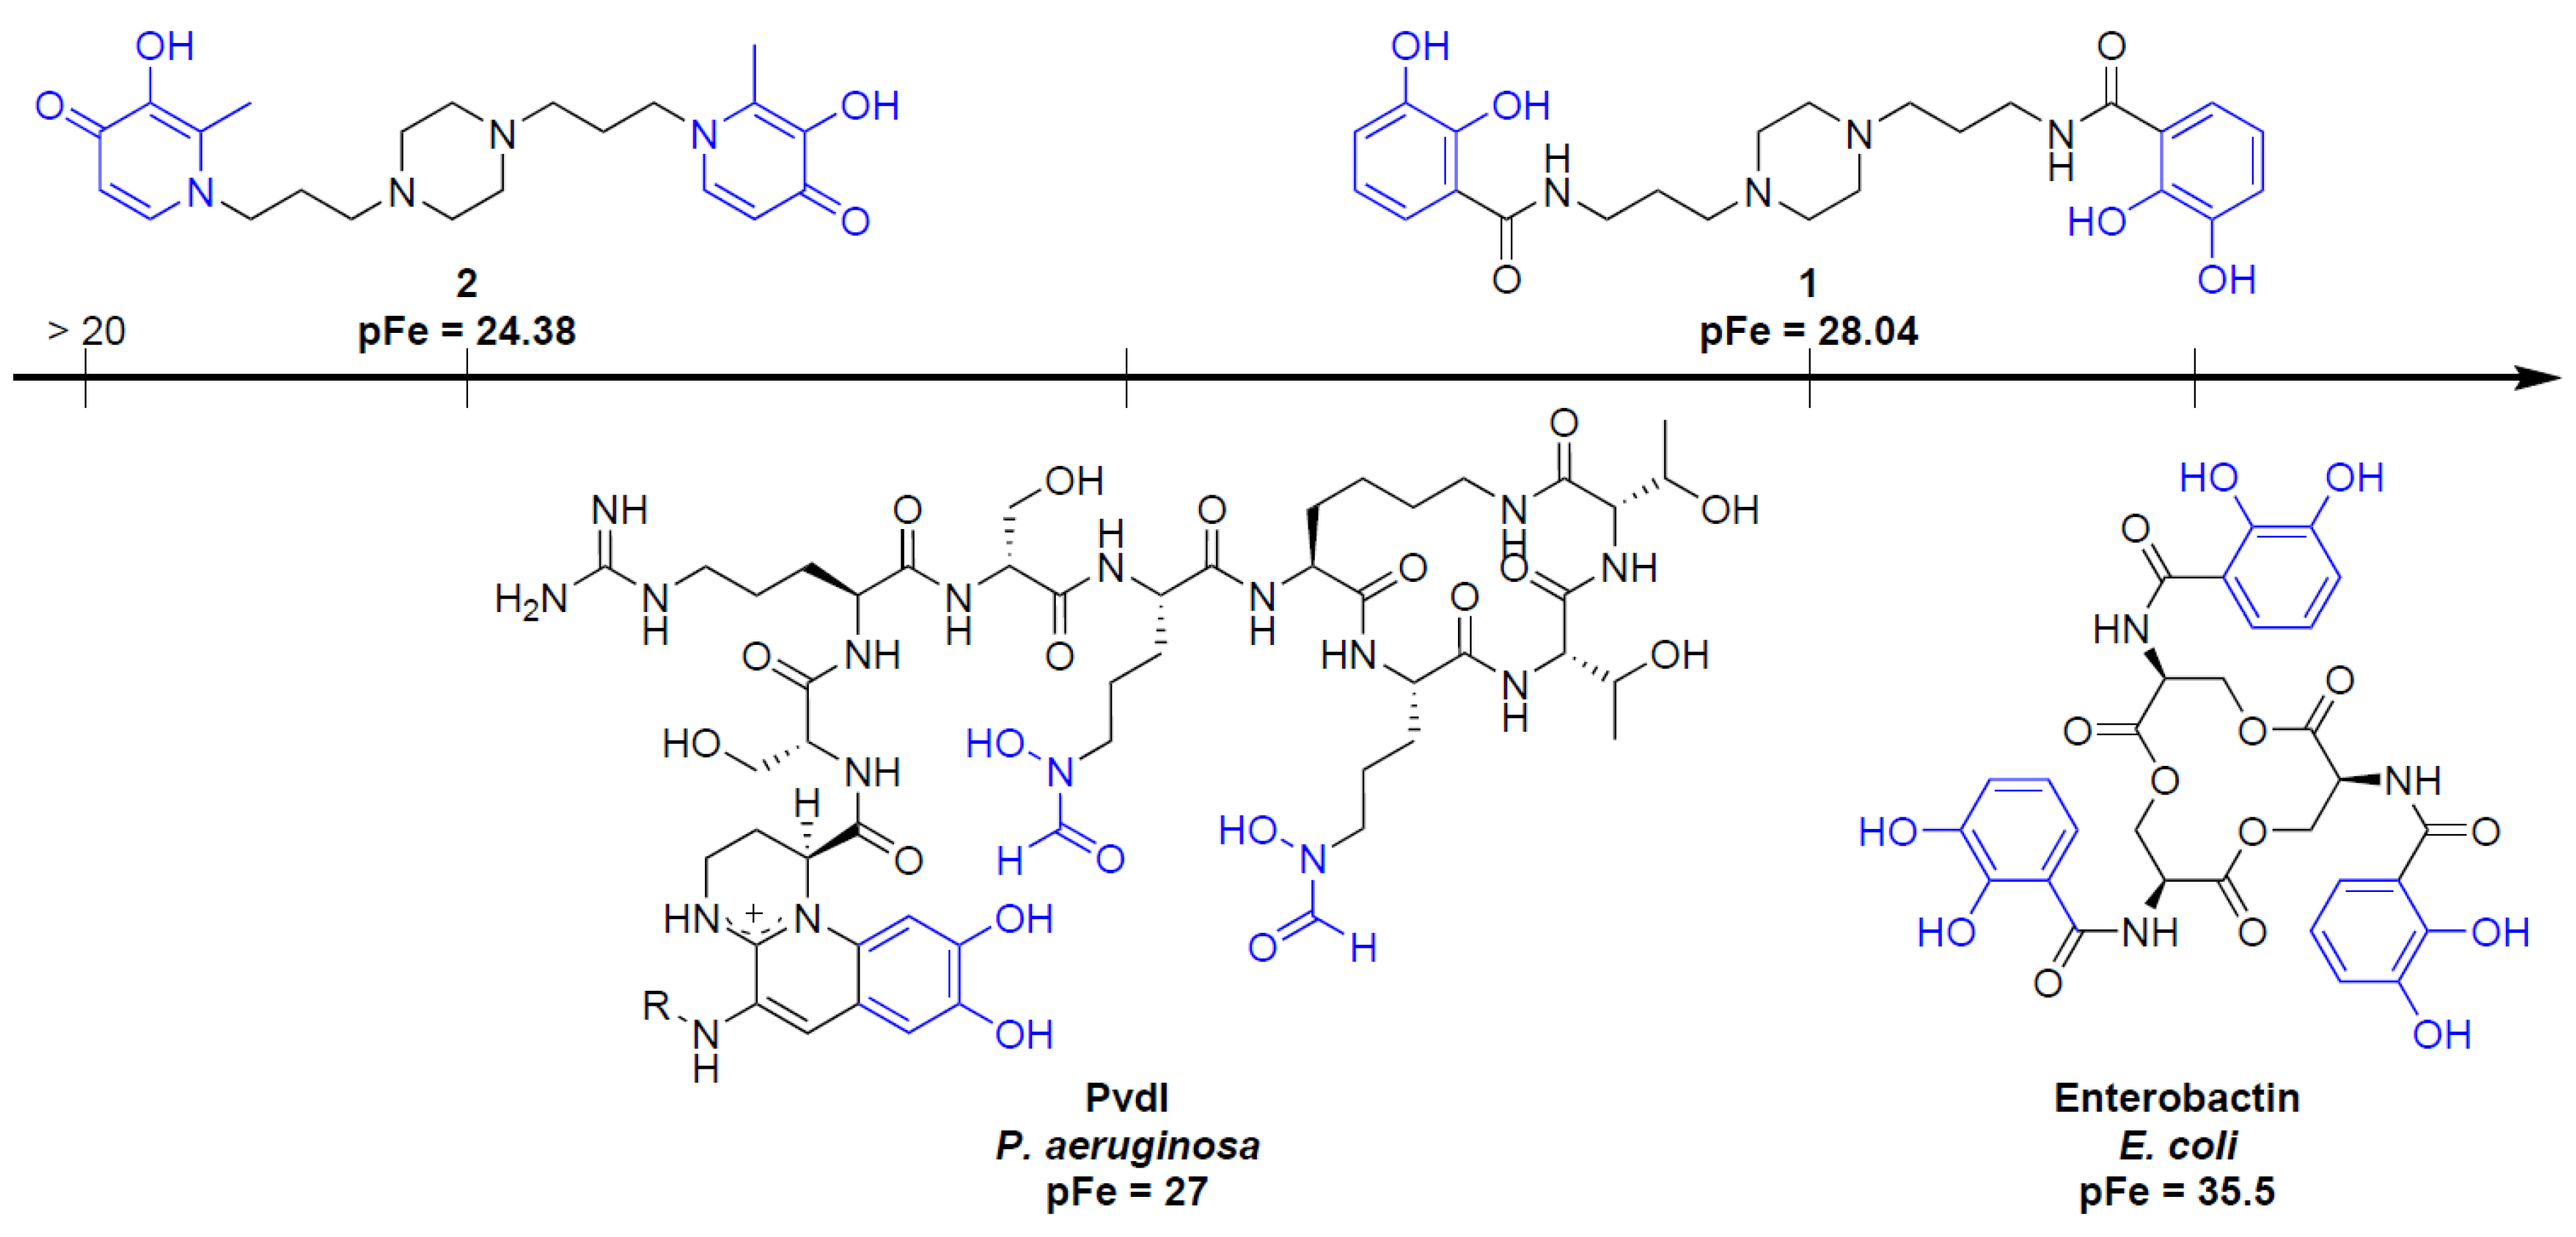
3.2.4. pFe Determination
3.3. Biological Evaluation and Siderophore-Like Activity
3.3.1. Bacterial Strains
3.3.2. Antibacterial Activity of 1 and 2
3.3.3. Cytotoxicity
3.3.4. Bacterial Growth under Restricted Iron Medium and Potential Siderophore-Like Activity
4. Conclusions
Supplementary Materials
Author Contributions
Funding
Acknowledgments
Conflicts of Interest
References
- Santé Publique France. Enquête Nationale de Prévalence des Infections Nosocomiales et Des Traitements Anti-Infectieux en Établissements de Santé, Mai-Juin 2017; Santé Publique France: Saint Maurice, France, 2018; pp. 1–12. [Google Scholar]
- Schweizer, H.P. Mechanisms of antibiotic resistance in Burkholderia pseudomallei: Implications for treatment of melioidosis. Future Microbiol. 2012, 7, 1389–1399. [Google Scholar] [CrossRef] [PubMed]
- Inglis, T.J.J.; Rolim, D.B.; Sousa, A.D.Q. Melioidosis in the Americas. Am. J. Trop. Med. Hyg. 2006, 75, 947–954. [Google Scholar] [CrossRef] [PubMed]
- Benoit, T.J.; Elrod, M.G.; Walke, H.T.; Inglis, T.J.J.; Bower, W.A.; Gee, J.E.; Doker, T.J.; Hoffmaster, A.R.; Rolim, D.B.; Blaney, D.D. A review of melioidosis cases in the Americas. Am. J. Trop. Med. Hyg. 2015, 93, 1134–1139. [Google Scholar] [CrossRef] [PubMed]
- Limmathurotsakul, D.; Golding, N.; Dance, D.A.B.; Messina, J.P.; Pigott, D.M.; Moyes, C.L.; Rolim, D.B.; Bertherat, E.; Day, N.P.J.; Peacock, S.J.; et al. Predicted global distribution of Burkholderia pseudomallei and burden of melioidosis. Nat. Microbiol. 2016, 1, 1–5. [Google Scholar] [CrossRef] [PubMed]
- Mislin, G.L.A.; Schalk, I.J. Siderophore-dependent iron uptake systems as gates for antibiotic Trojan horse strategies against Pseudomonas aeruginosa. Metallomics 2014, 6, 408–420. [Google Scholar] [CrossRef] [PubMed]
- Pham, T.; Loupias, P.; Dassonville-Klimpt, A.; Sonnet, P. Drug delivery systems designed to overcome antimicrobial resistance. Med. Res. Rev. 2019, 1–54. [Google Scholar] [CrossRef] [PubMed]
- Neilands, J.B. Iron absorption and transport in microorganisms. Annu. Rev. Nutr. 1981, 1, 27–46. [Google Scholar] [CrossRef]
- Ratledge, C. Iron metabolism and infection. Food Nutr. Bull. 2007, 28, S515–S523. [Google Scholar] [CrossRef]
- Pollack, J.R.; Neilands, J.B. Enterobactin, an iron transport compound from Salmonella Typhimurium. Biochem. Biophys. Res. Commun. 1970, 38, 4. [Google Scholar] [CrossRef]
- Neilands, J.B. Siderophores: Structure and function of microbial iron transport compounds. J. Biol. Chem. 1995, 270, 26723–26726. [Google Scholar] [CrossRef]
- Braun, V.; Killmann, H. Bacterial solutions to the iron-supply problem. Trends Biochem. Sci. 1999, 24, 104–109. [Google Scholar] [CrossRef]
- Hider, R.C.; Kong, X. Chemistry and biology of siderophores. Nat. Prod. Rep. 2010, 27, 637–657. [Google Scholar] [CrossRef] [PubMed]
- Nader, M.; Journet, L.; Meksem, A.; Guillon, L.; Schalk, I.J. Mechanism of ferripyoverdine uptake by Pseudomonas aeruginosa outer membrane transporter FpvA: No diffusion channel formed at any time during ferrisiderophore uptake. Biochemistry 2011, 50, 2530–2540. [Google Scholar] [CrossRef] [PubMed]
- Valappil, S.P.; Yiu, H.H.P.; Bouffier, L.; Hope, C.K.; Evans, G.; Claridge, J.B.; Higham, S.M.; Rosseinsky, M.J. Effect of novel antibacterial gallium-carboxymethyl cellulose on Pseudomonas aeruginosa. Dalton Trans. 2013, 42, 1778–1786. [Google Scholar] [CrossRef]
- Page, M.G.P.; Dantier, C.; Desarbre, E. In vitro properties of BAL30072, a novel siderophore sulfactam with activity against multiresistant Gram-Negative bacilli. Antimicrob. Agents Chemother. 2010, 54, 2291–2302. [Google Scholar] [CrossRef]
- Schell, M.A.; Zhao, P.; Wells, L. Outer membrane proteome of Burkholderia pseudomallei and Burkholderia mallei from diverse growth conditions. J. Proteome Res. 2011, 10, 2417–2424. [Google Scholar] [CrossRef]
- Mima, T.; Kvitko, B.H.; Rholl, D.A.; Page, M.G.P.; Desarbre, E.; Schweizer, H.P. In vitro activity of BAL30072 against Burkholderia pseudomallei. Int. J. Antimicrob. Agents 2011, 38, 157–159. [Google Scholar] [CrossRef]
- Luscher, A.; Moynié, L.; Auguste, P.S.; Bumann, D.; Mazza, L.; Pletzer, D.; Naismith, J.H.; Köhler, T. TonB-dependent receptor repertoire of Pseudomonas aeruginosa for uptake of siderophore-drug conjugates. Antimicrob. Agents Chemother. 2018, 62, 1–11. [Google Scholar] [CrossRef]
- Portsmouth, S.; van Veenhuyzen, D.; Echols, R.; Machida, M.; Ferreira, J.C.A.; Ariyasu, M.; Tenke, P.; Nagata, T.D. Cefiderocol versus imipenem-cilastatin for the treatment of complicated urinary tract infections caused by Gram-negative uropathogens: A phase 2, randomised, double-blind, non-inferiority trial. Lancet Infect. Dis. 2018, 18, 1319–1328. [Google Scholar] [CrossRef]
- Ito, A.; Sato, T.; Ota, M.; Takemura, M.; Nishikawa, T.; Toba, S.; Kohira, N.; Miyagawa, S.; Ishibashi, N.; Matsumoto, S.; et al. In vitro antibacterial properties of cefiderocol, a novel siderophore cephalosporin, against Gram-Negative bacteria. Antimicrob. Agents Chemother. 2018, 62, 1–11. [Google Scholar] [CrossRef]
- Fardeau, S.; Dassonville-Klimpt, A.; Audic, N.; Sasaki, A.; Pillon, M.; Baudrin, E.; Mullié, C.; Sonnet, P. Synthesis and antibacterial activity of catecholate—Ciprofloxacin conjugates. Bioorg. Med. Chem. 2014, 22, 4049–4060. [Google Scholar] [CrossRef] [PubMed]
- Antonietti, V.; Boudesocque, S.; Dupont, L.; Farvacques, N.; Cézard, C.; Da Nascimento, S.; Raimbert, J.F.; Socrier, L.; Robin, T.J.; Morandat, S.; et al. Synthesis, iron(III) complexation properties, molecular dynamics simulations and P. aeruginosa siderophore-like activity of two pyoverdine analogs. Eur. J. Med. Chem. 2017, 137, 338–350. [Google Scholar] [CrossRef] [PubMed]
- Rathi, A.K.; Syed, R.; Shin, H.S.; Patel, R.V. Piperazine derivatives for therapeutic use: A patent review (2010-present). Expert Opin. Ther. Pat. 2016, 26, 777–797. [Google Scholar] [CrossRef] [PubMed]
- Magotra, A. Physicochemical, pharmacokinetic, efficacy and toxicity profiling of a potential nitrofuranyl methyl piperazine derivative IIIM-MCD-211 for oral tuberculosis therapy via in-silico–in-vitro–in-vivo approach. Pulm. Pharmacol. Ther. 2018, 48, 151–160. [Google Scholar] [CrossRef]
- Kharb, R.; Bansal, K.; Sharma, A.K. A valuable insight into recent advances on antimicrobial activity of piperazine derivatives. Pharma Chem. 2012, 4, 2470–2488. [Google Scholar]
- Schiller, D.; Fung, H. Posaconazole: An extended-spectrum triazole antifungal agent. Clin. Ther. 2007, 29, 1862–1886. [Google Scholar] [CrossRef] [PubMed]
- Kern, W.V.; Steinke, P.; Schumacher, A.; Schuster, S. Effect of 1-(1-naphthylmethyl)-piperazine, a novel putative efflux pump inhibitor, on antimicrobial drug susceptibility in clinical isolates of Escherichia coli. J. Antimicrob. Chemother. 2006, 57, 339–343. [Google Scholar] [CrossRef]
- Leite, A.; Silva, A.M.G.; Nunes, A.; Andrade, M.; Sousa, C.; Cunha-Silva, L.; Gameiro, P.; de Castro, B.; Rangel, M. Novel tetradentate chelators derived from 3-hydroxy-4-pyridinone units: Synthesis, characterization and aqueous solution properties. Tetrahedron 2011, 67, 4009–4016. [Google Scholar] [CrossRef]
- Gao, J.; Xing, F.; Bai, Y.; Zhu, S. Synthesis, spectroscopy, and binding constants of ketocatechol-containing iminodiacetic acid and its Fe(III), Cu(II), and Zn(II) complexes and reaction of Cu(II) complex with H2O2 in aqueous solution. Dalton Trans. 2014, 43, 7964–7978. [Google Scholar] [CrossRef]
- Allam, A.; Dechamps-Olivier, I.; Behr, J.B.; Dupont, L.; Plantier-Royon, R. Thermodynamic, spectroscopic studies and catechol oxidase activity of copper (II) complexes with amphiphilic d-galacturonic acid derived ligands. Inorg. Chim. Acta 2011, 366, 310–319. [Google Scholar] [CrossRef]
- Nurchi, V.M.; Crisponi, G.; Pivetta, T.; Donatoni, M.; Remelli, M. Potentiometric, spectrophotometric and calorimetric study on iron(III) and copper(II) complexes with 1,2-dimethyl-3-hydroxy-4-pyridinone. J. Inorg. Biochem. 2008, 102, 684–692. [Google Scholar] [CrossRef] [PubMed]
- Charkoudian, L.K.; Franz, K.J. Fe(III)-coordination properties of neuromelanin components: 5,6-dihydroxyindole and 5,6-dihydroxyindole-2-carboxylic acid. Inorg. Chem. 2006, 45, 3657–3664. [Google Scholar] [CrossRef] [PubMed]
- Elhabiri, M.; Carrër, C.; Marmolle, F.; Traboulsi, H. Complexation of iron(III) by catecholate-type polyphenols. Inorg. Chim. Acta 2007, 360, 353–359. [Google Scholar] [CrossRef]
- Miethke, M.; Marahiel, M.A. Siderophore-based iron acquisition and pathogen control. Microbiol. Mol. Biol. Rev. 2007, 71, 413–451. [Google Scholar] [CrossRef] [PubMed]
- Cézard, C.; Farvacques, N.; Sonnet, P. Chemistry and biology of pyoverdines, Pseudomonas primary siderophores. Curr. Med. Chem. 2015, 22, 165–186. [Google Scholar] [CrossRef] [PubMed]
- Albrecht-Gary, A.M.; Blanc, S.; Rochel, N.; Ocaktan, A.Z.; Abdallah, M.A. Bacterial iron transport: Coordination properties of pyoverdin PaA, a peptidic siderophore of Pseudomonas aeruginosa. Inorg. Chem. 1994, 33, 6391–6402. [Google Scholar] [CrossRef]
- Clinical and Laboratory Standards Institute (Ed.) Methods for Dilution Antimicrobial Susceptibility Tests for Bacteria That Grow Aerobically: M07-A10; Approved Standard; Committee for Clinical Laboratory Standards: Wayne, PA, USA, 2015; ISBN 978-1-56238-987-1. [Google Scholar]
- Takase, H.; Nitanai, H.; Hoshino, K.; Otani, T. Impact of siderophore production on Pseudomonas aeruginosa infections in immunosuppressed mice. Infect. Immun. 2000, 68, 1834–1839. [Google Scholar] [CrossRef]
- Meyer, J.M.; Abdallah, M.A. The fluorescent pigment of Pseudomonas fluorescens: Biosynthesis, purification and physicochemical properties. J. Gen. Microbiol. 1978, 107, 319–328. [Google Scholar] [CrossRef]
- Bergeron, R.J.; Bharti, N.; Singh, S.; McManis, J.S.; Wiegand, J.; Green, L.G. Vibriobactin antibodies: A vaccine strategy. J. Med. Chem. 2009, 52, 3801–3813. [Google Scholar] [CrossRef]
- Senko, M. Isopro 3.0 MS/MS Software; National High Magnetic Field Laboratory: Sunnyvale, CA, USA, 2017. [Google Scholar]
- Fournaise, R.; Petitfaux, C. Etude de la formation des complexes en solution aqueuse-III Nouvelle méthode d’affinement des constantes de stabilité des complexes et des autres paramètres des titrages protométriques. Talanta 1987, 34, 385–395. [Google Scholar] [CrossRef]
- Gans, P.; Sabatini, A.; Vacca, A. Investigation of equilibria in solution. Determination of equilibrium constants with the HYPERQUAD suite of programs. Talanta 1996, 43, 1739–1753. [Google Scholar] [CrossRef]
- Alderighi, L.; Gans, P.; Ienco, A.; Peters, D.; Sabatini, A.; Vacca, A. Hyperquad simulation and speciation (HySS): A utility program for the investigation of equilibria involving soluble and partially soluble species. Coord. Chem. Rev. 1999, 184, 311–318. [Google Scholar] [CrossRef]
- Steinhauser, S.; Heinz, U.; Bartholomä, M.; Weyhermüller, T.; Nick, H.; Hegetschweiler, K. Complex formation of ICL670 and related ligands with Fe(III) and Fe(II). Eur. J. Inorg. Chem. 2004, 2004, 4177–4192. [Google Scholar] [CrossRef]
- Rouge, P.; Dassonville-Klimpt, A.; Cézard, C.; Boudesocque, S.; Ourouda, R.; Amant, C.; Gaboriau, F.; Forfar, I.; Guillon, J.; Guillon, E.; et al. Synthesis, physicochemical studies, molecular dynamics simulations, and metal-ion-dependent antiproliferative and antiangiogenic properties of cone ICL670-substituted calix [4] arenes. ChemPlusChem 2012, 77, 1001–1016. [Google Scholar] [CrossRef] [PubMed]
- Lowry, R. Mann-Whitney Test. Available online: http://vassarstats.net (accessed on 17 October 2019).


| 1 | 2 | |
|---|---|---|
| pKa1 | 2.39 (4) 1 | 2.21 (5) |
| pKa2 | 3.66 (4) | 2.82 (3) |
| pKa3 | 6.99 (6) | 3.72 (8) |
| pKa4 | 8.67 (8) | 7.17 (2) |
| pKa5 | - | 11.09 (1) |
| pKa6 | - | 11.79 (2) |
| Log β 1 | Log β 2 | ||
|---|---|---|---|
| Fe(LH) | log | 18.17 (6)1 | - |
| Fe2(LH)2 | log | 67.25 (3) | |
| Fe2L2 | log | 31.87 (6) | 61.73 (4) |
| Fe2L(LH−1) or Fe2L2(OH) | log | 27.0 (5) | 58.58 (4) |
| Fe2(LH−1)2 or Fe2L2(OH)2 | log | 23.4 (1) | 54.68 (5) |
| Fe2(LH−2)(LH−1) or Fe2L2(OH)3 | log | 18.8 (1) | 47.45 (6) |
| Fe2L3 | log | 79.43 (1) | |
| Fe2(LH−1)3 | log | 27.92 (3) | |
| Fe2(LH−1)2(LH−2) | log | 18.8 (5) | |
| Fe2(LH−1)(LH−2)2 | log | 10.2 (6) | |
| Fe2(LH−2)3 | log | 0.6 (1) |
| Activity | Cytotoxicity | |
|---|---|---|
| Compound | MIC 1 (mg·L−1) | IC50 2 (mmol·L−1) |
| 1 | >512 (MH) 3 >512 (SMM) 4 | >100 |
| 2 | >512 (MH) >512 (SMM) | >100 |
| Ciprofloxacin | 0.5 (MH) 0.5 (SMM) | - |
| Activity | Cytotoxicity | |
|---|---|---|
| Compound | MIC 1 (mg.L−1) | IC50 2 (mmol.L−1) |
| Ga(III)-1 | >512 (MH) 3 >512 (SMM) 4 | >100 |
| Ga(III)-2 | >512 (MH) >512 (SMM) | >100 |
© 2019 by the authors. Licensee MDPI, Basel, Switzerland. This article is an open access article distributed under the terms and conditions of the Creative Commons Attribution (CC BY) license (http://creativecommons.org/licenses/by/4.0/).
Share and Cite
Loupias, P.; Dechamps-Olivier, I.; Dupont, L.; Vanlemmens, P.; Mullié, C.; Taudon, N.; Bouchut, A.; Dassonville-Klimpt, A.; Sonnet, P. Study of Iron Piperazine-Based Chelators as Potential Siderophore Mimetics. Pharmaceuticals 2019, 12, 160. https://0-doi-org.brum.beds.ac.uk/10.3390/ph12040160
Loupias P, Dechamps-Olivier I, Dupont L, Vanlemmens P, Mullié C, Taudon N, Bouchut A, Dassonville-Klimpt A, Sonnet P. Study of Iron Piperazine-Based Chelators as Potential Siderophore Mimetics. Pharmaceuticals. 2019; 12(4):160. https://0-doi-org.brum.beds.ac.uk/10.3390/ph12040160
Chicago/Turabian StyleLoupias, Pauline, Isabelle Dechamps-Olivier, Laurent Dupont, Pierre Vanlemmens, Catherine Mullié, Nicolas Taudon, Anne Bouchut, Alexandra Dassonville-Klimpt, and Pascal Sonnet. 2019. "Study of Iron Piperazine-Based Chelators as Potential Siderophore Mimetics" Pharmaceuticals 12, no. 4: 160. https://0-doi-org.brum.beds.ac.uk/10.3390/ph12040160