Article

Echinacea purpurea (L.) Moench: Chemical Characterization and Bioactivity of Its Extracts and Fractions

1
Centro de Investigação de Montanha (CIMO), Instituto Politécnico de Bragança, Campus de Santa Apolónia, 5300-253 Bragança, Portugal
2
Centro de Química-Vila Real (CQ-VR), Universidade de Trás-os-Montes e Alto Douro, 5001-801 Vila Real, Portugal
3
REQUIMTE/LAQV, Faculdade de Farmácia, Universidade do Porto, 4050-313 Porto, Portugal
*
Authors to whom correspondence should be addressed.
Pharmaceuticals 2020, 13(6), 125; https://0-doi-org.brum.beds.ac.uk/10.3390/ph13060125
Submission received: 30 May 2020 / Revised: 17 June 2020 / Accepted: 17 June 2020 / Published: 20 June 2020
(This article belongs to the Special Issue Anticancer Compounds in Medicinal Plants)

Abstract

:
Echinacea purpurea (L.) Moench is widely known for its medicinal properties, being one of the most used medicinal plants for its immunostimulant properties. Nevertheless, there is still scarce information on its cytotoxic activity. Thus, this study aims at evaluating the cytotoxicity and antimicrobial activity of several aqueous and organic extracts of the aerial parts of this plant and chemically characterizing the obtained extracts. The analysis was performed by HPLC–DAD–ESI/MS. Fifteen compounds were identified; of these, seven were phenolic acids and eight were flavonoids. Non-polar compounds were evaluated by GC/MS, with a total of sixty-four compounds identified, and the most abundant groups were the sterols, fatty acids and long-chain hydrocarbons. The highest antimicrobial activity was exhibited by the dichloromethane, ethyl acetate, and acetone extracts. Dichloromethane and n-hexane extracts showed the highest cytotoxic activity. Therefore, they were fractionated, and the obtained fractions were also assessed for their cytotoxicity. Notwithstanding, the cytotoxicity of the extracts was superior to that of the obtained fractions, evidencing a possible synergistic effect of different compounds in the whole extracts.

1. Introduction

Taking advantage of the traditional ethnomedicinal application of a wide diversity of plants, they are now being used as a powerful tool for disease prevention [1]. Nowadays, approximately 30% of the pharmaceutical market and 11% of essential drugs (considered drugs intended for primary care) are plant-based [2]. Echinacea purpurea (L.) Moench is a perennial plant native to eastern North America that belongs to the Asteraceae family [3]. This plant species is considered a safe herbal medicine, thus, usually being used in a self-medication manner, mainly through aqueous or ethanolic extracts of the dried aerial parts or roots [4,5]. E. purpurea is considered one of the most known and used medicinal plants against a variety of treatments, such as snake bites and wound infections, and also for its anti-inflammatory, antioxidant and antitumor properties [6,7,8,9]. This plant can be used as an infusion or tincture, and it is available on the market in standardized preparation solutions (fluid forms) or in the form of capsules (containing dried E. purpurea) [10,11]. According to previous studies, the most common phytochemicals found in E. purpurea are alkamides, polysaccharides, lipoproteins, betaine, sesquiterpenes, polyacetylene, saponins and phenolic compounds (echinacoside and other caffeic acid derivatives, and chicoric acid) [6,11,12]. These classes of bioactive compounds have been described as being responsible for the mentioned biological properties. The multiple activities of this plant species indicate that several compounds may contribute to its medicinal benefits, which are also dependent on the plant part used, since the roots have been described as having more alkamides while the leaves are rich sources of flavonoids [13]. Nevertheless, so far, most studies on the bioactive properties of E. purpurea aerial parts have mainly focused on the evaluation of their immunostimulant capacity [14,15,16,17,18]. Thus, the present work aims at assessing the phenolic compounds profile of a commercial sample of E. purpurea aerial parts, and also at evaluating the antimicrobial and antiproliferative activity of different aqueous and organic extracts. Moreover, the most active extracts in terms of cytotoxic effects were fractionated by gradient elution through column chromatography on silica gel and the resulting fractions were assessed for their antiproliferative potential.

2. Results and Discussion

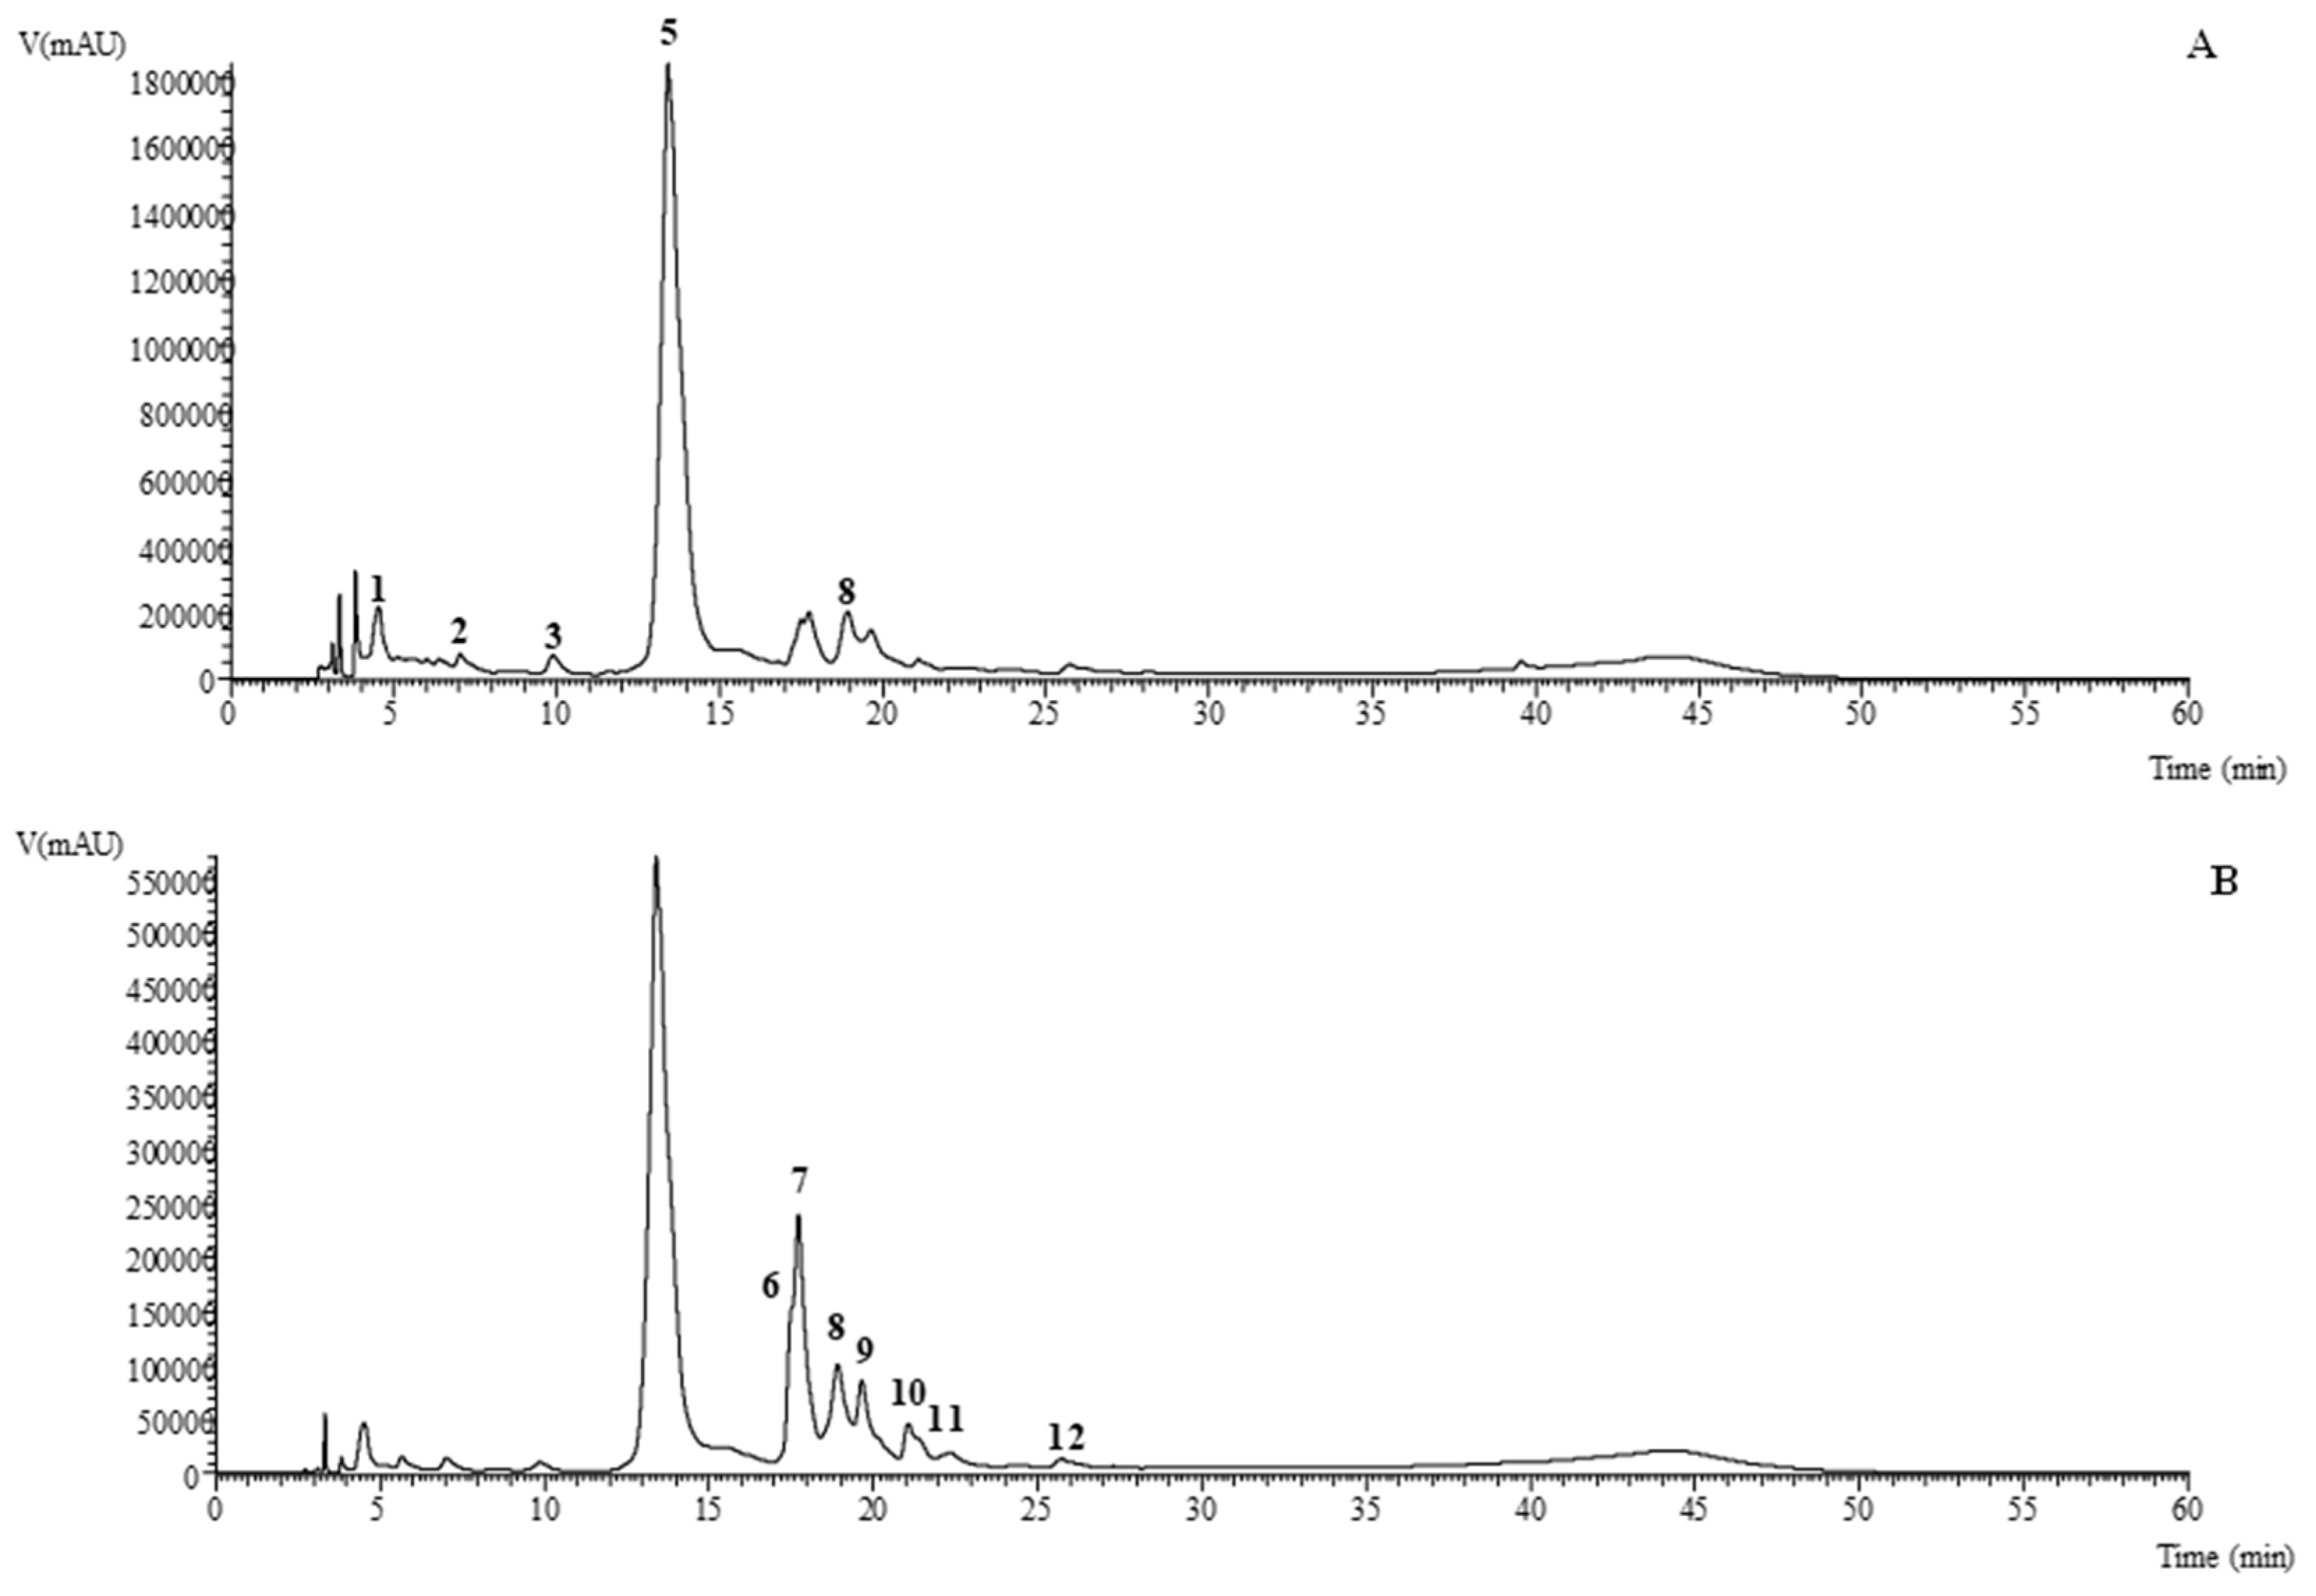
2.1. HPLC–DAD–ESI/MS Analysis of Phenolic Compounds

Table 1 presents the data (retention time, λmax, pseudomolecular ions, main fragment ions in MS2, tentative identification and quantification) obtained from the HPLC–DAD–ESI/MS analysis of the EtOAc, acetone, MeOH, infusion and decoction extracts of E. purpurea. An exemplificative chromatogram of the phenolic profile recorded at 280 and 370 nm of the methanolic extract is shown in Figure 1 (the extract that presented most of the phenolic compounds tentatively identified). The n-hexane and DCM extracts were not considered for this analysis, since in non-polar or lower polarity extracts, it is not expected to detect phenolic compounds in significant amounts. Fifteen phenolic compounds were tentatively identified, namely seven phenolic acids (mainly caffeic, chicoric, p-coumaric, ferulic, and caftaric acid derivatives, corresponding to peaks 1, 2, 3, 4, 5, 8 and 14) and eight flavonoids (mainly quercetin, kaempferol, and diosmetin glycosylated derivatives, corresponding to peaks 6, 7, 9, 10, 11, 12, 13 and 15). Peaks 2, 3 and 7 were identified as 5-O-caffeoylquinic acid, caffeic acid and quercetin-3-O-rutinoside, respectively, according to their retention time, mass and UV–Vis characteristics in comparison with commercial standards. Other authors also found similar compounds in different species [19]. All the remaining compounds were tentatively identified according to their mass and UV–Vis characteristics in comparison with information found in the literature. Peaks 1 ([M-H] at m/z 311) and 4 and 5 (both presenting [M-H] at m/z 473) were tentatively identified as caftaric acid and cis and trans chicoric acid, respectively, according to their pseudomolecular ion, MS2 fragmentation and UV–Vis spectra. trans-Chicoric acid was the main compound found in the methanolic extract; however, in the infusion and the decoction, the cis form was found in higher amounts. Peaks 8 ([M-H] at m/z 487) and 14 ([M-H] at m/z 501) were tentatively identified as feruloylcaffeoyltartaric acid and p-coumaroylsinapoyltartaric acid, respectively, following the identification described by Ma et al. [20]. These type of compounds have been previously reported in E. purpurea water:methanol:formic acid (80:20:0.1, v/v/v) extracts [21].
Regarding the flavonoids identified in E. purpurea samples, kaempferol derivatives were the main compounds found in these samples. Peaks 9, 10, 11, and 13 ([M-H] at m/z 607) presented a unique MS2 fragment at m/z 285, corresponding to kaempferol aglycone, which was confirmed by its characteristic UV–Vis spectrum. Peaks 9, 10 and 11 showed a pseudomolecular ion [M-H] at m/z 593, all being tentatively identified as kaempferol-O-deoxyhexosyl-hexoside, while compound 10 was identified as kaempferol-3-O-rutinoside, showing a similar retention time to the commercial standard. Peak 13 presented a pseudomolecular ion [M-H] at m/z 607 and was tentatively identified as kaempferol-O-deoxyhexosyl-glucuronide.
Regarding the quercetin derivatives, peak 6 presented the same chromatographic characteristics as peak 7, except for its retention time, and was tentatively identified as quercetin-O-deoxyhexosyl-hexoside. Peak 12 ([M-H] at m/z 549) revealed MS2 fragments at m/z 505 (44 u), 463 (42 u), and 301 (162 u, quercetin aglycone), and was tentatively identified as quercetin-O-malonylhexoside. Finally, peak 15 ([M-H] at m/z 577) showed an MS2 fragment at m/z 299 (diosmetin moiety). Given its higher value of retention time, the −146 u should correspond to the loss of a p-coumaroyl moiety and the −132 u to a pentosyl moiety, being tentatively identified as diosmetin-O-p-coumaroyl-pentoside.
Comparing the profile obtained for the different extracts, the methanolic extract was the one that presented the highest number of phenolic compounds identified, being also the extract richest in phenolic acids (53 ± 1 mg per g of extract, mainly due to trans-chicoric acid) and flavonoids (8.6 ± 0.2 mg per g of extract, mainly due to quercetin-3-O-rutinoside). The infusion and decoction showed a similar qualitative profile, with the only difference being the presence of 5-O-caffeoylquinic acid in the former, despite being in low amounts. Only two compounds were identified in the acetone extract, with the particularity of this extract being the only one exhibiting the presence of diosmetin-O-p-coumaroyl-pentoside. The EtOAc extract was found to have only minute amounts of one compound (caffeic acid), possibly due to the low polarity of the extracting solvent. According to Brown et al. [22], methanolic extracts of the E. purpurea are rich in chicoric acid and caftaric acid.

2.2. GC/MS Analysis of Non-Polar Extracts

Table 2 presents the data obtained from the GC/MS analysis of the n-hexane and DCM extracts, which enabled the identification of 61–63% of the compounds, corresponding to a total of 64 compounds. Among those, 35 compounds were found to be present in only one of the extracts, 17 being identified in the n-hexane extract and 18 in the DCM extract. In general, the extracts revealed the presence of various bioactive compounds. Regarding the terpenes group (mono, di and sesquiterpenes), they were present in the highest amounts in the n-hexane extract, with oxygen-containing terpenes being found only in this extract. Phytol was present in both of the n-hexane and DCM extracts, but in different quantities (1.1% and 0.55%, respectively). The most abundant compounds identified in the n-hexane extract were fatty acids (25.8% of the extract) including hexadecanoic acid (palmitic acid, C16:0), 9,12-octadecadienoic acid (linoleic acid, C18:3), octadecanoic acid (stearic acid, C18:0), followed by long-chain hydrocarbons (14.6%) and sterols (13.9%). The obtained results are in agreement with those that reported the prevalence of unsaturated fatty acids, mainly linoleic acid, in the fatty-oil of E. purpurea fruits obtained by extraction with n-hexane [23]. Regarding the DCM extract, the most abundant class of identified compounds were long-chain hydrocarbons (27.1%) and fatty acids (27.8%).

2.3. Biological Properties

2.3.1. Antimicrobial Activity

The results concerning the ability of all seven extracts of E. purpurea to inhibit the growth or kill the assayed microorganisms are presented in Table 3. All tested extracts did not evidence a microbicide activity at the tested concentrations. Nevertheless, several were able to inhibit the growth of bacteria, with MICs varying between 2.5 to 20 mg/mL. The exception was the infusion extract, which did not present any activity, even at the highest tested concentration (20 mg/mL). Additionally, the decoction and the methanolic extract also evidenced low activity, with the former being able to inhibit only the growth of K. pneumoniae and the last only S. aureus (both susceptible and resistant strains). In general, the DCM, EtOAc, and acetone extracts were the ones evidencing the best antimicrobial activity, since they were capable of inhibiting the growth of all microorganisms. DCM extract showed particularly good results against Gram-positive bacteria, with Enterococcus faecalis and Listeria monocytogenes being the most susceptible ones, with a MIC value of 2.5 mg/mL. Concerning S. aureus, the strain MSSA was mostly inhibited by the acetone extract, with a MIC value of 2.5 mg/mL, while the strain MRSA was most sensitive to the DCM, EtOAc, and acetone extracts (all presenting a similar MIC value of 5 mg/mL). According to Hudson et al. [10], preparations of E. purpurea have relatively little effect on the growth of MRSA or MSSA, which was not demonstrated in the present work, since all organic extracts were able to inhibit the growth of both S. aureus strains, with the best results being obtained for the acetone extract. The n-hexane extract also evidenced the capacity of inhibiting some Gram-positive bacteria, although requiring higher MICs in general. Among the Gram-negative bacteria, the most susceptible were Morganella morganii and Escherichia coli, namely due to the DCM and EtOAc extracts, both with a MIC value of 5 mg/mL. Sharma, et al. [24] evaluated the antimicrobial activity of E. purpurea commercial extracts (corresponding to a mixture of roots and aerial parts extracted with 40% of EtOH) and concluded that several bacteria, including E. coli, K. pneumoniae, P. aeruginosa and E. faecalis, were relatively insensitive to the extracts, as only a minute reduction in colony forming units was obtained. In the present work, these four bacteria showed variable MIC values according to the assayed extract, with all of them having lower sensitivity (in general, MIC > 20 mg/mL) for the aqueous and methanolic extracts, while presenting better results for the less polar extracts. Regarding antifungal activity, C. albicans was most susceptible to the DCM and acetone extracts, showing a MIC of 5 mg/mL. This yeast also showed some susceptibility against the n-hexane and EtOAc extracts, with MIC values of 10 mg/mL. According to Barnes et al. [7], n-hexane extracts of E. purpurea roots show high activity against several yeast strains, including Saccharomyces cerevisiae and Candida albicans, which is in good agreement with the results obtained in the present work.

2.3.2. Cytotoxic Properties of Extracts and Fractions

The results obtained regarding the cytotoxic activity of the seven extracts of E. purpurea are shown in Table 4. Almost all extracts showed activity against the four human tumor cell lines, with DCM being the extract that showed the best results [GI50 = 48 ± 4 µg/mL (NCI H460), GI50 = 36.7 ± 0.6 µg/mL (HepG2), GI50 = 51 ± 4 µg/mL (HeLa) and GI50 = 21 ± 2 µg/mL (MCF-7)]. Nevertheless, all the organic extracts, with the exception of MeOH, displayed also toxicity against the non-tumor hepatic cell line (PLP2), although presenting higher GI50 values compared to those of the tumor cell lines (Table 4). Despite the MeOH extract being only effective against the HeLa (GI50 = 111 ± 9) µg/mL and MCF-7 tumor cell lines (GI50 = 76 ± 5 µg/mL), as mentioned, it presented the advantage of not showing toxicity against the PLP2 primary cell line at the maximum concentration assayed (>400 µg/mL). The infusion was able to inhibit the growth of the MCF-7 cell line and both aqueous extracts inhibit the growth of HeLa cells, however, requiring a higher GI50. In addition, none presented cytotoxicity against non-tumoral PLP2 cells. This result is worth noting since the aerial parts E. purpurea are frequently consumed in the form of infusion when used in traditional medicine.
The obtained results correlate well with the ability to inhibit the growth of cancer cell lines, reported by Aarland et al. [6], who investigated the cytotoxic capacity of the hydroalcoholic extract prepared with the aerial parts of E. purpurea against MCF-7, HeLa and HCT-15 cells and showed a higher toxicity for the HeLa cell line. Tsai et al. [25] tested a hydroethanolic extract prepared with the flower of E. purpurea, and compared it with the commercial standard compound of chicoric acid. The results showed significant inhibition of proliferation, in a dose- and time-dependent manner, in human colon cancer cells Caco-2 and HCT-116. Chicoric acid was found to decrease the telomerase activity in HCT-116 cells, inducing apoptosis in colon cancer cells. In the present work, despite chicoric acid being also the main compound in the aqueous extracts, these extracts were the ones showing the lower cytotoxic activity. However, better results were obtained for the MeOH compared to both aqueous extracts, which can be related to its significantly higher concentration in trans-chicoric acid. Previously, Chicca, et al. [26] reported that one constituent of Echinacea pallida roots, namely the acetylenic compound pentadeca-(8Z,13Z)-dien-11-yn-2-one, revealed a concentration-dependent cytotoxicity on several human cancer cell lines, including leukemia (Jurkat and HL-60), breast carcinoma (MCF-7), and melanoma (MeWo) cells. Nevertheless, in the present work, this compound was not identified in the extracts from the aerial parts of E. purpurea.
According to the obtained results (Table 4), in the present work, DCM and n-hexane extracts were the ones that showed the most promising cytotoxic activity. Therefore, these two E. purpurea extracts were selected for fractionation, and the obtained fractions were further investigated for their cytotoxicity. A total of fourteen fractions from the n-hexane extract (FH 1–14) and fifteen fractions from the DCM (FD 1–15) were obtained, with the results of their cytotoxicity being shown in Table 4. Almost all fractions from the n-hexane extract showed activity against the four human tumor cell lines, nevertheless showing a marked reduction in activity when compared to the whole extract, as the GI50 values were much higher. The same was observed for the DCM fractions, with the reduction in activity being more evident in this case since, besides higher GI50 values, five fractions did not present any cytotoxic activity at all. In both cases, the obtained results suggest a high synergic effect among the compounds present in the whole extract. Therefore, considering that all DCM and n-hexane fractions exhibited a lower cytotoxic activity compared to the whole extract, they were not further analyzed for its chemical composition. In what concerns the two whole extracts, DCM and n-hexane, by comparing their chemical composition obtained by GC–MS analysis (Table 2), it can be observed that the composition regarding the major group of compounds is somehow similar, comprising fatty acids, sterols, and long-chain hydrocarbons, thus, not justifying the differences observed in the cytotoxic assays. However, it should be noticed that, for both extracts, several compounds were not possible to be identified by the used technique (corresponding to 37.2% and 38.9% for DCM and n-hexane extracts, respectively). Most possibly, those non-identified compounds can be related with both the cytotoxic effects exhibited against the tumor and hepatic cell lines as well as the synergic effects suggested by the results obtained with the fractions.
Todd et al. [16] evaluated the effect of a 75% ethanolic extract of E. purpurea roots, and thereof, fractions on the suppression of cytokines and observed that both the fractions that contained alkylamides as well as those without detectable alkylamides displayed similar suppressive effects, allowing the authors to conclude that the ethanolic E. purpurea extract probably contains multiple constituents that differentially regulate cytokine production by macrophages.

3. Materials and Methods

3.1. Standards and Reagents

Acetonitrile 99.9% was of HPLC grade was obtained from Fisher Scientific (Lisbon, Portugal). Phenolic compound standards were obtained from Extrasynthese (Genay, France). Formic acid was obtained from Sigma-Aldrich (St. Louis, MO, USA). Water was treated in a Milli-Q water purification system (TGI Pure Water Systems, Greenville, SC, USA). Fetal Bovine Serum (FBS), solutions of penicillin (100 IU/mL) and streptomycin (10 mg/mL), RPMI-1640 medium, trypsin-EDTA (ethylenediaminetetraacetic acid), L-glutamine and Hank’s Balanced Salt Solution (HBSS) were purchased from Hyclone (Logan, USA). Acetic acid, sulforhodamine B (SRB), trypan blue, trichloroacetic acid (TCA) and Tris-base were purchased from Sigma Chemical Co. (Saint Louis, USA). Silica gel 0.060–0.200 mm 60 A was obtained from Acros Organics (Geel, Belgium).

3.2. Plant Material

Echinacea purpurea (L.) Moench (aerial parts) (150 g) were acquired from Cantinho das Aromáticas, Vila Nova de Gaia, Portugal, in September 2017. According to the supplier, E. purpurea was from a biological production, harvested when flowering and dried at 40–45 °C for three days in a dryer with controlled ventilation. The dried sample was ground to a fine powder, mixed to obtain a homogeneous sample and stored at room temperature protected from light and humidity.

3.3. Preparation of Extracts

The extracts were prepared from the powdered plant using different solvents with increasing polarities, as described by Graça et al. [27]. The extracts were separated into organic (n-hexane, dichloromethane—DCM, ethyl acetate—EtOAc, acetone, and methanol—MeOH) and aqueous (decoction and infusion) extracts.

3.3.1. Organic Extracts

For the preparation of the mentioned organic extracts, 7 g of dried plant material were submitted to a sequential extraction process based on increasing the solvent’s polarity. The plant was extracted twice with each organic solvent (500 mL) for 48 h, under vigorous stirring (150 rpm), at room temperature. The solutions were filtered under reduced pressure through a sintered Buchner glass funnel, the combined organic extracts were evaporated to dryness under reduced pressure at 40 °C (Büchi R-20, Flawil, Switzerland), and the obtained residue was further extracted with another solvent following the same procedure.

3.3.2. Aqueous Extracts

Two aqueous extracts were prepared: decoction and infusion. For the former, the dried sample (1 g) was added to 100 mL of distilled water and boiled for 5 min; the infusion extract was obtained by adding the dried sample (1 g) in 100 mL of boiling water and left to stand for 5 min at room temperature. The mixtures were filtered under reduced pressure through a sintered glass Buchner funnel, and further frozen and lyophilized.

3.4. Fractionation of the Extracts

Fractionation was carried out in the extracts that showed promising results in the bioactivity assays, namely DCM and n-hexane extracts. The procedure was conducted based on the methodology described by Graça et al. [28], with some modifications.

3.4.1. Dichloromethane Extracts

The extract was diluted in the minimum amount of CH2Cl2, and a small amount of silica gel was added. The mixture was evaporated to dryness at 40 °C under reduced pressure and, afterwards, placed on the top of a silica gel column. The dry-loaded extract was fractionated by gradient elution column chromatography (20 × 400 mm) using: CH2Cl2; CH2Cl2/EtOAc—(9:1), (8:2), (7:3), (6:4), (5:5), (4:6), (3:7), (2:8), (1:9); EtOAc; EtOAc/acetone—(9:1), (8:2), (7:3), (6:4), (5:5), (6:4), (7:3), (8:2), (9:1); acetone; acetone/MeOH—(9:1), (8:2), (7:3), (6:4), (5:5), (4:6), (3:7), (2:8), (1:9); MeOH; MeOH/formic acid (99:1), (97:3), (95:5). A total of seven hundred and twenty-four eluates (∼23 mL each) were collected and grouped into fifteen fractions (FD 1–15), according to the similarity of their TLC profiles [silica gel, CH2Cl2/MeOH—(99:1), stained with 50% H2SO4 in MeOH, heating]. The solvent of these final fractions was removed under reduced pressure until dryness.

3.4.2. n-Hexane Extracts

For the n-hexane extract, a fractionation procedure similar as described for the DCM extract was used. The gradient elution using the same solvents/mixture of solvents allowed collecting of a total of eight hundred and thirty-six samples (~23 mL each), which were collected and grouped in fourteen fractions (FH 1–14), according to the similarity of their TLC profiles [silica gel, CH2Cl2/MeOH—(99:1), stained with 50% H2SO4 in MeOH, heating]. The solvent of these final fractions was removed under reduced pressure until complete dryness.

3.5. Chemical Characterization

3.5.1. Analysis of Phenolic Compounds by HPLC–DAD–ESI/MS

The phenolic compounds present in E. purpurea extracts were analyzed as described in Bessada et al. [29], with minor modifications. The EtOAc and acetone extracts were dissolved in MeOH, while the methanol extract was dissolved in MeOH/H2O (1:4, v/v), and the infusion and the decoction extracts were dissolved in distilled H2O, at a final concentration of 5 mg/mL, and filtered through a 0.22 µm disposable LC filter disk. All the extracts were analyzed using a Dionex Ultimate 3000 UPLC (Thermo Scientific, San Jose, CA, USA) system equipped with a diode array detector coupled to an electrospray ionization mass detector (LC-DAD-ESI/MSn), a quaternary pump, an autosampler (kept at 5 °C), a degasser and an automated thermostatized column compartment. Chromatographic separation was achieved with a Waters Spherisorb S3 ODS-2 C18 (3 μm, 4.6 × 150 mm, Waters, Milford, MA, USA), column thermostatized at 35 °C. The solvents used were: (A) 0.1% formic acid in water, (B) acetonitrile. The elution gradient established was the following: 15% B (5 min), 15% B to 20% B (5 min), 20–25% B (10 min), 25–35% B (10 min), 35–50% B (10 min), and re-equilibration of the column, using a flow rate of 0.5 mL/min. Double online detection was carried out in the DAD (using 280, 330 and 370 nm as preferred wavelengths) and in a mass spectrometer (MS) connected to a HPLC system via the DAD cell outlet. MS detection was performed in the negative mode, using a Linear Ion Trap LTQ XL mass spectrometer (Thermo Finnigan, San Jose, CA, USA) equipped with an ESI source. Nitrogen served as the sheath gas (50 psi); the system was operated with a spray voltage of 5 kV, a source temperature of 325 °C, and a capillary voltage of −20 V. The tube lens offset was kept at a voltage of −66 V. The full scan covered the mass range from m/z 100 to 1500. The collision energy used was 35 (arbitrary units). Data acquisition was carried out with Xcalibur® data system (Thermo Finnigan, San Jose, CA, USA). The phenolic compounds were identified by comparing their retention times, UV–Vis and mass spectra with those obtained from standard compounds, when available. Otherwise, compounds were tentatively identified comparing the obtained information with available data reported in the literature. For quantitative analysis, 7-level calibration curves for each available phenolic standard was constructed based on the UV signal of caffeic acid (y = 388345x + 406369, R2 = 0.999, LOD = 0.78 µg/mL and LOQ = 1.97 µg/mL), ferulic acid (y = 633126x − 185462, R2 = 0.999, LOD = 1.85 µg/mL and LOQ = 5.61 µg/mL), p-coumaric acid (y = 301950x + 6966.7, R2 = 0.9999, LOD = 1.10 µg/mL and LOQ = 3.32 µg/mL), and quercetin-3-O-rutinoside (y = 13343x + 76751, R2 = 0.999, LOD = 0.21 µg/mL and LOQ = 0.71 µg/mL). For the identified phenolic compounds, for which a commercial standard was not available, the quantification was performed through the calibration curve of the most similar available standard (Figure S1, Supplementary Material). The results were expressed as mg per g of extract.

3.5.2. Analysis of Non-Polar Compounds by GC–MS

E. purpurea n-hexane and DCM extracts were chemically characterized by GC–MS after sample derivatization. A portion of the N-hexane and DCM extracts (50 mg) was dissolved in 600 μL of bis-(trimethylsilyl) trifluoroacetamide (BSTFA; PanReac AppliChem, Germany) and the mixture was heated at 70 °C for 1 h. The derivatized sample was analyzed by GC–MS using a GC-2010 Plus (Shimadzu, USA) gas chromatography system equipped with a AOC-20iPlus (Shimadzu) automatic injector, a SH-RXi-5ms column (30 m × 0.25 mm × 0.25 μm; Shimadzu, USA) and a mass spectrometry detector, operating under the conditions previously described by Spréa et al. [30], with minor modifications, namely the oven program, was as follows: initial oven temperature of 45 °C increasing at 3 °C/min to 175 °C, then at 15 °C/min to 300 °C, and finally, was held isothermal for 15 min. The compounds were identified based on the comparison of the obtained spectra with those from the NIST17 mass spectral library, and confirmed by determining the linear retention index (LRI) based on the retention times of an N-alkanes mixture (C8–C40, Supelco). Whenever possible, comparisons were also performed with commercial standards and with published data. Compounds were quantified as relative percentage using relative peak area values obtained directly from the total ion current (TIC) values.

3.6. Evaluation of the Bioactive Properties

3.6.1. Antimicrobial Activity

The organic and aqueous extracts were evaluated for their antimicrobial potential based on the methodology presented by Alves, et al. [31], with some modifications. The used microorganisms were clinical isolates from patients hospitalized in various departments of the Centro Hospitalar de Trás-os-Montes e Alto Douro (Vila Real and Bragança) and comprised five Gram-negative bacteria (Escherichia coli, Klebsiella pneumoniae, Morganella morganii, Proteus mirabilis and Pseudomonas aeruginosa), three Gram-positive bacteria (Enterococcus faecalis, Listeria monocytogenes, Methicillin-resistant Staphylococcus aureus (MRSA), and Methicillin-Susceptible Staphylococcus aureus (MSSA)) and a yeast (Candida albicans). All the microorganisms were incubated at 37 °C in an appropriate fresh medium for 24 h before analysis to maintain the exponential growth phase. The minimum inhibitory concentration (MIC), corresponding to the lowest concentration of the E. purpurea extracts able to inhibit microbial growth, was determined against each microorganism using a colorimetric assay. The extracts were dissolved in 5% (v/v) dimethyl sulfoxide (DMSO)/Mueller–Hinton Broth (MHB) or Tryptic Soy Broth (TSB) to give a final concentration of 100 mg/mL for the stock solution. Then, the samples were serially diluted, obtaining a concentration range from 20 to 0.15 mg/mL. For the determination of the minimal bactericide concentration (MBC) or minimal fungicidal concentration (MFC) for the yeast, 10 μL of each well that showed no change in color was plated on blood agar (7% sheep blood) solid medium and incubated at 37 °C for 24 h. The lowest concentration that yielded no growth was set as the MBC or MFC. A negative control was prepared with 5% (v/v) dimethyl sulfoxide (DMSO)/Mueller–Hinton Broth (MHB) or Tryptic Soy Broth (TSB). One growth control was prepared with MHB and each inoculum. For the Gram-negative bacteria, antibiotics, such as ampicillin and Imipenem, were used as positive controls, while for the Gram-positive bacteria, ampicillin and vancomycin were selected.

3.6.2. Cytotoxic Activity

The evaluation of cytotoxicity was in human tumor cell lines, namely: NCI-H460 (lung cancer); MCF-7 (breast adenocarcinoma); HepG2 (hepatocellular carcinoma); HeLa (cervical carcinoma) was determined according to the procedure used in Barros et al. [32]. A phase-contrast microscope was used to monitor the growth of cell cultures, which were subcultured and plated in 96-well plates (density of 5.0 × 10⁴ cells/mL) using Dulbecco’s modified Eagle’s medium (DMEM) supplemented with FBS (10%), 1% penicillin/streptomycin. The cell growth inhibition was measured using the sulforhodamine B (SRB) assay, where the quantity of pigmented cells is directly proportional to the total protein content and, therefore, to the number of bounded cells. The samples were dissolved in water or DMSO (1%) depending on the extract, at 8 mg/mL and then, submitted to further dilutions (400–3.125 µg/mL). The results were expressed as GI50 values (sample concentration that inhibited 50% of the net cell growth, in μg/mL). Ellipticine was used as the positive control.

3.6.3. Hepatotoxicity

For the hepatotoxicity assay, a cell culture was prepared from a freshly harvested porcine liver (obtained from a local slaughterhouse) and designated as PLP2 [33]. Before reaching confluence, cells were subcultured and plated in 96-well plates at a density of 1.0 × 10⁴ cells/well and cultivated in commercial DMEM medium supplemented with 10% FBS, 1% penicillin/streptomycin. The samples were dissolved in water or DMSO (1%) depending on the extract, at 8 mg/mL, and then, submitted to further dilutions (400-3.125 μg/mL). Ellipticine was used as a positive control and results were expressed in GI50 values corresponding to the sample concentration achieving 50% of growth inhibition in liver primary culture PLP2.

3.7. Statistical Analysis

The described experiments were performed in triplicate and the results were expressed as the mean ± standard deviation (SD). The differences between the different extracts were analyzed using one-way analysis of variance (ANOVA) followed by Tukey’s honest significant difference post hoc test with α = 0.05, coupled with Welch’s statistic. A Student’s t-test was used to determine the significant difference among two different samples, with α = 0.05. Statistical analysis was carried out using the SPSS v. 23.0 program (SPSS v. 23.0; IBM Corp., Armonk, NY, USA).

4. Conclusions

The work reported herein highlights the difference of the biological activity in the extracts of E. purpurea prepared with solvents of different polarity as well as their chemical characterization. The highest antimicrobial activity was observed for the DCM, EtOAc, and acetone extracts, while the highest cytotoxicity was evidenced by the DCM and n-hexane extracts. Despite exhibiting lower activity, it is worth noting that the infusion, which is frequently used by consumers, was able to inhibit the growth of MCF-7 and HeLa cell lines. In general, the cytotoxicity of the DCM and n-hexane extracts was superior compared to the corresponding fractions, which points to a possible synergistic effect of the mixture of compounds present in the initial extracts.

Supplementary Materials

The following are available online at https://0-www-mdpi-com.brum.beds.ac.uk/1424-8247/13/6/125/s1, Figure S1: Chemical structures of the proposed compounds.

Author Contributions

Conceptualization, L.B., P.F.S. and I.C.F.R.F.; Formal analysis, J.C., T.C.F., J.S.A. and R.C.C.; Investigation, J.C., L.B., M.I.D., T.C.F., M.J.A., R.C.C., P.F.S. and I.C.F.R.F.; Methodology, J.C., L.B., T.C.F., J.S.A., M.J.A., R.C.C. and P.F.S.; Project administration, M.I.D.; Supervision, L.B., P.F.S. and I.C.F.R.F.; Writing—original draft, J.C., L.B., M.I.D., T.C.F. and J.S.A.; Writing—review and editing, P.F.S. and I.C.F.R.F. All authors have read and agreed to the published version of the manuscript.

Funding

The authors are grateful to the Foundation for Science and Technology (FCT, Portugal) for financial support by national funds FCT/MCTES to CIMO (UIDB/00690/2020) and CQ-VR (UID/QUI/00616/2013); national funding by FCT, P.I., through the institutional scientific employment program-contract for L. Barros and R. C. Calhelha contracts. FEDER-Interreg España-Portugal programme for financial support through the project 0377_Iberphenol_6_E.

Acknowledgments

The authors are grateful to the company Cantinho das Aromáticas, (Vila Nova de Gaia, Portugal), for providing the samples.

Conflicts of Interest

The authors declare no conflict of interest.

References

  1. Nadaf, M.; Joharchi, M.R.; Amiri, M.S. Ethnomedicinal uses of plants for the treatment of nervous disorders at the herbal markets of Bojnord, North Khorasan Province, Iran. Avicenna J. Phytomed. 2019, 9, 153–163. [Google Scholar] [CrossRef] [PubMed]
  2. Sousa, S.G.; Oliveira, L.A.; de Aguiar Magalhaes, D.; de Brito, T.V.; Batista, J.A.; Pereira, C.M.C.; de Souza Costa, M.; Mazulo, J.C.R.; de Carvalho Filgueiras, M.; Vasconselos, D.F.P.; et al. Chemical structure and anti-inflammatory effect of polysaccharide extracted from Morinda citrifolia Linn (Noni). Carbohydr. Polym. 2018, 197, 515–523. [Google Scholar] [CrossRef] [PubMed]
  3. Thomsen, M.O.; Christensen, L.P.; Grevsen, K. Harvest strategies for optimization of the content of bioactive alkamides and caffeic acid derivatives in aerial parts and in roots of Echinacea purpurea. J. Agric. Food Chem. 2018, 66, 11630–11639. [Google Scholar] [CrossRef] [PubMed]
  4. Chiou, S.-Y.; Sung, J.-M.; Huang, P.-W.; Lin, S.-D. Antioxidant, antidiabetic, and antihypertensive properties of Echinacea purpurea flower extract and caffeic acid derivatives using in vitro models. J. Med. Food 2017, 20, 171–179. [Google Scholar] [CrossRef] [PubMed]
  5. Du, Y.; Wang, Z.; Wang, L.; Gao, M.; Wang, L.; Gan, C.; Yang, C. Simultaneous determination of seven phenolic acids in rat plasma using UHPLC-ESI-MS/MS after oral administration of Echinacea purpurea extract. Molecules 2017, 22, 1494. [Google Scholar] [CrossRef] [Green Version]
  6. Aarland, R.C.; Bañuelos-Hernández, A.E.; Fragoso-Serrano, M.; Del Carmen Sierra-Palacios, E.; Díaz de León-Sánchez, F.; Pérez-Flores, L.J.; Rivera-Cabrera, F.; Mendoza-Espinoza, J.A. Studies on phytochemical, antioxidant, anti-inflammatory, hypoglycaemic and antiproliferative activities of Echinacea purpurea and Echinacea angustifolia extracts. Pharm. Biol. 2017, 55, 649–656. [Google Scholar] [CrossRef] [Green Version]
  7. Barnes, J.; Anderson, L.A.; Gibbons, S.; Phillipson, J.D. Echinacea species (Echinacea angustifolia (DC.) Hell., Echinacea pallida (Nutt.) Nutt., Echinacea purpurea (L.) Moench): A review of their chemistry, pharmacology and clinical properties. J. Pharm. Pharmacol. 2005, 57, 929–954. [Google Scholar] [CrossRef] [Green Version]
  8. Oláh, A.; Szabó-Papp, J.; Soeberdt, M.; Knie, U.; Dähnhardt-Pfeiffer, S.; Abels, C.; Bíró, T. Echinacea purpurea-derived alkylamides exhibit potent anti-inflammatory effects and alleviate clinical symptoms of atopic eczema. J. Dermatol. Sci. 2017, 88, 67–77. [Google Scholar] [CrossRef] [Green Version]
  9. Pires, C.; Martins, N.; Carvalho, A.M.; Barros, L.; Ferreira, I.C.F.R. Phytopharmacologic preparations as predictors of plant bioactivity: A particular approach to Echinacea purpurea (L.) Moench antioxidant properties. Nutrition 2016, 32, 834–839. [Google Scholar] [CrossRef] [Green Version]
  10. Hudson, J.B. Applications of the phytomedicine Echinacea purpurea (Purple Coneflower) in infectious diseases. J. Biomed. Biotechnol. 2012, 2012, 1–16. [Google Scholar] [CrossRef] [Green Version]
  11. Senica, M.; Mlinsek, G.; Veberic, R.; Mikulic-Petkovsek, M. Which plant part of purple coneflower (Echinacea purpurea (L.) Moench) should be used for tea and which for tincture? J. Med. Food 2019, 22, 102–108. [Google Scholar] [CrossRef] [PubMed]
  12. Sultan, M.T.; Buttxs, M.S.; Qayyum, M.M.N.; Suleria, H.A.R. Immunity: Plants as effective mediators. Crit. Rev. Food Sci. Nutr. 2014, 54, 1298–1308. [Google Scholar] [CrossRef] [PubMed]
  13. Manayi, A.; Vazirian, M.; Saeidnia, S. Echinacea purpurea: Pharmacology, phytochemistry and analysis methods. Pharmacogn. Rev. 2015, 9, 63–72. [Google Scholar] [CrossRef] [PubMed] [Green Version]
  14. Khalaf, A.A.; Hussein, S.; Tohamy, A.F.; Marouf, S.; Yassa, H.D.; Zaki, A.R.; Bishayee, A. Protective effect of Echinacea purpurea (Immulant) against cisplatin-induced immunotoxicity in rats. DARU J. Pharm. Sci. 2019, 27, 233–241. [Google Scholar] [CrossRef]
  15. Pillai, S.; Pillai, C.; Mitscher, L.A.; Cooper, R. Use of quantitative flow cytometry to measure ex vivo immunostimulant activity of Echinacea: The case for polysaccharides. J. Altern. Complement. Med. 2007, 13, 625–634. [Google Scholar] [CrossRef] [Green Version]
  16. Todd, D.A.; Gulledge, T.V.; Britton, E.R.; Oberhofer, M.; Leyte-Lugo, M.; Moody, A.N.; Shymanovich, T.; Grubbs, L.F.; Juzumaite, M.; Graf, T.N.; et al. Ethanolic Echinacea purpurea extracts contain a mixture of cytokine-suppressive and cytokine-inducing compounds, including some that originate from endophytic bacteria. PLoS ONE 2015, 10, e0124276. [Google Scholar] [CrossRef]
  17. Yang, G.; Li, K.; Liu, C.; Peng, P.; Bai, M.; Sun, J.; Li, Q.; Yang, Z.; Yang, Y.; Wu, H. A comparison of the immunostimulatory effects of polysaccharides from tetraploid and diploid Echinacea purpurea. Biomed. Res. Int. 2018, 2018, 1–12. [Google Scholar] [CrossRef] [Green Version]
  18. Yao, L.; Bai, L.; Tan, Y.; Sun, J.; Qu, Q.; Shi, D.; Guo, S.; Liu, C. The immunoregulatory effect of sulfated Echinacea purpurea polysaccharide on chicken bone marrow-derived dendritic cells. Int. J. Biol. Macromol. 2019, 139, 1123–1132. [Google Scholar] [CrossRef]
  19. Sloley, B.D.; Urichuk, L.J.; Tywin, C.; Coutts, R.T.; Pang, P.K.T.; Shan, J.J. Comparison of chemical components and antioxidant capacity of different Echinacea species. J. Pharm. Pharmacol. 2001, 53, 849–857. [Google Scholar] [CrossRef]
  20. Ma, Y.; Kosińska-Cagnazzo, A.; Kerr, W.L.; Amarowicz, R.; Swanson, R.B.; Pegg, R.B. Separation and characterization of phenolic compounds from dry-blanched peanut skins by liquid chromatography-electrospray ionization mass spectrometry. J. Chromatogr. A 2014, 1356, 64–81. [Google Scholar] [CrossRef]
  21. Waidyanatha, S.; Pierfelice, J.; Cristy, T.; Mutlu, E.; Burback, B.; Rider, C.V.; Ryan, K. A strategy for test article selection and phytochemical characterization of Echinacea purpurea extract for safety testing. Food Chem. Toxicol. 2020, 137, 111125. [Google Scholar] [CrossRef] [PubMed]
  22. Brown, P.N.; Chan, M.; Paley, L.; Betz, J.M. Determination of major phenolic compounds in Echinacea spp. raw materials and finished products by high-performance liquid chromatography with ultraviolet detection: Single-laboratory validation matrix extension. J. AOAC Int. 2011, 94, 1400–1410. [Google Scholar] [CrossRef] [PubMed] [Green Version]
  23. Vandyshev, V.V.; Babaeva, E.Y.; Drozdovskaya, D.D. Triacylglycerols of the lipid fraction from fruits of two Echinacea species. Pharm. Chem. J. 2009, 43, 154–156. [Google Scholar] [CrossRef]
  24. Sharma, M.; Vohra, S.; Arnason, J.T.; Hudson, J.B. Echinacea extracts contain significant and selective activities against human pathogenic bacteria. Pharm. Biol. 2008, 46, 111–116. [Google Scholar] [CrossRef]
  25. Tsai, Y.-L.; Chiu, C.-C.; Yi-Fu Chen, J.; Chan, K.-C.; Lin, S.-D. Cytotoxic effects of Echinacea purpurea flower extracts and cichoric acid on human colon cancer cells through induction of apoptosis. J. Ethnopharmacol. 2012, 143, 914–919. [Google Scholar] [CrossRef] [PubMed]
  26. Chicca, A.; Adinolfi, B.; Pellati, F.; Orlandini, G.; Benvenuti, S.; Nieri, P. Cytotoxic activity and G1 cell cycle arrest of a Dienynone from Echinacea pallida. Planta Med. 2010, 76, 444–446. [Google Scholar] [CrossRef]
  27. Graça, V.C.; Barros, L.; Calhelha, R.C.; Dias, M.I.; Carvalho, A.M.; Santos-Buelga, C.; Santos, P.F.; Ferreira, I.C.F.R. Chemical characterization and bioactive properties of aqueous and organic extracts of Geranium robertianum L. Food Funct. 2016, 7. [Google Scholar] [CrossRef]
  28. Graça, V.C.; Barros, L.; Calhelha, R.C.; Dias, M.I.; Ferreira, I.C.F.R.; Santos, P.F. Bio-guided fractionation of extracts of Geranium robertianum L.: Relationship between phenolic profile and biological activity. Ind. Crops Prod. 2017, 108, 543–552. [Google Scholar] [CrossRef] [Green Version]
  29. Bessada, S.M.F.; Barreira, J.C.M.; Barros, L.; Ferreira, I.C.F.R.; Oliveira, M.B.P.P. Phenolic profile and antioxidant activity of Coleostephus myconis (L.) Rchb.f.: An underexploited and highly disseminated species. Ind. Crops Prod. 2016, 89, 45–51. [Google Scholar] [CrossRef] [Green Version]
  30. Mascoloti Spréa, R.; Fernandes, Â.; Calhelha, R.C.; Pereira, C.; Pires, T.C.S.P.; Alves, M.J.; Canan, C.; Barros, L.; Amaral, J.S.; Ferreira, I.C.F.R. Chemical and bioactive characterization of the aromatic plant Levisticum officinale W.D.J. Koch: A comprehensive study. Food Funct. 2020, 11, 1292–1303. [Google Scholar] [CrossRef]
  31. Alves, M.J.; Ferreira, I.C.F.R.; Martins, A.; Pintado, M. Antimicrobial activity of wild mushroom extracts against clinical isolates resistant to different antibiotics. J. Appl. Microbiol. 2012, 113, 466–475. [Google Scholar] [CrossRef] [PubMed]
  32. Barros, L.; Pereira, E.; Calhelha, R.C.; Dueñas, M.; Carvalho, A.M.; Santos-Buelga, C.; Ferreira, I.C.F.R. Bioactivity and chemical characterization in hydrophilic and lipophilic compounds of Chenopodium ambrosioides L. J. Funct. Foods 2013, 5, 1732–1740. [Google Scholar] [CrossRef]
  33. Abreu, R.M.V.; Ferreira, I.C.F.R.; Calhelha, R.C.; Lima, R.T.; Vasconcelos, M.H.; Adega, F.; Chaves, R.; Queiroz, M.-J.R.P. Anti-hepatocellular carcinoma activity using human HepG2 cells and hepatotoxicity of 6-substituted methyl 3-aminothieno[3,2-b]pyridine-2-carboxylate derivatives: In vitro evaluation, cell cycle analysis and QSAR studies. Eur. J. Med. Chem. 2011, 46, 5800–5806. [Google Scholar] [CrossRef] [PubMed] [Green Version]
Figure 1. Phenolic profile of the MeOH extract of E. purpurea recorded at 280 nm (A) and 370 nm (B).
Pharmaceuticals 13 00125 g001
Table 1. Retention time (Rt), wavelengths of maximum absorption in the visible region (λmax), mass spectral data, tentative identification and quantification (mg/g extract) of the phenolic compounds present in five different extracts of E. purpurea.
PeakRt (min)λmax (nm)[M-H] (m/z)MS2 (m/z)Tentative IdentificationOrganicAqueous
EtOAcAcetoneMeOHInfusionDecoction
14.54327311179(6),149(100),135(5),113(3)Caftaric acidndnd1.19 ± 0.02 a0.16 ± 0.01 c0.22 ± 0.01 b
27.04325353191(100),179(8),173(3),135(3)5-O-caffeoylquinic acidndnd0.286 ± 0.003 a0.024 ± 0.001 bnd
39.87324179135(100)Caffeic acid0.20 ± 0.01 b0.066 ± 0.001 c0.63 ± 0.02 andnd
411.84328473311(100),293(87),179(5),149(5)cis Chicoric acidndndnd12.0 ± 0.1 *10.5 ± 0.1 *
513.40328473311(100),293(87),179(5),149(5)trans Chicoric acidndnd41.0 ± 0.3 a4.0 ± 0.1 b4.5 ± 0.1 b
617.50342609301(100)Quercetin-O-deoxyhexosyl-hexosidendtr1.8836 ± 0.0005ndnd
717.73342609301(100)Quercetin-3-O-rutinosidendtr5.6 ± 0.2 a1.4 ± 0.1 b0.26 ± 0.01 c
818.93328487325(85),307(51),293(100),193(10),179(15)Feruloylcaffeoyltartaric acidnd0.030 ± 0.001 d1.36 ± 0.04 a0.10 ± 0.01 b0.040 ± 0.001 c
919.66329593285(100)Kaempferol-O-deoxyhexosyl-hexosidendtr0.60 ± 0.01ndtr
1021.10334593285(100)Kaempferol-3-O-rutinosidendtr0.536 ± 0.001ndtr
1121.42334593285(100)Kaempferol-O-deoxyhexosyl-hexosidendtr0.058 ± 0.003ndnd
1222.35327549505(5),463(13),301(30)Quercetin-O-malonylhexosidendndndndnd
1324.10340607285(100)Kaempferol-O-deoxyhexosyl-glucuronidendtrndndnd
1425.73327501337(100),307(50),277(15),233(61),203(5)p-Coumaroylsinapoyltartaric acidndnd0.050 ± 0.001 a0.010 ± 0.001 b0.010 ± 0.001 b
1539.56308577299(100)Diosmetin-O-p-coumaroyl-pentosidend5.29 ± 0.04ndndnd
Total phenolic acids0.20 ± 0.01 b0.066 ± 0.001 a44.5 ± 0.4 b16.4 ± 0.2 b15.2 ± 0.2 b
Total flavonoidsnd5.29 ± 0.04 b8.6 ± 0.2 a1.4 ± 0.1 c0.26 ± 0.01 d
Total phenolic compounds0.20 ± 0.01 e5.36 ± 0.04 d53 ± 1 a17.8 ± 0.1 b15.5 ± 0.2 c
Nd—not detected. tr—traces. * Samples differ significantly (p < 0.05), obtained by Student’s t-test. Results expressed in mean values ± standard deviation (SD). Different letters represent significant differences (p < 0.05).
Table 2. Chemical composition of n-hexane and DCM extracts of E. purpurea obtained by GC–MS analysis.
NumberCompoundRT (min)LRI aRelative % bt-Students Test p-Value
n-HexaneDCM
12,3-Butanediol14.971044 *-0.055 ± 0.003-
2Hexanoic acid16.561079 *0.017 ± 0.0040.061 ± 0.001<0.001
32-Methyl-4-pentenoic acid16.831085 *-0.027 ± 0.002-
4(E)-2-Hexenoic acid18.831127 *-0.018 ± 0.002-
5Verbenone22.9212150.009 ± 0.001--
6(+)-cis-Verbenol24.111241 *0.009 ± 0.002--
7Benzoic acid24.651253 *-0.039 ± 0.003-
8Menthol25.241264 *0.0035 ± 0.0004--
9Octanoic acid25.521270 *0.013 ± 0.0030.026 ± 0.002<0.001
10Carvacrol28.541340 *0.13 ± 0.040.1256 ± 0.000040.155
11Copaene30.4913850.013 ± 0.001--
12β-Caryophyllene32.3914300.034 ± 0.002--
13Decanoic acid33.911466 *0.198 ± 0.0010.125 ± 0.002<0.001
14D-(-)-Citramalic acid35.041494 *-0.077 ± 0.003-
15Epicubebol35.4715040.048 ± 0.003--
16Malic acid35.791512 *0.033 ± 0.0020.115 ± 0.002<0.001
17Dihydroactinidiolide36.8315390.052 ± 0.002--
18trans-Nerolidol38.0915710.048 ± 0.001--
19Spathulenol38.7915890.22 ± 0.01--
20Caryophyllene oxide39.0315950.22 ± 0.01--
21Dodecanoic acid41.551662 *0.15 ± 0.040.066 ± 0.002<0.001
22Oplopanone44.4917550.507 ± 0.004--
23Azelaic acid45.781803 *-0.371 ± 0.003-
24Neophytadiene46.3518450.907 ± 0.0012.71 ± 0.1<0.001
25Myristic acid46.531858 *1.4 ± 0.11.14 ± 0.010.092
26Hexadecanoic acid, methyl ester47.5119360.351 ± 0.004--
27Pentadecanoic acid47.781960 *0.44 ± 0.020.27 ± 0.01<0.001
28Gallic acid48.091988 *-0.12 ± 0.01-
29Undecanedioic acid48.292006 *-0.154 ± 0.003-
30Palmitelaidic acid48.582039 *0.16 ± 0.01--
31Palmitic Acid48.792061 *4.6 ± 0.15.7 ± 0.20.015
32Linoleic acid, methyl ester49.2121090.644 ± 0.001--
33Heptadecanoic acid49.592157 *0.8 ± 0.1--
34Caffeic acid49.622161 *-0.822 ± 0.003-
35Phytol49.852190 *1.1 ± 0.10.55 ± 0.01<0.001
36Docosane49.992210-0.42 ± 0.02-
37Linoleic acid50.122229 *5.0 ± 0.14.3 ± 0.10.016
38α-Linolenic acid50.172236 *2.2 ± 0.22.4 ± 0.10.121
39Stearic acid50.312256 *2.30 ± 0.041.5 ± 0.1<0.001
40Tricosane50.682311-1.0 ± 0.1-
41Tetracosane51.3024111.6 ± 0.11.9 ± 0.10.025
42Arachidic acid51.552454 *3.3 ± 0.21.664 ± 0.005<0.001
43Pentacosane51.8925111.6 ± 0.023.20 ± 0.04<0.001
44Heneicosanoic acid52.132552 *0.37 ± 0.020.56 ± 0.04<0.001
45Hexacosane52.4826121.58 ± 0.014.36 ± 0.02<0.001
46Behenic acid52.732651 *1.21 ± 0.051.4 ± 0.10.084
473-Methylhexacosane52.952686-0.47 ± 0.02-
48Heptacosane53.1227122.6 ± 0.15.0 ± 0.3<0.001
49Tricosanoic acid53.392750 *0.82 ± 0.030.84 ± 0.020.373
50Octacosane53.8328121.6 ± 0.014.4 ± 0.1<0.001
51Lignoceric acid54.122849 *1.3 ± 0.11.04 ± 0.010.023
52Squalene54.1828561.3 ± 0.10.434 ± 0.02<0.001
532-Methyl-octacosane54.312873-0.592 ± 0.01-
543-Methyloctacosane54.412886-0.52 ± 0.01-
55Nonacosane54.6329123.1 ± 0.15.14 ± 0.03<0.001
561-Hexacosanol55.012953 *1.6 ± 0.11.3 ± 0.10.091
57Hexacosanoic acid55.953048 *-1.4 ± 0.1-
58Nonacosanal56.073059 *0.75 ± 0.04--
59Untriacontane56.6731122.4 ± 0.2--
60α-Tocopherol57.563182-1.09 ± 0.04-
61Cholesterol58.113221 *0.39 ± 0.01--
62Campesterol59.783325 *2.00 ± 0.010.41 ± 0.02<0.001
63Stigmasterol60.313353 *3.9 ± 0.2--
64β-Sitosterol61.403416 *7.5 ± 0.54.8 ± 0.3<0.001
Total identified compounds 61.0 ± 0.563 ± 10.482
Monoterpene hydrocarbons 0.06 ± 0.002--
Oxygen-containing monoterpenes 0.021 ± 0.002--
Sesquiterpene hydrocarbons 0.38 ± 0.030.1256 ± 0.00004<0.001
Oxygen-containing sesquiterpenes 0.824 ± 0.002--
Diterpene hydrocarbons 3.4 ± 0.23.7 ± 0.10.151
Sterol 13.9 ± 0.35.2 ± 0.3<0.001
Fatty acids 24.8 ± 0.523 ± 10.362
Long-chain hydrocarbons 14.57 ± 0.0327.1 ± 0.3<0.001
Long-chain alcohols 1.6 ± 0.11.3 ± 0.10.018
Others 1.4 ± 0.042.61 ± 0.04<0.001
a LRI, linear retention index determined on a SH-RXi-5ms fused silica column relative to a series of n-alkanes (C8–C40). * identified as TMS derivative. b relative % is given as mean ± SD, n = 3. In each row, p values < 0.05 means significant differences.
Table 3. Antimicrobial activity of all seven E. purpurea extracts against clinical isolates of Gram-negative and Gram-positive bacteria and one yeast strain.
Organic ExtractsAqueous ExtractsControls
n-HexaneDCMEtOAcAcetoneMeOHInfusionDecoctionAmpicilinImipenemVancomycinFluconazol
MICMBCMICMBCMICMBCMICMBCMICMBCMICMBCMICMBCMICMBCMICMBCMICMBCMICMBC
Gram-negative bacteria
Escherichia coli20>2010>205>2010>20>20>20>20>20>20>20<0.15<0.15<0.0078<0.0078ntntntnt
Klebsiella pneumoniae20>2020>2010>2010>20>20>20>20>2020>201020<0.0078<0.0078ntntntnt
Morganella morganii20>205>205>2010>20>20>20>20>20>20>2020>20<0.0078<0.0078ntntntnt
Proteus mirabilis20>2020>2010>2010>20>20>20>20>20>20>20<0.15<0.15<0.0078<0.0078ntntntnt
Pseudomonas aeruginosa20>2010>2010>2010>20>20>20>20>20>20>20>20>200.51ntntntnt
Gram-positive bacteria
Enterococcus faecalis10>202.5>2010>205>20>20>20>20>20>20>20<0.15<0.15ntnt<0.0078<0.0078ntnt
Listeria monocytogenes>20>202.5>2020>2020>20>20>20>20>20>20>20<0.15<0.15<0.0078<0.0078ntntntnt
MRSA10>205>205>205>2020>20>20>20>20>20<0.15<0.15ntnt<0.0078<0.0078ntnt
MSSA10>205>205>202.5>2020>20>20>20>20>20<0.15<0.15ntnt0.250.5ntnt
YeastsMICMFCMICMFCMICMFCMICMFCMICMFCMICMFCMICMFCMICMFCMICMFCMICMFCMICMFC
Candida albicans10>205>2010>205>20>20>20>20>20>20>20ntntntntntnt0.060.06
MIC and MBC are expressed in mg/mL. nt—not tested. The highest tested concentration was 20 mg/mL.
Table 4. Cytotoxicity of organic and aqueous extracts and obtained fractions (n-hexane and DCM, μg/mL) of E. purpurea against human tumor cell lines and non-tumor cell line (PLP2).
NCI H460HepG2HeLaMCF-7PLP2
Organicn-Hexane70 ± 2 c47 ± 3 c58 ± 5 e29 ± 2 d104 ± 7 c
DCM48 ± 4 d36.7 ± 0.6 c51 ± 4 e21 ± 2 e100 ± 8 c
EtOAc192 ± 4 a226 ± 15 a85 ± 6 d51 ± 5 c166 ± 9 b
Acetone142 ± 10 b82 ± 4 b98 ± 5 cd50 ± 4 c195 ± 15 a
MeOH> 400> 400111 ± 9 c76 ± 5 b>400
AqueousInfusion>400>400305 ± 23 b247 ± 5 a>400
Decoction>400>400319 ± 12 a>400>400
Fraction of n-hexaneFH1105 ± 7 h206 ± 12 e150 ± 5 d110 ± 3 fg326 ± 17 b
FH2142 ± 5 g344 ± 10 ab180 ± 7 c140 ± 7 e>400
FH3184 ± 15 ef308 ± 19 c212 ± 6 b182 ± 9 c>400
FH4243 ± 16 a233 ± 3 d240 ± 3 a222 ± 5 b>400
FH5238 ± 4 ab359 ± 7 a232 ± 5 a239 ± 4 a>400
FH6250 ± 1 a327 ± 16 bc235 ± 5 a237 ± 8 a>400
FH7197 ± 12 de159 ± 6 gh213 ± 8 b179 ± 9 c343 ± 22 ab
FH8222 ± 5 bc168 ± 5 fg241 ± 2 a121 ± 10 f356 ± 11 a
FH9206 ± 11 cd159 ± 3 gh181 ± 8 c171 ± 4 cd342 ± 10 ab
FH10211 ± 5 cd141 ± 4 hi170 ± 9 c181 ± 5 c331 ± 6 ab
FH11100 ± 7 h93 ± 4 j105 ± 9 f106 ± 10 g269 ± 6 c
FH12128 ± 5 g131 ± 6 i127 ± 9 e111 ± 3 fg>400
FH13168 ± 12 f187 ± 12 ef176 ± 12 c160 ± 7 d>400
FH14>400338 ± 13 b>400>400>400
Fraction of DCMFD1>400>400>400>400>400
FD2236 ± 11 c278 ± 9 ab178 ± 12 c146 ± 11 c>400
FD3>400>400>400>400>400
FD4>400>400>400>400>400
FD5128 ± 4 e146 ± 4 f116 ± 4 e89 ± 8 d267 ± 13 *
FD6135 ± 4 e141 ± 3 f113 ± 4 e81 ± 3 d>400
FD7170 ± 2 d187 ± 16 e150 ± 3 d139 ± 5 c302 ± 18 *
FD8225 ± 9 c212 ± 3 d174 ± 9 c151 ± 4 bc>400
FD9238 ± 4 c205 ± 7 de178 ± 9 c144 ± 9 c>400
FD10341 ± 9 a298 ± 19 a241 ± 5 a181 ± 9 a>400
FD11291 ± 9 b253 ± 8 c220 ± 5 b149 ± 3 bc>400
FD12292 ± 17 b256 ± 11 c223 ± 14 b144 ± 3 c>400
FD13336 ± 10 a271 ± 4 bc254 ± 6 a161 ± 4 b>400
FD14>400>400>400>400>400
FD15>400>400>400>400>400
Results expressed in mean values ± standard deviation (SD). Different letters correspond to significant differences (p < 0.05). * Samples differ significantly (p < 0.05), obtained by Student’s t-test. Ellipticine GI50 values: 1.21 μg/mL (MCF-7), 1.03 μg/mL (NCI-H460), 0.91 μg/mL (HeLa), 1.10 μg/mL (HepG2) and 2.29 μg/mL (PLP2). FH. Fraction of n-hexane; FD. Fraction of dichloromethane.

