
Thermodynamic Study of Oxidovanadium(IV) with Kojic Acid Derivatives: A Multi-Technique Approach

 , ,
, ,  , , , ,
  , and
, and
Abstract
:1. Introduction
2. Experimental
2.1. Reagents
2.2. Solution Equilibrium Studies
2.3. ESI-MS Measurements
2.4. EPR Experiments
2.5. NMR Experiments
2.6. DFT Calculations
3. Results and Discussion
3.1. Characterization of the Ligands
3.2. Protonation Equilibria
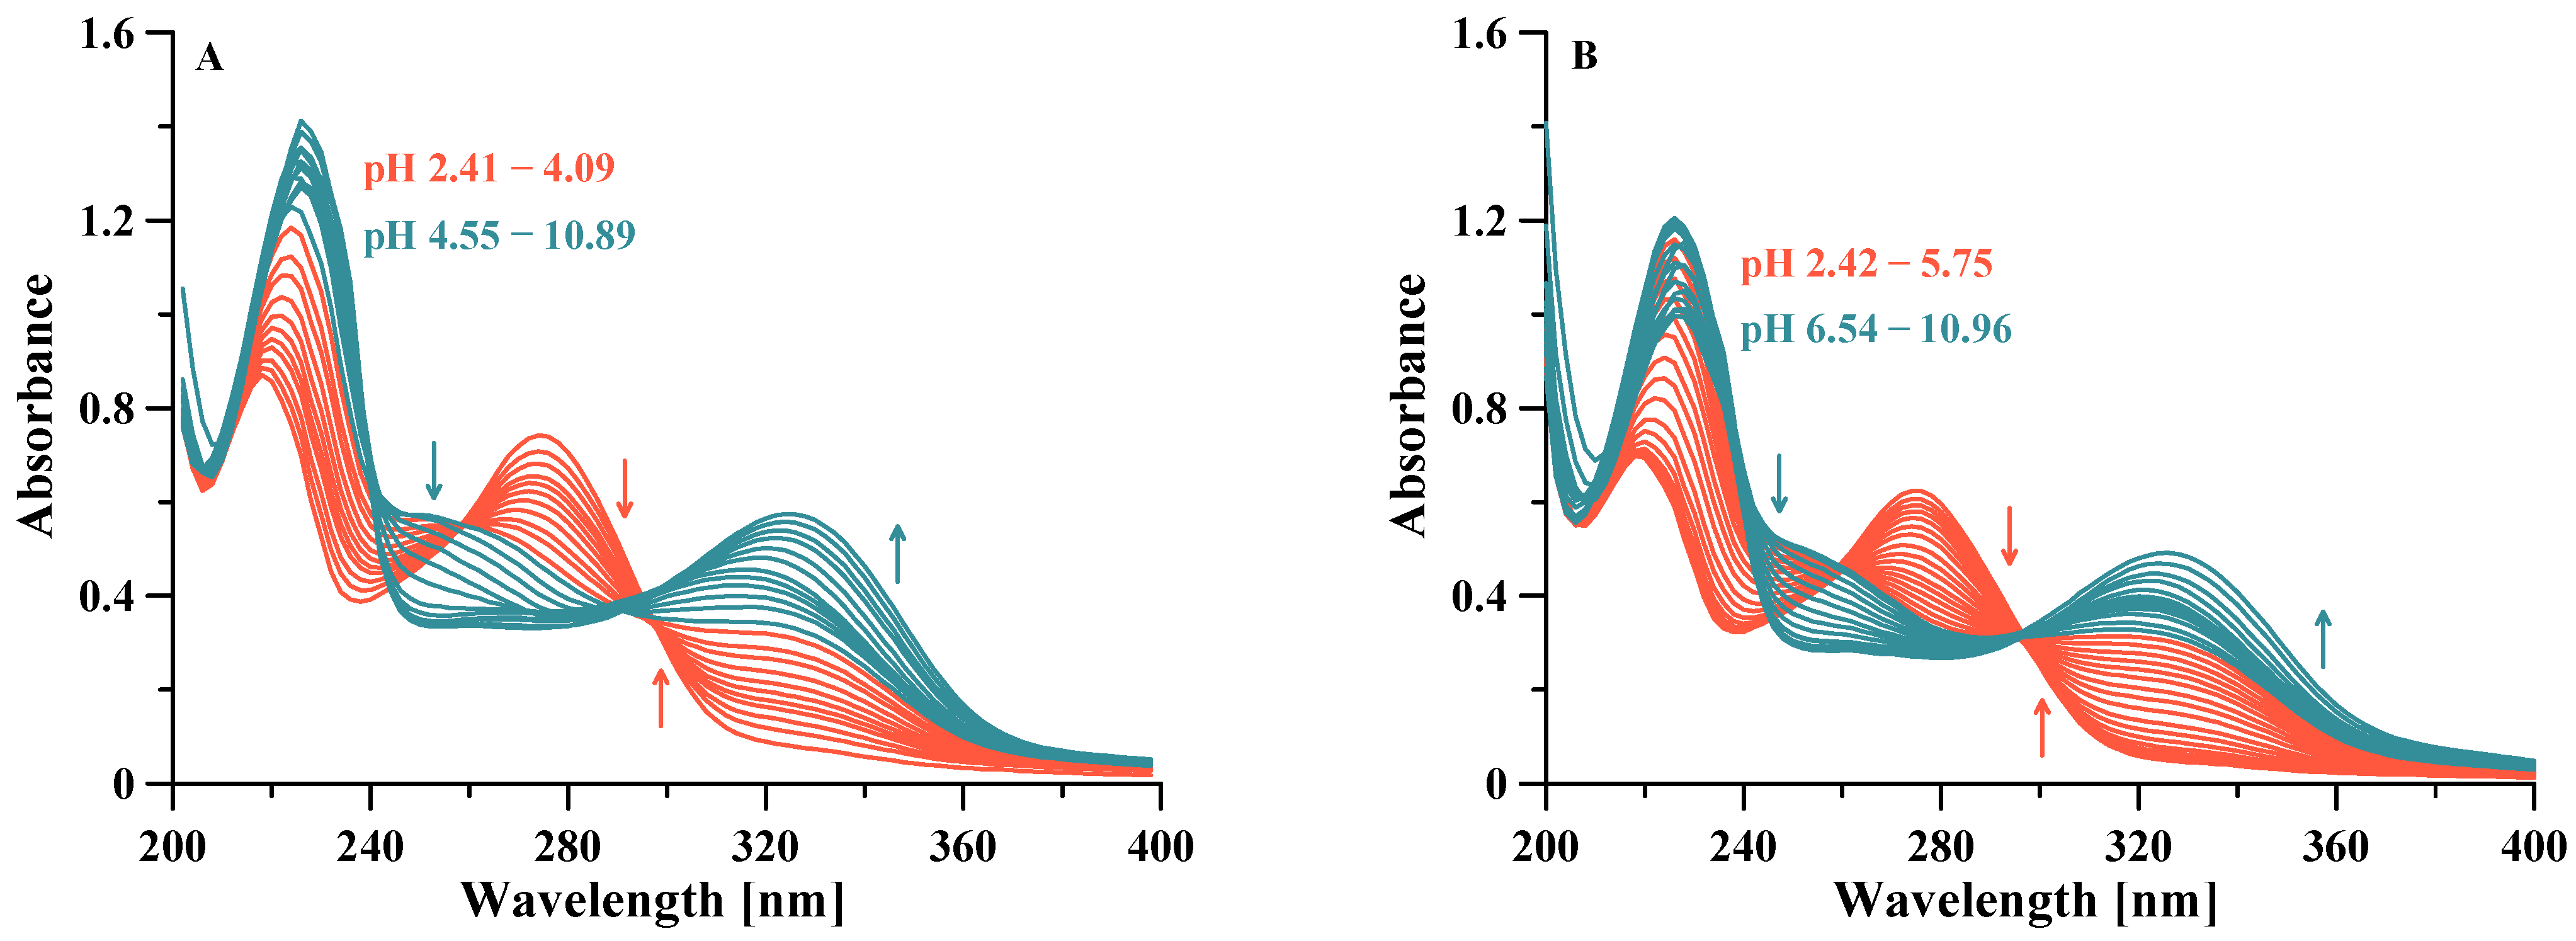
3.3. Oxidovanadium(IV) Complex Formation Equilibria
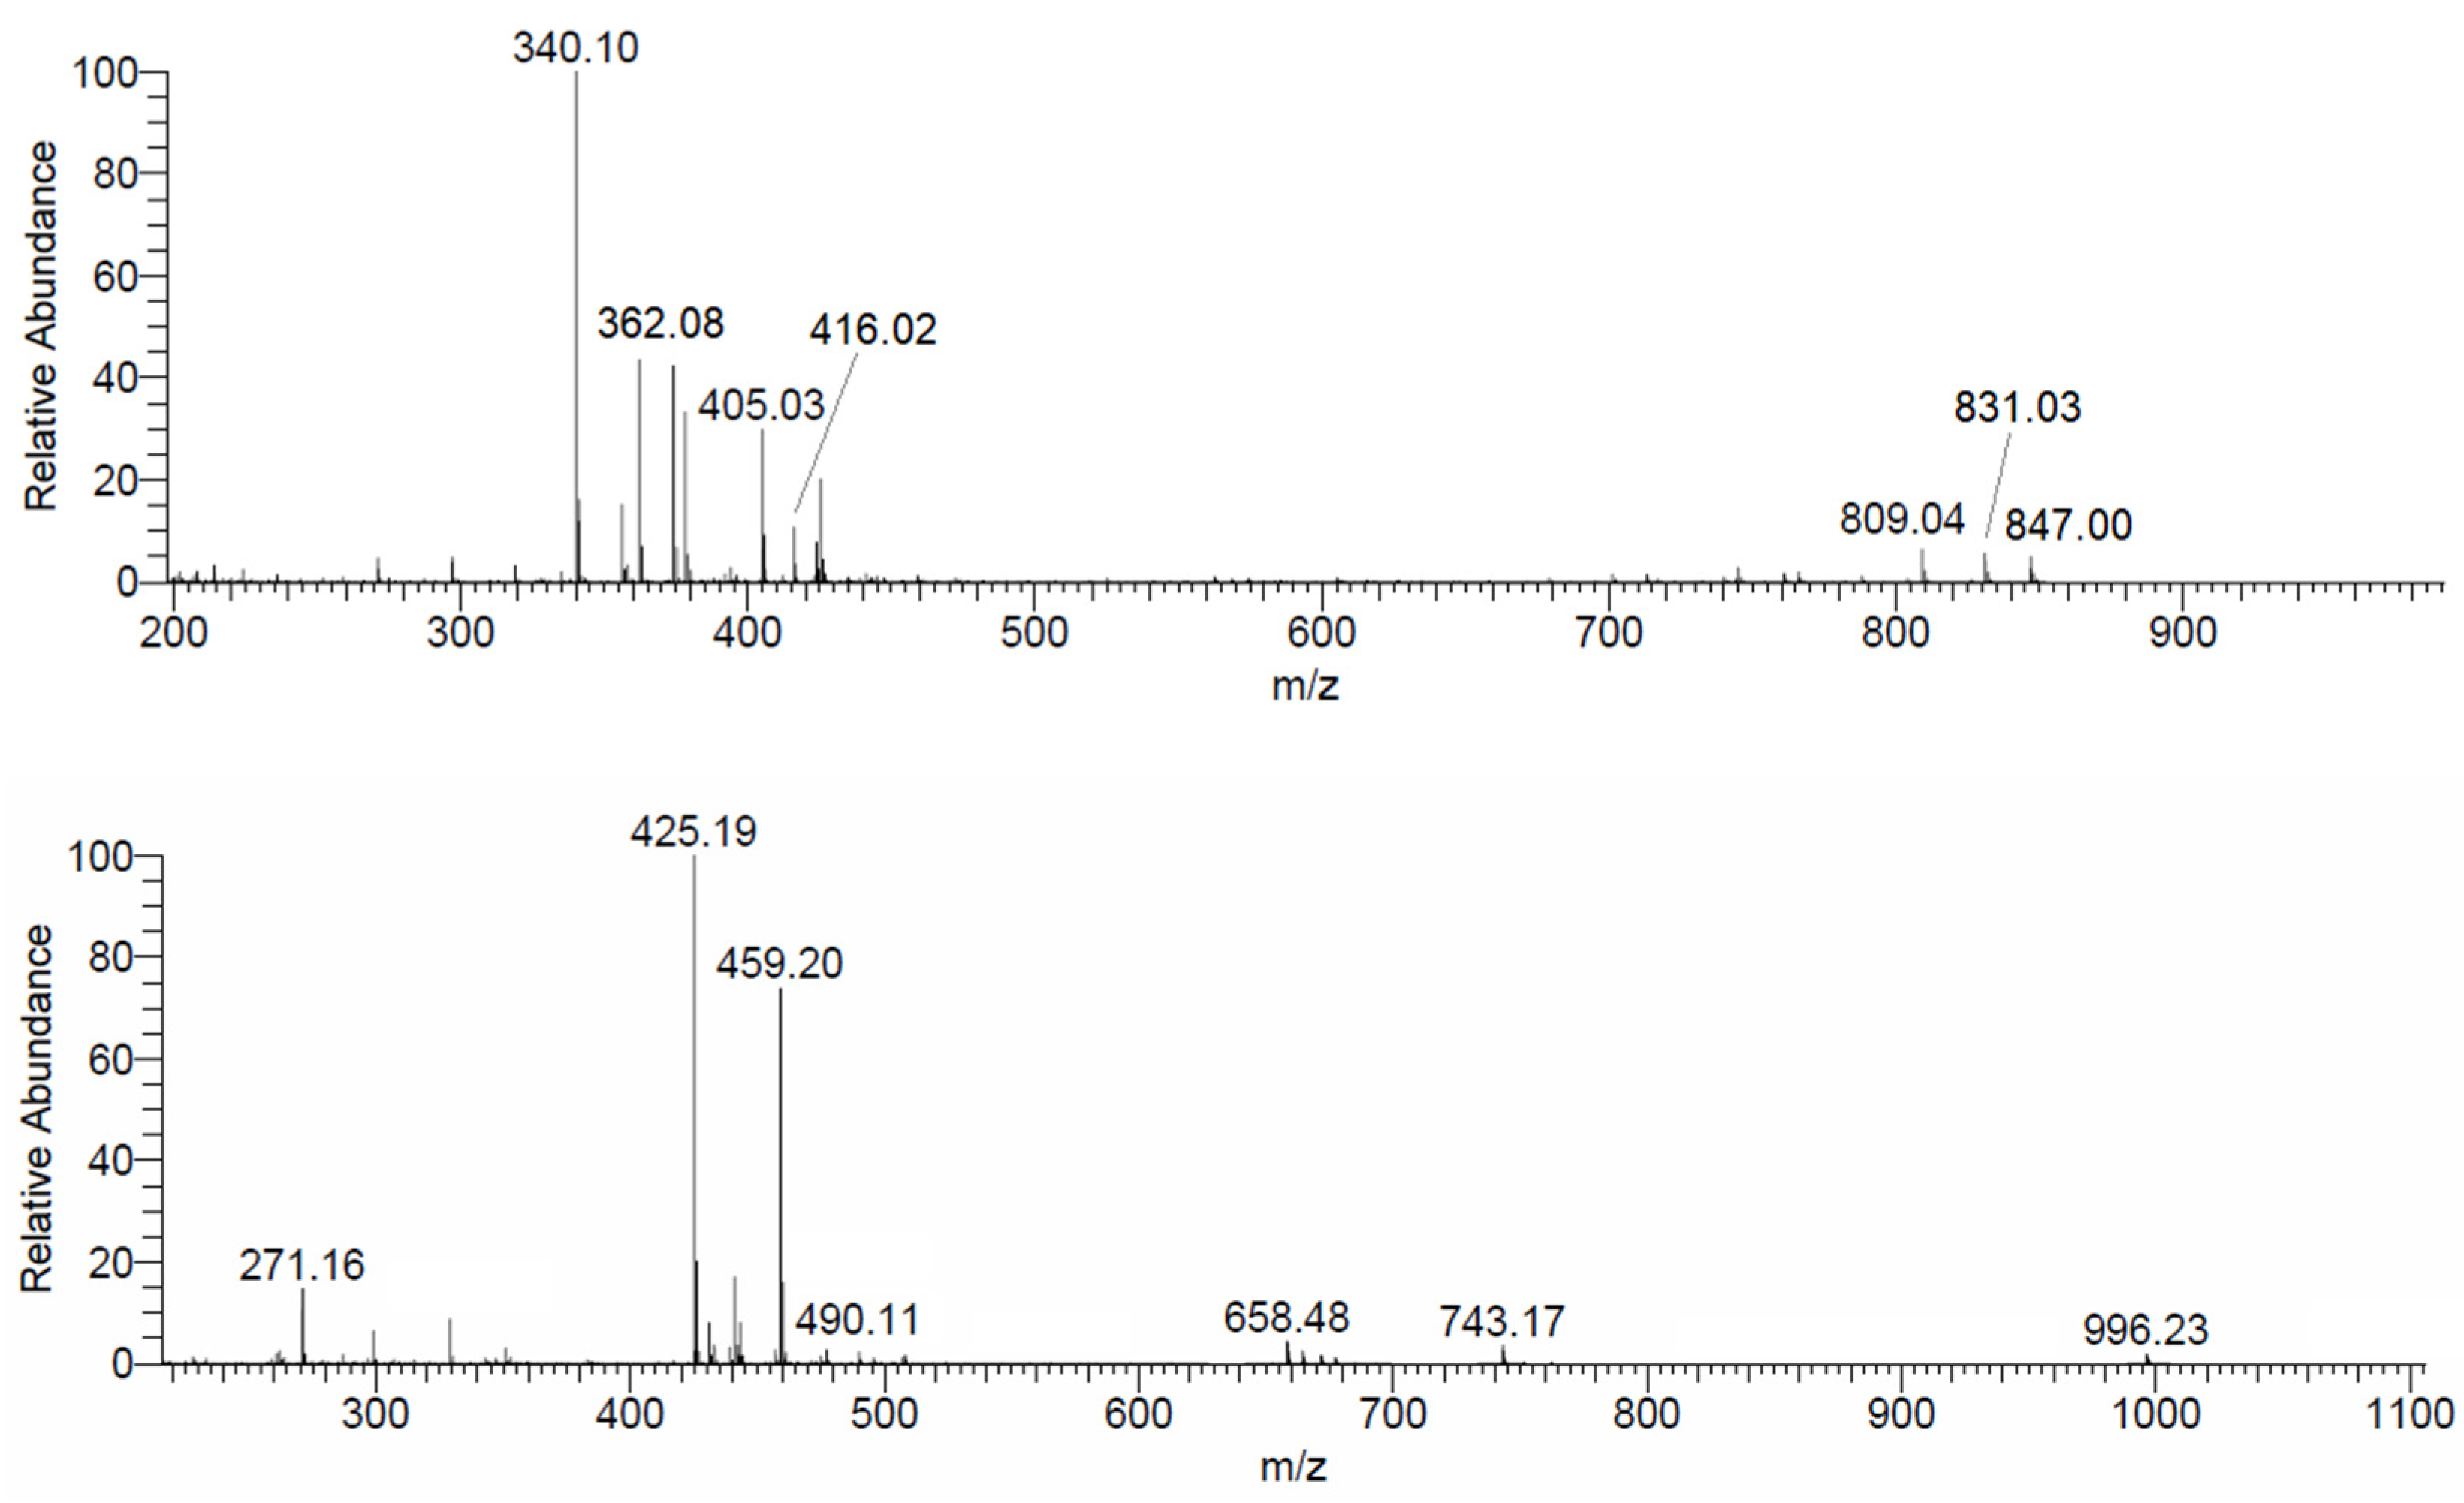
3.4. ESI-MS
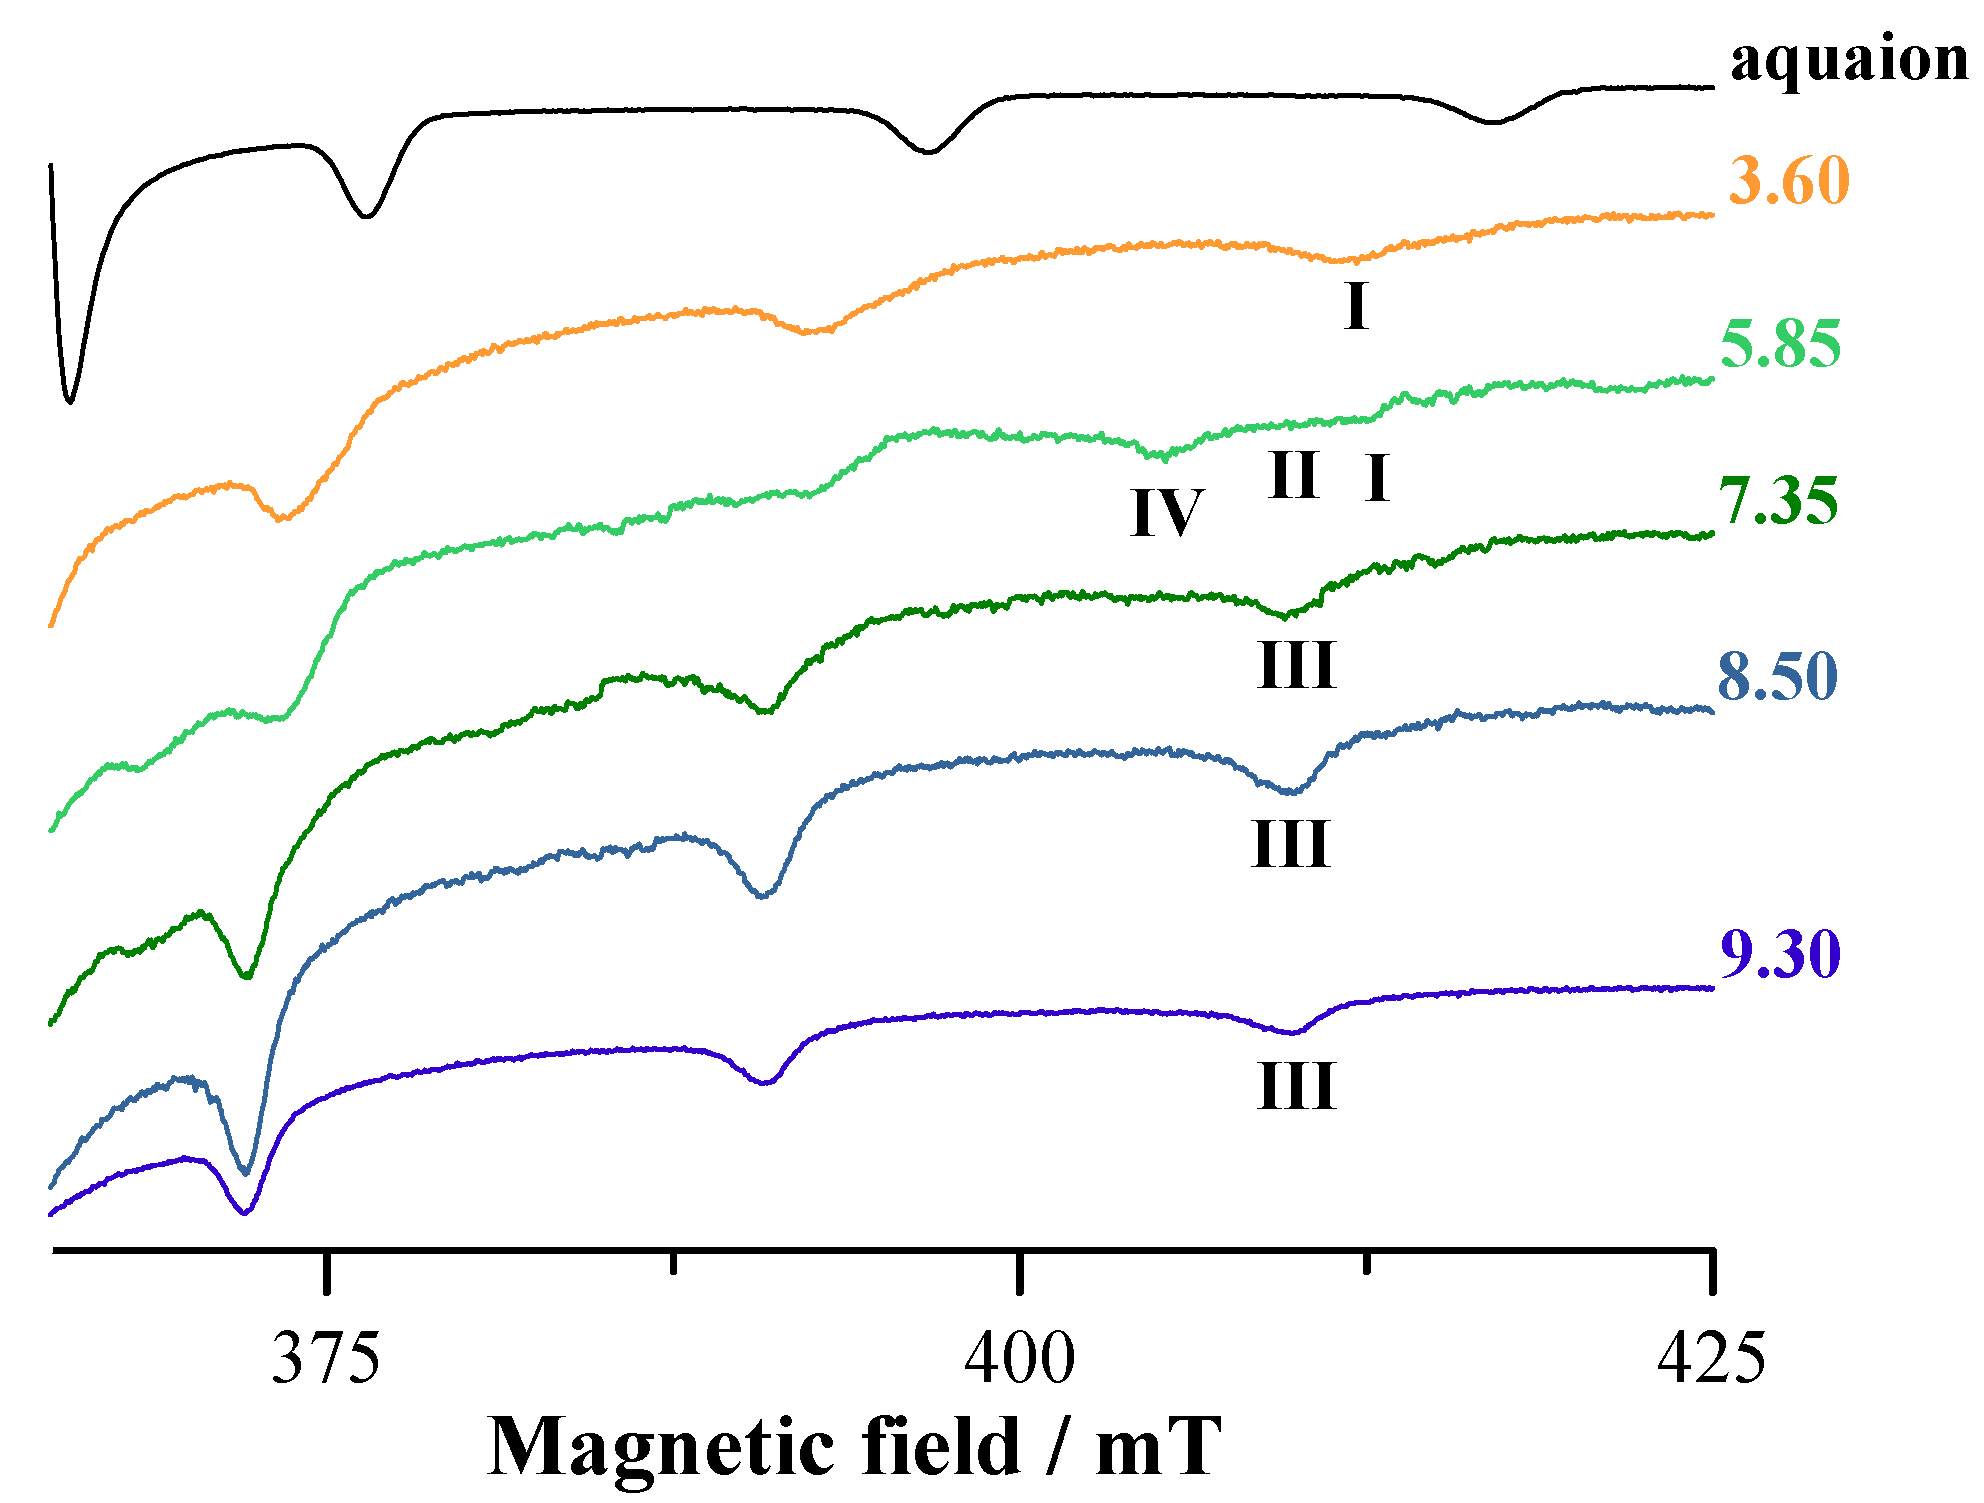
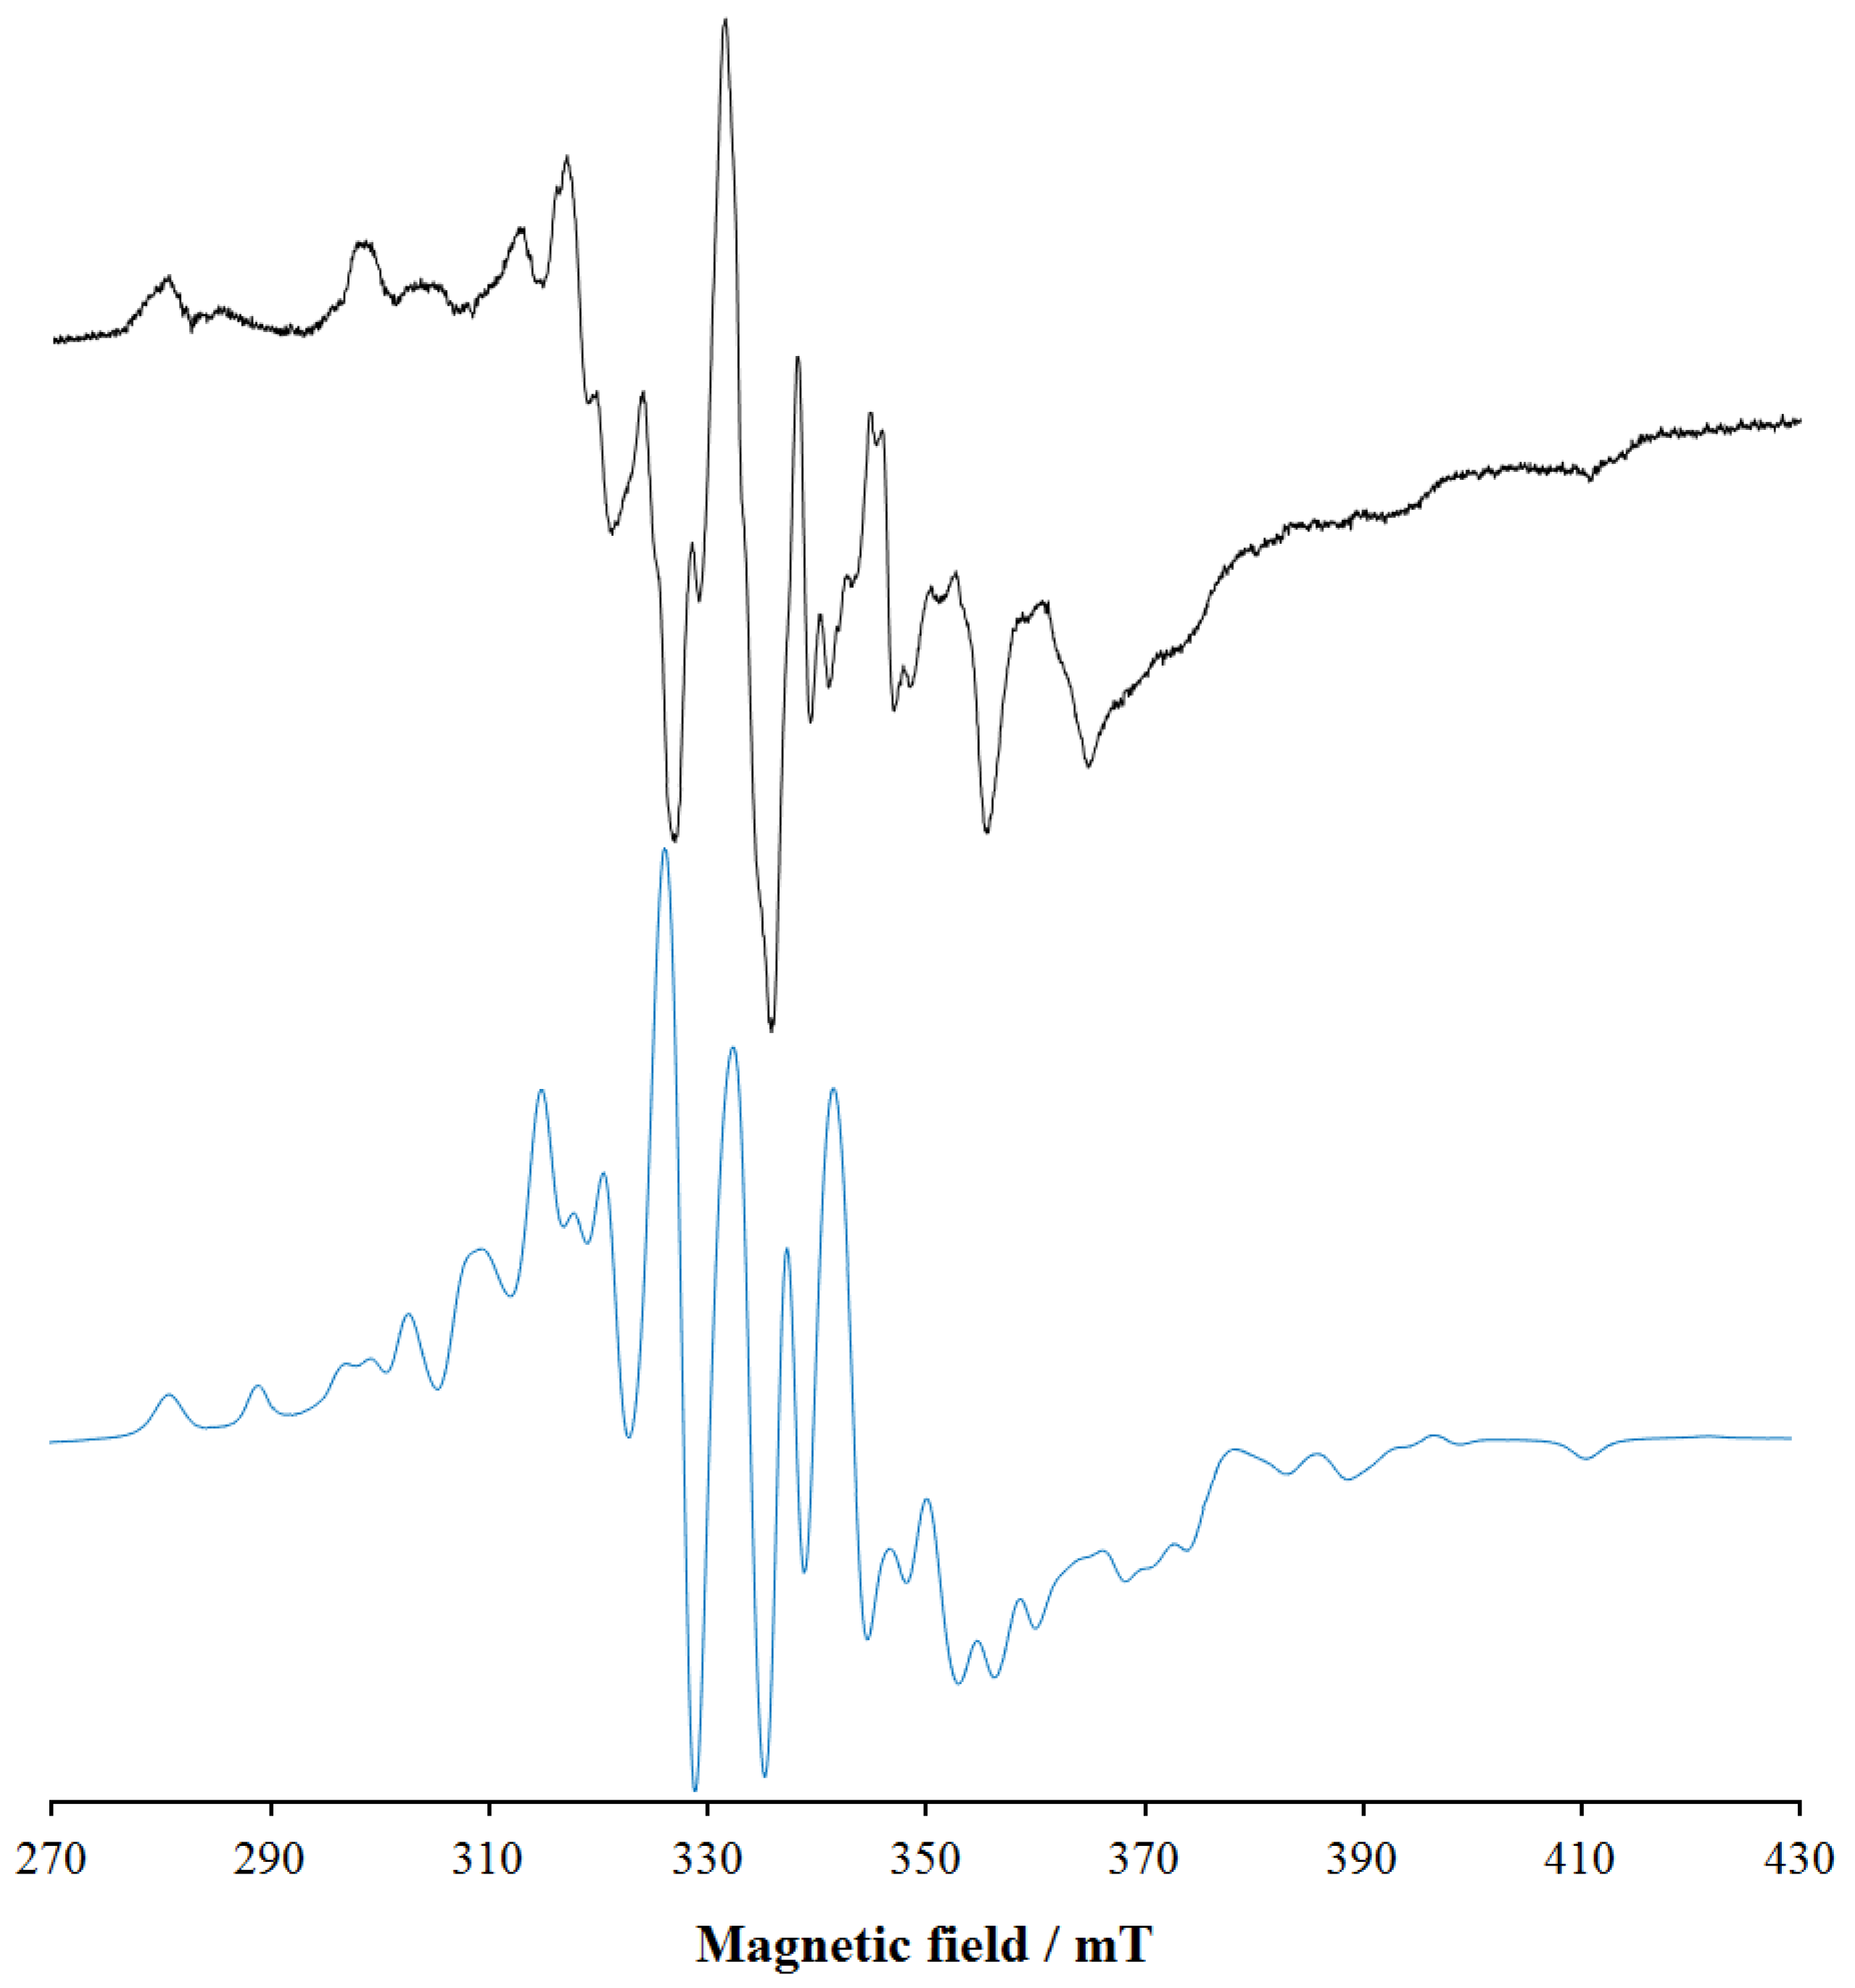
3.5. EPR
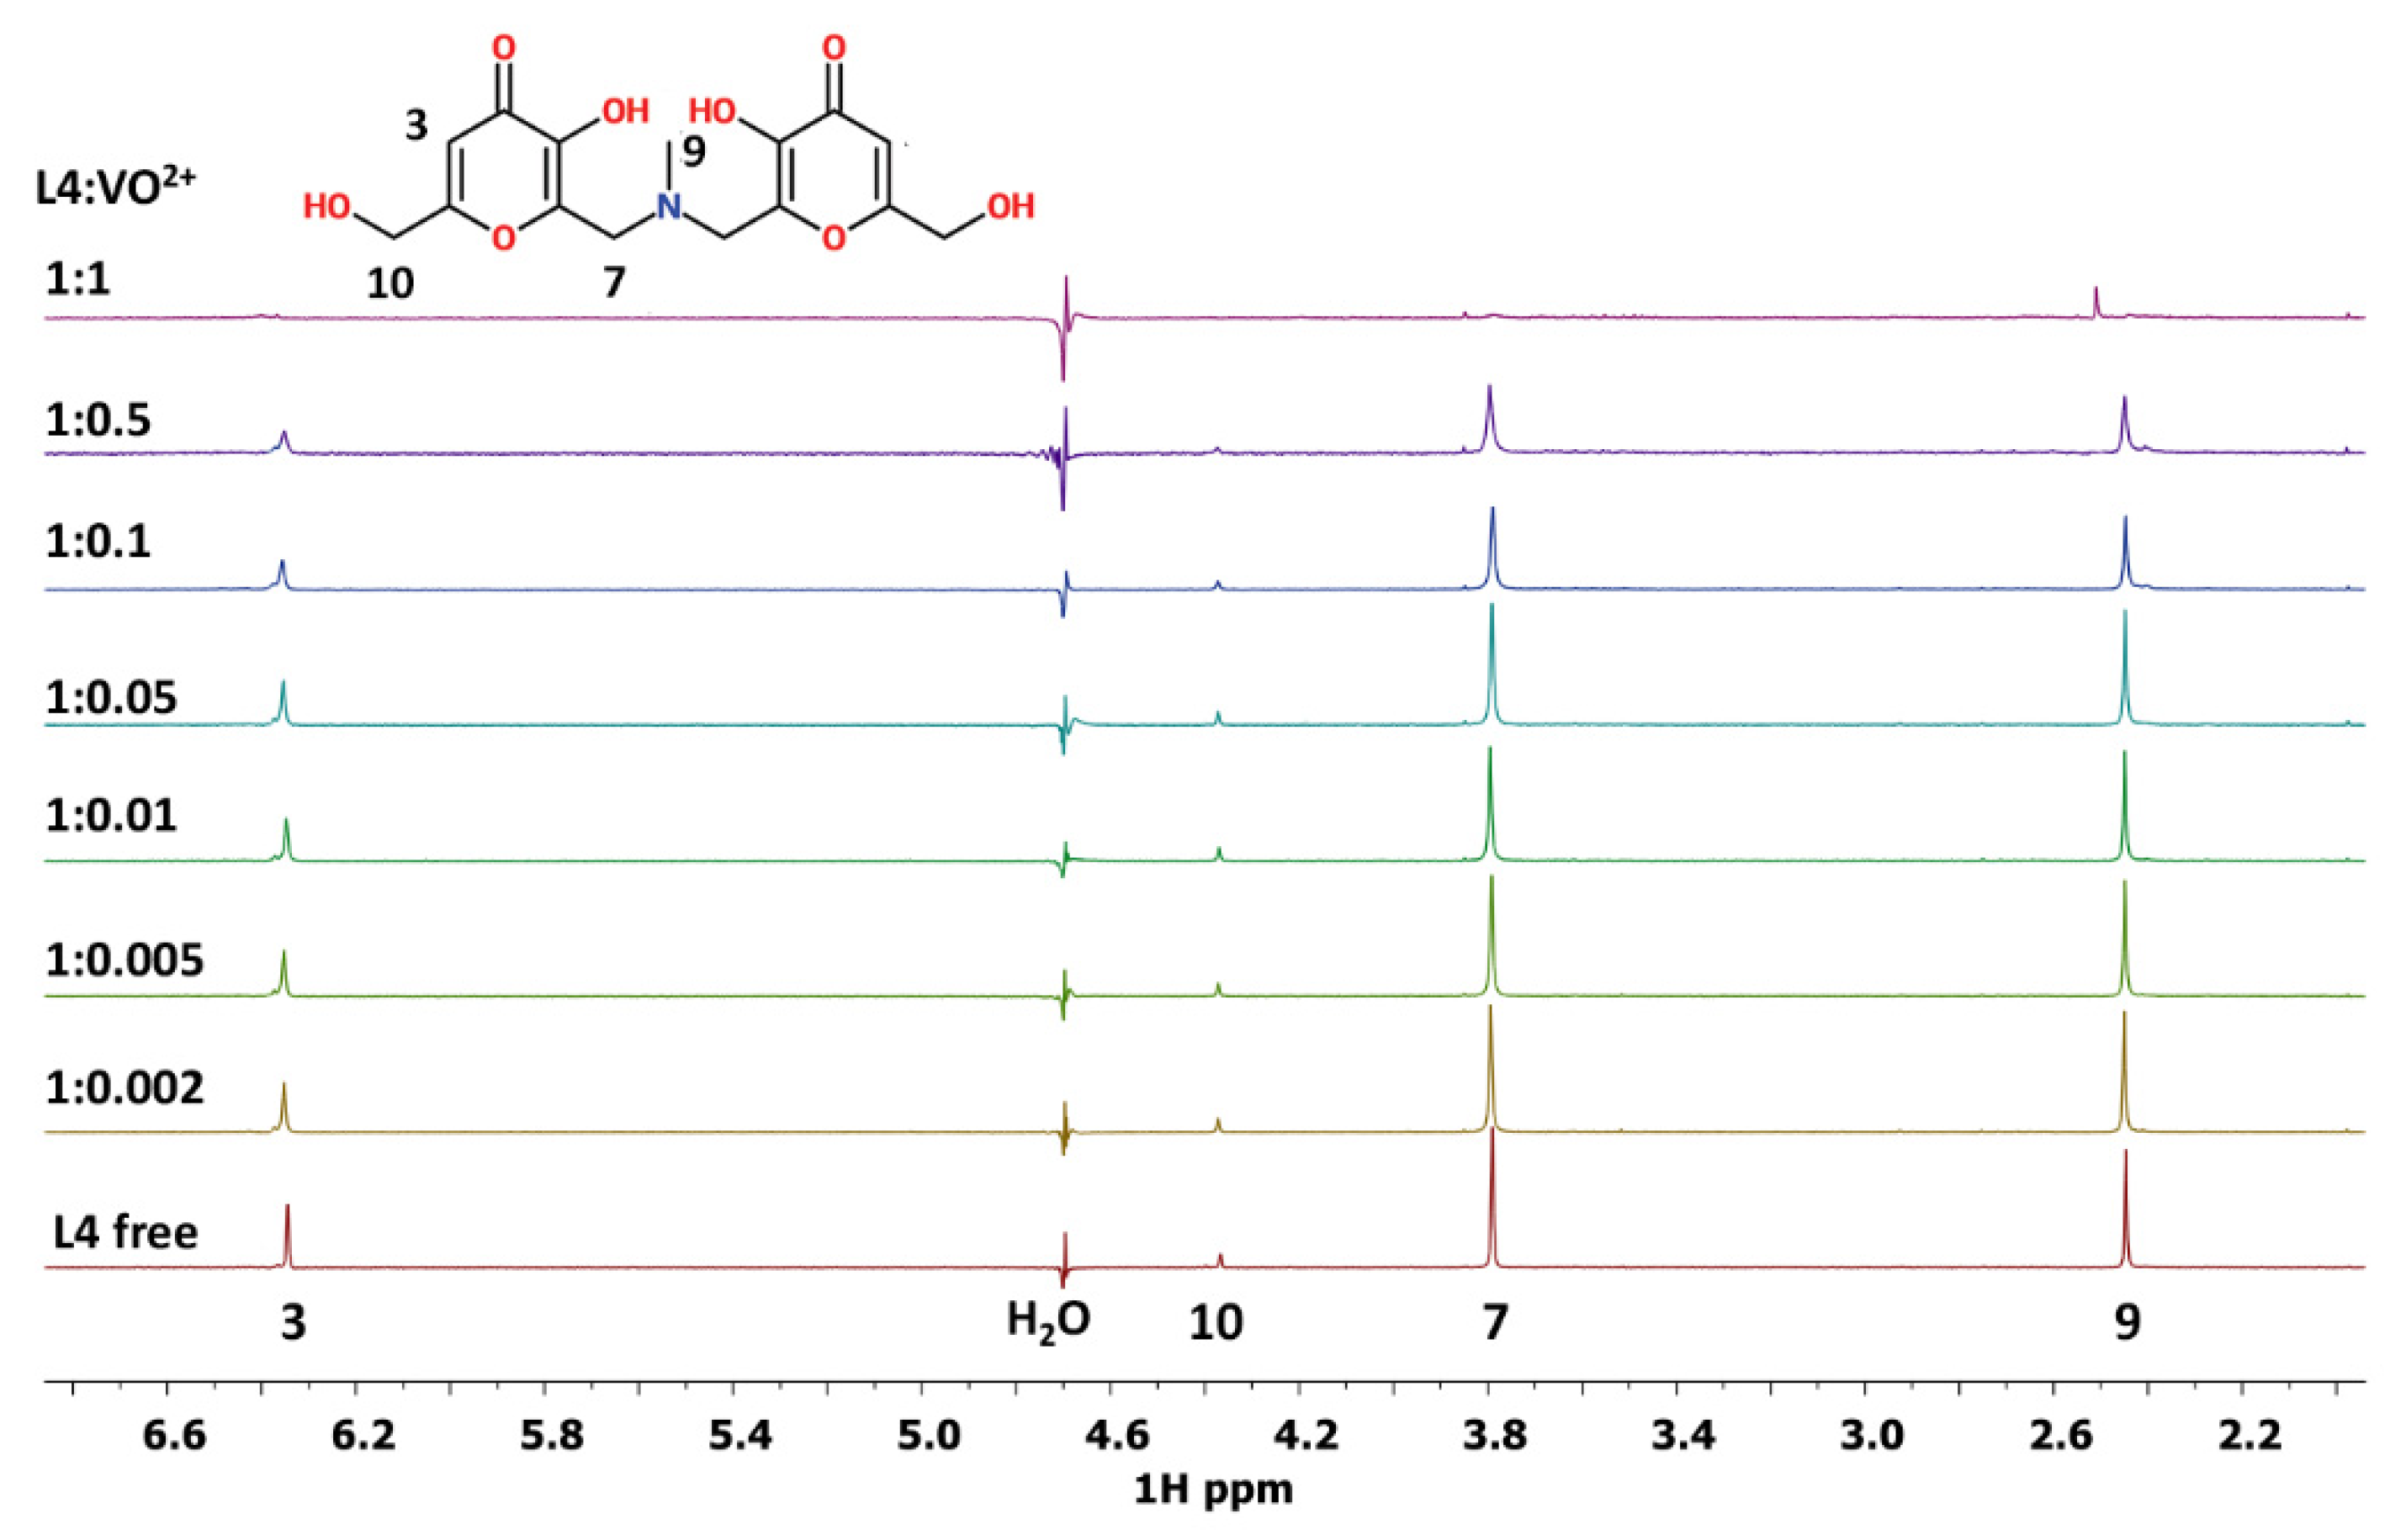
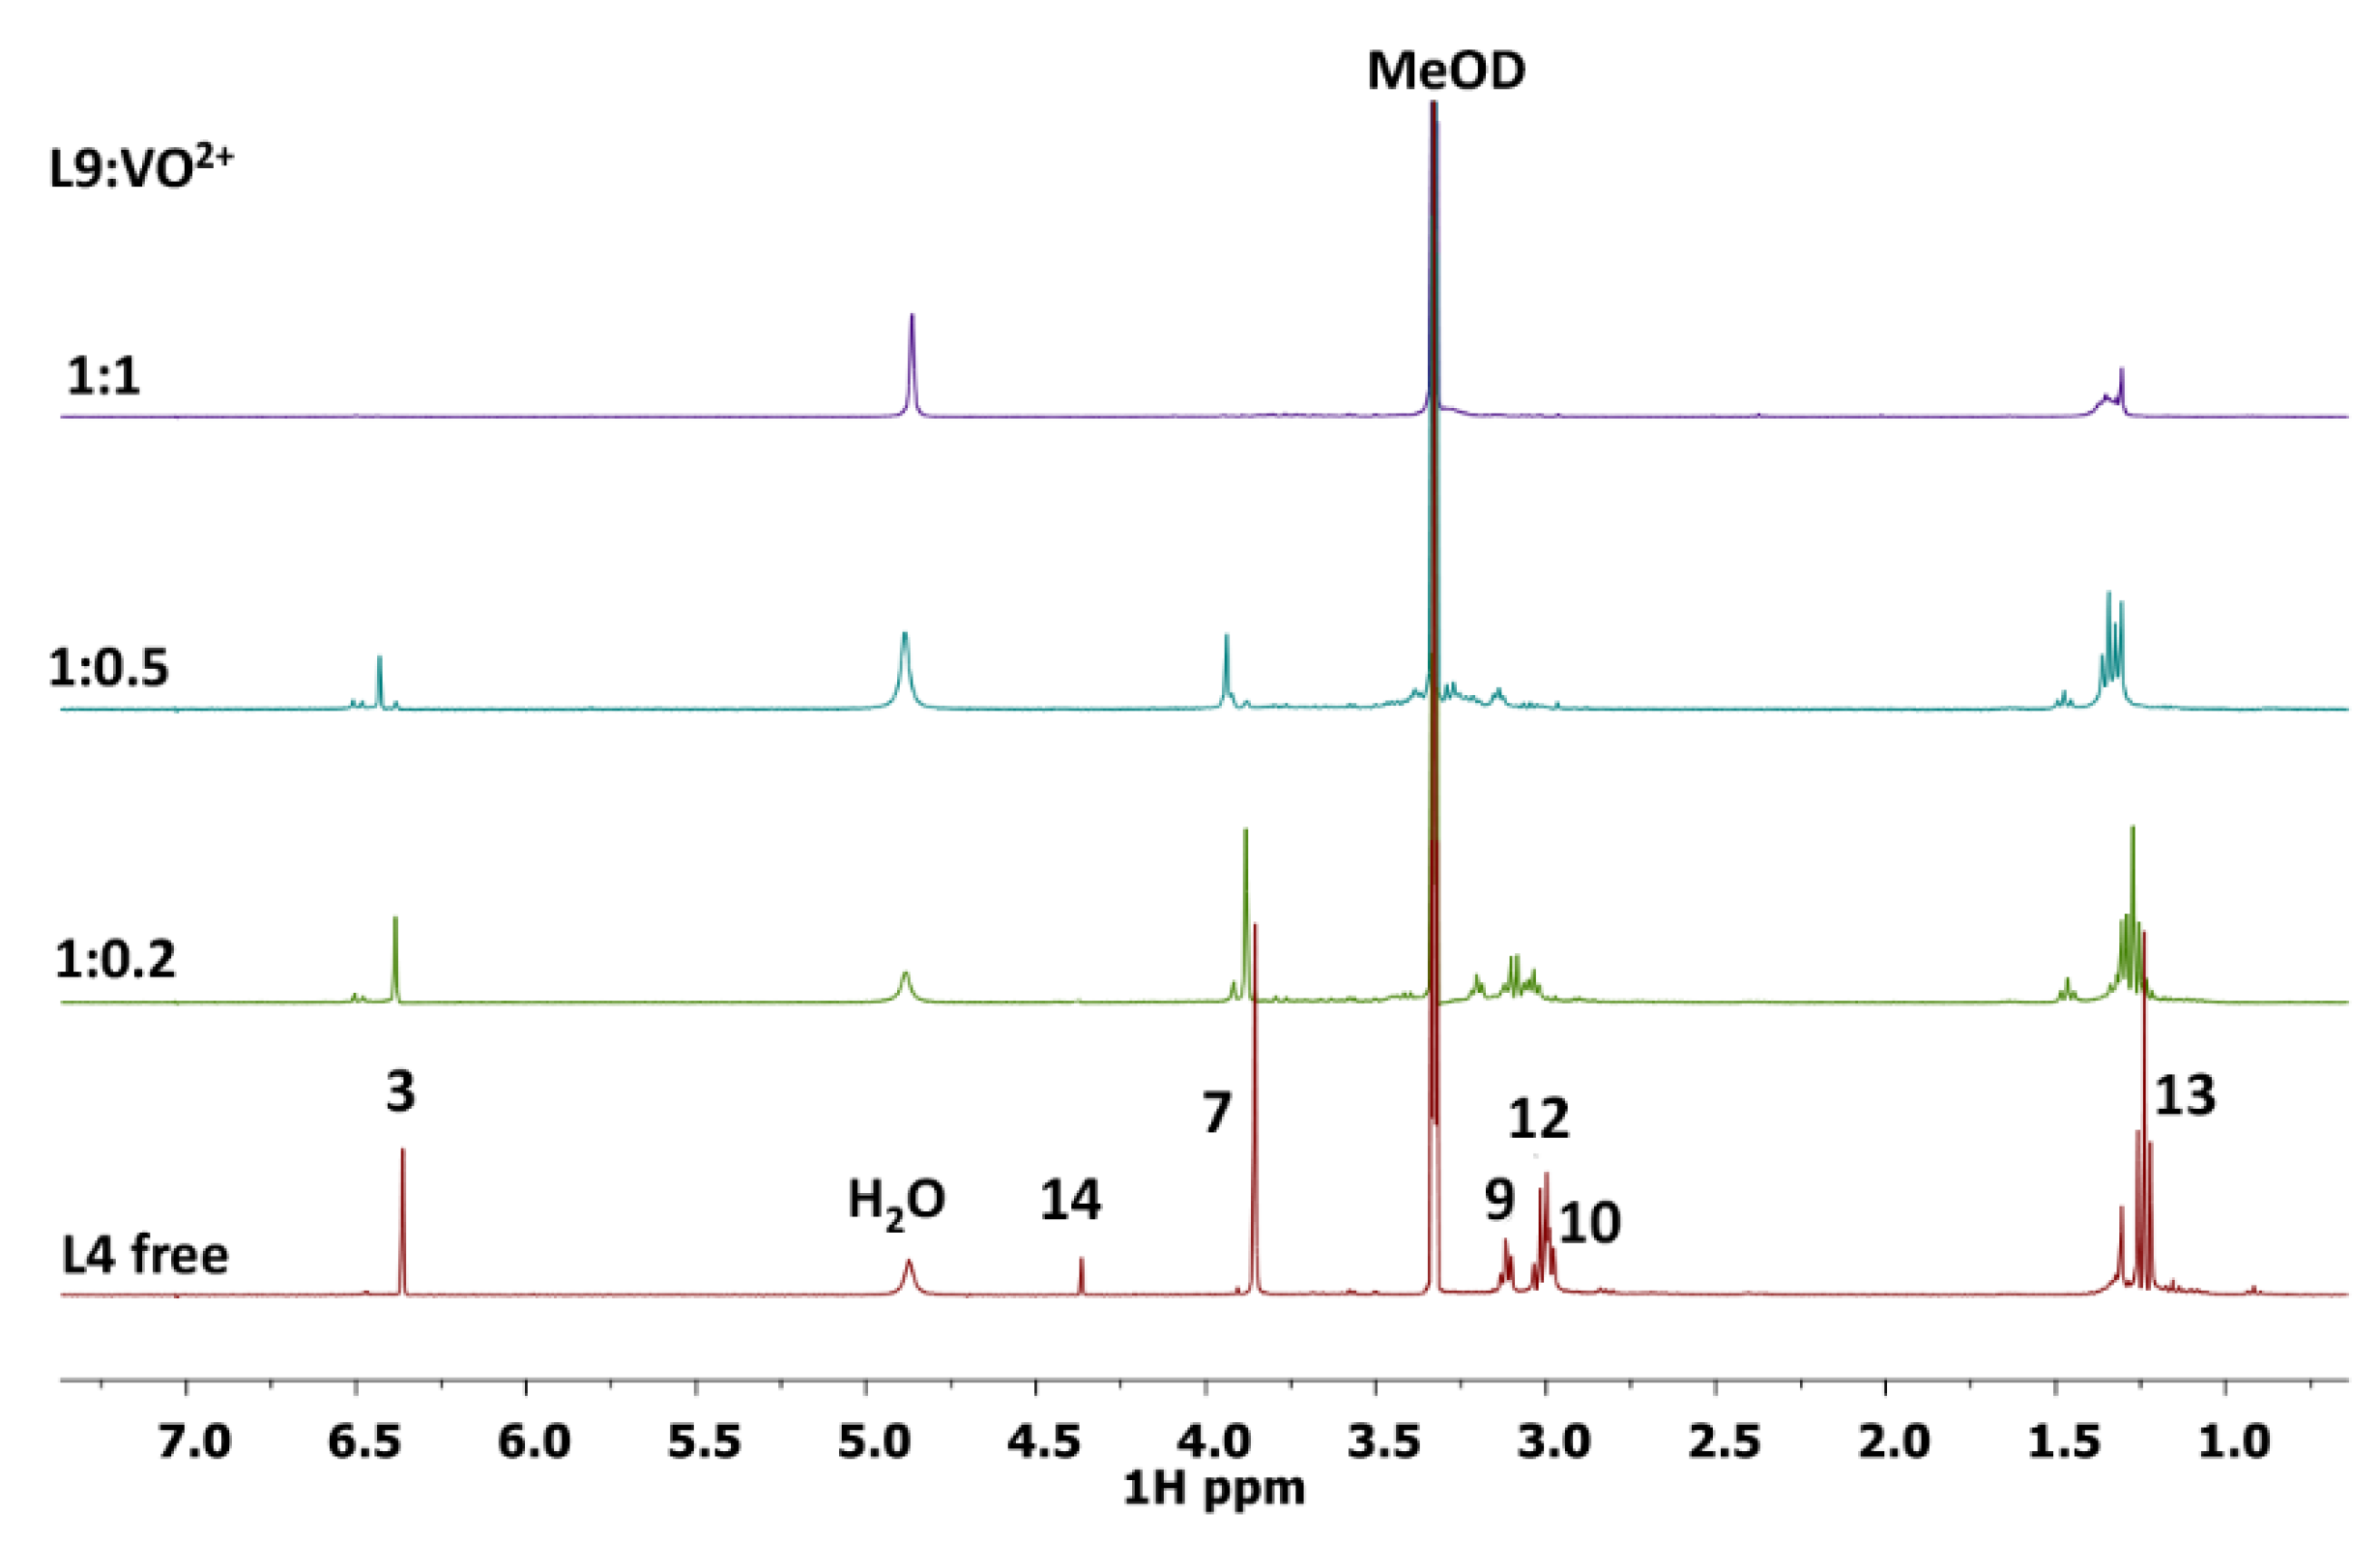
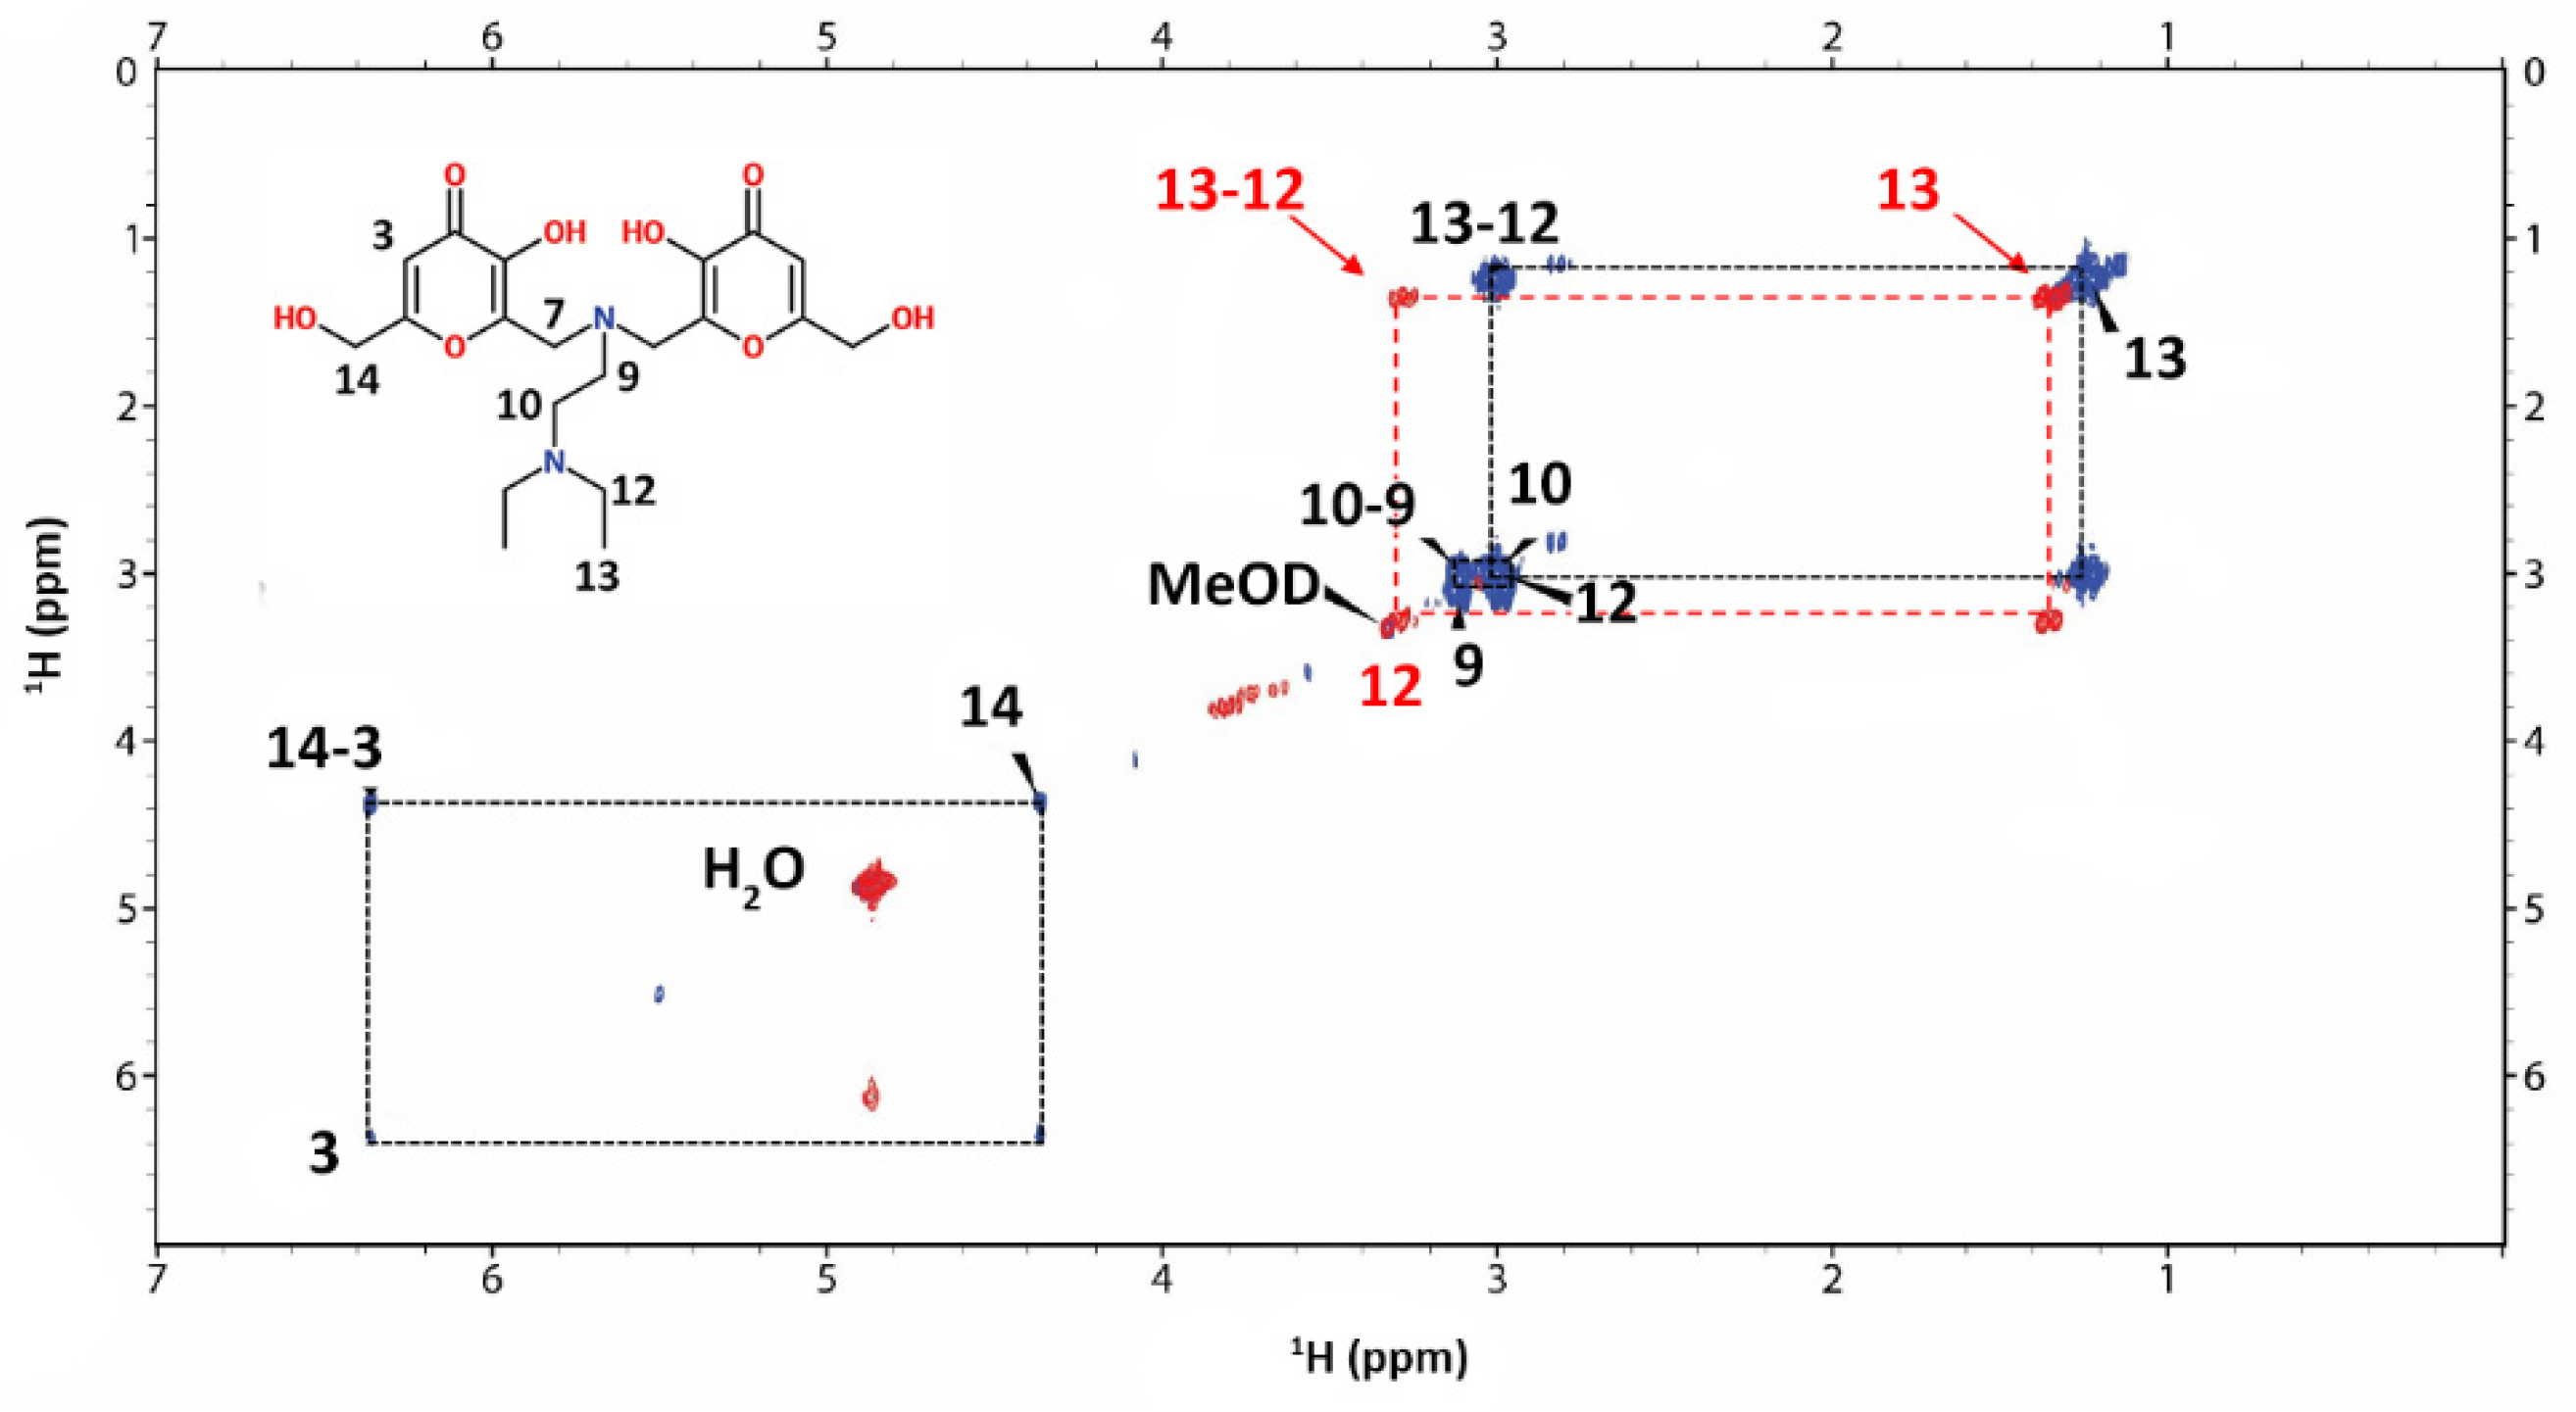
3.6. NMR Experiments
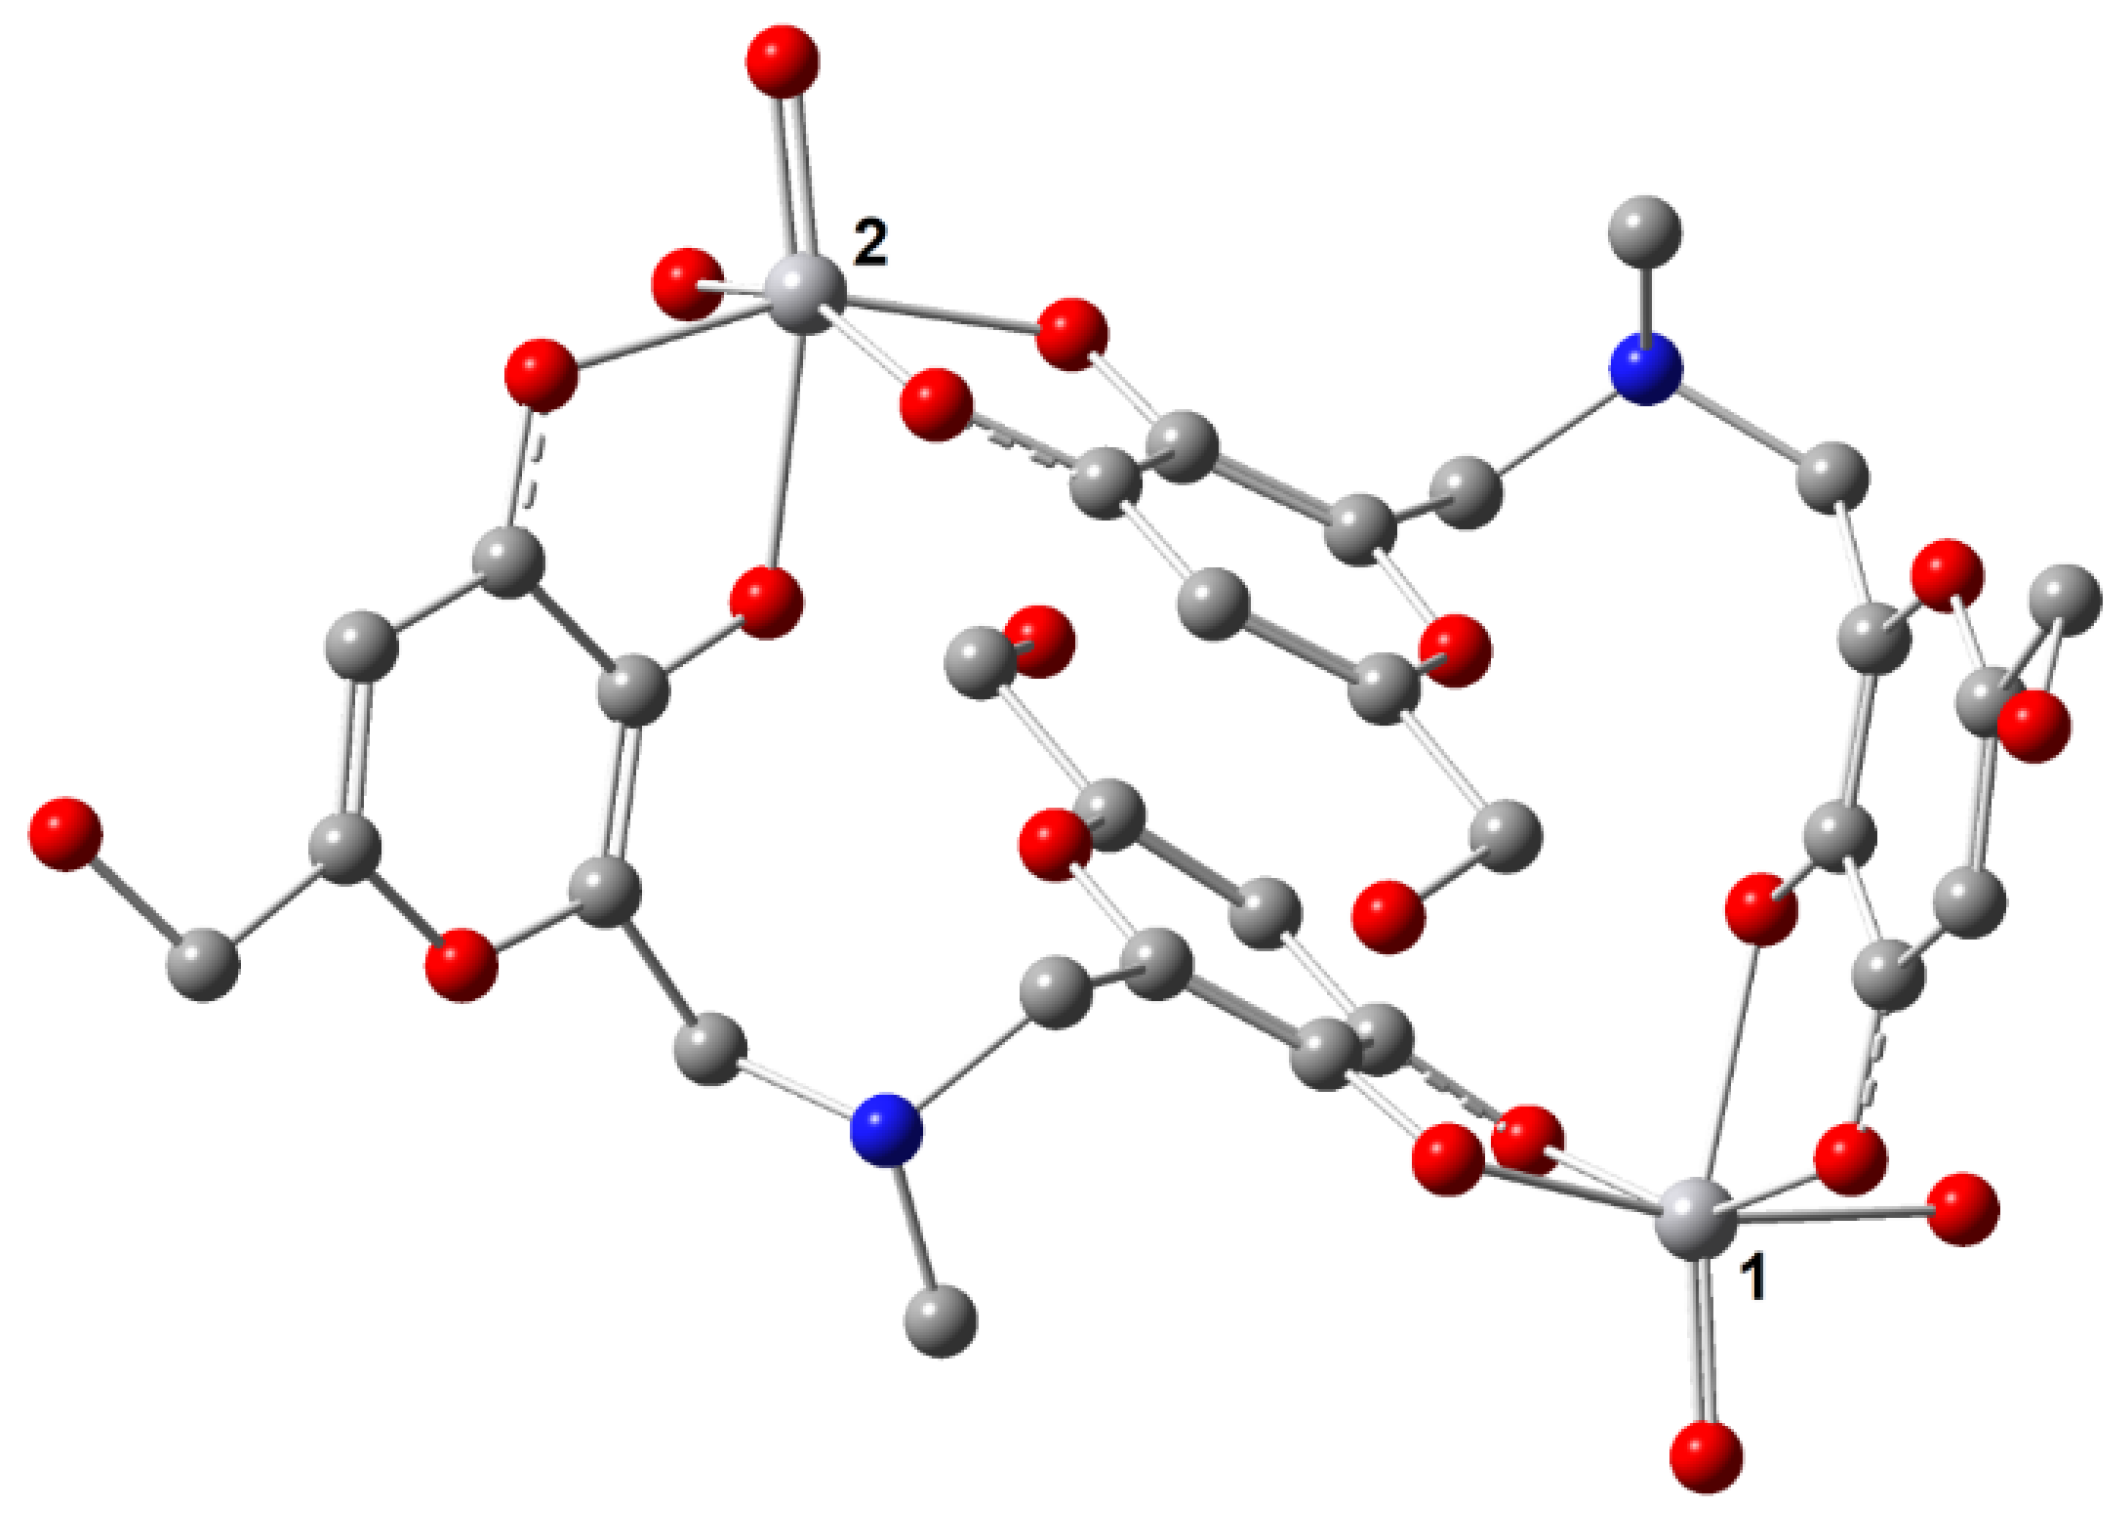
3.7. DFT Calculations
4. Conclusions
Supplementary Materials
Author Contributions
Funding
Institutional Review Board Statement
Informed Consent Statement
Data Availability Statement
Acknowledgments
Conflicts of Interest
References
- Gambino, D. Potentiality of vanadium compounds as anti-parasitic agents. Coord. Chem. Rev. 2011, 255, 2193–2203. [Google Scholar] [CrossRef]
- Pessoa, J.C.; Etcheverry, S.; Gambino, D. Vanadium compounds in medicine. Coord. Chem. Rev. 2015, 301–302, 24–48. [Google Scholar] [CrossRef]
- Rehder, D. Perspectives for vanadium in health issues. Future Med. Chem. 2016, 8, 325–338. [Google Scholar] [CrossRef]
- Treviño, S.; Díaz, A.; Sánchez-Lara, E.; Sanchez-Gaytan, B.L.; Perez-Aguilar, J.M.; González-Vergara, E. Vanadium in Biological Action: Chemical, Pharmacological Aspects, and Metabolic Implications in Diabetes Mellitus. Biol. Trace Elem. Res. 2019, 188, 68–98. [Google Scholar] [CrossRef] [Green Version]
- Crans, D.C.; Henry, L.; Cardiff, G.; Posner, B.I. Developing Vanadium as antidiabetic and anticancer drug: A clinical and historical perspective. In Essential Metals in Medicine: Therapeutic Use and Toxicity of Metal Ions in the Clinic; Carver, P.L., Ed.; De Gruyter GmbH: Berlin, Germany, 2019; pp. 203–230. [Google Scholar]
- Rehder, D. The potentiality of vanadium in medicinal applications. Inorg. Chim. Acta 2020, 504, 119445. [Google Scholar] [CrossRef]
- Ścibior, A.; Pietrzyk, Ł.; Plewa, Z.; Skiba, A. Vanadium: Risks and possible benefits in the light of a comprehensive overview of its pharmacotoxicological mechanisms and multi-applications with a summary of further research trends. J. Trace Elem. Med. Biol. 2020, 61, 126508. [Google Scholar] [CrossRef]
- Jakusch, T.; Hollender, D.; Enyedy, É.A.; González, C.S.; Montes-Bayón, M.; Sanz-Medel, A.; Costa Pessoa, J.; Tomaz, I.; Kiss, T. Biospeciation of various antidiabetic VIVO compounds in serum. Dalt. Trans. 2009, 2428–2437. [Google Scholar] [CrossRef]
- Verma, S.; Cam, M.C.; McNeill, J.H. Nutritional factors that can favorably influence the glucose/insulin system: Vanadium. J. Am. Coll. Nutr. 1998, 17, 11–18. [Google Scholar] [CrossRef] [PubMed]
- Marzban, L.; Rahimian, R.; Brownsey, R.W.; McNeill, J.H. Mechanisms by which bis(maltolato)oxovanadium(IV) normalizes phosphoenolpyruvate carboxykinase and glucose-6-phosphatase expression in streptozotocin-diabetic rats in vivo. Endocrinology 2002, 143, 4636–4645. [Google Scholar] [CrossRef] [PubMed] [Green Version]
- Kawabe, K.; Yoshikawa, Y.; Adachi, Y.; Sakurai, H. Possible mode of action for insulinomimetic activity of vanadyl(IV) compounds in adipocytes. Life Sci. 2006, 78, 2860–2866. [Google Scholar] [CrossRef] [PubMed]
- Kiss, T.; Jakusch, T.; Hollender, D.; Dörnyei, A. Biospeciation of insulin-mimetic VO(IV) complexes. ACS Symp. Ser. 2007, 974, 323–339. [Google Scholar] [CrossRef]
- Thompson, K.H.; Orvig, C. Vanadium in diabetes: 100 years from Phase 0 to Phase I. J. Inorg. Biochem. 2006, 100, 1925–1935. [Google Scholar] [CrossRef]
- Kiss, T.; Jakusch, T. Insulin-Mimetic Vanadium-Containing Compounds. In Metallotherapeutic Drugs and Metal-Based Diagnostic Agents: The Use of Metals in Medicine; TieknikR, T.M., Gielen, E., Eds.; John Wiley & Sons, Ltd.: Hoboken, NJ, USA, 2004. [Google Scholar]
- Sakurai, H.; Fugono, J.; Yasui, H. Pharmacokinetic Study and Trial for Preparation of Enteric-Coated Capsule Containing Insulinomimetic Vanadyl Compounds: Implications for Clinical Use. Mini-Rev. Med. Chem. 2005, 4, 41–48. [Google Scholar] [CrossRef]
- Kioseoglou, E.; Petanidis, S.; Gabriel, C.; Salifoglou, A. The chemistry and biology of vanadium compounds in cancer therapeutics. Coord. Chem. Rev. 2015, 301–302, 87–105. [Google Scholar] [CrossRef]
- Leon, I.E.; Cadavid-Vargas, J.F.; Di Virgilio, A.L.; Etcheverry, S.B. Vanadium, Ruthenium and Copper Compounds: A New Class of Nonplatinum Metallodrugs with Anticancer Activity. Curr. Med. Chem. 2017, 24, 112–148. [Google Scholar] [CrossRef] [PubMed]
- Crans, D.C.; Yang, L.; Haase, A.; Yang, X. Health Benefits of Vanadium and Its Potential as an Anticancer Agent. In Metallo-Drugs: Development and Action of Anticancer Agents; Sigel, A., Sigel, H., Freisinger, E., Sigel, R.K.O., Eds.; De Gruyter GmbH: Berlin, Germany, 2018; pp. 251–280. [Google Scholar]
- Rozzo, C.; Sanna, D.; Garribba, E.; Serra, M.; Cantara, A.; Palmieri, G.; Pisano, M. Antitumoral effect of vanadium compounds in malignant melanoma cell lines. J. Inorg. Biochem. 2017, 174, 14–24. [Google Scholar] [CrossRef] [PubMed]
- Pisano, M.; Arru, C.; Serra, M.; Galleri, G.; Sanna, D.; Garribba, E.; Palmieri, G.; Rozzo, C. Antiproliferative activity of vanadium compounds: Effects on the major malignant melanoma molecular pathways. Metallomics 2019, 11, 1687–1699. [Google Scholar] [CrossRef]
- Etcheverry, S.B.; Di Virgilio, A.L.; Nascimento, O.R.; Williams, P.A.M. Dinuclear copper(II) complexes with valsartan. Synthesis, characterization and cytotoxicity. J. Inorg. Biochem. 2012, 107, 25–33. [Google Scholar] [CrossRef] [PubMed]
- Marques, M.P.M. Platinum and Palladium Polyamine Complexes as Anticancer Agents: The Structural Factor. ISRN Spectrosc. 2013, 2013, 1–29. [Google Scholar] [CrossRef]
- Fernandes, T.A.; Mendes, F.; Roseiro, A.P.S.; Santos, I.; Carvalho, M.F.N.N. Insight into the cytotoxicity of polynuclear Cu(I) camphor complexes. Polyhedron 2015, 87, 215–219. [Google Scholar] [CrossRef]
- Billecke, C.; Finniss, S.; Tahash, L.; Miller, C.; Mikkelsen, T.; Farrell, N.P.; Bögler, O. Polynuclear platinum anticancer drugs are more potent than cisplatin and induce cell cycle arrest in glioma. Neuro. Oncol. 2006, 8, 215–226. [Google Scholar] [CrossRef] [Green Version]
- Cindrić, M.; Bjelopetrović, A.; Pavlović, G.; Damjanović, V.; Lovrić, J.; Matković-Čalogović, D.; Vrdoljak, V. Copper(ii) complexes with benzhydrazone-related ligands: Synthesis, structural studies and cytotoxicity assay. New J. Chem. 2017, 41, 2425–2435. [Google Scholar] [CrossRef]
- Reddy, T.S.; Pooja, D.; Privér, S.H.; Luwor, R.B.; Mirzadeh, N.; Ramesan, S.; Ramakrishna, S.; Karri, S.; Kuncha, M.; Bhargava, S.K. Potent and Selective Cytotoxic and Anti-inflammatory Gold(III) Compounds Containing Cyclometalated Phosphine Sulfide Ligands. Chem. A Eur. J. 2019, 25, 14089–14100. [Google Scholar] [CrossRef]
- Bhunia, A.; Mistri, S.; Manne, R.K.; Santra, M.K.; Manna, S.C. Synthesis, crystal structure, cytotoxicity study, DNA/protein binding and molecular docking of dinuclear copper(II) complexes. Inorganica Chim. Acta 2019, 491, 25–33. [Google Scholar] [CrossRef]
- Radisavljević, S.; Petrović, B. Gold(III) Complexes: An Overview on Their Kinetics, Interactions With DNA/BSA, Cytotoxic Activity, and Computational Calculations. Front. Chem. 2020, 8, 1–8. [Google Scholar] [CrossRef]
- Levina, A.; Lay, P.A. Vanadium(V/IV)-Transferrin Binding Disrupts the Transferrin Cycle and Reduces Vanadium Uptake and Antiproliferative Activity in Human Lung Cancer Cells. Inorg. Chem. 2020, 59, 16143–16153. [Google Scholar] [CrossRef] [PubMed]
- Berto, S.; Alladio, E.; Daniele, P.G.; Laurenti, E.; Bono, A.; Sgarlata, C.; Valora, G.; Cappai, R.; Lachowicz, J.I.; Nurchi, V.M. Oxovanadium(IV) coordination compounds with kojic acid derivatives in aqueous solution. Molecules 2019, 24, 3768. [Google Scholar] [CrossRef] [PubMed] [Green Version]
- Toso, L.; Crisponi, G.; Nurchi, V.M.; Crespo-Alonso, M.; Lachowicz, J.I.; Santos, M.A.; Marques, S.M.; Niclós-Gutiérrez, J.; González-Pérez, J.M.; Domínguez-Martín, A.; et al. A family of hydroxypyrone ligands designed and synthesized as iron chelators. J. Inorg. Biochem. 2013, 127, 220–231. [Google Scholar] [CrossRef]
- Lachowicz, J.I.; Nurchi, V.M.; Crisponi, G.; Jaraquemada-Pelaez, M.D.G.; Ostrowska, M.; Jezierska, J.; Gumienna-Kontecka, E.; Peana, M.; Zoroddu, M.A.; Choquesillo-Lazarte, D.; et al. Zinc(II) and copper(II) complexes with hydroxypyrone iron chelators. J. Inorg. Biochem. 2015, 151, 94–106. [Google Scholar] [CrossRef]
- Nurchi, V.M.; Crisponi, G.; Arca, M.; Crespo-Alonso, M.; Lachowicz, J.I.; Mansoori, D.; Toso, L.; Pichiri, G.; Amelia Santos, M.; Marques, S.M.; et al. A new bis-3-hydroxy-4-pyrone as a potential therapeutic iron chelating agent. Effect of connecting and side chains on the complex structures and metal ion selectivity. J. Inorg. Biochem. 2014, 141, 132–143. [Google Scholar] [CrossRef]
- Peana, M.; Medici, S.; Nurchi, V.M.; Lachowicz, J.I.; Crisponi, G.; Crespo-Alonso, M.; Santos, M.A.; Zoroddu, M.A. An NMR study on the 6,6′-(2-(diethylamino)ethylazanediyl)bis(methylene)bis(5-hydroxy-2-hydroxymethyl-4H-pyran-4-one) interaction with AlIII and ZnII ions. J. Inorg. Biochem. 2015, 148, 69–77. [Google Scholar] [CrossRef]
- Albert, A.; Serjeant, E.P. The Determination of Ionization Constants: A Laboratory Manual; Chapman and Hall: New York, NY, USA, 1984. [Google Scholar]
- Berto, S.; Daniele, P.G.; Foti, C.; Prenesti, E.; Sammartano, S. Interaction of oxovanadium(IV) with carboxylic ligands in aqueous solution: A thermodynamic and visible spectrophotometric study. J. Mol. Liq. 2008, 142, 57–63. [Google Scholar] [CrossRef]
- Smith, G.F.; McCurdy, W.H.; Diehl, H. The colorimetric determination of iron in raw and treated municipal water supplies by use of 4:7-diphenyl-1:10-phenanthroline. Analyst 1952, 77, 418–422. [Google Scholar] [CrossRef]
- Gans, P.; Sabatini, A.; Vacca, A. Investigation of equilibria in solution. Determination of equilibrium constants with the HYPERQUAD suite of programs. Talanta 1996, 43, 1739–1753. [Google Scholar] [CrossRef]
- Frassineti, C.; Ghelli, S. NMR as a tool for determining protonation constants of nutral polyprotic bases in solution. Anal. Biochem. 1995, 231, 374–382. [Google Scholar] [CrossRef]
- Henry, R.P.; Mitchell, P.C.H.; Prue, J.E. Hydrolysis of the oxovanadium(IV) ion and the stability of its complexes with the 1,2-dihydroxybenzenato(2–) ion. J. Chem. Soc. Dalton Trans. 1973, 1156–1159. [Google Scholar] [CrossRef]
- Komura, M.A.; Hayashi, H.I. Hydrolytic Behavior of Oxovanadium(4) Ions. Bull. Chem. Soc. Jpn. 1977, 50, 2927–2931. [Google Scholar] [CrossRef] [Green Version]
- Vilas Boas, L.V.; Costa Pessoa, J. Vanadium. In Comprehensive Coordination Chemistry: The Synthesis, Reactions, Properties & Applications of Coordination Compounds; Wilkinson, G., Gillard, R., Mc Cleverty, J.A., Eds.; Pergamon Press: Oxford, UK, 1985; pp. 453–583. [Google Scholar]
- Stoll, S.; Schweiger, A. EasySpin, a comprehensive software package for spectral simulation and analysis in EPR. J. Magn. Reson. 2006, 178, 42–55. [Google Scholar] [CrossRef] [PubMed]
- Stoll, S.; Britt, R.D. General and efficient simulation of pulse EPR spectra. Phys. Chem. Chem. Phys. 2009, 11, 6614–6625. [Google Scholar] [CrossRef]
- Stoll, S. CW-EPR spectral simulations: Solid state. Methods Enzymol. 2015, 563, 121–142. [Google Scholar]
- Frisch, M.J.; Trucks, G.W.; Schlegel, H.B.; Scuseria, G.E.; Robb, M.A.; Cheeseman, J.R.; Scalmani, G.; Barone, V.; Mennucci, B.; Petersson, G.A.; et al. Gaussian 09, Revision D.01; Gaussian, Inc.: Wallingford, CT, USA, 2010. [Google Scholar]
- Marenich, A.V.; Cramer, C.J.; Truhlar, D.G. Universal Solvation Model Based on Solute Electron Density and on a Continuum Model of the Solvent Defined by the Bulk Dielectric Constant and Atomic Surface Tensions. J. Phys. Chem. B 2009, 113, 6378–6396. [Google Scholar] [CrossRef] [PubMed]
- Becke, A.D. Density-functional thermochemistry. III. The role of exact exchange. J. Chem. Phys. 1993, 98, 5648–5652. [Google Scholar] [CrossRef] [Green Version]
- Perdew, J.P. Density-functional approximation for the correlation energy of the inhomogeneous electron gas. Phys. Rev. B 1986, 33, 8822–8824, Erratum in 1986, 34, 7406. [Google Scholar] [CrossRef] [PubMed]
- Micera, G.; Garribba, E. The effect of the functional, basis set, and solvent in the simulation of the geometry and spectroscopic properties of V. Int. J. Quantum Chem. 2012, 112, 2486–2498. [Google Scholar] [CrossRef]
- Neese, F.; Wennmohs, F.; Becker, U.; Riplinger, C. The ORCA quantum chemistry program package. J. Chem. Phys. 2020, 152, 224108. [Google Scholar] [CrossRef] [PubMed]
- Rodríguez-Fortea, A.; Alemany, P.; Alvarez, S.; Ruiz, E. A Theoretical Study of the Exchange Coupling in Hydroxo- and Alkoxo-Bridged Dinuclear Oxovanadium(IV) Compounds. Eur. J. Inorg. Chem. 2004, 143–153. [Google Scholar] [CrossRef]
- Ruiz, E.; Cano, J.; Alvarez, S.; Alemany, P. Broken symmetry approach to calculation of exchange coupling constants for homobinuclear and heterobinuclear transition metal complexes. J. Comput. Chem. 1999, 20, 1391–1400. [Google Scholar] [CrossRef]
- Micera, G.; Garribba, E. Is the spin-orbit coupling important in the prediction of the 51V hyperfine coupling constants of VIVO2+ species? ORCA versus Gaussian performance and biological applications. J. Comput. Chem. 2011, 32, 2822–2835. [Google Scholar] [CrossRef]
- Alderighi, L.; Gans, P.; Ienco, A.; Peters, D.; Sabatini, A.; Vacca, A. Hyperquad simulation and speciation (HySS): A utility program for the investigation of equilibria involving soluble and partially soluble species. Coord. Chem. Rev. 1999, 184, 311–318. [Google Scholar] [CrossRef]
- Buglyó, P.; Kiss, E.; Fabian, I.; Kiss, T.; Sanna, D.; Garribba, E.M. Speciation and NMR relaxation studies of VO(IV) complexes with several O-donor containing ligands: Oxalate, malonate, maltolate and kojate. Inorg. Chim. Acta 2000, 306, 174–183. [Google Scholar] [CrossRef]
- Yuen, V.G.; Caravan, P.; Gelmini, L.; Glover, N.; McNeill, J.H.; Setyawati, I.A.; Zhou, Y.; Orvig, C. Glucose-lowering properties of vanadium compounds: Comparison of coordination complexes with maltol or kojic acid as ligands. J. Inorg. Biochem. 1997, 68, 109–116. [Google Scholar] [CrossRef]
- Sanna, D.; Buglyó, P.; Bíró, L.; Micera, G.; Garribba, E. Coordinating properties of pyrone and pyridinone derivatives, tropolone and catechol toward the VO2+ ion: An experimental and computational approach. Eur. J. Inorg. Chem. 2012, 1079–1092. [Google Scholar] [CrossRef]
- Di Marco, V.B.; Bombi, G.G. Electrospray mass spectrometry (ESI-MS) in the study of metal-ligand solution equilibria. Mass Spectrom. Rev. 2006, 25, 347–379. [Google Scholar] [CrossRef] [PubMed]
- Sanna, D.; Ugone, V.; Micera, G.; Buglyó, P.; Bíró, L.; Garribba, E. Speciation in human blood of Metvan, a vanadium based potential anti-tumor drug. Dalt. Trans. 2017, 46, 8950–8967. [Google Scholar] [CrossRef]
- Sanna, D.; Ugone, V.; Sciortino, G.; Buglyó, P.; Bihari, Z.; Parajdi-Losonczi, P.L.; Garribba, E. VIVO complexes with antibacterial quinolone ligands and their interaction with serum proteins. Dalt. Trans. 2018, 47, 2164–2182. [Google Scholar] [CrossRef] [PubMed] [Green Version]
- Sojo, L.E.; Chahal, N.; Keller, B.O. Oxidation of catechols during positive ion electrospray mass spectrometric analysis: Evidence for in-source oxidative dimerization. Rapid Commun. Mass Spectrom. 2014, 28, 2181–2190. [Google Scholar] [CrossRef] [PubMed]
- Pisano, L.; Varnagy, K.; Timari, S.; Hegetschweiler, K.; Micera, G. VIVO Versus VIV Complex Formation by Tridentate (O, Narom, O) Ligands: Prediction of Geometry, EPR 51V Hyperfine Coupling Constants, and UV−Vis Spectra. Inorg. Chem. 2013, 52, 5260–5272. [Google Scholar] [CrossRef] [PubMed]
- Sanna, D.; Várnagy, K.; Lihi, N.; Micera, G.; Garribba, E. Formation of New Non-oxido Vanadium(IV) Species in Aqueous Solution and in the Solid State by Tridentate (O, N, O) Ligands and Rationalization of Their EPR Behavior. Inorg. Chem. 2013, 52, 8202–8213. [Google Scholar] [CrossRef] [PubMed]
- Smith, T.D.; Pilbrow, J.R. The determination of structural properties of dimeric transition metal ion complexes from EPR spectra. Coord. Chem. Rev. 1974, 13, 173–278. [Google Scholar] [CrossRef]
- Paine, T.K.; Weyhermüller, T.; Bill, E.; Bothe, E.; Chaudhuri, P. Templating Schiff-Base Lateral Macrobicycles: An Experimental and Theoretical Structural Study of the Intermediates. Eur. J. Inorg. Chem. 2003, 42, 4299–4307. [Google Scholar] [CrossRef]
- Smith, T.D.; Boas, J.F.; Pilbrow, J.R. An electron spin resonance study of certain vanadyl polyaminocarboxylate chelates formed in aqueous and frozen aqueous solutions. Aust. J. Chem. 1974, 27, 2535–2545. [Google Scholar] [CrossRef]
- Hanson, G.R.; Sun, Y.; Orvig, C. Characterization of the Potent Insulin Mimetic Agent Bis(maltolato)oxovanadium(IV) (BMOV) in Solution by EPR Spectroscopy. Inorg. Chem. 1996, 35, 6507–6512. [Google Scholar] [CrossRef] [PubMed]


| L4 | L9 | |||
|---|---|---|---|---|
| Species | log β | log K | log β | log K |
| [LH]− | 9.19 (3) | 9.19 a | 10.81 (1) | 10.81 |
| LH2 | 16.70 (3) | 7.51 a | 19.04 (2) | 8.23 a |
| [LH3]+ | 21.08 (5) | 4.38 | 25.99 (2) | 6.95 a |
| [LH4]2+ | 26.50 (4) | 0.51 | ||
| L4 | L9 | |||
|---|---|---|---|---|
| Species | log β | pK | log β | pK |
| [VIVOLH2]2+ | 22.08 (1) | 26.03 (3) | ||
| [(VIVO)2L2H3]3+ | – | 52.73 (4) | 4.41 | |
| [(VIVO)2L2H2]2+ | 41.63 (2) | 4.63 | 48.32 (2) | 7.30 |
| [(VIVO)2L2H]+ | 37.00 (1) | 7.24 | 41.02 (3) | |
| [(VIVO)2L2] | 29.76 (1) | – | ||
| pVIVO2+ | 12.9 | 11.1 | ||
| Species | Composition | m/z (exptl) a | m/z (calcd) a | Deviation (ppm) b |
|---|---|---|---|---|
| [(VIVO)2(L4)2+2H]2+ | C30H32N2O18V2 | 405.02573 | 405.02592 | −0.5 |
| [(VIVO)2(L4)2+H+Na]2+ | C30H31N2O18V2Na | 416.01658 | 416.01689 | −0.7 |
| [(VIVO)2(L4)2+H]+ | C30H31N2O18V2 | 809.04406 | 809.04457 | −0.6 |
| [(VIVO)2(L4)2+Na]+ | C30H30N2O18V2Na | 831.02600 | 831.02651 | −0.6 |
| [(VIVO)2(L4)2+K]+ | C30H30N2O18V2K | 846.99983 | 847.00045 | −0.7 |
| [(VIVO)2(L9)2+2H]2+ | C40H54O18N4V2 | 490.11474 | 490.11507 | −0.7 |
| [(VIVO)2(L9)2+H]+ c | C40H53O18N4V2 | 979.22286 | 979.22235 | 0.5 |
| [(VVO2)(VIVO)2(L9)3+4H]3+ d | C60H82O28N6V3 | 495.78245 | 495.78265 | −0.4 |
| [(VVO2)(VIVO)2(L9)3+3H]2+ d | C60H81O28N6V3 | 743.17012 | 743.17034 | −0.3 |
| [(VV2O3)(VIVO)2(L9)4+3H]3+ d | C80H107O37N8V4 | 658.48251 | 658.48264 | −0.2 |
| [(VV2O3)(VIVO)2(L9)4+H2O+3H]3+ d | C80H109O38N8V4 | 664.48597 | 664.48616 | −0.3 |
| [(VV2O3)(VIVO)2(L9)4+H2O+2H+Na]3+ d | C80H108O38N8V4Na | 671.81325 | 671.81348 | −0.3 |
| [(VV2O3)(VIVO)2(L9)4+H2O+2H]2+ d | C80H108O38N8V4 | 966.22516 | 966.22560 | −0.5 |
| VIVO2+ Center | Axcalcd(51V) b | Aycalcd(51V) b | Azcalcd(51V) b | Azexptl(51V) | PD(Az) a |
|---|---|---|---|---|---|
| 1 | −71.0 | −65.5 | −168.7 | −170.1 | −0.8 |
| 2 | −72.1 | −69.0 | −171.2 | −170.1 | 0.7 |
Publisher’s Note: MDPI stays neutral with regard to jurisdictional claims in published maps and institutional affiliations. |
© 2021 by the authors. Licensee MDPI, Basel, Switzerland. This article is an open access article distributed under the terms and conditions of the Creative Commons Attribution (CC BY) license (https://creativecommons.org/licenses/by/4.0/).
Share and Cite
Cappai, R.; Crisponi, G.; Sanna, D.; Ugone, V.; Melchior, A.; Garribba, E.; Peana, M.; Zoroddu, M.A.; Nurchi, V.M. Thermodynamic Study of Oxidovanadium(IV) with Kojic Acid Derivatives: A Multi-Technique Approach. Pharmaceuticals 2021, 14, 1037. https://0-doi-org.brum.beds.ac.uk/10.3390/ph14101037
Cappai R, Crisponi G, Sanna D, Ugone V, Melchior A, Garribba E, Peana M, Zoroddu MA, Nurchi VM. Thermodynamic Study of Oxidovanadium(IV) with Kojic Acid Derivatives: A Multi-Technique Approach. Pharmaceuticals. 2021; 14(10):1037. https://0-doi-org.brum.beds.ac.uk/10.3390/ph14101037
Chicago/Turabian StyleCappai, Rosita, Guido Crisponi, Daniele Sanna, Valeria Ugone, Andrea Melchior, Eugenio Garribba, Massimiliano Peana, Maria Antonietta Zoroddu, and Valeria Marina Nurchi. 2021. "Thermodynamic Study of Oxidovanadium(IV) with Kojic Acid Derivatives: A Multi-Technique Approach" Pharmaceuticals 14, no. 10: 1037. https://0-doi-org.brum.beds.ac.uk/10.3390/ph14101037