
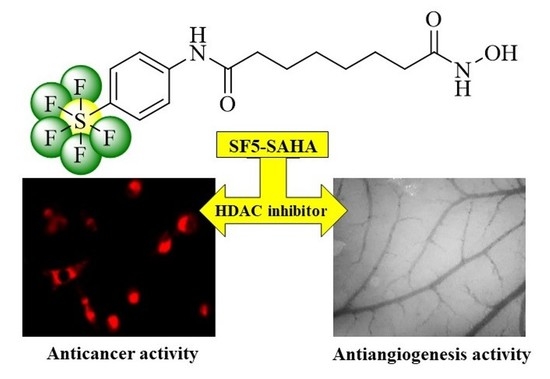
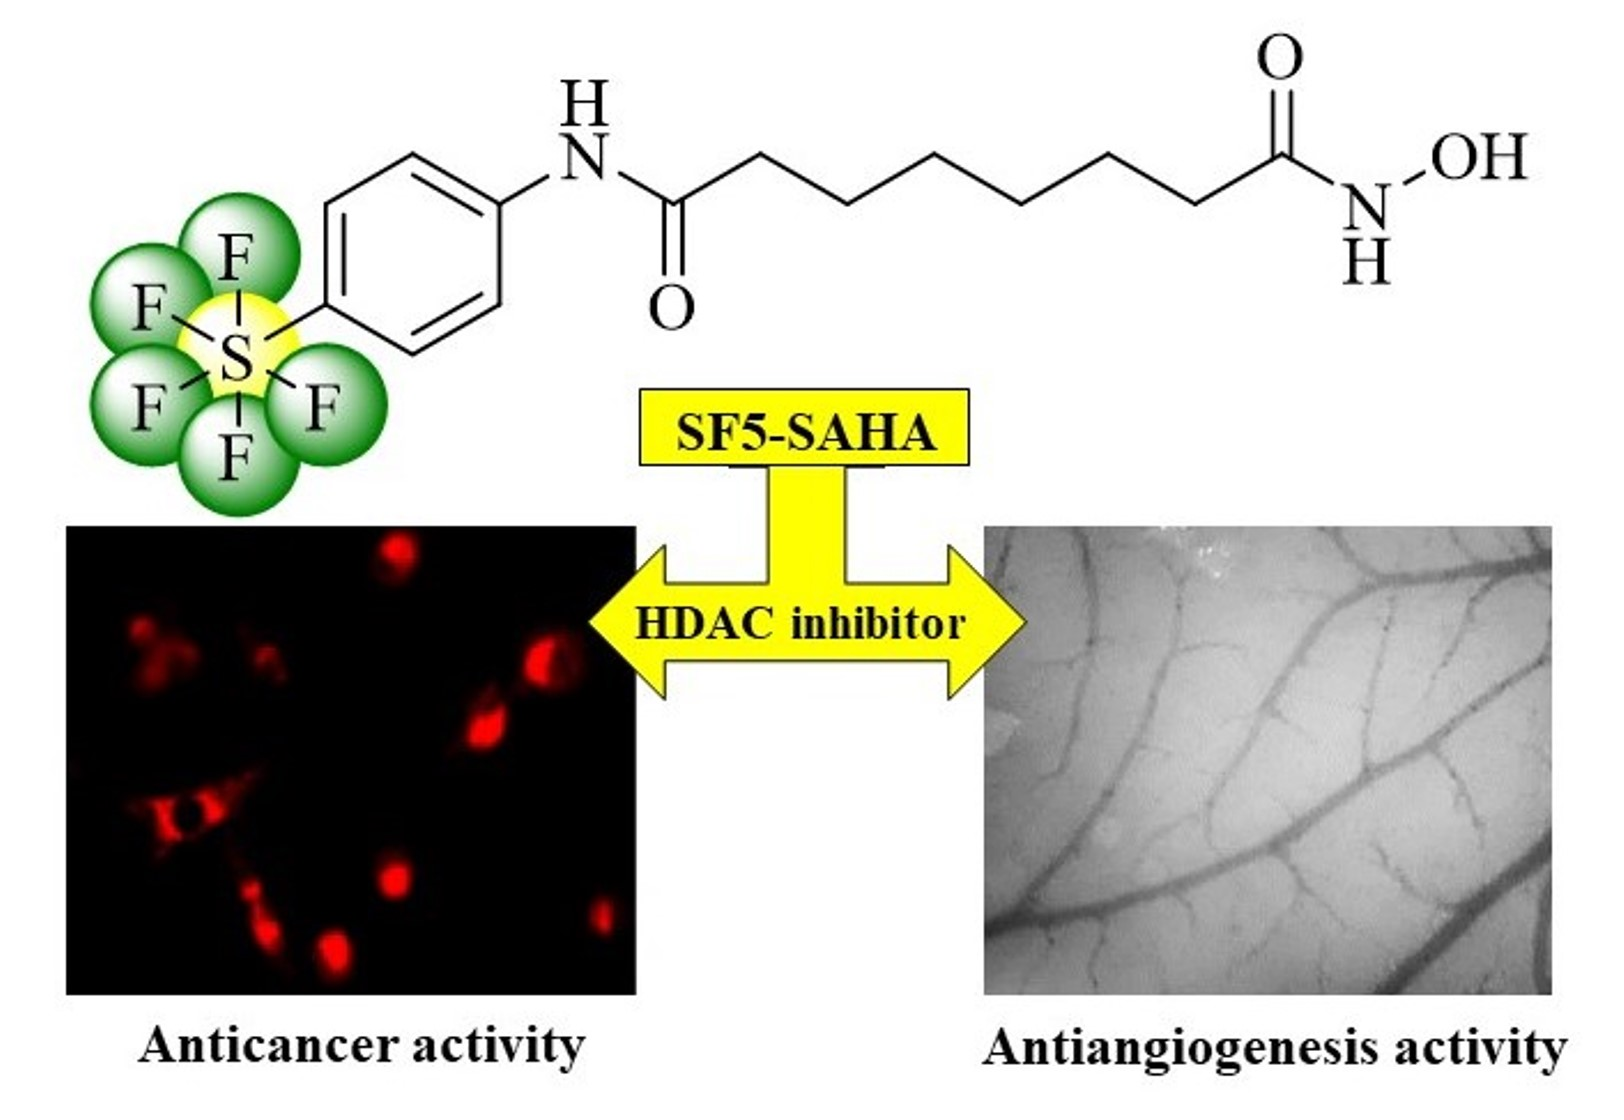
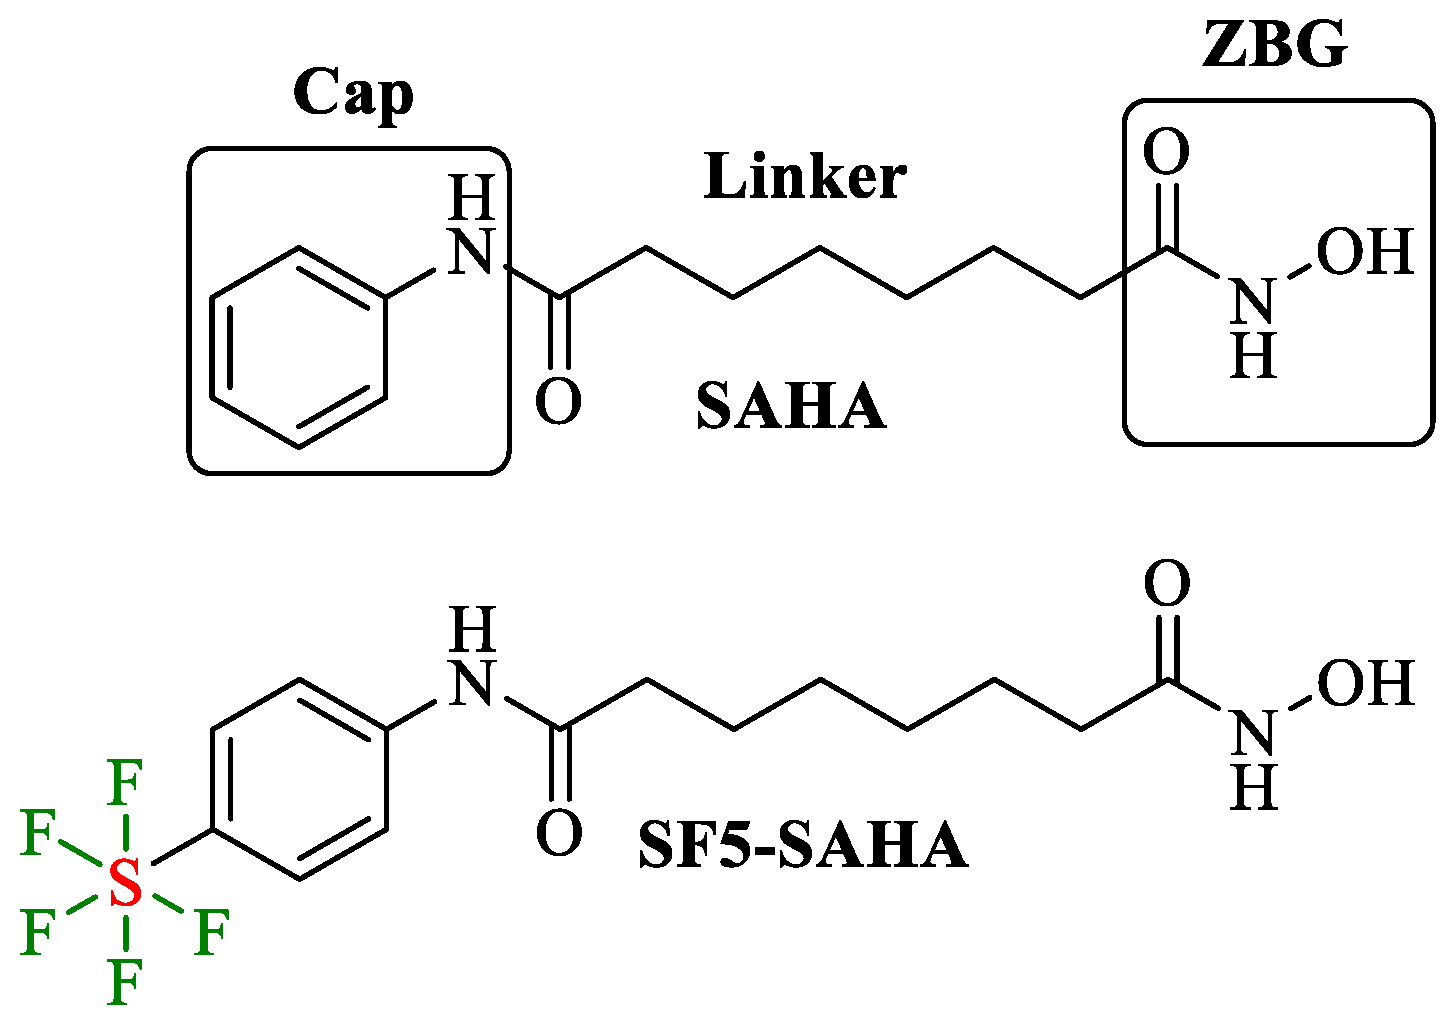
Improved Anticancer Activities of a New Pentafluorothio-Substituted Vorinostat-Type Histone Deacetylase Inhibitor

 , ,
, ,
Abstract
:
1. Introduction
2. Results
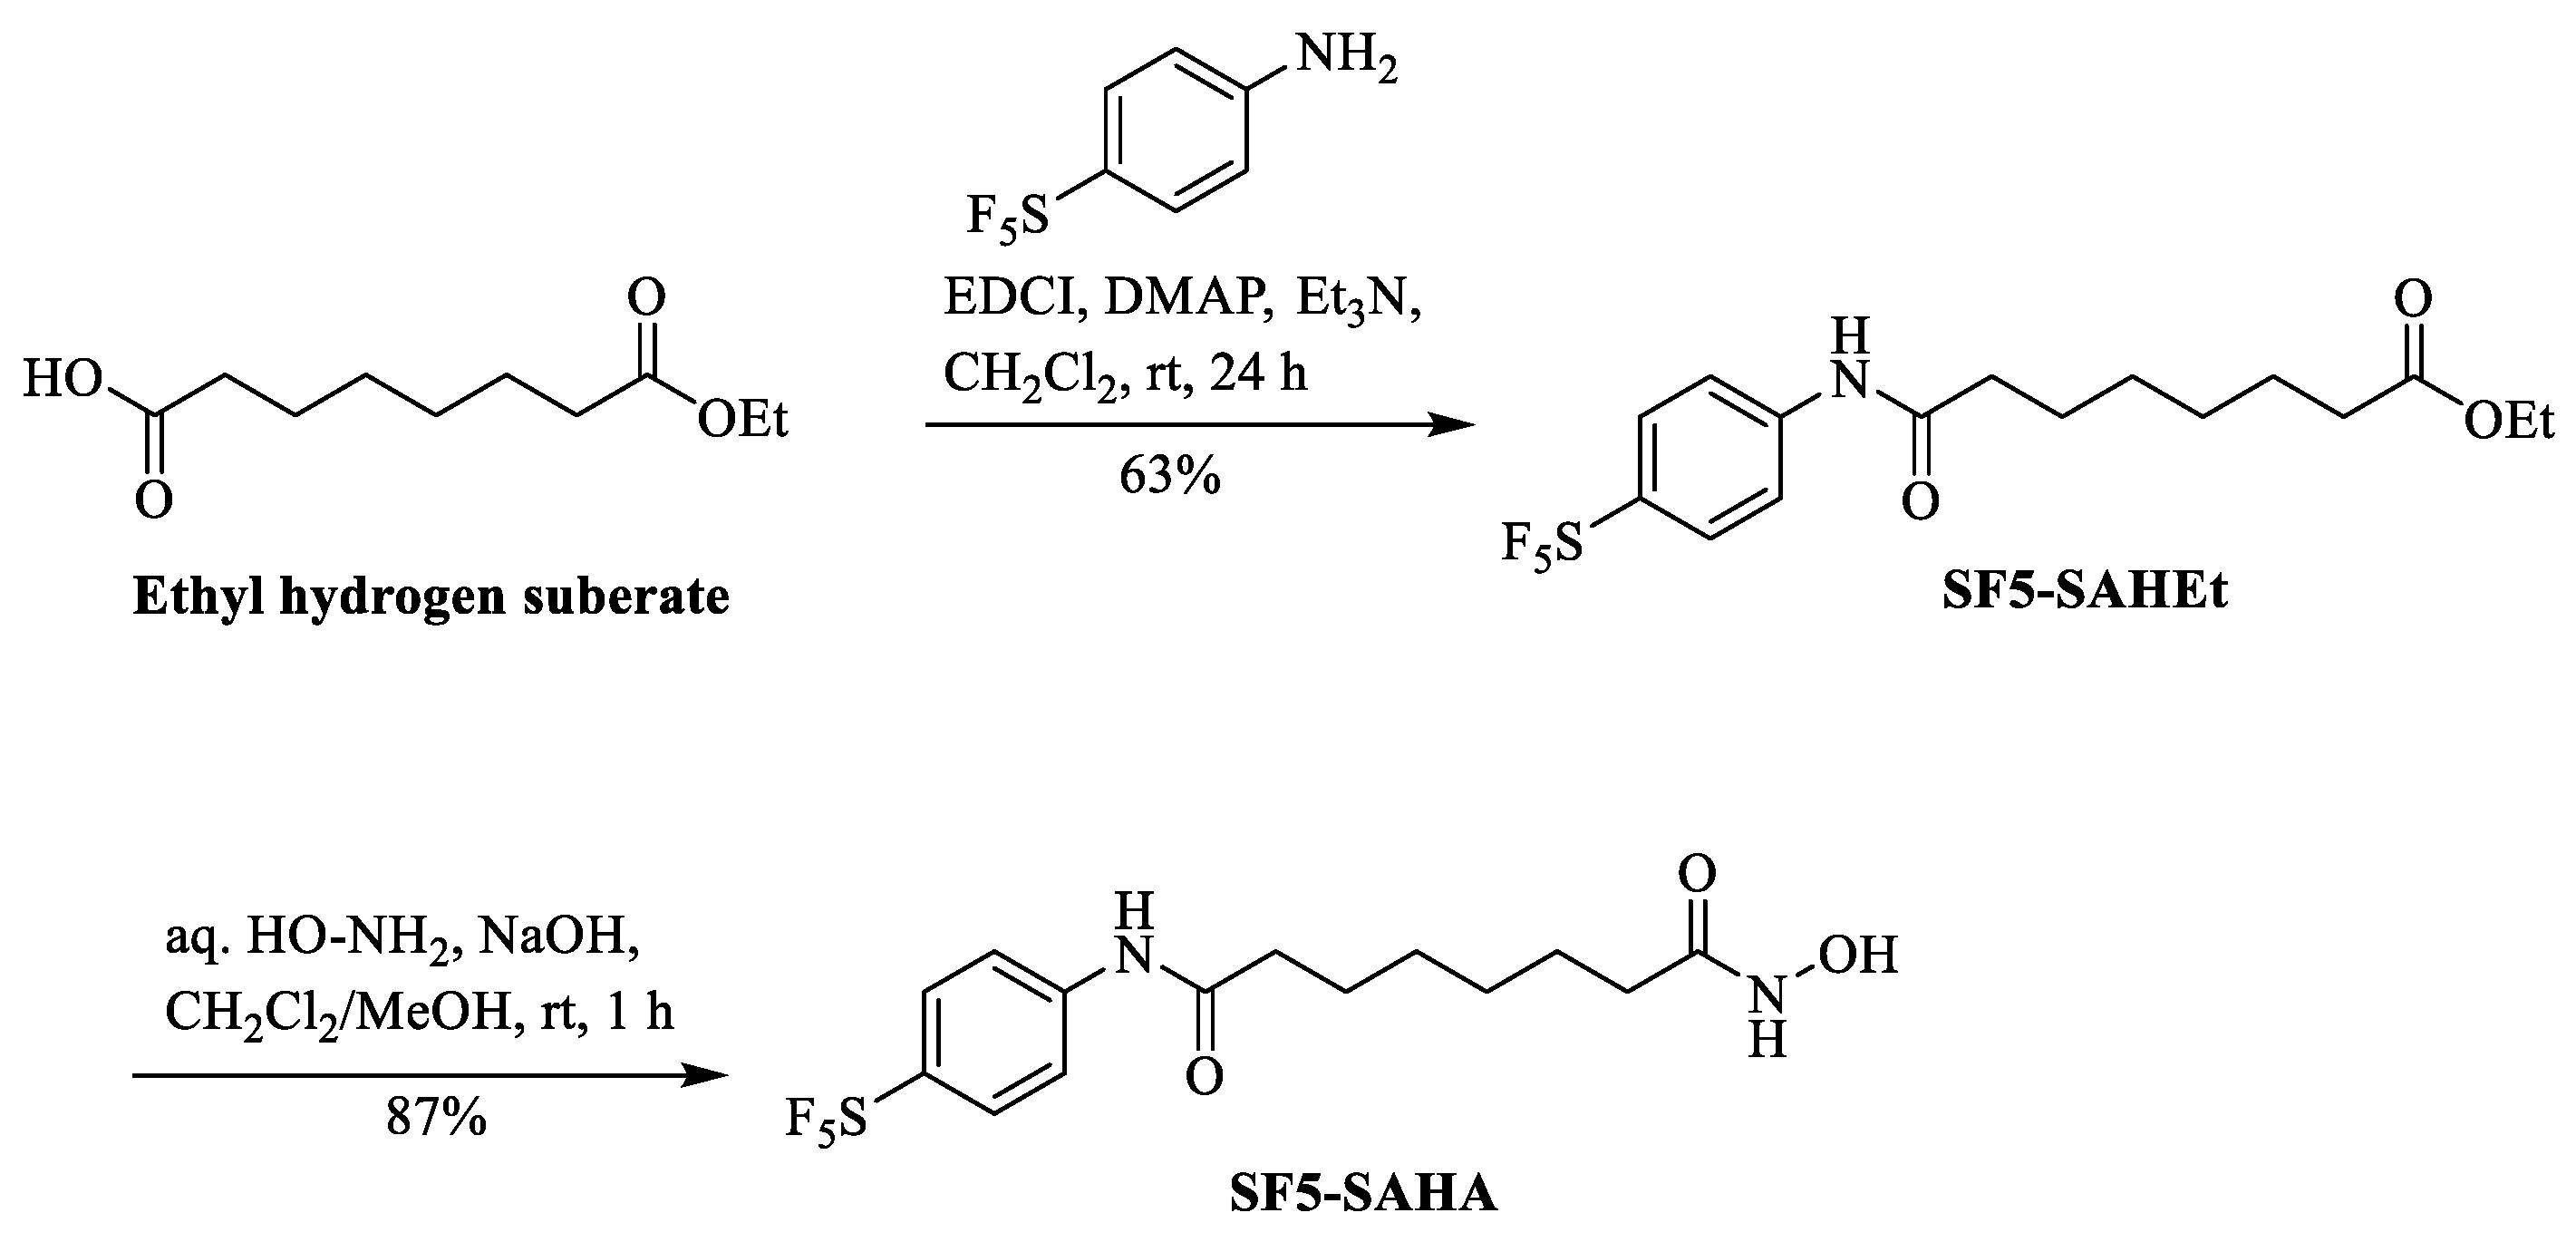
2.1. Chemistry
2.2. Biological Evaluation
2.2.1. Antiproliferative Activity
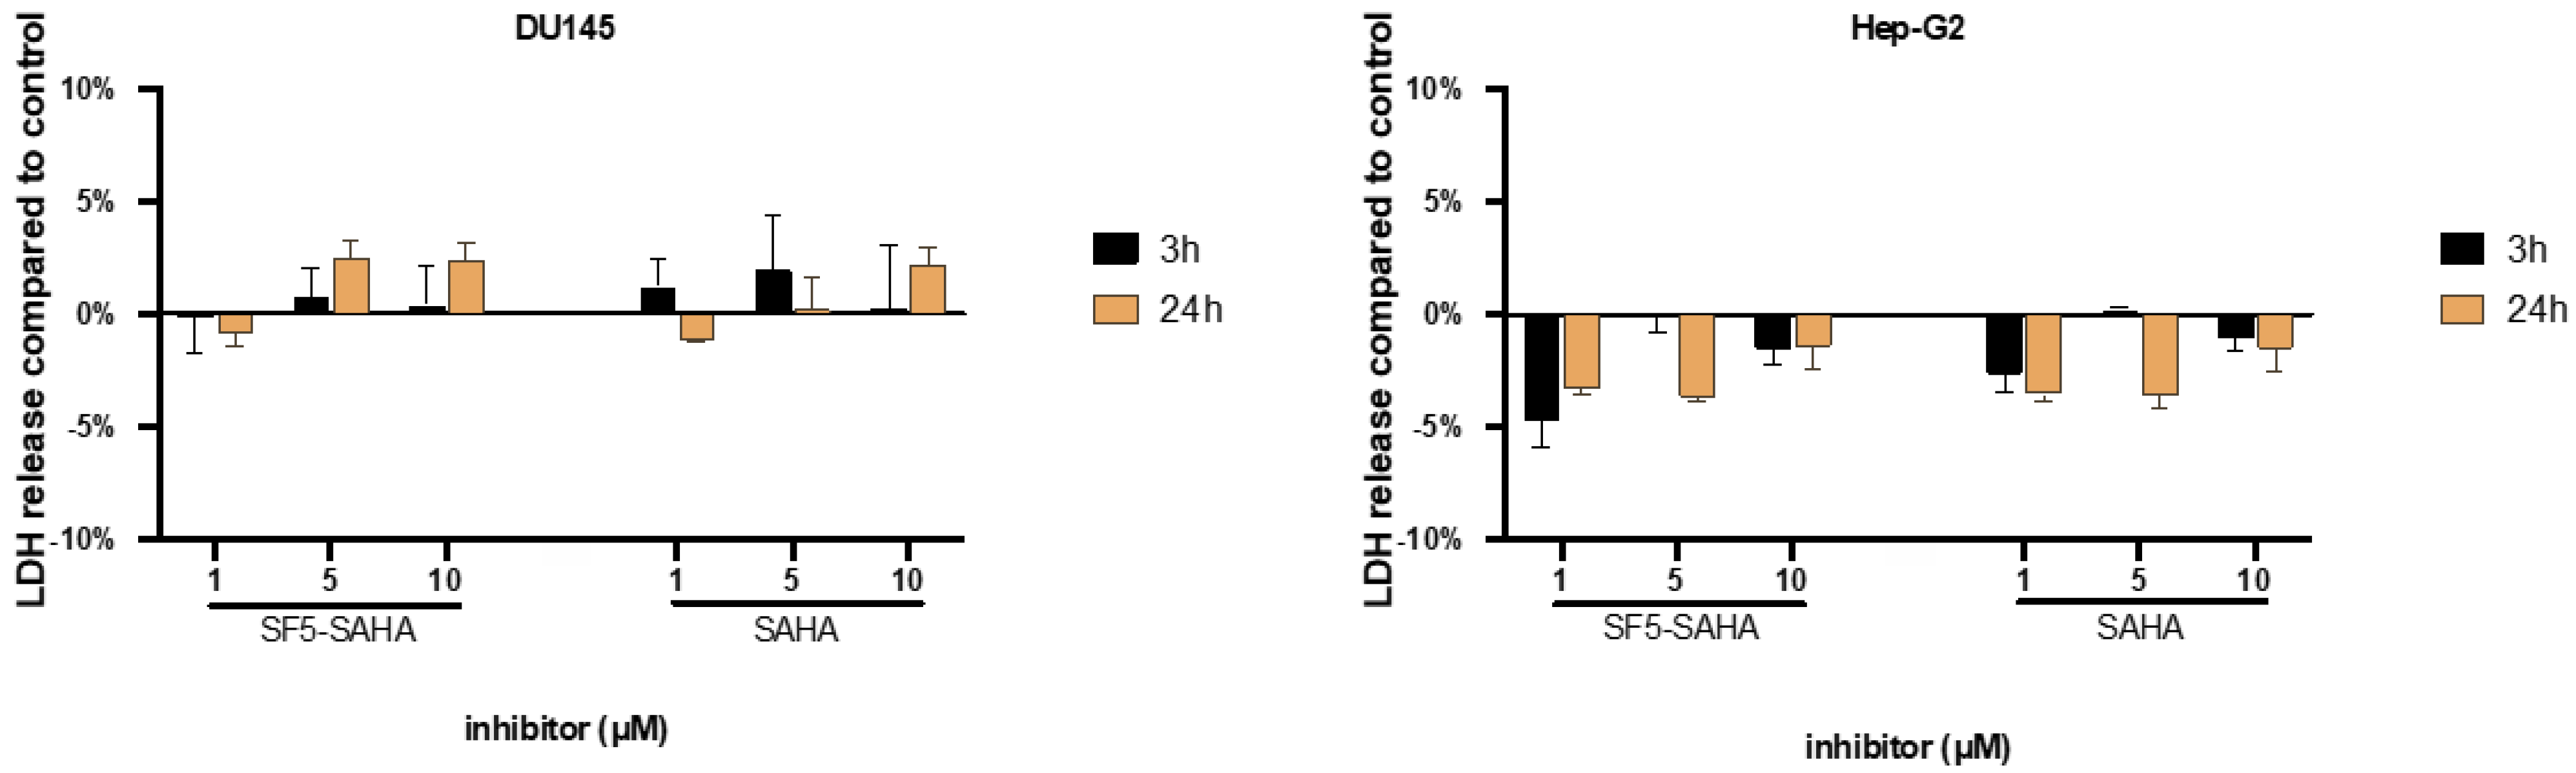
2.2.2. Unspecific Cytotoxicity of SF5-SAHA
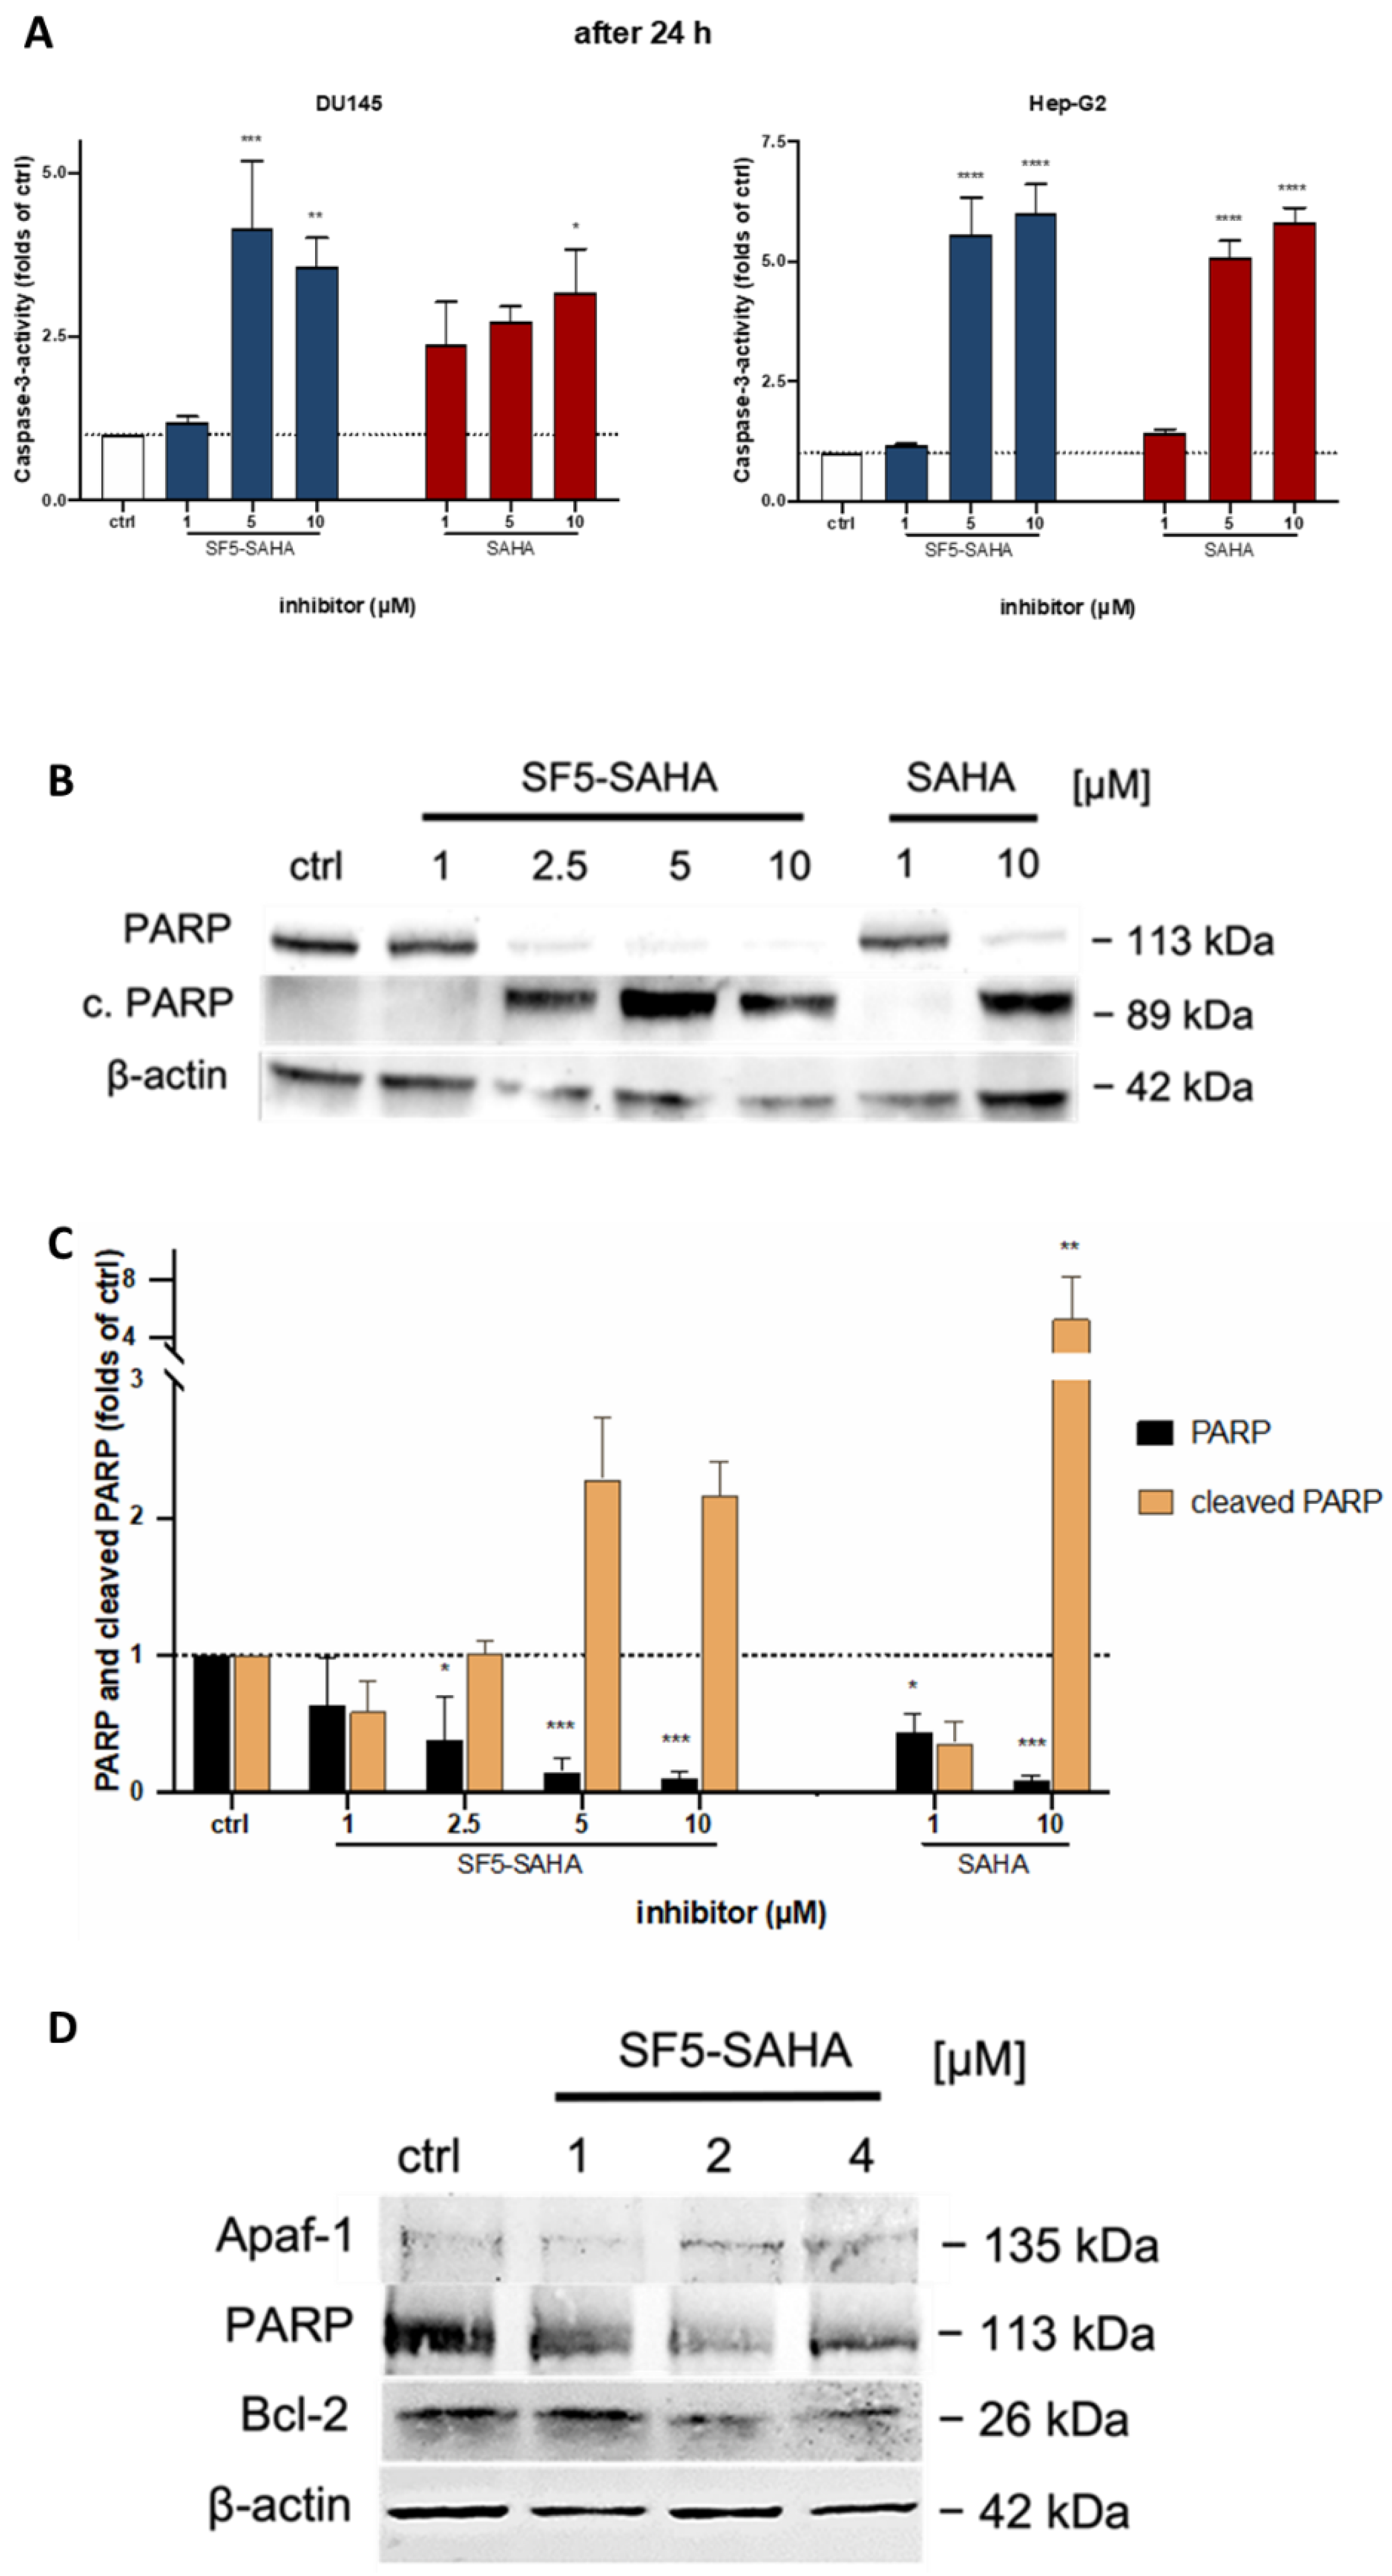
2.2.3. Apoptosis Induction by SF5-SAHA
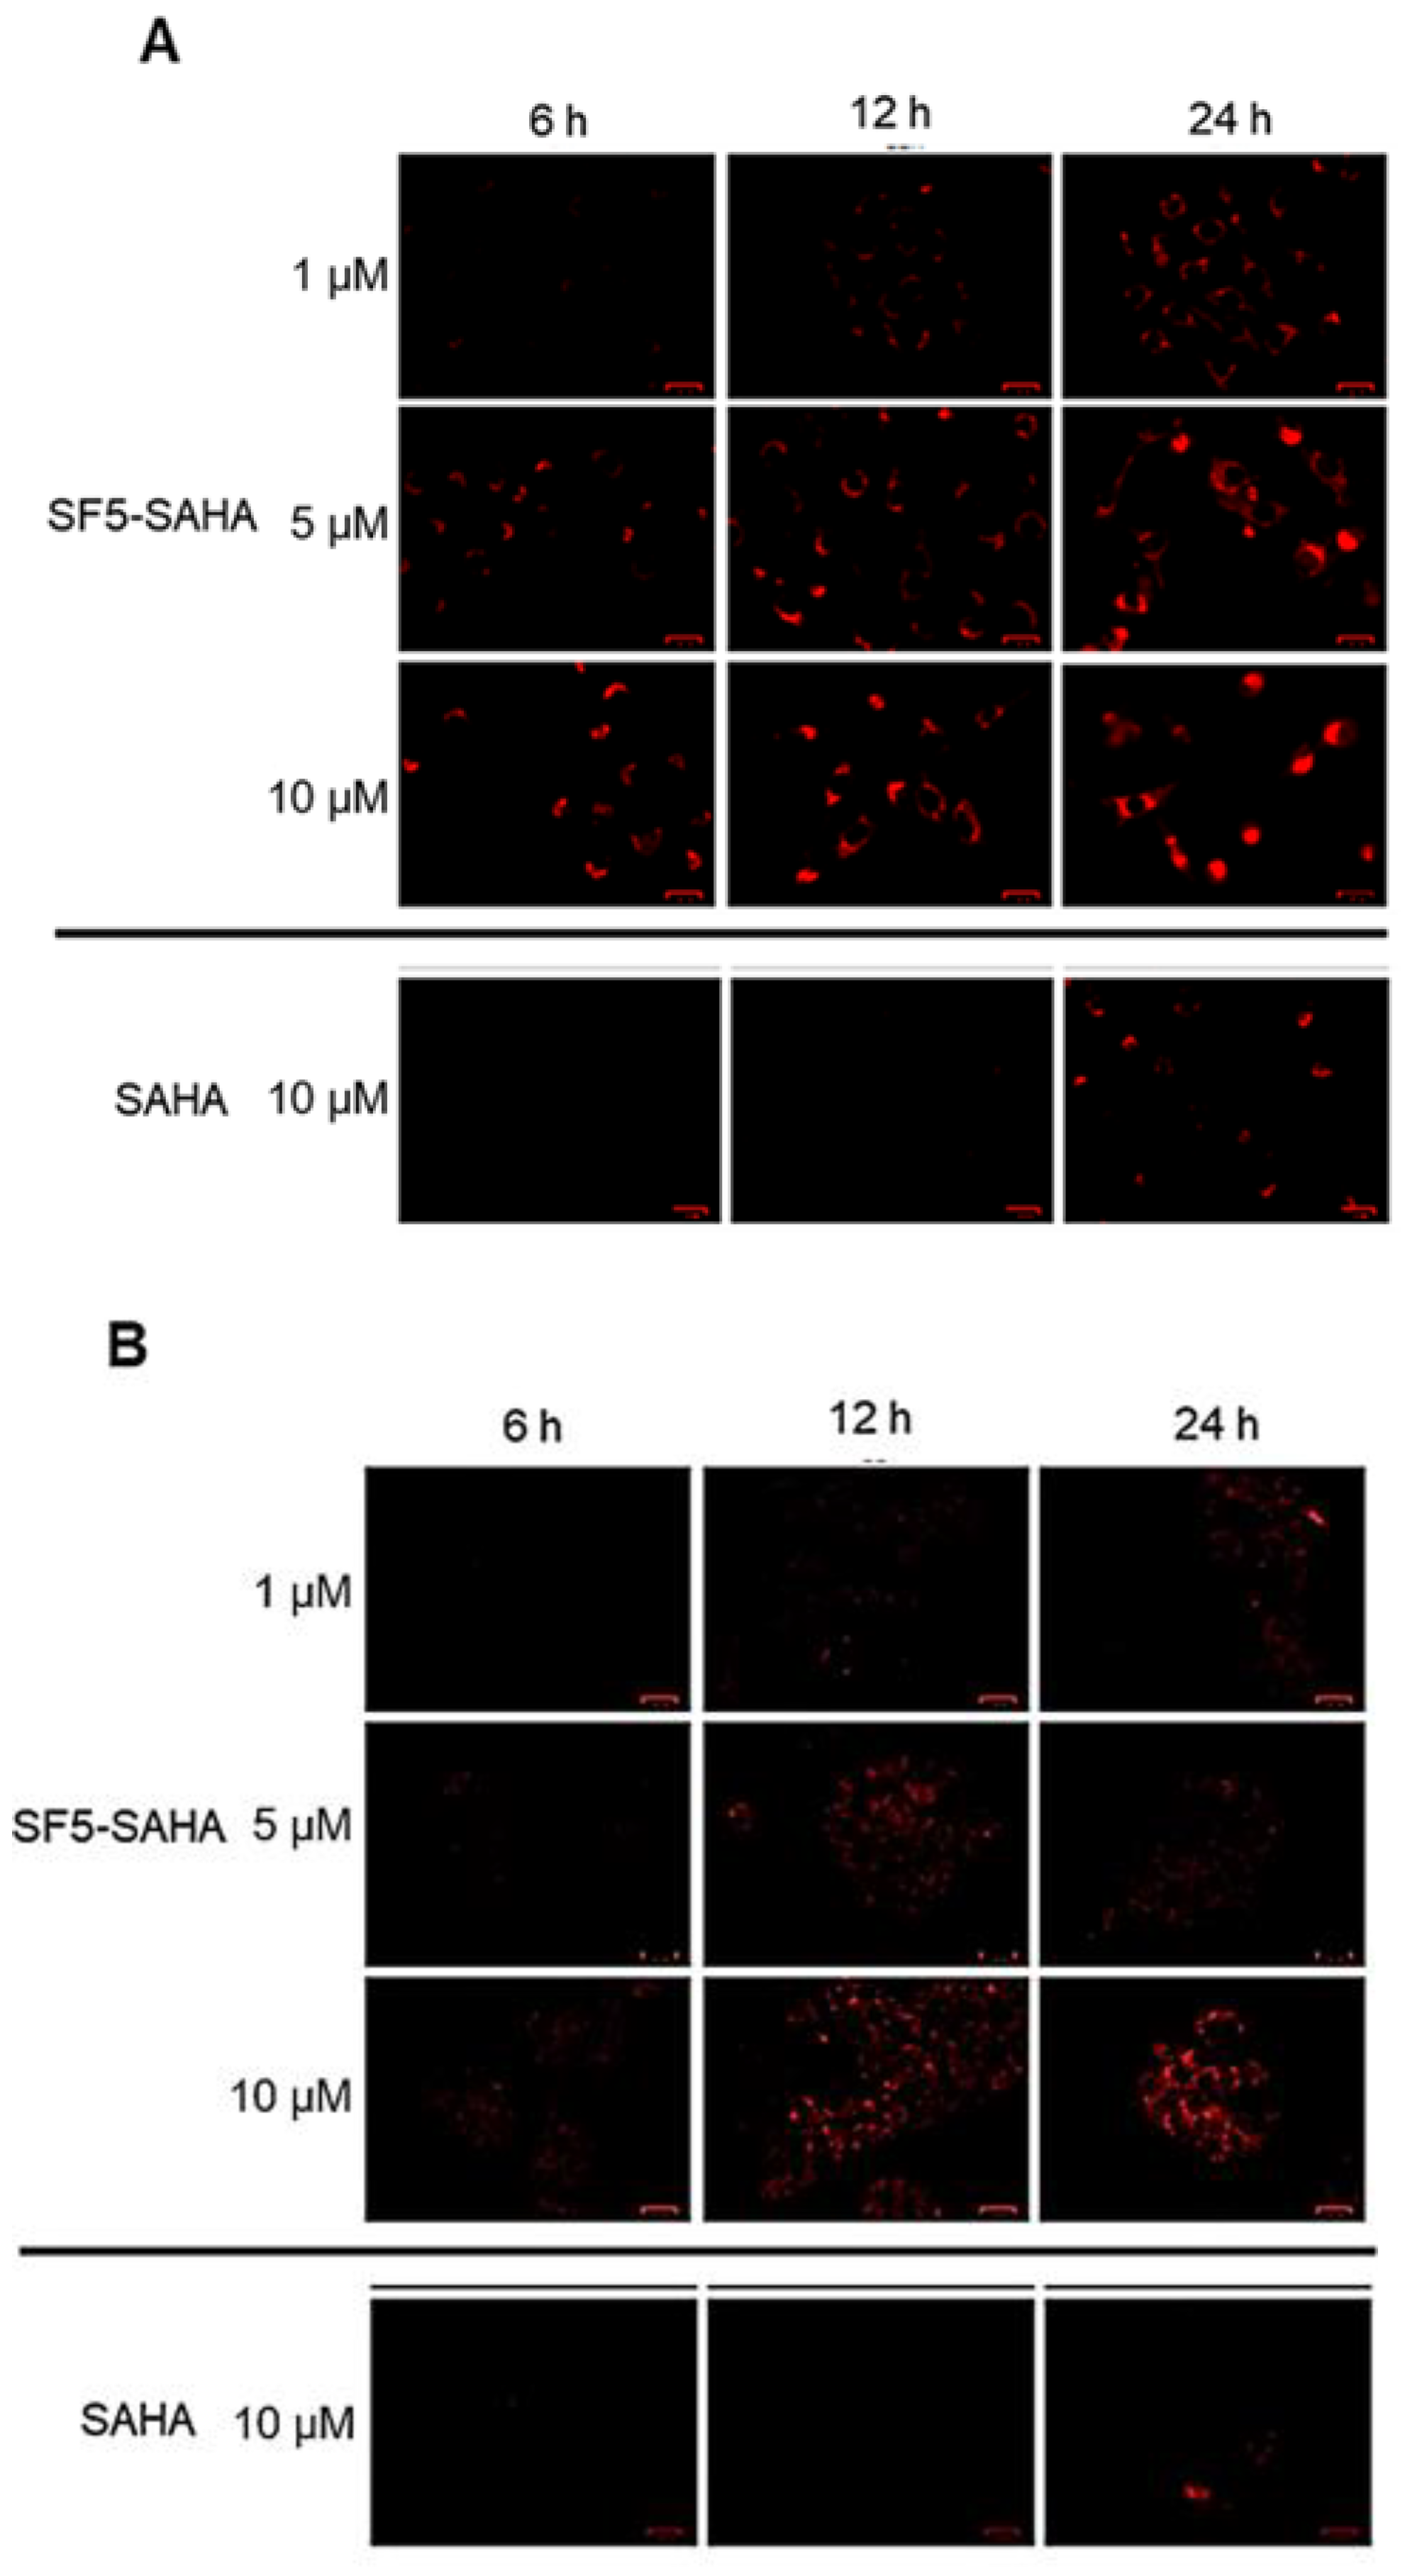
2.2.4. ROS Induction by SF5-SAHA
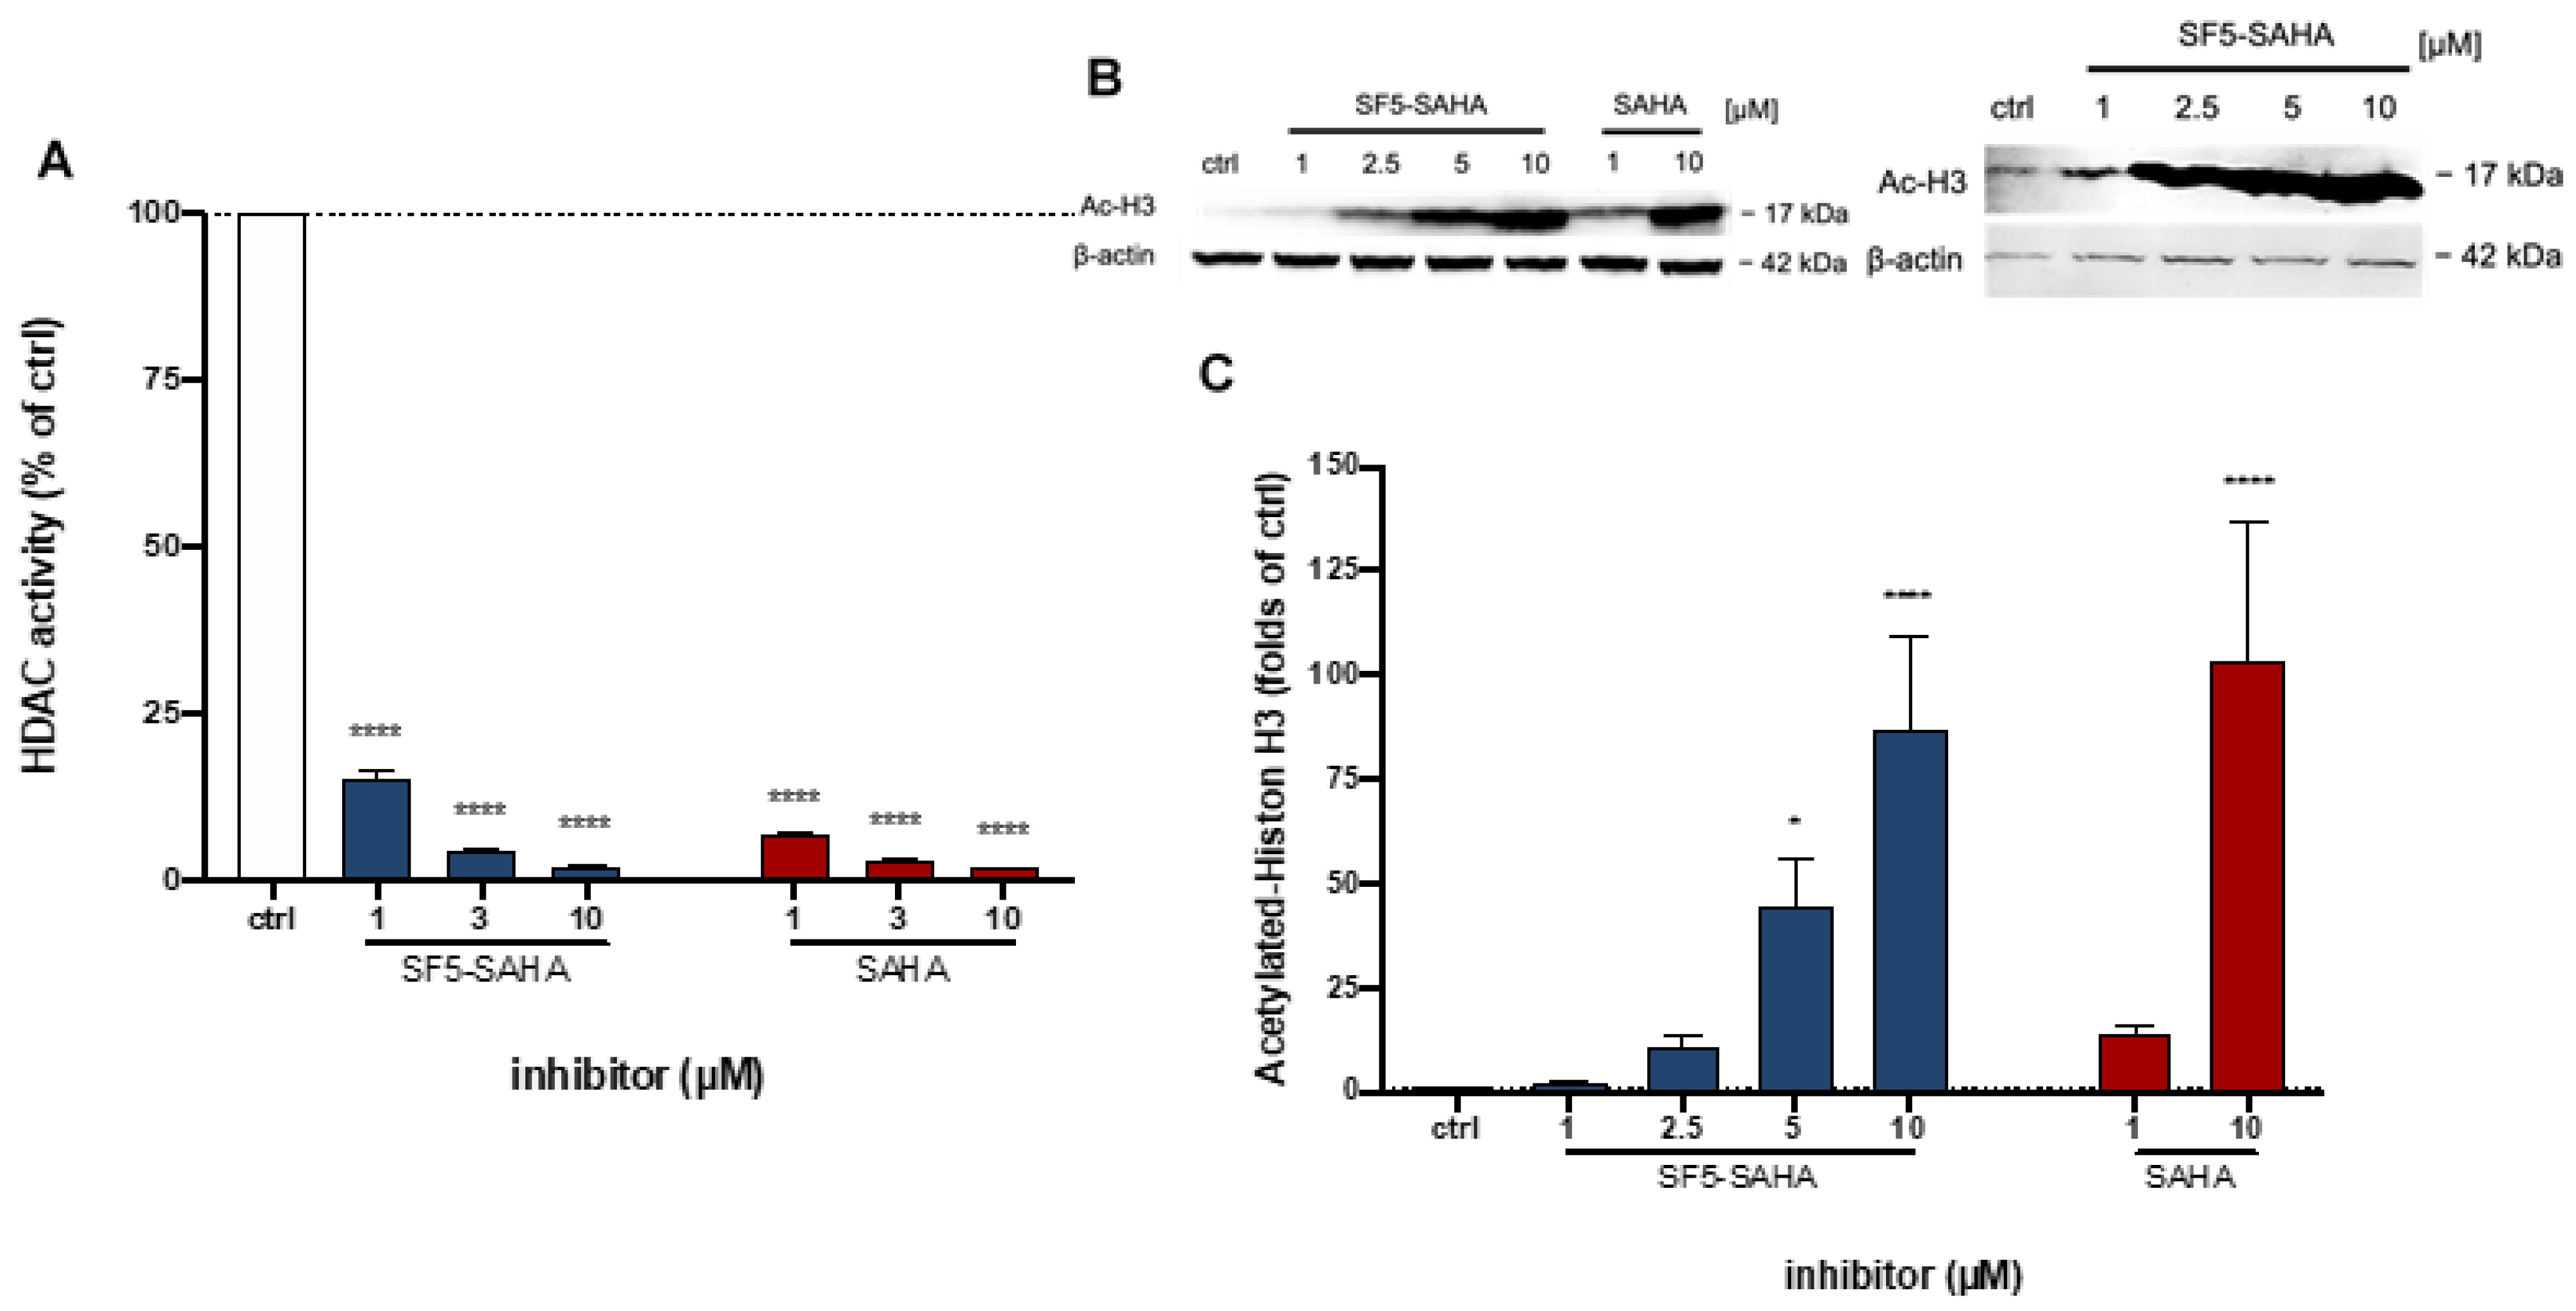
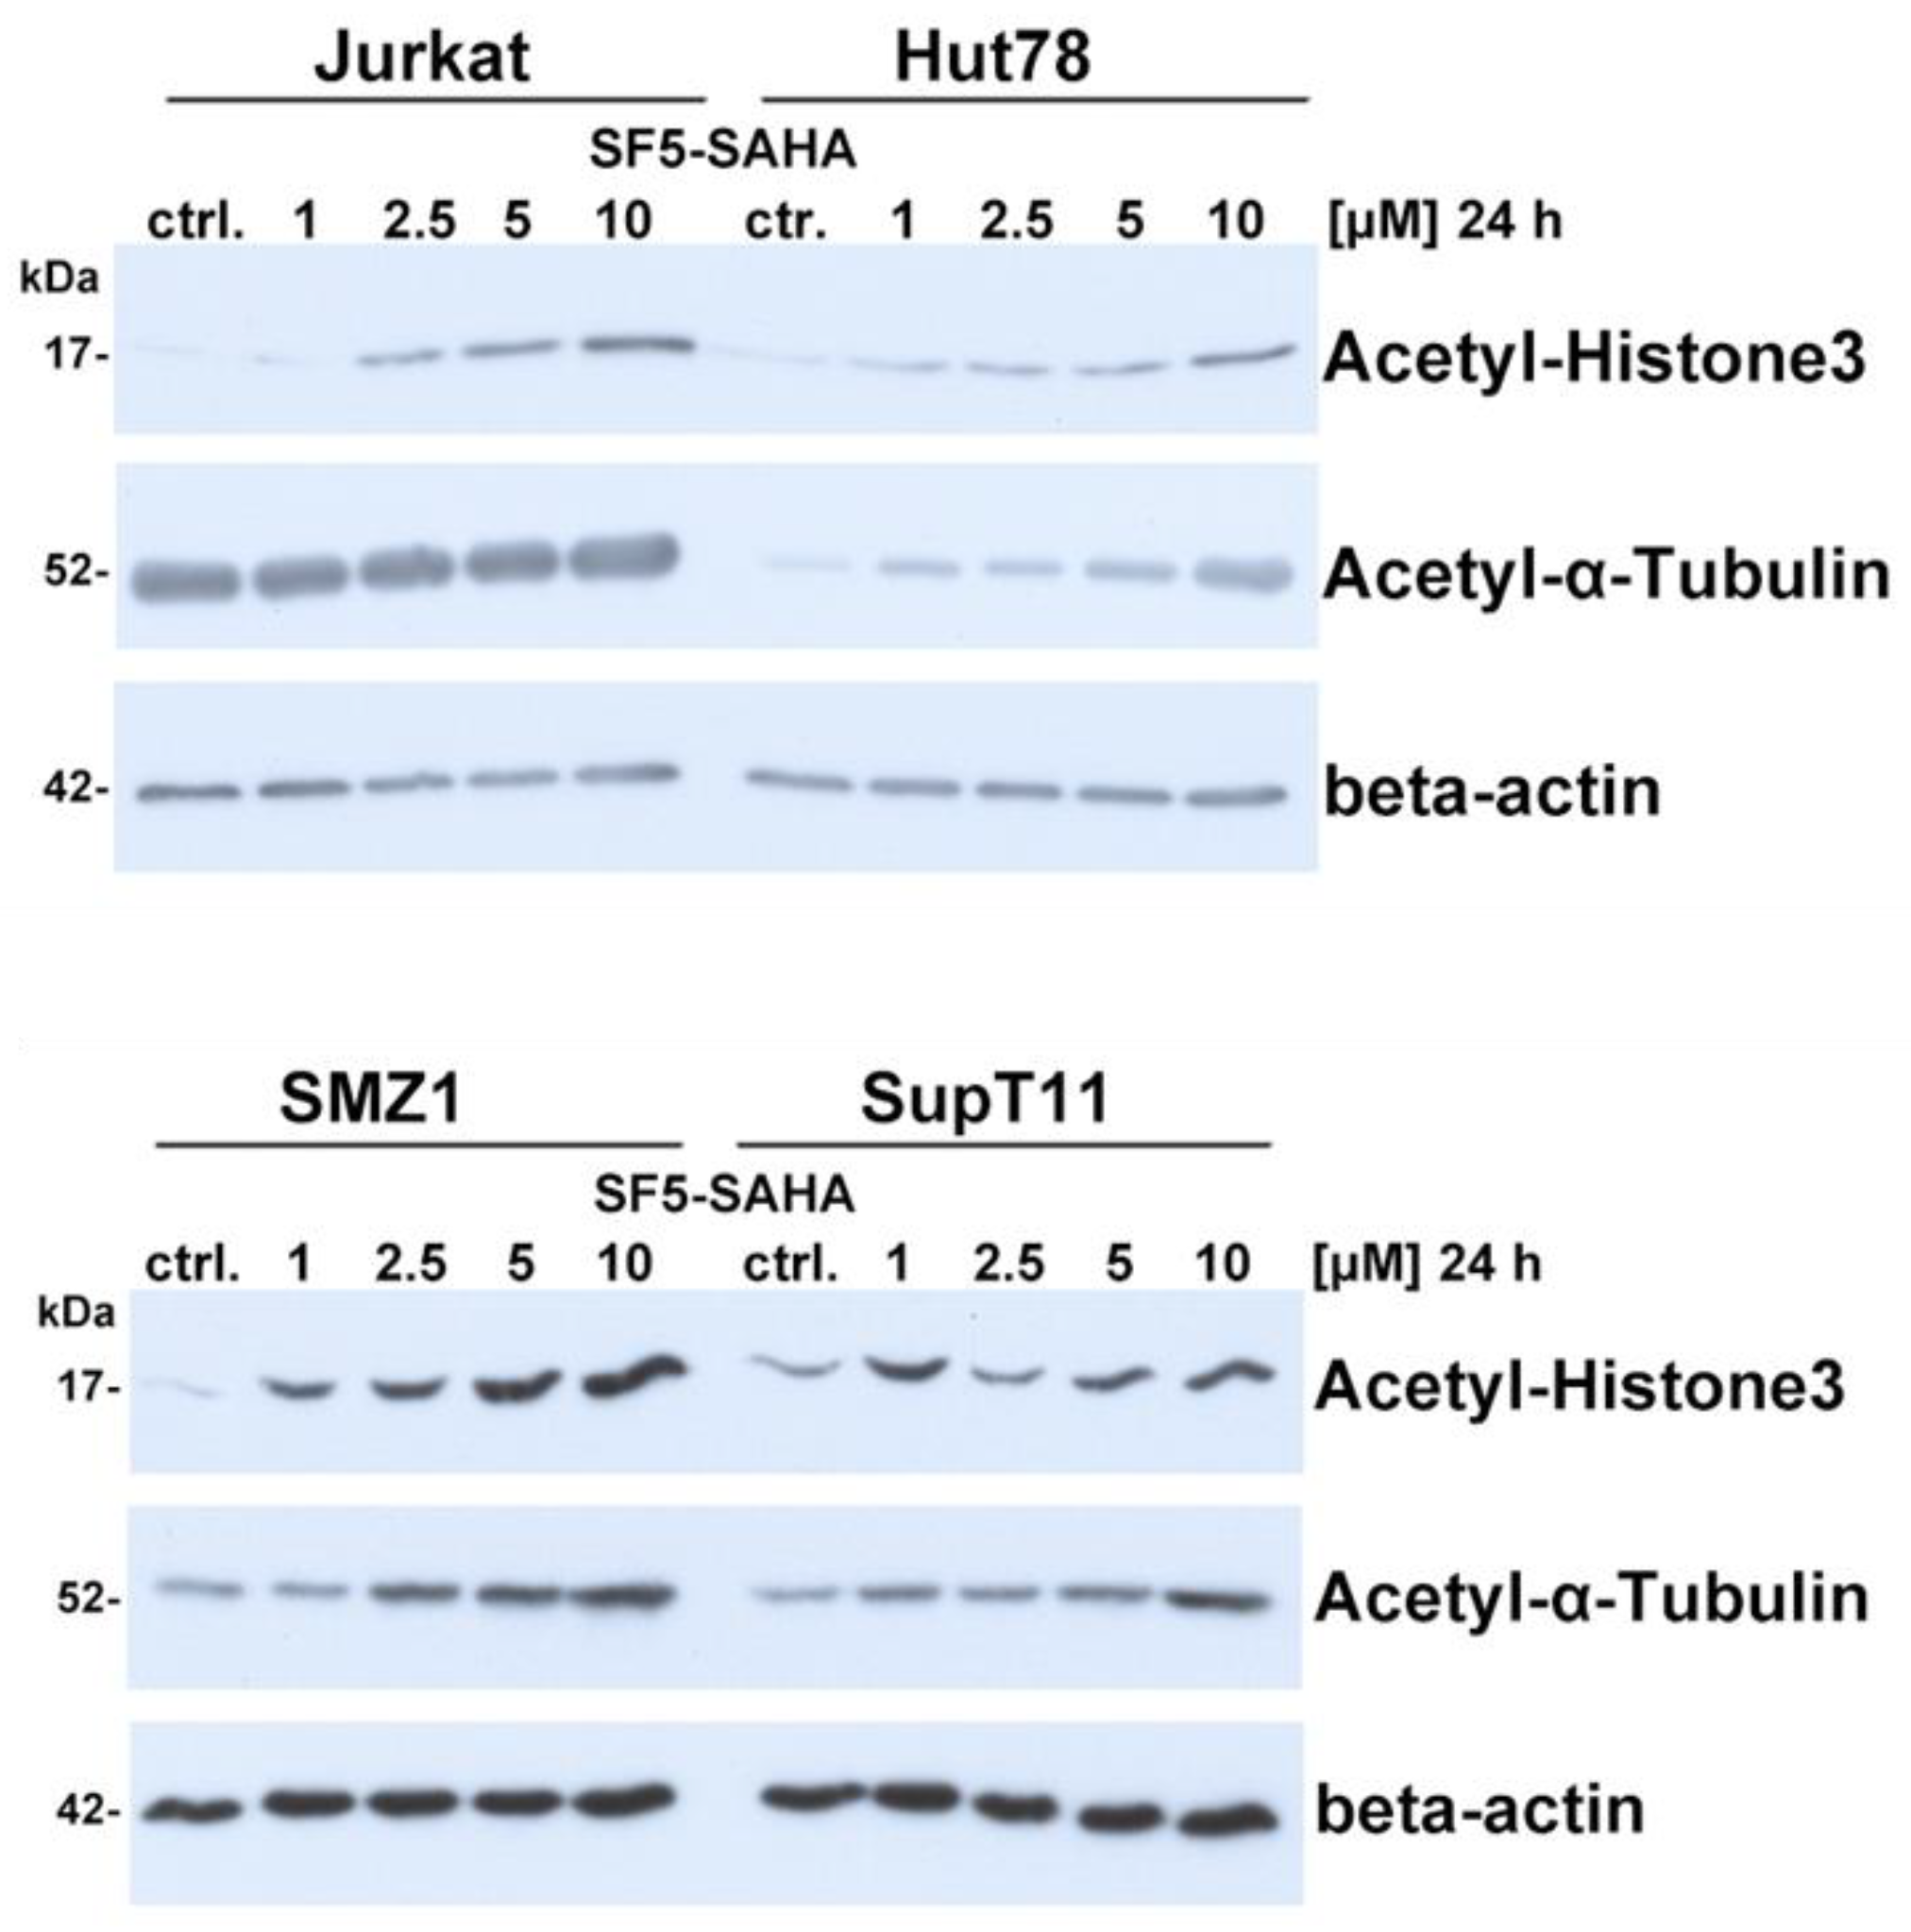
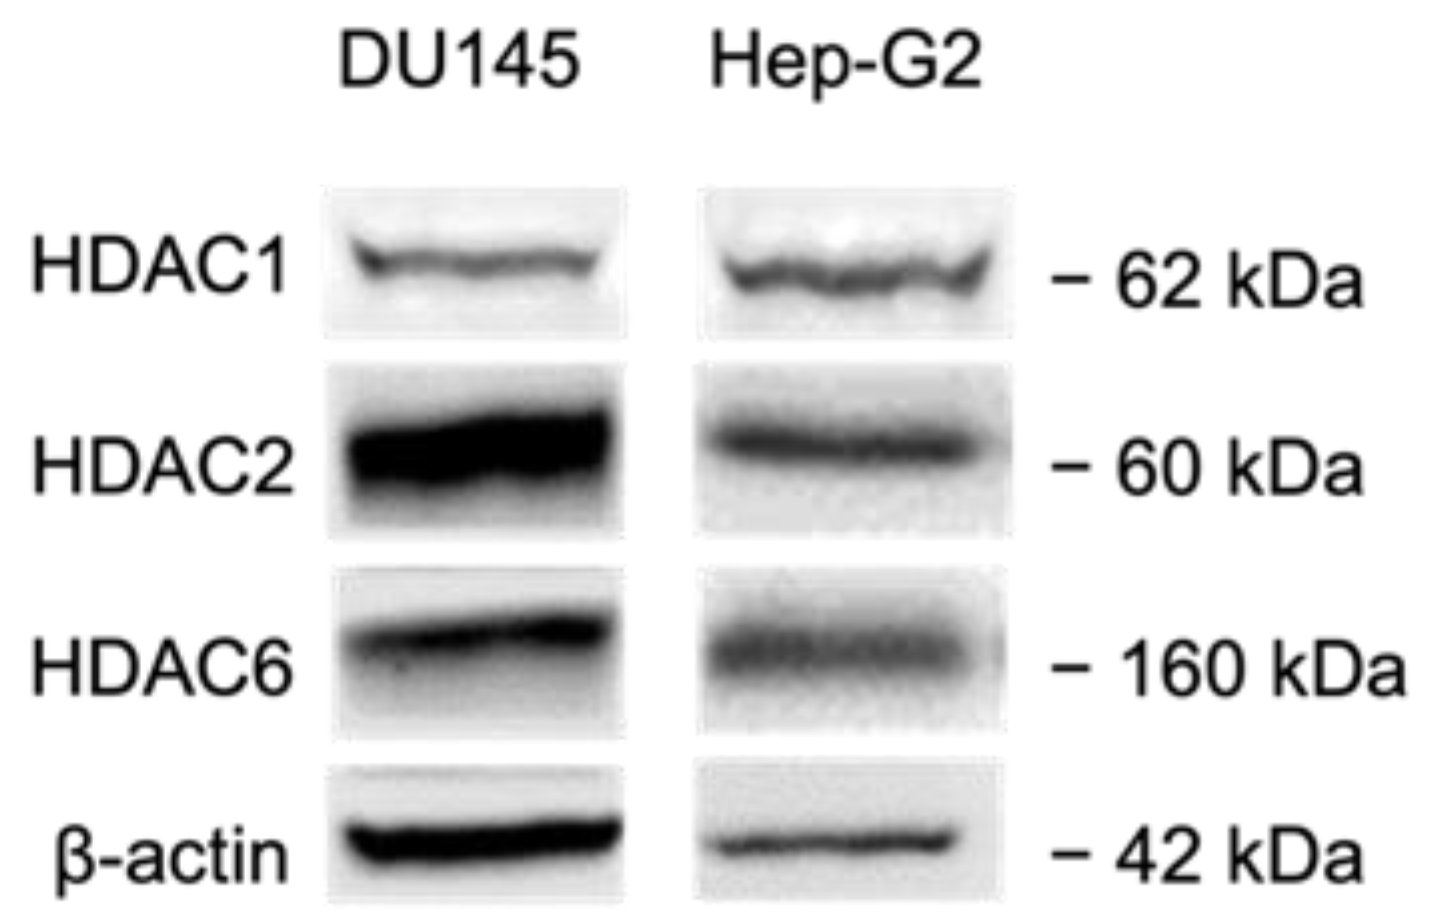
2.2.5. HDAC Inhibition by SF5-SAHA
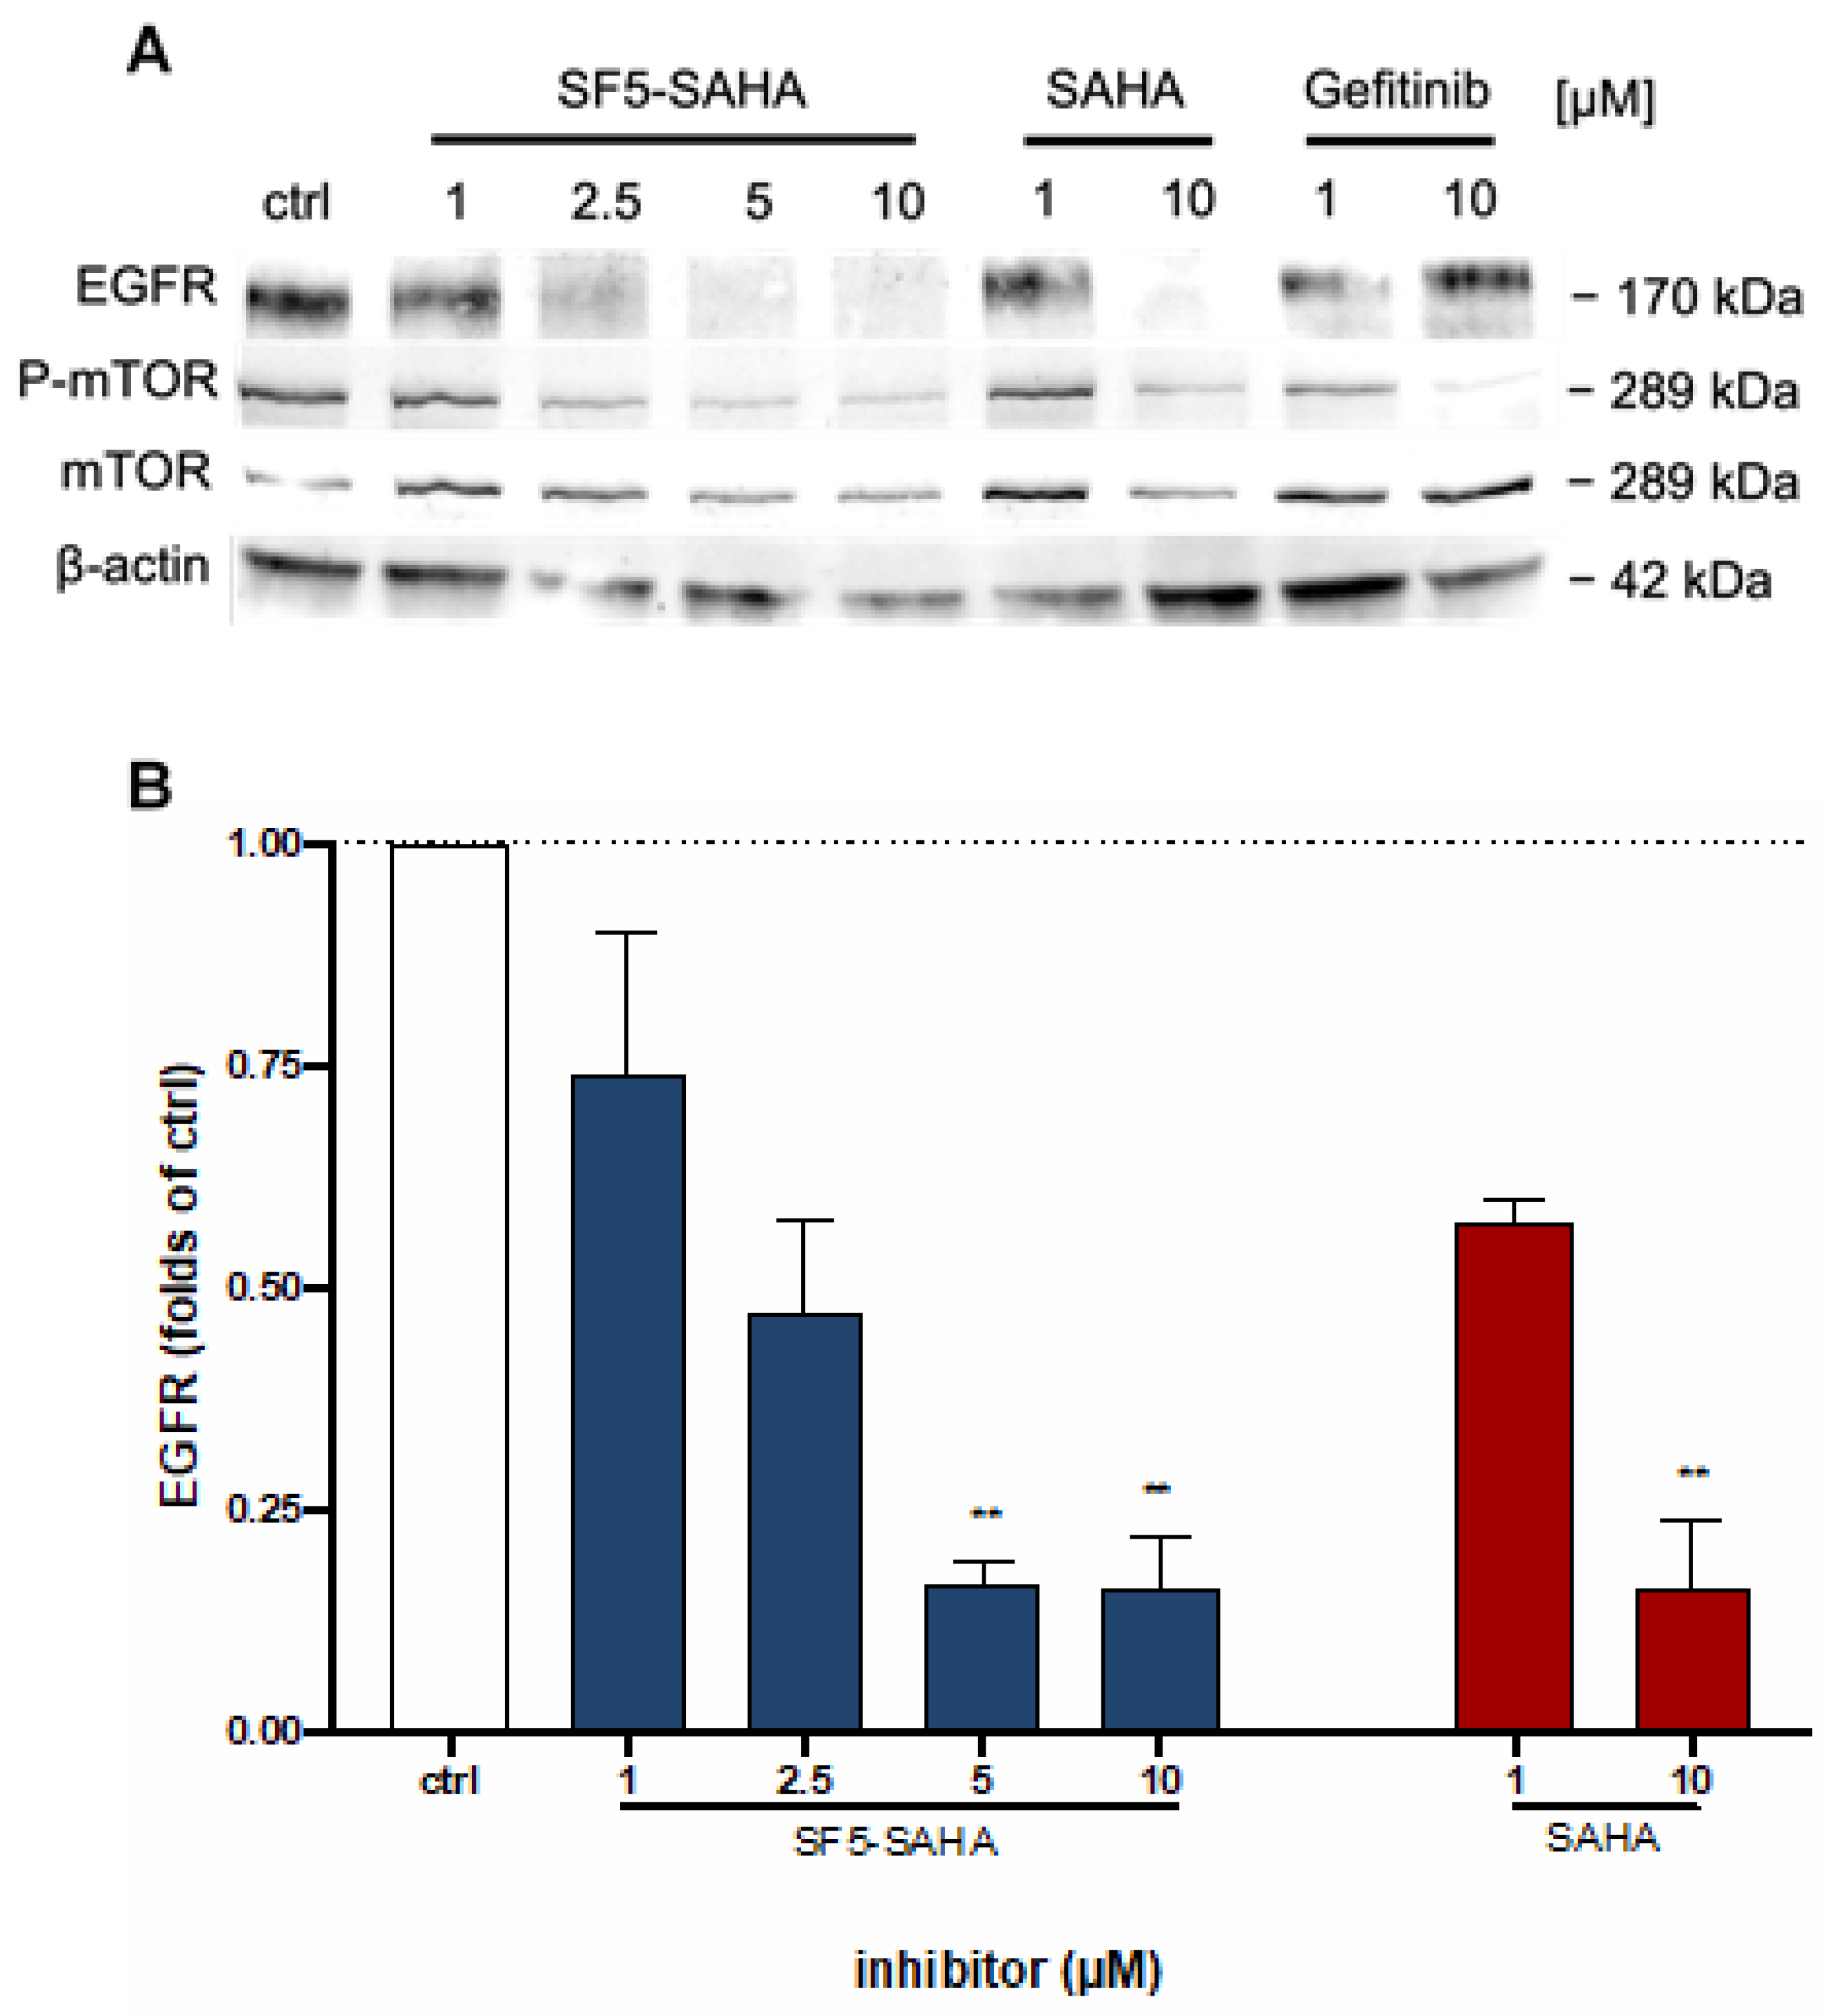
2.2.6. Effects on EGFR Signaling
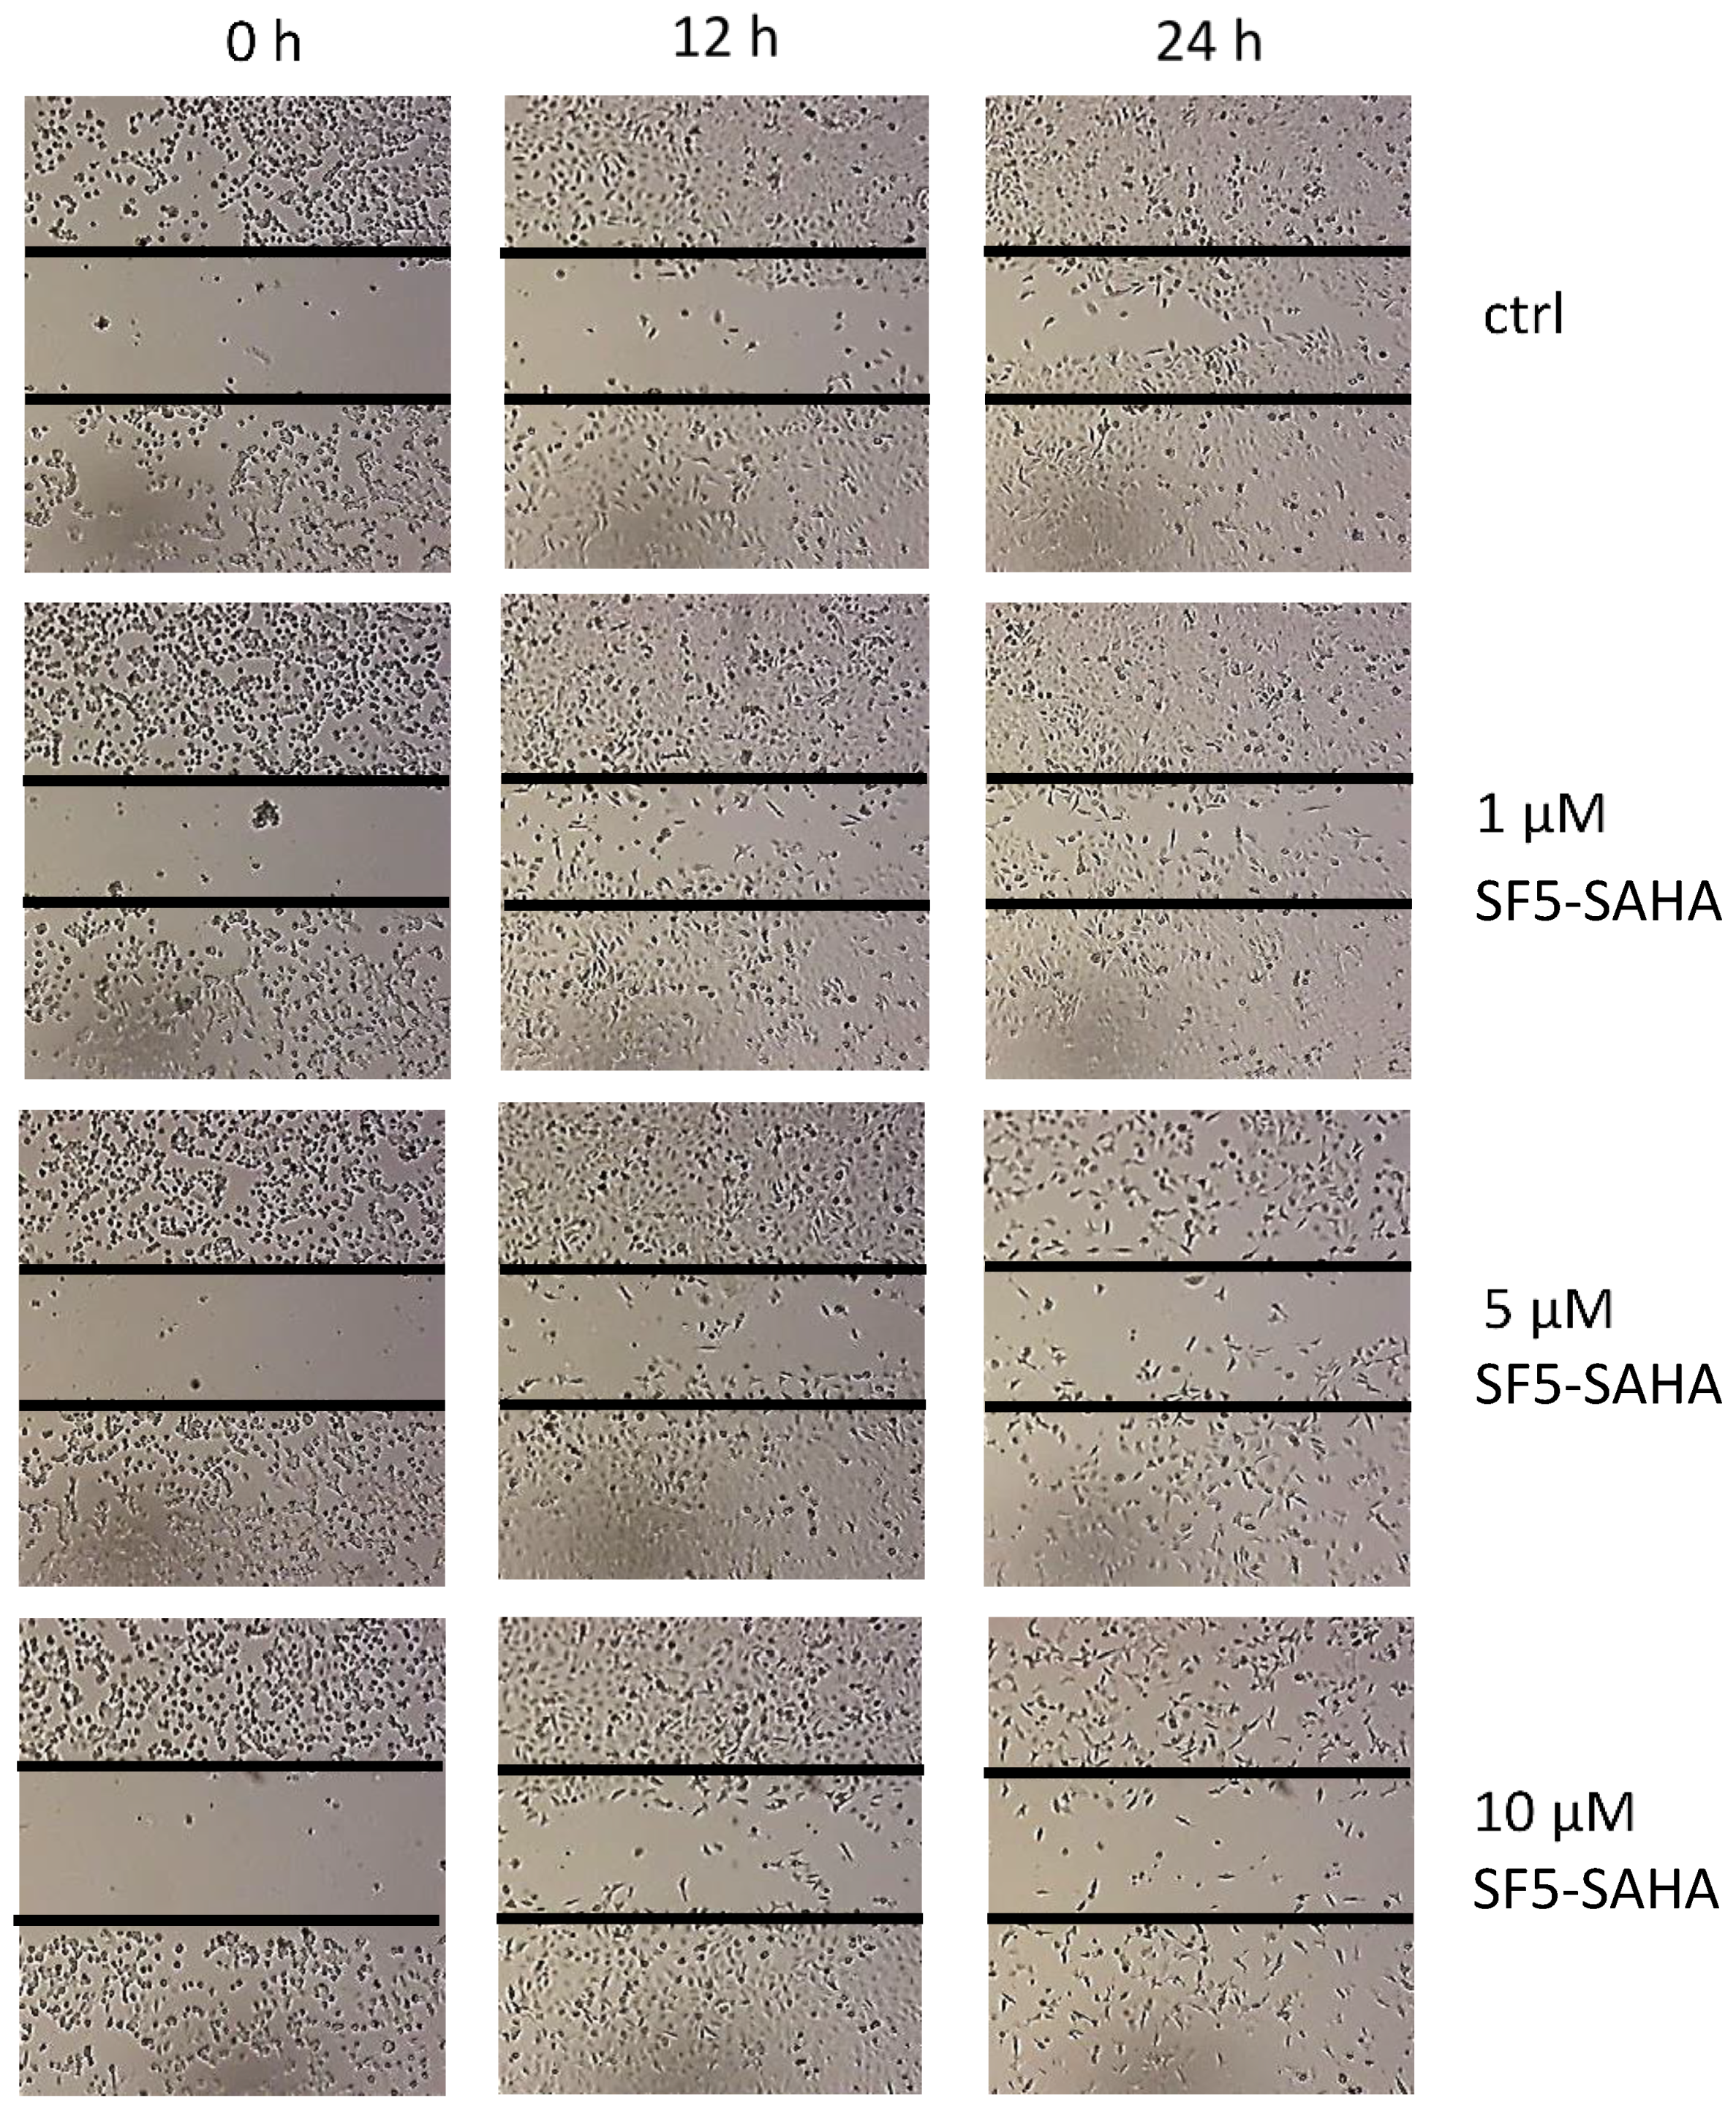
2.2.7. Antimigration Effects
2.2.8. Antiangiogenic Effects
3. Discussion
4. Materials and Methods
4.1. General Chemical Procedures and Materials
4.2. Synthesis of SF5-SAHEt
4.3. Synthesis of SF5-SAHA
4.4. Biological Evaluations
4.4.1. Cell Culture
4.4.2. Antiproliferative Activity Assay
4.4.3. Determination of Unspecific Cytotoxicity
4.4.4. Apoptosis-Specific Caspase-3 Activation
4.4.5. ROS Formation
4.4.6. HDAC Inhibition
4.4.7. Western Blots
4.4.8. Scratch Assay
4.4.9. In Vivo/Ovo Evaluation of Angiogenesis
4.4.10. Statistical Analysis
5. Conclusions
Author Contributions
Funding
Institutional Review Board Statement
Informed Consent Statement
Data Availability Statement
Conflicts of Interest
References
- Biersack, B.; Polat, S.; Höpfner, M. Anticancer properties of chimeric HDAC and kinase inhibitors. Semin. Cancer Biol. 2020. [Google Scholar] [CrossRef]
- Yang, H.; Salz, T.; Zajac-Kaye, M.; Liao, D.; Huang, S.; Qiu, Y. Overexpression of histone deacetylases in cancer cells is controlled by interplay of transcription factors and epigenetic modulators. FASEB J. 2014, 28, 4265–4279. [Google Scholar] [CrossRef] [PubMed] [Green Version]
- Mann, B.S.; Johnson, J.R.; Cohen, M.H.; Justice, R.; Pazdur, R. FDA approval summary: Vorinostat for treatment of advanced primary cutaneous T-cell lymphoma. Oncologist 2007, 12, 1247–1252. [Google Scholar] [CrossRef] [PubMed]
- Sippl, W.; Jung, M. Epigenetic Drug Discovery; Wiley-VCH Verlag GmbH & Co. KGaA: Weinheim, Germany, 2019. [Google Scholar]
- Guerra, F.S.; Rodrigues, D.A.; Fraga, C.A.M.; Fernandes, P.D. Novel single inhibitor of HDAC6/8 and dual inhibitor of PI3K/HDAC6 as potential alternative treatments for prostate cancer. Pharmaceuticals 2021, 14, 387. [Google Scholar] [CrossRef] [PubMed]
- Rana, Z.; Tyndall, J.D.A.; Hanif, M.; Hartinger, C.G.; Rosengren, R.J. Cytostatic action of novel histone deacetylase inhibitors in androgen receptor-null prostate cancer cells. Pharmaceuticals 2021, 14, 103. [Google Scholar] [CrossRef] [PubMed]
- Qi, Z.; Wang, C.; Jiang, J.; Wu, C. Novel C15 triene triazole, D-A derivatives anti-HepG2, and as HDAC2 inhibitors: A synergy study. Int. J. Mol. Sci. 2018, 19, 3184. [Google Scholar] [CrossRef] [PubMed] [Green Version]
- Saha, S.K.; Yin, Y.; Kim, K.; Yang, G.-M.; Dayem, A.A.; Choi, H.Y.; Cho, S.-G. Valproic acid induces endocytosis-mediated doxorubicin internalization and shows synergistic cytotoxic effects in hepatocellular carcinoma cells. Int. J. Mol. Sci. 2017, 18, 1048. [Google Scholar] [CrossRef] [Green Version]
- Gillis, E.P.; Eastman, K.J.; Hill, M.D.; Donnelly, D.J.; Meanwell, N.A. Applications of fluorine in medicinal chemistry. J. Med. Chem. 2015, 58, 8315–8359. [Google Scholar] [CrossRef]
- Baecker, D.; Obermoser, V.; Kirchner, E.A.; Hupfauf, A.; Kircher, B.; Gust, R. Fluorination as tool to improve bioanalytical sensitivity and COX-2-selective antitumor activity of cobalt alkyne complexes. Dalton Trans. 2019, 48, 15856–15868. [Google Scholar] [CrossRef] [PubMed]
- Altomonte, S.; Zanda, M. Synthetic chemistry and biological activity of pentafluorosulphanyl (SF5) organic molecules. J. Fluor. Chem. 2012, 143, 57–93. [Google Scholar] [CrossRef] [Green Version]
- Mo, T.; Mi, X.; Milner, E.E.; Dow, G.S.; Wipf, P. Synthesis of an 8-pentafluorosulfanyl analog of the antimalarial agent mefloquine. Tetrahedron Lett. 2010, 51, 5137–5140. [Google Scholar] [CrossRef]
- Schmitt, F.; Gold, M.; Begemann, G.; Andronache, I.; Biersack, B.; Schobert, R. Fluoro and pentafluorothio analogs of the antitumoral curcuminoid EF24 with superior antiangiogenic and vascular-disruptive effects. Bioorg. Med. Chem. 2017, 25, 4894–4903. [Google Scholar] [CrossRef]
- Linder, B.; Köhler, L.H.F.; Reisbeck, L.; Menger, D.; Subramaniam, D.; Herold-Mende, C.; Anant, S.; Schobert, R.; Biersack, B.; Kögel, D.A. A new pentafluorothio-substituted curcuminoid with superior antitumor activity. Biomolecules 2021, 11, 947. [Google Scholar] [CrossRef]
- Salmi-Smail, C.; Fabre, A.; Dequiedt, F.; Restouin, A.; Castellano, R.; Garbit, S.; Roche, P.; Morelli, X.; Brunel, J.M.; Collette, Y. Modified cap group suberoylanilide hydroxamic acid histone deacetylase inhibitor derivatives reveal improved selective antileukemic activity. J. Med. Chem. 2010, 53, 3038–3047. [Google Scholar] [CrossRef]
- Goehringer, N.; Biersack, B.; Peng, Y.; Schobert, R.; Herling, M.; Ma, A.; Nitzsche, B.; Höpfner, M. Anticancer activity and mechanisms of action of new chimeric EGFR/HDAC-inhibitors. Int. J. Mol. Sci. 2021, 22, 8432. [Google Scholar] [CrossRef] [PubMed]
- Schrader, A.; Crispatzu, G.; Oberbeck, S.; Mayer, P.; Pützer, S.; von Jan, J.; Vasyutina, E.; Warner, K.; Weit, N.; Pflug, N.; et al. Actionable Perturbations of Damage Responses by Tcl1/Atm and Epigenetic Lesions Form the Basis of T-Pll. Nat. Commun. 2018, 9, 693–697. [Google Scholar] [CrossRef]
- Parhamifar, L.; Andersen, H.; Moghimi, S.M. Lactate dehydrogenase assay for assessment of polycation cytotoxicity. Methods Mol. Biol. 2019, 1943, 291–299. [Google Scholar] [PubMed]
- Kaufmann, S.H.; Desnoyers, S.; Ottaviano, Y.; Davidson, N.E.; Poirier, G.G. Specific proteolytic cleavage of poly(ADP-ribose) polymerase: An early marker of chemotherapy-induced apoptosis. Cancer Res. 1993, 53, 3976–3985. [Google Scholar]
- Boulares, A.H.; Yakovlev, A.G.; Ivanova, V.; Stoica, B.A.; Wang, G.; Iyer, S.; Smulson, M. Role of poly(ADP-ribose) polymerase (PARP) cleavage in apoptosis. Caspase 3-resistant PARP mutant increases rates of apoptosis in transfected cells. J. Biol. Chem. 1999, 274, 22932–22940. [Google Scholar] [CrossRef] [PubMed] [Green Version]
- Newbold, A.; Falkenberg, K.J.; Prince, H.M.; Johnstone, R.W. How do tumor cells respond to HDAC inhibition? FEBS J. 2016, 283, 4032–4046. [Google Scholar] [CrossRef] [PubMed] [Green Version]
- Evan, G.I.; Vousden, K.H. Proliferation, cell cycle and apoptosis in cancer. Nature 2001, 411, 342–348. [Google Scholar] [CrossRef] [PubMed]
- Buurman, R.; Sandbothe, M.; Schlegelberger, B.; Skawran, B. HDAC inhibition activates the apoptosome via Apaf1 upregulation in hepatocellular carcinoma. Eur. J. Med. Res. 2016, 21, 26. [Google Scholar] [CrossRef] [PubMed] [Green Version]
- Dedes, K.J.; Dedes, I.; Imesch, P.; von Bueren, A.O.; Fink, D.; Fedier, A. Acquired vorinostat resistance shows partial cross-resistance to ‘second-generation’ HDAC inhibitors and correlates with loss of histone acetylation and apoptosis but not with altered HDAC and HAT activities. Anti-Cancer Drugs 2009, 20, 321–333. [Google Scholar] [CrossRef] [Green Version]
- Hu, Y.; Lu, W.; Chen, G.; Zhang, H.; Jia, Y.; Wie, Y.; Yang, H.; Zhang, W.; Fiskus, W.; Bhalla, K.; et al. Overcoming resistance to histone deacetylase inhibitors in human leukemia with the redox modulating compound β-phenylethyl isothiocyanate. Blood 2010, 116, 2732–2741. [Google Scholar] [CrossRef] [PubMed] [Green Version]
- Gupta, S.C.; Hevia, D.; Patchva, S.; Park, B.; Koh, H.; Aggarwal, B.B. Upsides and downsides of reactive oxygen species for cancer: The roles of reactive oxygen species in tumorigenesis, prevention, and therapy. Antioxid. Redox. Signal. 2012, 16, 1295–1322. [Google Scholar] [CrossRef] [Green Version]
- Weichert, W.; Röske, A.; Gekeler, V.; Beckers, T.; Stephan, C.; Jung, K.; Fritzsche, F.R.; Niesporek, S.; Denkert, C.; Dietel, M.; et al. Histone deacetylases 1, 2 and 3 are highly expressed in prostate cancer and HDAC2 expression is associated with shorter PSA relapse time after radical prostatectomy. Br. J. Cancer 2008, 98, 604–610. [Google Scholar] [CrossRef] [PubMed] [Green Version]
- Freese, K.; Seitz, T.; Dietrich, P.; Lee, S.M.L.; Thasler, W.E.; Bosserhoff, A.; Hellerbrand, C. Histone deacetylase expressions in hepatocellular carcinoma and functional effects of histone deacetylase inhibitors on liver cancer cells in vitro. Cancers 2019, 11, 1587. [Google Scholar] [CrossRef] [Green Version]
- Quint, K.; Agaimy, A.; Di Fazio, P.; Montalbano, R.; Steindorf, C.; Jung, R.; Hellerbrand, C.; Hartmann, A.; Sitter, H.; Neureiter, D.; et al. Clinical significance of histone deacetylases 1, 2, 3, and 7: HDAC2 is an independent predictor of survival in HCC. Virchows Arch. 2011, 459, 129–139. [Google Scholar] [CrossRef] [PubMed]
- Huang, B.H.; Laban, M.; Leung, C.H.; Lee, L.; Salto-Tellez, M.; Raju, G.C.; Hooi, S.C. Inhibition of histone deacetylase 2 increases apoptosis and p21cip1/Waf1 expression, independent of histone deacetylase 1. Cell Death Differ. 2005, 12, 395–404. [Google Scholar] [CrossRef] [Green Version]
- Weichert, W.; Röske, A.; Niesporek, S.; Noske, A.; Buckendahl, A.C.; Dietel, M.; Gekeler, V.; Boehm, M.; Beckers, T.; Denkert, C. Class I histone deacetylase expression has independent prognostic impact in human colorectal cancer: Specific role of class I histone deacetylases in vitro and in vivo. Clin. Cancer Res. 2008, 14, 1669–1677. [Google Scholar] [CrossRef] [Green Version]
- Gillies, R.; Didier, N.; Denton, M. Determination of cell number in monolayer cultures. Anal. Biochem. 1986, 159, 109–113. [Google Scholar] [CrossRef]
- Shi, X.Y.; Ding, W.; Li, T.Q.; Zhang, Y.X.; Zhao, S.C. Histone deacetylase (HDAC) inhibitor, suberoylanilide hydroxamic acid (SAHA), induces apoptosis in prostate cancer cell lines via the Akt/Foxo3a signaling pathway. Med. Sci. Monit. 2017, 23, 5793–5802. [Google Scholar] [CrossRef]
- Hubbert, C.; Guardiola, A.; Shao, R.; Kawaguchi, Y.; Ito, A.; Nixon, A.; Yoshida, M.; Wang, X.-F.; Yao, T.-P. HDAC6 is a microtubule-associated deacetylase. Nature 2002, 417, 455–458. [Google Scholar] [CrossRef]
- Bali, P.; Pranpat, M.; Bradner, J.; Balasis, M.; Fiskus, W.; Guo, F.; Rocha, K.; Kumaraswamy, S.; Boyapalle, S.; Atadjia, P.; et al. Inhibition of histone deacetylase acetylates and disrupts the chaperone function of heat shock protein 90: A novel basis for antileukemia activity of histone deacetylases. J. Biol. Chem. 2005, 280, 26729–26734. [Google Scholar] [CrossRef] [PubMed] [Green Version]
- Gibbs, A.; Schwartzmann, J.; Deng, V.; Alumkal, J. Sulforaphane destabilizes the androgen receptor in prostate cancer cells by inactivating histone deacetylase 6. Proc. Natl. Acad. Sci. USA 2009, 106, 16663–16668. [Google Scholar] [CrossRef] [PubMed] [Green Version]
- Kanno, K.; Kanno, S.; Nitta, H.; Uesugi, N.; Sugai, T.; Masuda, T.; Wakabayashi, G.; Maesawa, C. Overexpression of histone deacetylase 6 contributes to accelerated migration and invasion activity of hepatocellular carcinoma cells. Oncol. Rep. 2012, 28, 867–873. [Google Scholar] [CrossRef] [Green Version]
- Morgan, S.S.; Cranmer, L.D. Vorinostat synergizes with ridaforolimus and abrogates the ridaforolimus-induced activation of AKT in synovial sarcoma cells. BMC Res. Notes 2014, 7, 812. [Google Scholar] [CrossRef] [PubMed] [Green Version]
- Zibelman, M.; Wong, Y.-N.; Devarajan, K.; Malizzia, L.; Corrigan, A.; Olszanski, A.J.; Denlinger, C.S.; Roethke, S.K.; Tetzlaff, C.H.; Plimack, E.R. Phase I study of the mTOR inhibitor ridaforolimus and the HDAC inhibitor vorinostat in advanced renal cell carcinoma and other solid tumors. Investig. New Drugs 2015, 33, 1040–1047. [Google Scholar] [CrossRef] [Green Version]
- Deroanne, C.F.; Bonjean, K.; Servotte, S.; Devy, L.; Colige, A.; Clausse, N.; Blacher, S.; Verdin, E.; Foidart, J.-M.; Nusgens, B.V.; et al. Histone deacetylase inhibitors as anti-angiogenic agents altering vascular endothelial growth factor signaling. Oncogene 2002, 21, 427–436. [Google Scholar] [CrossRef] [Green Version]
- Hong, S.-W.; Jung, K.H.; Lee, H.-S.; Choi, M.-J.; Son, M.K.; Zheng, H.-M.; Hong, S.-S. SB365 inhibits angiogenesis and induces apoptosis of hepatocellular carcinoma through modulation of PI3K/Akt/mTOR signaling pathway. Cancer Sci. 2012, 103, 1929–1937. [Google Scholar] [CrossRef] [PubMed]
- Namdar, M.; Perez, G.; Ngo, L.; Marks, P.A. Selective inhibition of histone deacetylase 6 (HDAC6) induces DNA damage and sensitizes transformed cells to anticancer agents. Proc. Natl. Acad. Sci. USA 2010, 107, 20003–20008. [Google Scholar] [CrossRef] [Green Version]
- Schaller, E.; Ma, A.; Gosch, L.C.; Klefenz, A.; Schaller, D.; Goehringer, N.; Kaps, L.; Schuppan, D.; Volkamer, A.; Schobert, R.; et al. New 3-aryl-2-(2-thienyl)acrylonitriles with high activity against hepatoma cells. Int. J. Mol. Sci. 2021, 22, 2243. [Google Scholar] [CrossRef] [PubMed]
- Escada-Rebelo, S.; Mora, F.G.; Sousa, A.P.; Almeida-Santos, T.; Paiva, A.; Ramalho-Santos, J. Fluorescent probes for the detection of reactive oxygen species in human spermatozoa. Asian J. Androl. 2020, 22, 465–471. [Google Scholar]
- Trott, O.; Olson, A.J. AutoDock Vina: Improving the speed and accuracy of docking with a new scoring function, efficient optimization and multithreading. J. Comput. Chem. 2010, 31, 455–461. [Google Scholar] [CrossRef] [Green Version]
- DeLano, W. PyMOL: An open-source molecular graphics tool. CCP4 Newsl. Protein Crystallogr. 2002, 40, 44–53. [Google Scholar]
- Laemmli, U.K. Cleavage of structural proteins during the assembly of the head of bacteriophage T4. Nature 1970, 227, 680–685. [Google Scholar] [CrossRef] [PubMed]
- Steinemann, G.; Dittmer, A.; Kuzyniak, W.; Hoffmann, B.; Schrader, M.; Schobert, R.; Biersack, B.; Nitzsche, B.; Höpfner, M. Animacroxam, a novel dual-mode compound targeting histone deacetylases and cytoskeletal integrity of testicular germ cell cancer cells. Mol. Cancer Ther. 2017, 16, 2364–2374. [Google Scholar] [CrossRef] [PubMed] [Green Version]
- Maibier, M.; Bintig, W.; Goede, A.; Höpfner, M.; Kuebler, W.M.; Secomb, T.W.; Nitzsche, B.; Pries, A.R. Gap junctions regulated vessel diameter in chick chorioallantoic membrane vasculature by both tone-dependent and structural mechanisms. Microcirculation 2020, 27, e12590. [Google Scholar] [CrossRef] [PubMed] [Green Version]


| Compounds | DU145 | Hep-G2 | Jurkat | Hut78 | SupT11 | SMZ1 |
|---|---|---|---|---|---|---|
| SF5-SAHA | 0.73 ± 1.08 | 1.79 ± 1.06 | 0.76 ± 0.06 | 2.40 ± 0.40 | 3.08 ± 0.33 | 1.58 ± 0.29 |
| SAHA | 0.68 ± 0.04 | 3.22 ± 0.44 | 1.70 ± 0.17 | 5.07 ± 0.42 | 4.67 ± 0.31 | 2.87 ± 0.33 |
Publisher’s Note: MDPI stays neutral with regard to jurisdictional claims in published maps and institutional affiliations. |
© 2021 by the authors. Licensee MDPI, Basel, Switzerland. This article is an open access article distributed under the terms and conditions of the Creative Commons Attribution (CC BY) license (https://creativecommons.org/licenses/by/4.0/).
Share and Cite
Goehringer, N.; Peng, Y.; Nitzsche, B.; Biermann, H.; Pradhan, R.; Schobert, R.; Herling, M.; Höpfner, M.; Biersack, B. Improved Anticancer Activities of a New Pentafluorothio-Substituted Vorinostat-Type Histone Deacetylase Inhibitor. Pharmaceuticals 2021, 14, 1319. https://0-doi-org.brum.beds.ac.uk/10.3390/ph14121319
Goehringer N, Peng Y, Nitzsche B, Biermann H, Pradhan R, Schobert R, Herling M, Höpfner M, Biersack B. Improved Anticancer Activities of a New Pentafluorothio-Substituted Vorinostat-Type Histone Deacetylase Inhibitor. Pharmaceuticals. 2021; 14(12):1319. https://0-doi-org.brum.beds.ac.uk/10.3390/ph14121319
Chicago/Turabian StyleGoehringer, Nils, Yayi Peng, Bianca Nitzsche, Hannah Biermann, Rohan Pradhan, Rainer Schobert, Marco Herling, Michael Höpfner, and Bernhard Biersack. 2021. "Improved Anticancer Activities of a New Pentafluorothio-Substituted Vorinostat-Type Histone Deacetylase Inhibitor" Pharmaceuticals 14, no. 12: 1319. https://0-doi-org.brum.beds.ac.uk/10.3390/ph14121319