
Mercury Toxicity and Detection Using Chromo-Fluorogenic Chemosensors


1
Department of Chemistry, Sardar Vallabhbhai National Institute of Technology (SVNIT), Surat 395007, India
2
Dipartimento di Scienze della Vita e dell’Ambiente, Università di Cagliari, Cittadella Universitaria, 09042 Monserrato-Cagliari, Italy
*
Authors to whom correspondence should be addressed.
Pharmaceuticals 2021, 14(2), 123; https://0-doi-org.brum.beds.ac.uk/10.3390/ph14020123
Submission received: 17 January 2021
/
Revised: 3 February 2021
/
Accepted: 3 February 2021
/
Published: 5 February 2021
(This article belongs to the Special Issue Applications of Medicinal Bioinorganic Chemistry)
Abstract
:Mercury (Hg), this non-essential heavy metal released from both industrial and natural sources entered into living bodies, and cause grievous detrimental effects to the human health and ecosystem. The monitoring of Hg2+ excessive accumulation can be beneficial to fight against the risk associated with mercury toxicity to living systems. Therefore, there is an emergent need of novel and facile analytical approaches for the monitoring of mercury levels in various environmental, industrial, and biological samples. The chromo-fluorogenic chemosensors possess the attractive analytical parameters of low-cost, enhanced detection ability with high sensitivity, simplicity, rapid on-site monitoring ability, etc. This review was narrated to summarize the mercuric ion selective chromo-fluorogenic chemosensors reported in the year 2020. The design of sensors, mechanisms, fluorophores used, analytical performance, etc. are summarized and discussed.
1. Introduction
Metals like Na, K, Mg, Ca, V, Cr, Mn, Fe, Co, Ni, Cu, Zn, and Mo are well-known to play important roles in human physiological functions. However, the excessive as well as deficiency of these essential metals in human body can cause serious detrimental effects. Similarly, several non-essential metals entered into the human body from different sources can also cause grievous toxic effects even at trace quantity. Therefore, there is an exponential growth in the development of facile and cost-effective analytical techniques for the on-site and real-time detection of both essential and non-essential metal ions [1,2,3,4,5]. Among the various analytical techniques, the chromogenic and fluorogenic chemosensors are extensively developed for the detection of metal ions because of their high selectivity and sensitivity, easy-to-design, low-cost, simplicity, real-time, and on-site detection ability. The chromo-fluorogenic chemosensors are designed and developed by considering three important things: (i) signaling unit, (ii) recognition unit, and (iii) mechanism (Figure 1). The signaling unit may be an organic fluorophore, chromophore, or optically active nanoparticles. When the recognition unit selectively recognize the target analyte, the mechanism based on electron/charge/energy transfer occurred in the sensor can alter the electronic properties of the signaling unit that gives detectable optical response [6].
Mercury (Hg), one of the non-essential heavy metal can cause serious toxicity to human health and ecosystem. Because of the high affinity to S-containing ligands, the accumulation of mercury in human body can affect the normal functioning of proteins and enzymes leading to the wide variety of diseases related to kidney, brain, reproductive disturbance, central nervous system, etc. [7]. Considering the toxicity, the acceptable limit of inorganic mercury in drinking water was prescribed as 2 μg L−1 (10 nM) by the United States Environmental Protection Agency (US EPA). Also, the inorganic mercury can be converted into organic mercury (like methylmercury) that affects the brain and cause other neurotoxic effects, and therefore, the intake of 1.6 µg/kg body weight per week of methylmercury was recommended by Joint FAO/WHO Expert Committee on Food Additives (JECFA) [8]. The associated toxicity even at a trace amount of mercury resulted an expedite growth in the design of novel analytical methods, including optically active chemosensors for the detection of mercuric ions. Literature survey supported the reports of several reviews on mercuric ions sensing and toxicity [9,10,11,12,13,14,15]. In this review, the mercury toxicity and important chelates available for mercury intoxication will be discussed first, and then the chemosensors reported in the year 2020 will be summarized. The fluorophores used for the designing of sensors, the sensing mechanisms and the detection performance will be summarized and discussed.
2. Mercury Toxicity and Intoxication
Mercury, a silvery colored metal, liquid at room temperature, is characterized by atomic number 80 in group 12 of the periodic table of elements, standard atomic weight 200.59 g/mol. Mercury can assume the three oxidation states 0, +1, +2. It presents a high density 13.53 g/mL, and a relatively high vapor pressure (0.0017 torr at 25 °C, corresponding to a concentration of 20 mg/m3). It is monoatomic in vapor phase, and is highly soluble in polar and non-polar solvents (a mercury water solution can reach the concentration of 0.6 μg/L at 25 °C).
The use of mercury is reported since the ancient times, mainly as the pigment cinnabar. The mined amount of mercury has been almost constant over the centuries until 1500, when huge amounts were produced in Spain (Almaden) to be shipped to Spanish South America for silver extraction. A paper by Hylander and Meili [16], takes into account the trend in mercury production from this period to 2000. The discovery of gold in California in 1850 produced a jump in mercury production, as well as its use in chlor-alkali plants in the 20th century. The consumption of explosives in the war industry contributed to the large production of mercury during World Wars I and II. The increasing awareness of mercury toxicity has led in the years to its banning from different applications (amalgamation in China in 1985 and in Russia in 1990, pesticides in USA in 1993, batteries in USA in 1996), until the Protocol on Heavy Metals (cadmium, lead and mercury), signed in 1998 by different countries, the 2005 EU Mercury Strategy, and finally the Minamata Convention on Mercury in 2013. At the fifth session of the Intergovernmental Negotiating Committee in Geneva, Switzerland, on 19 January 2013, it was agreed the Minamata Convention on Mercury, a global treaty to protect human health and the environment from the adverse effects of mercury. The major highlights of the Minamata Convention on Mercury include a ban on new mercury mines, the phase-out of existing ones, control measures on air emissions, and the international regulation of the informal sector for artisanal and small-scale gold mining [17]. Despite the above legislative controls, mercury remains one of the major toxicants in the world [18] and deserves a careful consideration about its environmental quantification, its toxic action, and the strategy for the clinical treatment of intoxication.
Mercury presents in the environment mainly in three chemical forms, i.e., elemental mercury (liquid or vapor Hg0), inorganic mercuric compounds (Hg2+), and organic mercury compounds (methylmercury, MeHg, CH3Hg and ethyl mercury EtHg, C2H5Hg) [19]. Toxicity of mercury in humans can be related to any of these three forms, absorbed in different ways: inhalation, oral, and dermal. The kind and the degree of intoxication is highly specific for any of these three chemical species, as well as the symptoms and the consequences [20]. Table 1 presents the main sources of exposure of the different forms of mercury and the affected organs [21].
The exposure of mercury by human body can be occurred via ingestion or inhalation [7]. The extensive utilization of elemental mercury in a number of industrial processes has led the involved personnel exposed to gaseous mercury. To have a quantitative evaluation of this exposure, we remember that in presence of liquid Hg0 the surrounding non-ventilated air can reach a concentration of 20 mg/m3 of monoatomic mercury vapors. Since a person inhales 15–20 m3 of air daily, a worker who stays about 8 h in a mercury saturated place inhales 5–6.6 m3 of air, i.e., 100–135 mg of Hg0. Mercury vapors are efficiently absorbed by lungs due to their high liposolubility producing severe pulmonary injuries. Elemental mercury in the lungs enters the blood flow, where a certain amount is oxidized to Hg2+ and excreted in urine, and some, due its high liposolubility, passes through the blood–brain barrier (BBB) and enters in the central nervous system.
Various forms of inorganic mercury in water are converted by microorganisms to methyl mercury that accumulates in fish and pass to humans through the food chain. In humans, inhaled or ingested methyl mercury is well absorbed and is found in red blood cells, liver, kidneys, and above all in the brain (including the fetal brain, since methyl mercury can cross the placental barrier), where it causes severe, cumulative, and irreversible injuries to the central nervous system. Its retention time in the human body varies from months to years, and the appearance of symptoms can be delayed for many years. Symptoms of methylmercury intoxication include mental retardation, cerebral blindness, deafness, palsy, and dysarthria, particularly in children exposed in utero. It is important to emphasize that methylmercury exposure mainly affects people whose diet includes the consumption of high amounts of fish.
Inorganic mercury compounds were largely used in the chemical industry, and were the cause of heavy occupational exposure. Inorganic salts are poorly absorbed, and kidneys represent their main target. From a chemical point of view, mercury toxicity depends primarily from the mercuric ion ability to form covalent bonds with sulfur atoms, substituting hydrogen atoms in sulfhydryl groups of proteins to form mercaptides. This can deactivate a number of essential enzymes, completely altering their regular biological functions [21,22,23].
Chelation therapy is used for the treatment of all forms of mercury intoxication. In clinical use, chelating agents remove metal ions from the biological ligands in the organism, where they exert their toxic action, through the formation of metal complexes that are successively excreted. Characteristics of a good chelator should be great solubility in both water and lipids, resistance to biotransformation, capacity to reach the sites of metal accumulation, high stability of the complexes at the pH of body fluids, and toxicity of the formed complexes lower than that of the free metal ions [21]. Most of the chelating agents in use today are not able to cross the BBB and this limits their ability to remove the toxic metal ions from the brain. The main chelating agents used in the treatment of mercury intoxication are summarized in Figure 2.
The dithiol chelating agent 2,3-dimercaptopropan-1-ol (BAL) was originally synthesized for the treatment of the effects of the war gas Lewisite. It competes successfully with protein SH groups forming stable chelates with Hg2+ metal ions. For several decades after its synthesis, it was recommended for the treatment of inorganic mercury poisoning, but it presents severe adverse effects, including painful intramuscular injections, high blood pressure and tachycardia, and predisposition to redistribute the complexed toxic elements to the brain. At any rate, it is contraindicated in the treatment of alkyl-Hg intoxication. In most cases, it has been replaced by DMSA and DMPS in the treatment of metal poisoning [24].
The chelating agent meso-dimercaptosuccinic acid (DMSA) or simply called succimer is the water-soluble dithiol. DMSA can be administered as intravenous and oral preparations, being DMSA a hydrophilic chelator. When administered orally, about 20% is absorbed in the gut, and about 95% of the absorbed amount is bound to plasma albumin, presumably by one SH group to a cysteine residue, being the second SH group free for binding metal ions. The action of DMSA is limited to the extracellular space. It increases Hg excretion in the urine. DMSA is considered the drug of choice for the treatment of organic-Hg intoxication. Even if DMSA does not pass the BBB, it indirectly reduces the brain burden of methyl mercury presumably by changing the brain/blood equilibrium. The derivative monoisoamyl 2,3-dimercaptosuccinic acid (MiADMSA) is at the moment under evaluation. Differently from DMSA, which removes extracellularly distributed metal ions [25], MiADMSA is also able to chelate intracellular distributed metal ions [26].
The structure of 2,3-dimercaptopropane-1-sulfonic acid (DMPS), also known as unitiol is shown in Figure 2. DMPS is a drug produced in Germany and registered for the treatment of mercury intoxication. It is not an approved drug in the USA, unless the FDA gives a special permission. The daily dose is usually 3–10 mg DMPS/kg body weight. DMPS is believed the optimal remedy in poisoning by inorganic mercury [27], while it is less effective than DMSA for organic mercury [28]. DMPS can be administered both intravenously and orally; less than 40% of orally administered DMPS is effectively adsorbed [29]. DMPS, which is a hydrophilic chelating agent, is mainly distributed in the extracellular space, but a small fraction is found in the intracellular compartments [30]. DMPS scavenges mercury from kidneys more effectively than DMSA, and is considered the drug of choice for the treatment of acute intoxication by inorganic mercury [30,31].
The α-lipoic acid ((R)-5-(1,2-dithiolan-3-yl)pentanoic acid, LA) is the sulfur containing organic compound known as thioctic acid, presented in Figure 2. LA, essential for aerobic metabolism, is ordinarily produced in the body. Its reduced form, called dihydrolipoic acid (DHLA), contains a couple of -SH groups; it is characterized by high affinity for mercuric ion and has been recently proposed as an effective mercury chelator [31].
3. Chromo-Fluorogenic Chemosensors
Because of the potential toxicity of mercuric ions to living systems, there is an expedite growth in the design of optically activity chemosensors. In the year 2020, more than 100 Hg2+ selective chromo-fluorogenic chemosensors were reported, which can be classified in three different categories based on the optical responses, i.e., (i) fluorescence, (ii) colorimetric, and (iii) dual-mode chemosensors. The fluorescence chemosensors are discussed based on the fluorescence changes, i.e., turn-off, turn-on and ratiometric (Table 2). The fluorescent chemosensors are more sensitive than the colorimetric sensors with high visual effects that allowed for different bioimaging and diagnosis applications. The most dominating mechanisms for Hg2+ sensing are complexation-induced change in the optical properties due to electron/energy/charge transfer or the sensor possess a reactive group that undergoes Hg2+-catalyzed chemical transformation. The sensing mechanisms and other experimental parameters (such as solvent medium, pH and concentration of sensors etc.) important in fabricating a suitable chemosensors are discussed.
3.1. Fluorescent Chemosensors
3.1.1. Fluorescent Turn-Off Chemosensors
The heavy metal ions like Hg2+ greatly influence the fluorescence of a sensor after complexation leading to the fluorescence quenching via energy or electron transfer mechanism. Ebru et al. [32] have reported the pyrazoline based fluorogenic sensor 1 for the detection of Hg2+ in aqueous medium. Sensor 1 (Figure 3) showed a fluorescence maxima at 464 nm (λexc = 350 nm), but the fluorescence intensity was decreased upon addition of Hg2+ with the sensitivity limit of 0.16 μM (Figure 4). The electrostatic interaction between 1 and the heavy metal ion Hg2+ caused the fluorescence quenching. This reversibility sensor 1 formed a complex with Hg2+ in 2:1 stoichiometry. The fluorescent turn-off sensor 2 was introduced for the detection of Hg2+ in water medium [33]. Sensor 2 (Figure 3) showed an absorption band at 525 nm while fluorescence maxima at 632 nm. Prominent fluorescence quenching accompanied by 25 nm red-shift was observed upon binding with Hg2+ leading to the solution color turned from pink to pale violet due to the intramolecular charge transfer occurred between Hg2+ and the N-atoms of 2. Sensor 2 formed complex with Hg2+ in 1:2 stoichiometry, and the estimated LOD was reported to be 39.2 nM.
The Hg2+ selective fluorescent turn-off sensor 3 (Figure 3) using the Zn-based metal organic framework (Zn-MOF) was prepared by reacting the ligand 5-aminoisophthalic acid with Zn2+ [34]. The Zn-MOF formed a 3D supramolecular network having uncoordinated carboxylic atoms and pores size of 8.2 Å. Addition of Hg2+, the fluorescence of Zn-MOF at 416 nm (λexc = 316 nm) was quenched with a sensitivity limit of 0.1243 μM due to the complexation-induced inhibition of intermolecular energy transfer. In another work, the triarylamine-based covalent organic framework (COF) polymer 4 (Figure 3) was converted into nanosphere via Suzuki polymerization under mini-emulsion condition, which showed selective fluorescence turn-off response for Hg2+ in mixed aqueous medium. The blue-green fluorescence of 4 is quenched upon complexation of Hg2+ with the sulfur atom. The sensor was immobilized successfully over macroporous sponge for facile detection and removal of Hg2+ [35].
The benzimidazole derived fluorescent sensor 5 (Figure 5) showed an excellent selectivity towards Hg2+ in CH3CN/H2O (1:1, v/v). Sensor 5 exhibited a fluorescence emission at 380 nm when excited at 270 nm. In the fluorescence experiments, only Hg2+ caused significant fluorescence quenching (85%) of 5 by forming a complex in 1:1 stoichiometry (Figure 6). Sensor 5 showed a LOD of 0.68 μM, and no interference with other tested metal ions. The complex [5-Hg2+] emits in an acidic environment whereas quenched in an alkaline environment, which can also be used for pH sensing [36]. The triazole-bridged coumarin conjugated quinoline sensor 6 (Figure 5) was developed for the fluorescent turn-off detection of Hg2+. The complexation of 6 with Hg2+ at the tridentate coordination site created by the quinolone and triazole stimulates the unusual PET process, and caused the fluorescence quenching at 485 nm with the sensitivity limit of 172 nM. The Hg2+ sensing ability of 6 was further studied in live U-2-OS cells [37]. Murugan et al. [38] have reported the tetraazamacrocyclic derivative appended with the salicylaldehyde 7 (Figure 5) for the selective fluorescent turn-off sensing of Hg2+ in CH3CN/HEPES buffer (2:8, v/v). The fluorescence emission of 7 at 490 nm was quenched upon complexation with Hg2+ in 1:1 ratio due to chelation enhancement quenching (CHEQ) effect. The quenched fluorescence is recovered with the addition of KI. The lowest limit of detection for Hg2+ is 1 nM. In addition, the sensor 7 showed fluorescence turn-on response for the detection of HSO4−.
The marine cyanobacterium based natural protein C-phycoerythrin 8 (Figure 5) was applied for the fluorescent turn-off detection of Hg2+. Sensor 8 showed an intense yellow orange fluorescence at 574 nm due to the phycoerythrobilin (PEB), a linear tetrapyrrole. Upon interaction of Hg2+ with the amino acid side chain and thioether bridges in the protein 8, the fluorescence is quenched. The complexation of Hg2+ caused indirect charge transfer that quenched the fluorescence of 8. The LOD of 8 for Hg2+ was estimated as 312 nM [39].
The acridine-based chemosensor 9 (Figure 7) possessing two S-donor atoms was developed for the fluorescent turn-off detection of Hg2+ in Tris-HCl buffer. The fluorescence of 9 at 445 nm was quenched upon complexation with Hg2+ in 1:1 binding stoichiometry. Sensor 9 showed a LOD of 4.40 μM, and applied for the monitoring of Hg2+ in real water samples and bioimaging ability in living cells [40]. Adopting the complexation-induced fluorescence quenching approach, the dansyl-peptide based sensor 10 was developed by the conjugating two serines and dansyl groups. Sensor 10 (Figure 7) exhibited sensitivity towards Hg2+ through fluorescence quenching at 550 nm in HEPES buffer solutions. Upon complexation of sensor 10 with Hg2+ in 2:1 stoichiometry, the heavy atom effect and the electron transfer caused the fluorescence quenching. With nanomolar detection limit (7.59 nM), sensor 10 was successfully applied for monitoring Hg2+ ions in real water samples (lake and tap water) and living LNCaP cells [41].
Thiocarbohydrazide based Schiff base 11 (Figure 7) was introduced for the colorimetric and fluorescent sensing of Hg2+. Sensor 11 showed AIE behaviour in a mixture of acetonitrile and water. The emission intensity was found to increase gradually with the addition of water up to 40%, and the cyan fluorescence was clearly developed from aggregates. Upon interaction of Hg2+ with the AIE active 11 led to the color change from colorless to yellow. The quenching in fluorescence intensity was attributed to combine effect of chelation enhanced fluorescence quenching (CHEQ) and photo-induced electron transfer (PET). The limit of detection for Hg2+ is 1.26 nM. Sensor 11 was applied for the detection of Hg2+ by using test paper strip and in various real water samples [42].
Yanxin et al. [43] reported a covalent organic frameworks (COFs) 12 (Figure 7) with extended hydrazone-linked π-conjugation by condensing two different monomers for the detection and removal of Hg2+ in acetonitrile. Sensor 12 showed an absorption peak at 350 nm while emission band at 603 nm due to the ESIPT. Addition of Hg2+ ion, the color change from orange to light blue with the significant fluorescence quenching due to the inhibition of the ESIPT process. Limit of detection is calculated as 20 ppb without any significant interference with other ions. Moreover, sensor 12 was applied for the effective Hg2+ removal from water. The pyrene-based COFs 13 (Figure 7) was introduced for the simultaneous detection and removal of Hg2+ in DMF. After interaction with Hg2+, the fluorescence of COFs 13 at 463 nm was quenched with the sensitivity limit of 17 nM, and the blue-emitting 13 turned to colorless. Fluorescence quenching of 13 is attributed to a PET process from sensor to the Hg2+. Sensor 50 was applied for removing Hg2+ from both air and water [44]. The microporous porphyrinic zirconium-based MOF 14 was developed by using meso-tetra(4-carboxyphenyl)porphyrin as a ligand for the detection of Hg2+ in methanol medium [45]. Sensor 14 fluorescence at 436 nm was quenched upon addition of Hg2+ ions with a fast response rate under <1 min and sensitivity limit of 0.01 μM. The quenching efficiency was explain by donor-acceptor (D-A) electron transfer mechanism. Also, sensor was applied for the detection of DMF.
Reena et al. [46] have reported a phenylalaninol-fluorescein conjugated Schiff base receptor 15 (Figure 8) for the colorimetric and fluorescence detection of Hg2+ in pure aqueous medium. Upon gradual addition of Hg2+, the emission at 521 nm is quenched and slightly red-shift, while the absorption showed a hypsochromic shift of 30 nm at 430 nm causing color change from green to light pink. The lowest limit of detection for Hg2+ is 0.34 μM. The job’s plot supported the 1:1 binding stoichiometry between 15 and Hg2+. Sensor 15 is applicable for Hg2+ detection in industrial effluents and paper strip visualization with the irreversible mode. The curcumin and β-cyclodextrin inclusion complex 16 (Figure 8) was applied for the chromo-fluorogenic sensing of Hg2+ in aqueous medium. The supramolecular system 16 complexed with Hg2+ after deprotonation of aliphatic hydroxy group caused apparent color change from yellow to colorless [47]. The absorbance of 16 at 482 nm was quenched and blue-shifted to 379 nm. Also, the fluorescence emission at 512 was significantly diminished and blue-shifted to 502 nm. With the fluorescence change, the concentration of Hg2+ can be detected down to 5.02 µM, and applied to quantify Hg2+ concentration in real water samples. In another work, the fluorescent turn-off sensor 17 was developed for the detection of Hg2+ in MeOH/H2O (1/4, v/v) solvent [48]. The emission at 455 nm is red-shifted to 485 nm and quenched with the addition of Hg2+ due to the chelation enhancement quenching effect (CHEQ). Without responding with other ions, sensor 17 can be applied to detect Hg2+ down to 3.12 nM. In addition, the absorption band of 17 at 292 nm was quenched whereas the band at 337 nm red-shifted to 355 nm. The absorbance and fluorescence changes occurred in 17 after the addition of Hg2+ were recovered with the addition of iodide ions.
Ashwani et al. [49] reported an anthrapyridone-based receptor 18 (Figure 8) for the sensing of Hg2+ and Cu2+ in CH3CN. The fluorescence emission at 492 nm of sensor 18 was quenched in presence of Hg2+ with the LOD of 200 nM. In UV–vis absorption study, the absorption peak of 18 at 445 nm was quenched and a red-shifted absorption band appeared at 630 nm leading to the color change from yellow-green to green. Similar spectral changes of 18 were also observed with Cu2+. The quinoline-based benzimidazole derivative 19 (Figure 8) was developed for the dual-mode chemosensing of Hg2+ in DMF/H2O [50]. Sensor 19 formed gel in DMF and converted to sol with the addition of Hg2+, and also the fluorescence at 378 nm was quenched. This gel-sol transition based sensor showed the 16 nM LOD for Hg2+. Sensor 19 also showed naked-eye detectable color change for Cu2+ from white to dark pink in the gel state.
The multi-analytes selective bis-thiosemicarbazone based receptor 20 (Figure 8) was developed for the detection of Hg2+, Zn2+ and Cd2+ in H2O:DMSO (95:5 v/v) [51]. Sensor 20 showed an intense emission at 540 nm, while addition of Hg2+, the fluorescence was quenched and red-shifted to 578 nm with the color changed from yellow to reddish-brown (λex = 360 nm). Color and fluorescence changes were attributed by intra-ligand fluorescence and influence of coordination of Hg2+ to the receptor. The LOD for Hg2+ was estimated as 0.51 μM. With Zn2+ and Cd2+, the fluorescence of 20 was blue-shifted and enhanced respectively at 488 and 470 nm. The tryptophan-based polymer 21 (Figure 8) was reported for the detection of Hg2+ and Cu2+ [52]. Sensor 21 showed dual emissions at 364 nm and 464 nm with the yellow colored fluorescence in aqueous medium at physiological pH. Upon complexation with Hg2+/Cu2+, sensor 21 showed significant quenching at 464 nm without any change at 364 nm. The quenching was attributed by PET process from the tryptophan donor to the pyridine acceptor unit. With 21, the concentration of Hg2+ and Cu2+ can be detected down to 7.41 nM and 4.94 nM, respective, and applied for the bioimaging of intracellular Hg2+/Cu2+ in live CP3 cells. The isocoumarin based sensor 22 (Figure 8) was developed for the fluorescent turn-off sensing of Hg2+ and Fe3+ DMSO/HEPES buffer solution (9/1, v/v, pH 7.0) [53]. After complexation of Hg2+/Fe3+ with 22 in 1:2 stoichiometry, significant fluorescence quenching was observed at 455 nm. Sensor 22 showed the sensitivity limit of 8.12 nM and 5.51 nm for Hg2+ and Fe3+, respectively. Sensor 22 was applied to imaging intracellular Hg2+/Fe3+ in live HepG2 cells.
3.1.2. Fluorescent Turn-On and Ratiometric Chemosensors
The fluorescent turn-on and ratiometric sensors are more advantageous than fluorescent turn-off sensors for biological applications because of the facile measuring of low-concentration contrast in compared to a ‘dark’ background, reduction in the false positive signals and enhancement in the sensitivity. Therefore, more numbers of Hg2+ selective fluorescent turn-on and ratiometric sensors were reported and applied for the monitoring of Hg2+ in real samples and bioimaging intracellular Hg2+ in live cells. The micellar based Hg2+ selective fluorescent turn-on sensor 23 (Figure 9) was developed by organizing the fluorophore 10-methylacridinium perchlorate, sulfur-containing ligand N,N-bis(2-hydroxyethylthio-1-ethyl)dodecylamine and the surfactant sodium dodecyl sulfate (SDS) [54]. Under micellar condition, the ligand decorated with the SDS formed complex with Hg2+ that enhanced the fluorescence of 10-methylacridinium due to the inhibition of PET from the ligand to the excited fluorophore. The turn-on fluorescence is observed at λem = 495 nm (λexc = 359 nm) with the limit of detection of 22 nM Hg2+. The pyridyl-based sensor 24 (Figure 9) containing multiple binding sites was developed for fluorescent turn-on sensing of Hg2+ in aqueous solution with a limit of detection of 0.28 ppb [55]. The broad fluorescence emission spectrum of sensor 24 with maxima at 387 nm showed about 5-fold emission enhancement upon addition of Hg2+ due to the complexation-induced inhibition of PET and C=N isomerization. The applicability of sensor 24 was assessed in real water samples. The ESIPT and PET based sensor 25 (Figure 9) was developed for the detection of Hg2+ in DMF/HEPES solution (1:1, v/v) medium [56]. After interaction with Hg2+, sensor 25 showed fluorescence enhancement at 495 nm with 180 nm Stokes shift. The complex formation between 25 and Hg2+ in 1:1 stoichiometry inhibited both the ESIPT and PET processes (Figure 10), which caused significant fluorescence enhancement. The limit of detection of 25 was 6.45 × 10⁻⁷ M Hg2+ and applied in environmental and biological samples for Hg2+ quantification. In addition, the in situ generated complex of 25 with Hg2+ was applied as a secondary sensor for the detection of S2–.
Two polystyrene solid-phase sensors 26 and 27 (Figure 9) were synthesized with different lengths of the linker [57]. The fluorescence intensity was determined with an excitation wavelength of 401 nm for 26 and 405 nm for 27. These naphthalimide-piperazine-pyridine based sensors 26 and 27 showed fluorescence enhancement at 520 nm and 525 nm upon the incremental addition of Hg2+ in HEPES buffer (pH 7.2), respectively. The detection mechanism involving the Hg2+ sensing is chelation-induced inhibition of PET. Sensor 26 showed a higher fluorescence response than 27 with the LOD of 1.01 µM Hg2+. Also, sensor 26 was successfully applied to monitor Hg2+ in tap water and lake water.
The near-infrared (NIR) fluorescent receptor 28 (Figure 11) containing a donor-acceptor structure was reported for the detection of Hg2+ in THF-H2O (9:1, v/v), where the triphenylamine-benzothiadiazole acts as a fluorophore and the rhodanine-3-acetic acid as metal ion recognition unit [58]. The complexation of Hg2+ with 28 in 1:1 stoichiometry at the S and O donor atoms of rhodanine-3-acetic acid enhanced the electron-donating ability and blocked the intermolecular charge transfer process, which caused significant fluorescence enhancement at 675 nm with the sensitivity limit of 13.1 nM. This low cytotoxic sensor 28 was applied for the imaging of intracellular Hg2+ in live A549 cells and zebrafish larvae. The chemosensor 29 (Figure 11) based on the piperazine derivative was developed for the detection of Hg2+ ion in mixed aqueous DMSO. In UV–vis spectral analysis, sensor 29 showed a strong ICT band at 495 nm that significantly blue-shifted (13 nm), while the emission band at 543 nm was greatly enhanced in the presence of Hg2+ with LOD of 19.2 nM. The sensing mechanism was explained by the aspect that after addition of Hg2+, the electron donating ability of aniline group was reduced that suppressed the PET process in sensor resulting fluorescent turn-on detection of Hg2+ (Figure 12A) along with the naked-eyes colorimetric change from orange to yellow. Sensor 29 was also applied for the potential application in paper strip visualization and bioimaging (Figure 12B) [59]. Another PET based sensor 30 (Figure 11) containing NBD fluorophore and thiophene ionophore was applied for the fluorescent turn-on sensing of Hg2+. Sensor 30 showed weak emission at 587 nm in CH3CN:H2O (4:6 v/v), while the fluorescence enhanced by 50 folds upon complexation with Hg2+ in 1:1 binding stoichiometry. The fluorescence enhancement was observed due to complexation-induced inhibition of PET. The limit of detection of 3.9 ppb Hg2+ was estimated for sensor 30, and was applied to detect Hg2+ in drinking water, live cells and plant tissues [60].
Xiaobo et al. [61] recently introduced a bismacrocyclic polyamine-based chemosensor 31 (Figure 11) containing two 4-nitro-1,2,3-benzoxa-diazole molecules for the selective detection of Hg2+ in CH3CN/HEPES (1:9, v/v). Sensor 31 showed a fluorescence enhancement at 530 nm upon addition of Hg2+ with the sensitivity limit of 27 nM. The binding stoichiometry of 31-Hg2+ complex was 1:1 determined by Job’s plot and ES-MS. Sensor 31 was applied to monitor exogenous Hg2+ in living HeLa cells. Furthermore, the complex 31-Hg2+ was applied for the detection of glutathione (GSH) in FBS and human serum.
Madhusmita et al. [62] reported a dual-mode sensor 32 (Figure 11) containing a styrylpyridinium dye for the detection of Hg2+ in mixed methanol-H2O (4:1, v/v) medium. Orange color solution of 32 turned to colorless under daylight, whereas started emitting yellow-color under UV light after adding of Hg2+. The weak fluorescence band of 32 at 590 nm showed a remarkable blue-shift and enhancement at 566 nm with the LOD of 4.8 μM. Complexation of 32 with Hg2+ in 1:1 binding stoichiometry inhibited the PET and increase the conformational rigidity that caused the chelation enhanced fluorescence (CHEF) at 590 nm. Sensor 32 was applied for Hg2+ detection in test paper strips, bioimaging in E. coli DH5-α cells and mimicking INHIBIT molecular logic gate.
Guilin et al. [63] reported a terpyridine-based probe 33 (Figure 11) for detection of Hg2+ in aqueous solution. Probe showed the aggregation-induced emission (AIE) property in mixed DMSO/H2O mixture. In acidic medium (pH = 2), significant fluorescent enhancement was noticed in presence of Hg2+ with the red-shifting from 453 nm to 521 nm. The fluorescence enhancement is due to the complexation of 33 with Hg2+ in 2:1 ratio followed by coordination-triggered self-assembly of 33. Additionally, probe displayed highly efficient removal of Hg2+ ions from solution by rapid precipitation. In another approach, the triphenylamine (TPA) based NIR fluorescent sensor 34 was developed for the sensing of Hg2+. Sensor 34 (Figure 11) showed AIE properties with the red-emitting fluorescence at 639 nm in DMSO/H2O (1:99 v/v) mixed media. Sensor 34 is weakly emissive in 80% H2O-DMSO mixed solvent, but with the addition of Hg2+ caused significant fluorescence enhancement with the spectral shift from 600 nm to 639 nm. The strong fluorescence appeared due to the Hg2+-directed aggregation of 34 with the sensitivity limit of 30 nM. Sensor 34 was applied for the bio-imaging in HepG-2 cells [64].
Hai-Ling et al. reported a Cu(II)-based three-dimensional zwitterionic MOF and then functionalized with carboxyfluorescein labeled thymine-rich (T-rich) DNA 35 for the sequential detection of Hg2+ and biothiols. The non-fluorescent hybrid MOF 35 showed fluorescence enhancement at 518 nm due to the formation of hairpin-like T-Hg2+-T structure with the sensitivity limit of 3 nM. The formation of rigid complex, the MOF is separated that recovered the fluorescence of dye. This MOF based sensing approach was applied on the environmental water and serum samples for Hg2+ and homocysteine recovery [65].
İnal et al. [66] reported a salicylaldehyde derived sensor 36 (Figure 13) for the determination of Hg2+, Zn2+, and Cd2+ in ethanol-aqueous medium. The formation of 36-Hg2+, 36-Zn2+, and 36-Cd2+ complexes resulted significant fluorescence enhancement at 491, 452, and 474 nm, respectively. Sensor 36 formed complexes with Hg2+ and Zn2+ in 2:1 ratio whereas with Cd2+ in 1:1 ratio. Sensor 36 showed LOD of 270, 750, and 600 nM towards Zn2+, Hg2+, and Cd2+, respectively. In another work, the quinolone-based sensor 37 (Figure 13) was introduced for the detection of Hg2+ with the fluorescence method. In presence of Hg2+, the weakly emissive 37 at 463 nm undergoes large fluorescence enhancement at 490 nm, and the fluorescent color changed from faint blue to green [67]. The sensing mechanism was attributed to complex formation between 37 and Hg2+ which inhibited the PET and the excited-state intramolecular proton-transfer (ESIPT). The detection limit of Hg2+ is 2.1 nM. The binding stoichiometry between 37 and Hg2+ is 1:1 performed by job’s plot. Sensor 37 gives the reversible response with the addition of NaBH4. In addition, sensor 37 showed selective changes in the presence of Cu2+.
Xiao et al. [68] reported the boron dipyrromethene (BODIPY) based monomeric 38 and polymeric sensors (39 and 40) for the detection of Hg2+ in DMF/buffer (8:2, pH = 7.0) (Figure 13). Emission band of 38 at 529 nm was enhanced after addition of Hg2+ due to the complexation-induced inhibition of PET with a sensitivity limit of 2.40 μM, and also the color of sensor solution turned from orange to orange-green. Similar to 38, the polymeric sensors 39 and 40 also showed high selectivity towards Hg2+, and their fluorescence enhanced respectively at 621 and 614 nm. The LOD of sensors 39 and 40 to Hg2+ was estimated as 2.86 μM and 0.22 μM, respectively. The polymeric sensors 39 and 40 also showed the colorimetric response from colorless to pink after Hg2+ addition. These low cytotoxicity sensors 38–40 showed good cell permeability and applied successfully to monitor intracellular Hg2+ in live A549 cells and zebrafish.
Rhodamines are extensively applied for the designing of fluorescent turn-on sensors, where the colorless and non-fluorescent ring-closed spirolactam form turned to ring-opened form upon interaction with target analyte that caused significant fluorescent enhancement and color change from colorless to an intense color. The complexation-promoted ring-opening of rhodamines is widely used for the designing of many Hg2+ selective fluorescent turn-on sensors. With some exceptions, majority of the sensors discussed here showed dual-mode chromo-fluorogenic response but the fluorescence changes of the sensors are discussed because of their high sensitivity than the UV–vis method with possible application in bioimaging. The rhodamine B based fluorescent organic nanoparticles (FONs) 41 (Figure 14) was prepared via the reprecipitation technique. Upon addition of Hg2+, the fluorescence of 41 was enhanced at 532 nm (λexc = 480 nm) due to the chelation-enhanced fluorescence (CHEF) phenomenon that open the spirolactum ring. Sensor 41 with the LOD of 8.619 nM was successfully applied to quantify Hg2+ in environmental samples (tap and river water) and for intracellular Hg2+ imaging [69]. With the spirolactum ring opening mechanism, several Hg2+ selective fluorescent turn-on sensors were reported. The polyacylamide-fluorescein based sensor 42 was reported for the fluorescent turn-on sensing of Hg2+ (λem = 515 nm, λex = 460 nm) in PBS buffer (pH = 7.0) [70]. Sensor 42 (Figure 14) showed turn-on fluorescent response to Hg2+ due to the complexation-induced opening of spirolactum ring with the detection limit of 0.4 nM. Sensor 42 showed biological compatibility and cell permeability and successfully applied for turn-on fluorescent determination of Hg2+ both in aqueous samples (lake and tap water) and living cells.
Kaijie et al. [71] reported the rhodamine-based sensor 43 (Figure 14) for the selective detection of Hg2+ in CH3CN-HEPES buffer (1:9, v/v). After addition of Hg2+, sensor 43 showed fluorescence enhancement at 580 nm due to the coordination between 43 and Hg2+ in 2:1 binding stoichiometry followed by opening of rhodamine spirolactam ring. In addition, the sensor 43 showed colorimetric response for the detection of Cu2+. Heng et al. [72] reported a diarylethene and triazole-linked rhodamine B based sensor 44 (Figure 14) for the recognition of Hg2+ in DMSO (λex = 520 nm, λem = 606 nm). Sensor 44 showed a 88-fold fluorescence enhancement at 606 nm with the addition of Hg2+ due to the complexation-induced opening of the rhodamine-spirolactam ring. This sensor showed a detection limit of 0.13 µM and applied to mimic the INHIBIT logic gate by taking Hg2+ and TFA as two molecular inputs.
Jin et al. reported a near-infrared fluorescent sensor 45 (Figure 15) for the selective detection of Hg2+ in HEPES buffer (10 mM, pH = 7.4, containing 20% CH3CN), where the thiosemicarbazide moiety served as a recognition site [73]. Sensor 45 showed the potential response towards Hg2+ by absorption and fluorescence spectra with the detection limit as low as 1.5 nM with fast response times (3 min). Sensor 45 showed fluorescence enhancement at 691 nm with the large Stokes shift (78 nm), while in the absorption spectra, sensor gives the intense absorption at 613 nm after binding with Hg2+ in 1:1 stoichiometry leading to the color change from colorless to dark blue was observed. Sensor 45 also applied as an efficient organelle-targeting sensor for Hg2+ in mitochondria of living cells imaging. In another work, the same sensor 45 was applied for the sensing of Hg2+ in in HEPES buffer solution (10 mM, pH 7.4, containing 50% EtOH [74]. Sensor 45 showed the specific fluorescence enhancement at 664 nm (λex = 590 nm) with large Stokes-shift after addition of Hg2+ with the fluorescent color change from colorless to deep red. Sensor also showed the colorimetric response with changing the color from colorless from dark blue with naked-eyes. The determined LOD for Hg2+ is 1.87 ppb. Mechanism of colorimetric and fluorescence response were explained by desulfurization-cyclization reaction promoted by mercury ions, resulting in the formation of spirolactum ring-opening products. Sensor 45 was also applied in different real water samples.
Asif et al. [75] reported a water soluble p-sulphonatocalix[4]arene derived sensor 46 appended with a rhodamine dye for the detection of Hg2+ in aqueous medium (Figure 15). Sensor gives spectral changes after addition of Hg2+ with ‘turn-on’ fluorescent response at 574 nm with the specific color change from colorless to pink. The detection limit for Hg2+ sensing was 3.55 × 10⁻¹³ mL−1. The sensing mechanism was explained by inhibition of PET and the fluorescence enhanced due to chelation-enhanced fluorescence (CHEF) after forming a complex 46-Hg2+ in 1:1 binding stoichiometric. Zifan et al. [76] reported a sensor 47 (Figure 15) containing conjugated dyad quinolone-benzothiazole and rhodamine for the ratiometric detection of Hg2+ in DMF-H2O (7/3, v/v). Upon excitation at 390 nm, the emission band at 504 nm was decreased with the addition of Hg2+, while the rhodamine emission intensity at 613 nm was gradually increased due to the FRET with the sensitivity limit of 0.2 µM (Figure 16). In this process, the conjugated dyad serve as a donor and the rhodamine as an acceptor. Sensor 47 was also successfully applied in living cells. In addition, significant color change from colorless to pink attributed by Hg2+ induced by the opening of spirolactum ring.
Saswati et al. [77] reported a rhodamine coupled copillar[5]arene sensor 48 (Figure 17) for the selective sensing of Hg2+ ions in CH3CN medium. Sensor 48 was non-fluorescent, while showed strong fluorescence enhancement at 573 nm with the addition of Hg2+, and the color changed from colorless to pink due to the complextion-induced spirolactam ring opening mechanism. Sensor 48 formed a complex with Hg2+ in 1:1 stoichiometry, and can be applied to detect Hg2+ down to 28.5 nM. Jian-Peng et al. [78] reported a supramolecular sensor 49 via host–guest inclusion complexation between the host rhodamine hydrazone functionalized pillar[5]arene and the guest bis-pyridinium derivative (Figure 17). Sensor 49 showed both chromogenic and fluorogenic for the detection of Hg2+ in DMSO/H2O (6:4, v/v). The absorbance and fluorescence respective at 562 and 585 nm was enhanced with the addition of Hg2+ due to the complexation-induced opening of spirolactam ring. The estimated LOD with the UV–vis and fluorescence methods were 4.07 × 10⁻⁷ M and 1.69 × 10⁻⁸ M, respectively. In addition, the inductively coupled plasma data supported the ability of sensor to remove Hg2+.
Jiwen et al. [79] reported a rhodamine B based sensor 50 (Figure 17) for the detection of Hg2+. Sensor was synthesized by combining rhodamine B fluorophore with the thiophene-triazole unit as an ionophore. With the addition of Hg2+, sensor 50 showed significant fluorescence enhancement at 585 nm and also the absorbance increased at 560 nm that turned the colorless solution of 50 in to red. With high sensitivity, the fluorescence enhancement of 50 can be applied to detect Hg2+ down to 16 nM. Sagar et al. [80] reported the sensor 51 (Figure 17) containing two rhodamine units linked with 2,6-pyridinedicarboxaldehyde for the selective detection of Hg2+ in DMSO:H2O (1:1; v/v). After addition of Hg2+, the absorption band at 530 nm enhanced significantly with a visual color change from colorless to pink. While in emission spectra, new fluorescence band appeared at 562 nm due to the conversion of closed form of spirolactum ring of rhodamine to its ring opened form on both side of pyridine ring. The detection limit was obtained as 26 nM. Sensor 51 was applied for the real water samples for practical application.
Zixiang et al. [81] reported a rhodamine 6G based sensor 52 (Figure 18) for the selective detection of Hg2+ in DMSO/H2O (7/3, v/v). The non-fluorescent sensor showed a significant fluorescence enhancement at 581 nm after addition of Hg2+. In UV–vis spectra, the absorption band at 538 nm become stronger after addition of Hg2+ with the colorimetric response from colorless to red. The hydrogel of 52 was also prepared and applied for the reversible sensing of Hg2+. The sensing mechanism was described by the blocking of PET process upon complexation in 1:1 stoichiometry and the rigidity of the sensor promotes to the chelation-enhanced fluorescence (CHEF) effect. The detection limit of probe for Hg2+ detection is 14.9 nM. Yuesong et al. [82] have reported a novel rhodamine–naphthalene derivative 53 (Figure 18) for the Hg2+ detection in CH3CN-H2O (7/3, v/v). Absorption and emission peak of 53 enhanced respectively at 554 and 604 nm upon addition of Hg2+. Sensor 53 is non-fluorescent due to the spirolactam structure of rhodamine moiety; however, spirolactam ring was opened in presence of Hg2+, and give the colorimetric and fluorescent response (Figure 19). The LOD of sensor 53 for Hg2+ detection are 0.12 μM and 0.38 μM by using absorption and emission analysis, respectively. Sensor 53 was also applied for the test strips and biosensing applications. Guohua et al. [83] have reported a triazole-rhodamine conjugate 54 (Figure 18) for the selective detection of Hg2+ in DMF/H2O (1:1, v/v, Tris-HCl buffer, pH = 7.4). Free rhodamine sensor showed no fluorescence. However, the complexation of 54 with Hg2+ in 2:1 stoichiometry, the emission enhanced at 557 nm with the color changed from colorless to pink due to the spirolactam ring opening mechanism. The calculated LOD is 1.61 nM. UV–vis spectra also support the same process by exhibiting absorbance band at 563 nm. The Hg2+ detection by sensor 54 was applied for fluorescence imaging in HeLa cells. In another approach, Zhao et al. [84] reported a ferrocenyl containing rhodamine B based sensor 55 (Figure 18) for the detection of Hg2+ in H2O/THF (4:1, v/v). Sensor 55 showed fluorescence off-on response at 590 nm with the addition of Hg2+ due to the formation of a complex in 1:1 stoichiometry. Sensor 55 showed a low detection limit of 16 nM and fast response time (<3 min). Mechanism of Hg2+ detection is attributed by desulfurization annulation that triggers the spirolactam ring-opening. Sensor 55 was applied for monitoring of intracellular Hg2+ ions in living cells.
Zhong et al. [85,86] have reported three rhodamine 6G derivative 56–58 (Figure 20) for the fluorescent turn-on sensing of Hg2+ in DMSO/H2O (7:3, v/v). Because of the complexation-induced spirolactam ring opening, the weakly emissive 56, 57, and 58 showed significant fluorescence enhancement respectively at 582, 578, and 560 nm. The sensors 56, 57, and 58 showed the LOD of 13.4, 15.6, and 16.1 nM respectively for Hg2+. In addition, the absorption of 56, 57, and 58 enhanced respectively at 536, 537, and 534 nm leading to the naked-eye detectable color change from colorless to pink. Recently, Wei et al. [87] applied the fluorescent sensor 59 (Figure 20) encapsulated in the hydrogel microsphere for the detection of Hg2+ by using a microfluidic device. The non-fluorescent sensor 59 showed fluorescence enhancement with the color change to red upon addition of Hg2+. Sensor 59 showed a reversible response with EDTA and KI. The limit of detection for Hg2+ is 120 nM. Hydrogel microsphere probe was also applied for the detection of Hg2+ in real water samples.
Xuliang et al. [88] developed a dansyl-peptide based Hg2+ selective sensor (60, dansyl-Glu-Cys-Glu-Trp-NH2). Sensor 60 showed two emission maxima at 337 and 550 nm due to the tryptophan and dansyl fluorophores. Addition of Hg2+ caused chelation-induced fluorescence enhancement at 550 with a blue-shift to 505 nm, and the FRET from tryptophan (donor) to dansyl (acceptor) caused quenching at 337 nm. Sensor 60 can be applied to detect Hg2+ down to 23.0 nM. Sequentially, the in situ generated 60-Hg2+ complex was applied for the sensing of biothiols. The lanthanide-complexes of Tb3+ are also applied for the fluorescent sensing of Hg2+. For example, the ratiometric sensor 61 (Figure 21) based on the lanthanide coordination polymers (CPs) between Tb3+, guanine monophosphate (GMP) and luminol was developed for the detection of Hg2+ [89]. The addition of Hg2+ leads to the decrease of Tb3+ luminescence at 548 nm due to the higher coordination between Hg2+ and GMP, which inhibits energy transfer from GMP to Tb3+. While, the fluorescence of luminol at 430 nm increased due to the aggregation-induced emission phenomenon. The ratiometric response of 61 for Hg2+ can be detected down to 1.3 nM. Sensor 61 was successfully used for the determination of Hg2+ in tap water.
Peng et al. [90] reported a dansyl based sensor 62 (Figure 21) for the fluorescence turn-on detection of Hg2+ in HEPES buffer. The emission of 62 at 545 nm was weak based on a single dansyl group. The formation of a complex 62-Hg2+ in 2:1 stoichiometry resulted conformational adjustment that reduced the distance between two dansyl groups and formed the dansyl dimer (Figure 22). The monomer-excimer mechanism resulted significant fluorescence enhancement at 515 nm with the sensitivity limit of 22.65 nM. Muzey et al. [91] reported a naphthalimide-sulfamethizole conjugated sensor 63 (Figure 21) for the ratiometric detection of Hg2+ in DMSO/HEPES medium (1:99, v/v). The strong fluorescence from the monomeric form of 63 at 390 nm was quenched and a new band appeared at 483 nm due to the complexation-induced formation of excimer. Sensor 63 formed a complex with Hg2+ in 2:1 ratio that bring the naphthalimide close together to form the excimer. Sensor 63 showed LOD of 14.7 nM, and capable to quantify Hg2+ concentration in real water samples. Tapashree et al. [92] reported a pyrene-hydroxyquinoline conjugated azine based Schiff base 64 (Figure 21) for the selective detection of Hg2+ in ethanol-H2O (9:1 v/v) medium. The absorption bands of 64 at 240 and 290 nm were enhanced with the appearance of a new band at 450 nm upon addition of Hg2+. The color also changed from lemon yellow to golden yellow attributed to deprotonation (–OH) upon coordination with Hg2+ in 1:1 stoichiometry. The monomeric and excimer emission bands centered at 385 and 447 nm of 64 were enhanced due to CHEF effect that inhibited the C=N isomerization and suppressed the PET. Sensor 64 showed the LOD of 0.22 μM. The monomer-excimer based fluorescent sensor 65 (Figure 21) was reported for the selective detection of Hg2+ in CH3CN/DMSO (99:1) [93]. The pyrene appended calix[4]arene sensor 65 showed monomer emission at 395 nm. Upon complexation with Hg2+ in 2:1 ratio, the excimer emission enhanced at 472 nm with the sensitivity limit of 8.11 nM. Sensor 65 also showed fluorescence response towards Ag+. Using Hg2+ and Ag+ as two chemical inputs, the changes in the fluorescence of 65 was studied to mimic the INHIBITION and IMPLICATION logic gates.
3.1.3. Reaction-Based Chemosensors
Chemodosimeter, an irreversible reaction based detection approach, where the probe contains a reactive site that interacts with the target analyte and formed a new product that emits differently from the original probe molecule. In compared to the reversible fluorescent sensors, the reaction-based fluorescent sensors showed better selectivity and specificity due to the structural changes occurred upon chemical reactions with the target analyte. The 7-hydroxycoumarin-derived carbonothioate-based sensor 66 (Figure 23) was designed and synthesized by Xiwei et al. [94] for the detection of Hg2+ at the maximum emission wavelength 455 nm in water medium. Upon interaction with Hg2+, sensor 66 showed a large fluorescence enhancement because of the strengthening of the intramolecular charge transfer (ICT) due to the Hg2+ directed hydrolysis of 66 to form HgS and phenol. The sensor 66 showed a LOD of 7.9 nM. Sensor 66 was successfully applied to detect Hg2+ in different water samples (river water), living cells and in zebrafish. With similar sensing mechanism, the multi-analytes selective chemodosimeter 67 (Figure 23) based on naphthalene fluorophore was developed for the rapid detection of Hg2+, hydrazine and H2S in C2H5OH [95]. This probe possesses multiple reactive groups phenyl thiobenzoate, carbon-carbon double bond α,β-unsaturated ketone for the detection of Hg2+, H2S and hydrazine, respectively (Figure 24). With Hg2+, the phenyl thiobenzoate detached from 67 and formed HgS and phenol that resulted in the fluorescence quenching at 580 nm. The Hg2+ sensitivity limit of 67 is 1.10 μM, and applied for the detection of Hg2+ in paper test strips and environmental water samples (seawater, tap water, and mineral water). In another work, the naphthalene derived probe 68 (Figure 23) was introduced for the selective chemodosimetric detection of Hg2+ in DMSO/H2O (1:3, v/v) [96]. After addition of Hg2+, the fluorescence intensity enhanced at 444 nm and 644 nm due to desulfurization reaction of 68 leading to the formation of HgS and phenol. The probe 68 showed a LOD of 48.79 nM for Hg2+, and applied successfully for quantifying Hg2+ in various environmental and beverages samples. In addition, probe 68 was applied for the detection of hydrazine.
Zhixiu et al. [97] synthesized a coumarin based sensor 69 (Figure 23) with the conjugation of thiourea for turn-on detection of Hg2+ in EtOH/H2O (2:8, v/v) over a broad pH range of 1–11. Addition of Hg2+ to the sensor 69 solution induced a hypsochromic shift of the UV–vis absorption band at 360 nm to 340 nm. Additionally, a gradual enhancement in the fluorescence emission intensity was observed at 475 nm with the detection limit of 1.46 × 10⁻⁷ M. The sensing mechanism of probe 69 for fluorescent detection of Hg2+ ion is proposed as weakly fluorescent probe 69 readily binds with Hg2+ ion due to the strong interaction between sulphur atom and thiophilic Hg2+ ion. Then, a desulfurization and cyclization process occurred to form strong fluorescence. Sensor 69 was applied in real waste water sample for detecting Hg2+. The coumarin-based ratiometric fluorescent probe 70 (Figure 23) was reported for the sensing of Hg2+ ion in ethanol and HEPES buffer (1:9, v/v) medium [98]. Probe 70 was synthesized by the catalytic reaction between coumarin-red dye and DL-dithiothreitol. Probe showed two characteristic emission band at 495 nm and 600 nm, while addition of Hg2+, the band at 495 nm was disappeared and the second band at 600 nm was significantly enhanced. The detection limit of probe for Hg2+ is 1.6 nM. The DL-dithiothreitol moiety of 70 serve as the recognition receptor for Hg2+. After recognition, the DL-dithiothreitol moiety detached from 70 and formed the α,β-unsaturated ketone. This chemodosimeter based probe was applied for the detection of Hg2+ ion in real water sample, and in living cells and zebrafish.
The fluorescent probe 71 (Figure 23) was developed by the reaction of 6-hydroxy-2-naphthaldehyde and dimethylcarbamothioic for the detection of Hg2+ in aqueous medium [99]. After addition of Hg2+, the fluorescence of 71 was enhanced at 443 nm due to the Hg2+-catalyzed desulfurization reaction to form HgS and 6-hydroxy-2-naphthaldehyde. The LOD of 71 for Hg2+ was calculated to be 39.28 nM. Probe was applied for the detection of Hg2+ in test paper strips and in real water samples. Probe 71 also showed selective fluorescence response for the detection of H2S. The chemodosimetric probe 72 (Figure 23) based on perylene diimide dye was designed for the detection of Hg2+ in THF-H2O (1:9, v/v) [100]. Highly fluorescent 72 showed a significant fluorescence quenching at 667 nm upon interaction with Hg2+, where the butynoxy group serve as the reactive site for Hg2+ detection. The LOD of 60 nM and 33 nM was determined by UV–vis and emission methods, respectively. Sensor were successfully applied detection of Hg2+ in blood serum and urine and bioimaging in MG-63 cells. The thioxothiazolidin-coumarin based chemodosimeter 73 (Figure 23) was introduced for the selective sensing of Hg2+ in HEPES-DMSO (99/1, v/v) [101]. After interaction with Hg2+, the emission band at 630 nm was blued-shifted and enhanced significantly at 580 nm. Remarkable changes were obtained in absorption at 530 nm with decreasing intensity and appearance of a new band at 485 nm, and also the color changed from dark to light pink. The detection limit of Hg2+ was estimated to be 15.6 μM and 15.1 μM by absorbance and fluorescence methods, respectively. Sensing of Hg2+ by sensor 73 is based on the desulfurization reaction of thiocarbonyl to carbonyl, which was supported by 13C NMR and HRMS-ESI analyses. Probe 73 was applied for detecting Hg2+ in living cells by bioimaging experiment.
The phenothiazine derived chemodosimetric probe 74 (Figure 25) containing dithioacetal unit was applied for the detection of Hg2+ [102]. Upon interaction with Hg2+, the UV–vis absorption band of 74 at 320 nm was shifted to 390 nm with the appearance of yellow color, while the weakly fluorescent 74 showed significant fluorescence enhancement with a remarkable red-shift from 455 nm to 610 nm due to intramolecular charge transfer process (ICT). With high sensitivity, the fluorescence change of 74 was applied to detect Hg2+ down to 21.2 nM. Sensor 74 was applied successfully to detect Hg2+ in drinking water and live cells. With the similar sensing mechanisms, the Hg2+ selective fluorescent probes 75–79 were reported. The AIE active chemodosimeter 75 (Figure 25) was reported for the fluorescent turn-on sensing of Hg2+ in PBS buffer (10 mM, pH 7.4, containing 1% DMSO). Sensor 75 showed a weak emission at 475 nm. With the Hg2+ directed hydrolysis of 75 at the dithioacetal unit to aldehyde enhanced the ICT effect and also restricted the intramolecular rotations that amplified the fluorescence at 495 nm based on AIE effect. The detection limit of sensor 75 for Hg2+ is 36 nM. Sensor 75 was applied for the detection of Hg2+ in real water sample and in living cell imaging [103].
Zhonglong et al. [104] reported a camphor based fluorescent turn-on probe 76 (Figure 25) for the detection of Hg2+ with large Stokes shift of 153 nm in 99% PBS buffer medium. Probe 76 exhibited a maximum absorption at 322 nm that reduced remarkably while a new band emerged at about 355 nm after adding Hg2+. With high sensitivity, the fluorescence of 76 was enhanced at 518 nm upon interaction with Hg2+. The 1,3-dithiane unit of the 76 can be deprotected into a formyl group under the function of Hg2+, thus the probe 76 is transformed into compound 77-CHO. The detection limit of 76 is 19.3 nM for Hg2+. Sensor was applied in cell imaging experiment and to quantify Hg2+ in environmental water samples (tap, distilled, and lake water). The bithiophene-based sensor 77 (Figure 25) was reported for the ultra-rapid detection of Hg2+ in aqueous medium with the fluorescent color changed from colorless to blue under UV light irradiation [105]. Significant enhancement in emission of 77 at 470 nm was observed due to the Hg2+ induced desulfurization reaction that strengthened the ICT upon conversion of bithiophene moiety in to aldehyde group (Figure 26). With 77, the Hg2+ concentration can be detected down to 19 nM. Sensor 77 also showed selective changes in the absorption by quenching of absorbance at 334 nm and appearance of a new band at 370 nm after the addition of Hg2+. The fluorescence changes of 77 was applied to quantify Hg2+ detection in water, seafood as well as human urine samples. In addition, Sensor 77 was applied for Hg2+ detection by developing test paper strips and performing bio-imaging in HeLa cells.
Meiju et al. [106] reported a fluorescent sensor 78 (Figure 25) based on the naphthalimide derivative for the detection of Hg2+ in PBS buffer. In UV–vis absorption, the sensor 78 showed blue-shift from 461 to 417 nm with Hg2+. The fluorescence emission enhanced at 510 nm with increasing concentration of Hg2+. In the presence of Hg2+, the sensor 78 reacted specifically with the mercury ion to produce an aldehyde and emitted strong fluorescence, and the yellow color of the solution turned to light green. The detection limit for Hg2+ was found to be 40 nM. The sensor 78 was successfully applied to the living cell imaging to detect Hg2+ in PC-12 cells. The tetraphenylethylene (TPE) derivative 79 (Figure 25) reported by Long et al. showed aggregation-induced emission features in THF/water mixtures. TPE derivatives maintain AIE activities after grafting on fibers, however, the strong fluorescence emission at 477 nm was gradually weakened after Hg2+ addition due to Hg2+-initiated cleavage of dithioacetal moieties. The LOD reached as low as 20 nM Hg2+. In addition, the electrospun fibrous strips with grafted TPE and dithioacetal moieties are designed for the detection of trace Hg2+ with the visual change of color strip from green to blue [107].
Abani et al. [108] reported a trinuclear Zn(II)/Cd(II) Schiff base complexes 80 and 81 for the detection of Hg2+ in aqueous medium via chemodosimetric approach (Figure 27). Two absorption maxima at 388 nm and 390 nm were red-shifted and the colorless solution turned to distinct yellow. Complexes showed emission maxima at λem ∼ 461 nm (80) and 464 nm (81) were red-shifted to 475 and 472 nm, respectively and undergo considerable decrease in fluorescence intensity. The LOD estimated for complexes 80 and 81 to detect Hg2+ were 1.11 and 1.89 μM, respectively. The most probable chemodosimetric mechanism explained via the cleavage of the imine bond through hydrolysis. Results were confirmed by different spectroscopic techniques including 1H NMR titration.
Chunqing et al. [109] reported the monomeric BODIPY based Schiff bases 82 and 83, and the polymeric derivative 84 for the fluorescent turn-on sensing of Hg2+ and Fe3+ in DMF/H2O (1:1, v/v) (Figure 27). Both the selective metal ions hydrolysed the imine linkage and formed the original BODIPY aldehyde. The emission and absorption peak of the probes were blue-shifted and enhanced. The emission of 82, 83, and 84 at 549, 550, and 559 nm was blue-shifted and enhanced respectively at 523, 529, and 528 nm. The probes 82, 83, and 84 showed the LOD of 0.21, 0.63, and 0.19 µM respectively for Hg2+. The polymeric probe 84 showed high sensitivity than the probes 82 and 83. Similarly, the absorption of 82, 83, and 84 at 520, 545, and 548 nm was blue-shifted and enhanced respectively at 490, 499, and 501 nm.
3.2. Colorimetric Sensors
The colorimetric sensors provide naked-eyes detectable color change for the cost-effective of target analytes (Table 3). The ruthenium derived complex 85 (Figure 28) was reported for the colorimetric detection of Hg2+, where the coordination of mode of Ru2+ to the C-atom is changed to S-atom with the addition of Hg2+ (Figure 29). The Hg2+-prompted switch in coordination mode in 85 caused a color from dark red to light yellow, and the absorption band at 506 and 730 nm are gradually quenched with the sensitivity limit of 21 nM [110]. With the similar approach, the ruthenium complex based sensor 86 (Figure 28) was reported for the selective colorimetric detection of Hg2+. The color of 86 turned from red to yellow, due to the formation of a new low energy band at 410 nm, while pre-existed band at 503 declined with the addition of Hg2+. The detection limit of 86 for Hg2+ is 0.053 μM. Job’s plot confirmed the binding stoichiometry of sensor 86-Hg2+ complex is 1:1 mode. For the practical applicability, the sensor was grafted into a polymer membrane and applied for the colorimetric detection of Hg2+ [111].
The p-toluenesulfonate salt of merocyanine dye 87 (Figure 28) was reported for the colorimetric sensing of Hg2+ in HEPES buffer. Sensor 87 showed two absorption band at 390 nm and 530 nm. After complexation with Hg2+, both the absorption bands showed decrease in the intensity with the color change from pink to colorless easily detected by naked eyes. Sensor showed a micromolar detection limit of 0.27 μM and was also applied for the visual detection of Hg2+ by using paper test strip of 87 [112]. The pyrazole-based colorimetric sensor 88 (Figure 28) was developed for the detection of Hg2+ in semi-aqueous medium. The absorption band of 88 at 447 nm was red-shifted to 519 nm with a noticeable color change from yellow to pink upon complexation with Hg2+ in 2:1 stoichiometry. Sensor 88 showed LOD of 4.73 × 10⁻⁷ M, and was applied successfully to quantify Hg2+ in various environmental samples [113]. In another work, the azo dye based chromogenic sensor 89 (Figure 28) was studied for selective detection of Hg2+ in DMSO-H2O (4:1 v/v) medium. Sensor 89 showed absorption at 502 nm due to strong intermolecular charge transfer (ICT) transition with the solution color as reddish-pink. Addition of Hg2+ decreased the absorbance at 502 nm and blued-shifted to 395 nm. The complex formation between sensor 89 and Hg2+ restricted the ICT that caused blue-shift in absorbance, and the solution become colorless. Sensor 89 formed complex with Hg2+ in 1:1 stoichiometric through the salicylaldehyde unit and the complexation reversed with the addition of F- [114].
The conjugated Schiff base receptor 90 (Figure 30) showed colorimetric response for the detection of Hg2+ in buffer/DMF (98:2) [115]. Only Hg2+ showed spectral and color changes from pale yellow to orange. The absorption band at 400 nm was increased with decreasing of 90 band at 350 nm due to the formation a complex 90-Hg2+ in 2:1 stoichiometry. The limit of detection of probe for Hg2+ is 0.11 µM, and applied to quantify Hg2+ in real water samples.
Thirumalai et al. [116] reported two solid templates, mesoporous silica monoliths (MSMs) and mesoporous polymer monoliths (MPMs), immobilized with the amphiphilic chromo-ionophoric 91 (Figure 30) to develop solid-state sensors for naked-eye colorimetric sensing of Hg2+. Upon interaction with Hg2+, the solid-state sensors showed color transition from light orange to deep red due to the metal to ligand charge transfer (MLCT). The LOD for 91-MPM and 91-MSM sensors was estimated as 0.100 and 0.180 μg/L, respectively. Both the sensors applied successfully in real sample analysis to quantify Hg2+ concentrations. The solid-state sensor 92 (Figure 30) based on rhodamine B hydrazide derivative mobilized in mesoporous silica monolith was developed for the ultra-trace colorimetric detection of Hg2+ from aqueous medium [117]. The absorption of 92 was changed at 567 nm after each addition of Hg2+, and the light pink color turned to deep violet. Sensor 92 can be used to detect Hg2+ down to 0.61 µg/L, and applied successfully for quantifying Hg2+ ion in real water samples (ground, lake, and river water).
Hyokyung et al. [118] introduced a Pt complex 93 (Figure 30) coordinated with the ligands 1,2-bis[bis(pentafluorophenyl)phosphino]ethane) and 1,3-dithiole-2-thione-4,5-dithiolate for the selective colorimetric detection of Hg2+ in CH3CN/H2O (1:1, v/v). Complex 93 showed Hg2+ selective color change from yellow to vivid red due to the interaction of Hg2+ at >C=S, and also the absorbance at 448 nm of 93 was red-shifted to 523 nm. The colorimetric sensor 94 (Figure 30) based on the anthracene moiety was developed for the detection of Hg2+ in HEPES buffered CH3OH:H2O (7:3) medium. Sensor 94 showed absorbance at 414 nm was disappeared with the formation of a new red-shifted band at 498 nm after the addition of Hg2+. The complexation-induced spectral change caused due to ICT also showed naked-eye detectable color change from yellow to pink. With sensor 94, the concentration of Hg2+ can be detected down to 220 nM. Sensor 94 was applied for the various practical applications including naked-eyes detection of Hg2+ using paper strips and solid silica gel, and also to quantify Hg2+ concentration in real water samples [119].
The benzopyran based colorimetric sensor 95 (Figure 31) was reported for the visual detection of Hg2+ ion in CH3CN/H2O medium (1:1, v/v). In this sensor, the dicyanomethylene-4H-chromene serve as a fluorophore whereas the dithiadioxa-monoaza crown ether as the recognition unit. Sensor 95 absorption at 517 nm showed hypsochromic shift with Hg2+ and a new band generated at 415 nm. Color of probe is also changed from rose red to yellow detected by naked eyes. Color and spectral changes mainly attributed by the blocking of ICT process. In fluorescence study, the strong emission peak at 645 nm was significantly quenched with Hg2+ due to the complex formation of 95-Hg2+ in 1:1 ratio. The detection limit is 0.14 μM. For practical applications, sensor was applied for Hg2+ detection in real aqueous samples and live cell imaging [120].
Zhang et al. [121] reported chemosensor 96 (Figure 31) based on azobenzene for the selective detection of Hg2+ in HEPES buffered solution. In UV–vis study, the sensor 96 showed characteristic absorbance at 358 and 247 nm respectively due to π–π* and n–π* transitions. After interaction with Hg2+, the π–π* band was suppressed and blue-shifted by 13 nm. Absorption changes arising from the pull–push effect between electron-withdrawing and electron-donating groups of the azobenzene chromophore. The nitrobenzoxadiazole-antipyrine conjugate 97 (Figure 31) was studied for the colorimetric sensing of Hg2+ and CN- in CH3OH: H2O (1: 1, v/v). Addition of Hg2+ evolved new absorption band at 530 nm and band at 465 was red-shifted to 485 nm leading to the color change from pale yellow to pink due to the formation of a charge-transfer complex between probe and Hg2+ in 2:1 stoichiometry. Sensor showed reversibility with Na2S and the LOD of 2.57 × 10⁻⁸ M Hg2+ [122]. The colorimetric sensor 98 (Figure 31) was reported for the detection of Hg2+ and Cu2+ in MeCN-H2O (1:1, v/v). The colorless solution of 98 turned brick-red to the naked eye with the addition of Hg2+ and Cu2+, respectively due to the complexation-induced LMCT. The complexation led to the formation of a new absorption at 470 nm and the quenching of sensor band at 380 nm. The estimated detection limit for Hg2+ is 0.95 nM, and the sensor applied for real samples analyses [123].
The azo-phenylthiourea based receptor 99 (Figure 31) was applied as a colorimetric sensor for Hg2+ in DMSO/H2O (2:1, v/v). Sensor 99 showed an absorption band centered at 365 nm, attributed to ICT of azo skeleton. Interaction with Hg2+ in 1:1 stoichiometry, sensor 99 generated a new ICT band at 280 nm with the significant hypsochromic shift of 85 nm. Sensor 99 showed the lower detection limit of 4.89 μM for Hg2+, and applied for the monitoring of Hg2+ in the real samples [124]. In another work, Gargi et al. reported an azo dye based colorimetric sensor 100 (Figure 31) for the detection of Hg2+ in 9:1 (v/v) aqueous CH3CN. After addition of Hg2+ to the colorless solution of 100 showed a new absorption band at 610 nm that enhance π-delocalization and reduced the energy of π → π* transition leading to the appearance of greenish-blue color. Job’s plot confirmed 1:1 stoichiometry between 100 and Hg2+. The limit of detection was 8.5 μM, and the sensor was applied for the real water analysis [125].
The ninhydrin–thiosemicarbazone based sensor 101 (Figure 31) was developed for the colorimetric sensing of Hg2+ in aqueous medium [126]. After complexing with Hg2+ in 1:1 ratio, the absorption band of 101 at 335 nm was shifted to 305 nm without any pH effect, and the solution color turned from yellow to colorless. Addition of strong chelating agent ETDA reversed the color change occurred due to the 101-Hg2+ complex formation in solution. The LOD of 101 for Hg2+ detection was 1 μM. Gurjaspreet et al. [127] prepared an antipyrine based sensor 102 (Figure 31) for the detection of Hg2+ and Fe3+ in DMSO/H2O (8/2 v/v) by UV–vis method. After interaction with Hg2+, the absorption band of sensor at 290 nm was blue-shifted with the evolution of two bands at 255 nm and 292 nm due to the participation of azomethine linkage in the formation of Hg-N bond. The 102 LOD to detect Hg2+ was estimated as 0.10 mM.
4. Conclusions
In this review, we have summarized 102 chromo-fluorogenic chemosensors reported in the year 2020 for the sensing of mercuric ion. Most of the developed sensors are easy-to-prepare, low cost, and showed high selectivity and rapid response. In compared to colorimetric sensors, more focus is given on the development of fluorescent sensors because of the high sensitivity and their utility in monitoring intracellular Hg2+ ions in live cells. The majority of the summarized sensors are based on the well-known sensing mechanisms like PET, ICT, ESIPT, AIE, FRET, and excimer-monomer. The majority of the fluorescent sensors are either turn-off or turn-on, and there is need of more research on the designing of ratiometric sensors for Hg2+. Also, there is need of more attention in the designing of sensors applicable in pure aqueous medium over a wide pH range. Despite high sensitivity, the commercialization of sensors for real-world samples detection required great efforts on improving the sensor performance and also on fabrication methods. Therefore, future research may be focused on integrating the fascinating color change shown by the sensors even at low concentration with smartphone and other portable devices for the on-site, real-time and cost-effective detection of Hg2+. The paper chips, polymeric or other testing strips of sensors may be developed for the detection of Hg2+. The sensing mechanisms should be properly investigated to provide appropriate future directions to optimize the structure and performance for the designing of sensors. The concepts from nano and supramolecular chemistry may also be incorporated in the designing of novel sensors with improve sensing performance and to minimize the interference from other analytes in complex biological samples. We believe this review will provide new directions for designing novel and cost-effective sensors for Hg2+ with improved aqueous solubility, selectivity, and sensitivity.
Author Contributions
Conceptualization: S.K.S. and V.M.N.; Writing—original draft preparation: V.B.; Writing—review and editing, S.K.S. and V.M.N. All authors have read and agreed to the published version of the manuscript.
Funding
This research received no external funding.
Conflicts of Interest
The authors declare no conflict of interest.
References
- Kaur, B.; Kaur, N.; Kumar, S. Colorimetric Metal Ion Sensors—A Comprehensive Review of the Years 2011–2016. Coord. Chem. Rev. 2018, 358, 13–69. [Google Scholar] [CrossRef]
- Patil, A.; Salunke-Gawali, S. Overview of the Chemosensor Ligands Used for Selective Detection of Anions and Metal Ions (Zn2+, Cu2+, Ni2+, Co2+, Fe2+, Hg2+). Inorg. Chim. Acta 2018, 482, 99–112. [Google Scholar] [CrossRef]
- Sahoo, S.K.; Crisponi, G. Recent Advances on Iron (III) Selective Fluorescent Probes with Possible Applications in Bioimaging. Molecules 2019, 24, 3267. [Google Scholar] [CrossRef] [PubMed] [Green Version]
- Wu, D.; Sedgwick, A.C.; Gunnlaugsson, T.; Akkaya, E.U.; Yoon, J.; James, T.D. Fluorescent Chemosensors: The Past, Present and Future. Chem. Soc. Rev. 2017, 46, 7105–7123. [Google Scholar] [CrossRef] [Green Version]
- Sahoo, S.K.; Sharma, D.; Bera, R.K.; Crisponi, G.; Callan, J.F. Iron (III) Selective Molecular and Supramolecular Fluorescent Probes. Chem. Soc. Rev. 2012, 41, 7195–7227. [Google Scholar] [CrossRef]
- Houston, M.C. Role of Mercury Toxicity in Hypertension, Cardiovascular Disease, and Stroke. J. Clin. Hypertens. 2011, 13, 621–627. [Google Scholar] [CrossRef] [PubMed]
- Dufault, R.; Schnoll, R.; Lukiw, W.J.; LeBlanc, B.; Cornett, C.; Patrick, L.; Wallinga, D.; Gilbert, S.G.; Crider, R. Mercury Exposure, Nutritional Deficiencies and Metabolic Disruptions may Affect Learning in Children. Behav. Brain Funct. 2009, 5, 44. [Google Scholar] [CrossRef] [Green Version]
- Jayadevimanoranjitham, J.; Narayanan, S.S. 2,4,6-Trimercaptotriazine Incorporated Gold Nanoparticle Modifiedelectrode for Anodic Stripping Voltammetric Determination of Hg (II). Appl. Surf. Sci. 2018, 448, 444–454. [Google Scholar] [CrossRef]
- Aderinto, S.O. Fluorescent, Colourimetric, and Ratiometric Probes Based on Diverse Fluorophore Motifs for Mercuric (II) ion (Hg2+) Sensing: Highlights from 2011 to 2019. Chem. Pap. 2020, 74, 3195–3232. [Google Scholar] [CrossRef]
- Culzoni, M.J.; de La Peña, A.M.; Machuca, A.; Goicoechea, H.C.; Babiano, R. Rhodamine and BODIPY Chemodosimeters and Chemosensors for the Detection of Hg2+, Based on Fluorescence Enhancement Effects. Anal. Methods 2013, 5, 30–49. [Google Scholar] [CrossRef]
- Yan, Z.; Yuen, M.F.; Hu, L.; Sun, P.; Lee, C.S. Advances for the Colorimetric Detection of Hg2+ in Aqueous Solution. RSC Adv. 2014, 4, 48373–48388. [Google Scholar] [CrossRef]
- Liu, C.; Chen, X.; Zong, B.; Mao, S. Recent Advances in Sensitive and Rapid Mercury Determination with Graphene-Based Sensors. J. Mater. Chem. 2019, 7, 6616–6630. [Google Scholar] [CrossRef]
- Mahato, P.; Saha, S.; Das, P.; Agarwalla, H.; Das, A. An Overview of the Recent Developments on Hg2+ Recognition. RSC Adv. 2014, 4, 36140–36174. [Google Scholar] [CrossRef]
- Chen, G.; Guo, Z.; Zeng, G.; Tang, L. Fluorescent and Colorimetric Sensors for Environmental Mercury Detection. Analyst 2015, 140, 5400–5443. [Google Scholar] [CrossRef]
- Hylander, L.D.; Meili, M. 500 Years of Mercury Production: Global Annual Inventory by Region until 2000 and Associated Emissions. Sci. Total Environ. 2003, 304, 13–27. [Google Scholar] [CrossRef]
- Crisponi, G.; Nurchi, V.M. Metal ion toxicity. Encycl. Inorg. Bioinorg. Chem. 2011, 1–14. [Google Scholar] [CrossRef]
- Andrade, V.; Aschner, M.; Dos Santos, A.M. Neurotoxicity of Metal Mixtures. In Neurotoxicity of Metals; Springer: Berlin/Heidelberg, Germany, 2017; pp. 227–265. [Google Scholar]
- Bjørklund, G.; Dadar, M.; Mutter, J.; Aaseth, J. The Toxicology of Mercury: Current Research and Emerging Trends. Environ. Res. 2017, 159, 545–554. [Google Scholar] [CrossRef]
- Clarkson, T.W.; Magos, L.; Myers, G.J. The Toxicology of Mercury—Current Exposures and Clinical Manifestations. N. Engl. J. Med. 2003, 349, 1731–1737. [Google Scholar] [CrossRef] [PubMed] [Green Version]
- Guzzi, G.; La Porta, C.A. Molecular Mechanisms Triggered by Mercury. Toxicology 2008, 244, 1–12. [Google Scholar] [CrossRef] [PubMed]
- Bjørklund, G.; Crisponi, G.; Nurchi, V.M.; Cappai, R.; Buha Djordjevic, A.; Aaseth, J. A Review on Coordination Properties of Thiol-Containing Chelating Agents Towards Mercury, Cadmium, and Lead. Molecules 2019, 24, 3247. [Google Scholar] [CrossRef] [PubMed] [Green Version]
- Vas, J.; Monestier, M. Immunology of Mercury. Ann. N. Y. Acad. Sci. 2008, 1143, 240–267. [Google Scholar] [CrossRef] [PubMed]
- Crisponi, G.; Nurchi, V.M.; Crespo-Alonso, M.; Toso, L. Chelating Agents for Metal Intoxication. Curr. Med. Chem. 2012, 19, 2794–2815. [Google Scholar] [CrossRef] [PubMed]
- Bakka, A.; Aaseth, J.; Rugstad, H.E. Influence of Certain Chelating Agents on Egress of Cadmium from Cultured Epithelial Cells Containing High Amounts of Metallothionein: A Screening of Cd-Releasing and Toxic Effects. Acta Pharmacol. Toxicol. 1981, 49, 432–437. [Google Scholar] [CrossRef] [PubMed]
- Walker Jr, E.M.; Stone, A.; Milligan, L.B.; Gale, G.R.; Atkins, L.M.; Smith, A.B.; Jones, M.M.; Singh, P.K.; Basinger, M.A. Mobilization of Lead in Mice by Administration of Monoalkyl Esters of Meso-2, 3-Dimercaptosuccinic Acid. Toxicology 1992, 76, 79–87. [Google Scholar] [CrossRef]
- Andersen, O. Principles and Recent Developments in Chelation Treatment of Metal Intoxication. Chem. Rev. 1999, 99, 2683–2710. [Google Scholar] [CrossRef]
- Gersl, V.; Hrdina, R.; Vávrová, J.; Policka, V.; Voglova, J.; Mazurova, Y.; Balgar, J. Effects of Repeated Administration of Dithiol Chelating Agent-Sodium 2, 3-Dimercapto-1-Propanesulphonate (DMPS) on Biochemical and Haematological Parameters in Rabbits. Acta Med. Hradec Kral. 1997, 40, 3–8. [Google Scholar]
- Hurlbut, K.M.; Maiorino, R.M.; Mayersohn, M.; Dart, R.C.; Bruce, D.C.; Aposhian, H.V. Determination and Metabolism of Dithiol Chelating Agents. XVI: Pharmacokinetics of 2,3-Dimercapto-1-Propanesulfonate After Intravenous Administration to Human Volunteers. J. Pharmacol. Exp. Ther. 1994, 268, 662–668. [Google Scholar]
- Aaseth, J.; Jacobsen, D.; Andersen, O.; Wickstrøm, E. Treatment of Mercury and Lead Poisonings with Dimercaptosuccinic Acid and Sodium Dimercaptopropanesulfonate. A Review. Analyst 1995, 120, 853–854. [Google Scholar] [CrossRef] [PubMed]
- Aposhian, H.V. DMSA and DMPS-Water Soluble Antidotes for Heavy Metal Poisoning. Annu. Rev. Pharmacol. Toxicol. 1983, 23, 193–215. [Google Scholar] [CrossRef]
- Bjørklund, G.; Aaseth, J.; Crisponi, G.; Rahman, M.M.; Chirumbolo, S. Insights on Alpha Lipoic and Dihydrolipoic Acids as Promising Scavengers of Oxidative Stress and Possible Chelators in Mercury Toxicology. J. Inorg. Biochem. 2019, 195, 111–119. [Google Scholar] [CrossRef]
- Bozkurt, E.; Gul, H.I. Selective Fluorometric “Turn-off” Sensing for Hg2+ with Pyrazoline Compound and Its Application in Real Water Sample Analysis. Inorg. Chim. Acta 2020, 502, 119288. [Google Scholar] [CrossRef]
- Ergun, E.G.C.; Ertas, G.; Eroglu, D. A Benzimidazole-Based Turn-Off Fluorescent Sensor for Selective Detection of Mercury (II). J. Photochem. Photobiol. 2020, 394, 112469. [Google Scholar] [CrossRef]
- Jiang, J.; Lu, Y.; Liu, J.; Zhou, Y.; Zhao, D.; Li, C. An Acid-Base Resistant Zn-Based Metal-Organic Framework as a Luminescent Sensor for Mercury (II). J. Solid State Chem. 2020, 283, 121153. [Google Scholar] [CrossRef]
- He, Y.; Wang, X.; Wang, K.; Wang, L. A Triarylamine-Based Fluorescent Covalent Organic Framework for Efficient Detection and Removal of Mercury (II) Ion. Dye. Pigment. 2020, 173, 107880. [Google Scholar] [CrossRef]
- Wang, L.; Lou, C.; Duan, S.; Cheng, D.; Wang, A.; Zhao, B.; Zhao, H.; Yin, G.; Zhao, M. Piperazine-tuned Benzimidazole-based Multifunctional Fluorescent Sensor for the Detection of Mercury (II) Ion and pH. Inorg. Chem. Commun. 2020, 119, 108096. [Google Scholar] [CrossRef]
- Mondal, S.; Patra, N.; Nayek, H.P.; Hira, S.K.; Chatterjee, S.; Dey, S. Unusual Absence of FRET in Triazole Bridged Coumarin–Hydroxyquinoline, an Active Sensor for Hg2+ Detection. Photochem. Photobiol. Sci. 2020, 19, 1211–1221. [Google Scholar] [CrossRef]
- Sethupathi, M.; Muthusankar, G.; Thamilarasan, V.; Sengottuvelan, N.; Gopu, G.; Vinita, N.M.; Kumar, P.; Perdih, F. Macrocyclic “Tet a” Derived Colorimetric Sensor for the Detection of Mercury Cations and Hydrogen Sulphate Anions and Its Bio-Imaging in Living Cells. J. Photochem. Photobiol. 2020, 203, 111739. [Google Scholar] [CrossRef] [PubMed]
- Ghosh, T.; Chatterjee, S.; Bhayani, K.; Mishra, S. A Natural Cyanobacterial Protein C-Phycoerythrin as an Hg2+ Selective Fluorescent Probe in Aqueous Systems. New J. Chem. 2020, 44, 6601–6609. [Google Scholar] [CrossRef]
- Nunes, M.C.; dos Santos Carlos, F.; Fuganti, O.; da Silva, L.A.; Ribas, H.T.; Winnischofer, S.M.B.; Nunes, F.S. A Facile Preparation of a New Water-Soluble Acridine Derivative and Application as a Turn-off Fluorescence Chemosensor for Selective Detection of Hg2+. J. Fluoresc. 2020, 30, 235–247. [Google Scholar] [CrossRef]
- Xue, S.; Wang, P.; Chen, K. A Novel Fluorescent Chemosensor For Detection of Mercury (II) Ions Based on Dansyl-Peptide and Its Application in Real Water Samples and Living LNcap Cells. Spectrochim. Acta Part A 2020, 226, 117616. [Google Scholar] [CrossRef]
- Bhaskar, R.; Sarveswari, S. Thiocarbohydrazide Based Schiff Base as a Selective Colorimetric and Fluorescent Chemosensor for Hg2+ with “Turn-Off” Fluorescence Responses. ChemistrySelect 2020, 5, 4050–4057. [Google Scholar] [CrossRef]
- Yu, Y.; Li, G.; Liu, J.; Yuan, D. A Recyclable Fluorescent Covalent Organic Framework for Exclusive Detection and Removal of Mercury (II). Chem. Eng. J. 2020, 401, 126139. [Google Scholar] [CrossRef]
- Cui, W.R.; Jiang, W.; Zhang, C.R.; Liang, R.P.; Liu, J.; Qiu, J.D. Regenerable Carbohydrazide-Linked Fluorescent Covalent Organic Frameworks for Ultrasensitive Detection and Removal of Mercury. ACS Sustain. Chem. Eng. 2019, 8, 445–451. [Google Scholar] [CrossRef]
- Moradi, E.; Rahimi, R.; Safarifard, V. Porphyrinic Zirconium-based MOF with Exposed Pyrrole Lewis Base Site as an Efficient Fluorescence Sensing for Hg2+ ions, DMF small Molecule, and Adsorption of Hg2+ ions from Water Solution. J. Solid State Chem. 2020, 286, 121277. [Google Scholar] [CrossRef]
- Rathod, R.V.; Bera, S.; Maity, P.; Mondal, D. Mechanochemical Synthesis of a Fluorescein-Based Sensor for the Selective Detection and Removal of Hg2+ Ions in Industrial Effluents. ACS Omega 2020, 5, 4982–4990. [Google Scholar] [CrossRef] [PubMed] [Green Version]
- Prabu, S.; Mohamad, S. Curcumin/Beta-Cyclodextrin Inclusion Complex as a New “Turn-Off” Fluorescent Sensor System for Sensitive Recognition of Mercury Ion. J. Mol. Struct. 2020, 1204, 127528. [Google Scholar] [CrossRef]
- Gharami, S.; Aich, K.; Ghosh, P.; Patra, L.; Murmu, N.; Mondal, T.K. A Fluorescent “ON–OFF–ON” Switch for the Selective and Sequential Detection of Hg2+ and I− with Applications in Imaging using Human AGS Gastric Cancer Cells. Dalton Trans. 2020, 49, 187–195. [Google Scholar] [CrossRef] [PubMed]
- Kumar, A.; Kumar, S.; Chae, P.S. A Novel Anthrapyridone Diamine-Based Probe for Selective and Distinctive Cu2+ and Hg2+ Sensing in Aqueous Solution; Utility as Molecular Logic Gates. Dye. Pigment. 2020, 181, 108522. [Google Scholar] [CrossRef]
- Mandegani, F.; Zali-Boeini, H.; Khayat, Z.; Braun, J.D.; Herbert, D.E. Low-Molecular-Weight Gelators as Dual-Responsive Chemosensors for the Naked-Eye Detection of Mercury (II) and Copper (II) Ions and Molecular Logic Gates. ChemistrySelect 2020, 5, 886–893. [Google Scholar] [CrossRef]
- Kumar, P.S.; Elango, K.P. A Simple Organic Probe for Ratiometric Fluorescent Detection of Zn(II), Cd(II) and Hg(II) Ions in Aqueous Solution via Varying Emission Colours to Distinguish One Another. Spectrochim. Acta Part A 2020, 241, 118610. [Google Scholar] [CrossRef]
- Choudhury, N.; Ruidas, B.; Saha, B.; Srikanth, K.; Mukhopadhyay, C.D.; De, P. Multifunctional Tryptophan-Based Fluorescent Polymeric Probes for Sensing, Bioimaging and Removal of Cu2+ and Hg2+ Ions. Polym. Chem. 2020, 11, 2015–2026. [Google Scholar] [CrossRef]
- Elmas, S.N.K.; Dincer, Z.E.; Erturk, A.S.; Bostanci, A.; Karagoz, A.; Koca, M.; Sadi, G.; Yilmaz, I. A Novel Fluorescent Probe Based on Isocoumarin for Hg2+ and Fe3+ Ions and Its Application in live-Cell Imaging. Spectrochim. Acta 2020, 224, 117402. [Google Scholar] [CrossRef] [PubMed]
- Germani, R.; Anastasio, P.; Chiodini, M.; del Giacco, T.; Tiecco, M.; Belpassi, L. Fluorescent Signal Transduction in a Self-Assembled Hg2+ Chemosensor Tuned by Various Interactions in Micellar Aqueous Environment. J. Photochem. Photobiol. 2020, 389, 112276. [Google Scholar] [CrossRef]
- Ngororabanga, J.M.V.; Moyo, C.B.; Tshentu, Z.R. A Novel Multidentate Pyridyl Ligand: A Turn-on Fluorescent Chemosensor for Hg2+ and Its Potential Application in Real Sample Analysis. Spectrochim. Acta Part A 2020, 242, 118651. [Google Scholar] [CrossRef] [PubMed]
- Bu, F.; Zhao, B.; Kan, W.; Ding, L.; Liu, T.; Wang, L.; Song, B.; Wang, W.; Deng, Q. An ESIPT characteristic “Turn-On” Fluorescence Sensor for Hg2+ with Large Stokes Shift and Sequential “Turn-Off” Detection of S2– as well as the Application in Living Cells. J. Photochem. Photobiol. 2020, 387, 112165. [Google Scholar] [CrossRef]
- Liu, Y.; Zhang, J.; Feng, T.; Li, Y. Synthesis, Structure–Fluorescence Relationships and Density Functional Theory Studies of Novel Naphthalimide–Piperazine–Pyridine-Based Polystyrene Sensors for Hg (II) Detection. RSC Adv. 2020, 10, 25281–25289. [Google Scholar] [CrossRef]
- He, H.; Meng, X.; Deng, L.; Sun, Q.; Huang, X.; Lan, N.; Zhao, F. A Novel Benzothiadiazole-Based and NIR-Emissive Fluorescent Sensor for Detection of Hg2+ and Its Application in Living Cell and Zebrafish Imaging. Org. Biomol. Chem. 2020, 18, 6357–6363. [Google Scholar] [CrossRef] [PubMed]
- Wang, J.H.; Liu, Y.M.; Dong, Z.M.; Chao, J.B.; Wang, H.; Wang, Y.; Shuang, S. New Colorimetric and Fluorometric Chemosensor for Selective Hg2+ Sensing in a Near-Perfect Aqueous Solution and Bio-Imaging. J. Hazard. Mater. 2020, 382, 121056. [Google Scholar] [CrossRef]
- Kraithong, S.; Panchan, W.; Charoenpanich, A.; Sirirak, J.; Sahasithiwat, S.; Swanglap, P.; Promarak, V.; Thamyongkit, P.; Wanichacheva, N. A Method to Detect Hg2+ in Vegetable via a “Turn–ON” Hg2+–Fluorescent Sensor with a Nanomolar Sensitivity. J. Photochem. Photobiol. 2020, 389, 112224. [Google Scholar] [CrossRef]
- Wang, X.; Ma, X.; Wen, J.; Geng, Z.; Wang, Z. A Novel Bimacrocyclic Polyamine-Based Fluorescent Probe for Sensitive Detection of Hg2+ and Glutathione in Human Serum. Talanta 2020, 207, 120311. [Google Scholar] [CrossRef]
- Tripathy, M.; Subuddhi, U.; Patel, S. A Styrylpyridinium Dye as Chromogenic and Fluorogenic Dual Mode Chemosensor for Selective Detection of Mercuric Ion: Application in Bacterial Cell Imaging and Molecular Logic Gate. Dye. Pigment. 2020, 174, 108054. [Google Scholar] [CrossRef]
- Zhou, G.; Zhang, X.; Ni, X.L. Tuning the Amphiphilicity of Terpyridine-Based Fluorescent Probe in Water: Assembly and Disassembly-Controlled Hg2+ Sensing, Removal, and Adsorption of H2S. J. Hazard. Mater. 2020, 384, 121474. [Google Scholar] [CrossRef] [PubMed]
- Wen, X.; Yan, L.; Fan, Z. A novel AIE Active NIR Fluorophore Based Triphenylamine for Sensing of Hg2+ and CN− and Its Multiple Application. Spectrochim. Acta 2020, 241, 118664. [Google Scholar] [CrossRef] [PubMed]
- Chen, H.L.; Li, R.T.; Wu, K.Y.; Hu, P.P.; Zhang, Z.; Huang, N.H.; Zhang, W.H.; Chen, J.X. Experimental and Theoretical Validations of a One-Pot Sequential Sensing of Hg2+ and Biothiols by a 3D Cu-Based Zwitterionic Metal−Organic Framework. Talanta 2020, 210, 120596. [Google Scholar] [CrossRef]
- Inal, E.K. A Fluorescent Chemosensor Based on Schiff Base for the Determination of Zn2+, Cd 2+ and Hg2+. J. Fluoresc. 2020, 30, 891–900. [Google Scholar] [CrossRef] [PubMed]
- Jiang, H.; Tang, D.; Li, Z.; Li, J.; Liu, H.; Meng, Q.; Han, Q.; Liu, X. A Dual-Channel Chemosensor Based on 8-Hydroxyquinoline for Fluorescent Detection of Hg2+ and Colorimetric Recognition of Cu2+. Spectrochim. Acta 2020, 243, 118784. [Google Scholar] [CrossRef]
- Xiao, L.; Sun, Q.; Zhao, Q.; Cheng, X. Highly Sensitive and Selective Fluorescent Monomer/Polymer Probes for Hg2+ and Ag+ Recognition and Imaging of Hg2+ in Living Cells. Anal. Bioanal. Chem. 2020, 412, 881–894. [Google Scholar] [CrossRef] [PubMed]
- Mahajan, P.G.; Shin, J.S.; Dige, N.C.; Vanjare, B.D.; Han, Y.; Choi, N.G.; Kim, S.J.; Seo, S.Y.; Lee, K.H. Chelation Enhanced Fluorescence of Rhodamine Based Novel Organic Nanoparticles for Selective Detection of Mercury Ions in Aqueous Medium and Intracellular Cell Imaging. J. Photochem. Photobiol. 2020, 397, 112579. [Google Scholar] [CrossRef]
- Wei, G.; Yan, Z.; Tian, J.; Zhao, G.; Guang, S.; Xu, H. Efficient Polymer Pendant Approach toward High Stable Organic Fluorophore for Sensing Ultratrace Hg2+ with Improved Biological Compatibility and Cell Permeability. Anal. Chem. 2020, 92, 3293–3301. [Google Scholar] [CrossRef]
- Wang, K.; Kong, Q.; Chen, X.; Yoon, J.; Swamy, K.; Wang, F. A Bifunctional Rhodamine Derivative as Chemosensor for Recognizing Cu2+ and Hg2+ Ions via Different Spectra. Chin. Chem. Lett. 2020, 31, 1087–1090. [Google Scholar] [CrossRef]
- Zhao, H.; Kang, H.; Fan, C.; Liu, G.; Pu, S. A New Multi-Functional Fluorescent Mercuric Ion Sensor Based on Diarylethene with Triazole-Linked Rhodamine B Unit. Tetrahedron 2020, 76, 131393. [Google Scholar] [CrossRef]
- Gong, J.; Liu, C.; Jiao, X.; He, S.; Zhao, L.; Zeng, X. A Novel Near-Infrared Fluorescent Probe with an Improved Stokes Shift for Specific Detection of Hg2+ in Mitochondria. Org. Biomol. Chem. 2020, 18, 5238–5244. [Google Scholar] [CrossRef]
- Chen, S.; Zhang, S.; Ruhan, A.; Han, Y. A New Rhodamine Probe with Large Stokes Shift for Hg2+ Detection and Its Application in Real Sample Analysis. Tetrahedron Lett. 2020, 61, 152077. [Google Scholar] [CrossRef]
- Bhatti, A.A.; Oguz, M.; Yilmaz, M. New water soluble p-Sulphonatocalix [4] Arene Chemosensor Appended with Rhodamine for Selective Detection of Hg2+ ion. J. Mol. Struct. 2020, 1203, 127436. [Google Scholar] [CrossRef]
- Zhu, Z.; Ding, H.; Wang, Y.; Fan, C.; Tu, Y.; Liu, G.; Pu, S. A Ratiometric and Colorimetric Fluorescent Probe for the Detection of Mercury Ion Based on Rhodamine and Quinoline–Benzothiazole Conjugated Dyad. J. Photochem. Photobiol. 2020, 400, 112657. [Google Scholar] [CrossRef]
- Roy, S.G.; Mondal, S.; Ghosh, K. Copillar [5] Arene-Rhodamine Conjugate as a Selective Sensor for Hg2+ Ions. New J. Chem. 2020, 44, 5921–5928. [Google Scholar] [CrossRef]
- Hu, J.P.; He, J.X.; Fang, H.; Yang, H.H.; Zhang, Q.; Lin, Q.; Yao, H.; Zhang, Y.M.; Wei, T.B.; Qu, W.J. A Novel Pillar [5] Arene-Based Emission Enhanced Supramolecular Sensor for Dual-Channel Selective Detection and Separation of Hg2+. New J. Chem. 2020, 44, 13157–13162. [Google Scholar] [CrossRef]
- Hu, J.; Yu, X.; Zhang, X.; Jing, C.; Liu, T.; Hu, X.; Lu, S.; Uvdal, K.; Gao, H.W.; Hu, Z. Rapid Detection of Mercury(II) Ions and Water Content by a New Rhodamine B-Based Fluorescent Chemosensor. Spectrochim. Acta 2020, 241, 118657. [Google Scholar] [CrossRef] [PubMed]
- Patil, S.K.; Das, D. A novel Rhodamine-Based Optical Probe for Mercury (II) Ion in Aqueous Medium: A Nanomolar Detection, wide pH Range and Real Water Sample Application. Spectrochim. Acta 2020, 225, 117504. [Google Scholar] [CrossRef]
- Qu, Z.; Meng, X.; Duan, H.; Qin, D.; Wang, L. Rhodamine-Immobilized Optical Hydrogels with Shape Deformation and Hg2+-Sensitive Fluorescence Behaviors. Sci. Rep. 2020, 10, 7723. [Google Scholar] [CrossRef]
- Wang, Y.; Ding, H.; Zhu, Z.; Fan, C.; Tu, Y.; Liu, G.; Pu, S. Selective Rhodamine–Based Probe for Detecting Hg2+ and its Application as Test Strips and Cell Staining. J. Photochem. Photobiol. 2020, 390, 112302. [Google Scholar] [CrossRef]
- Ding, G.; Wu, L.; Feng, H.; Liu, Y.; Li, J.; Si, H.; Yao, X.; He, M.; He, W. The Specific Binding of a New 1, 2, 3-Triazole to Three Blood Proteins and it’s Appended Rhodamine Complex for Selective Detection of Hg2+. Spectrochim. Acta 2020, 228, 117728. [Google Scholar] [CrossRef]
- Zhao, M.; Shao, G.K.; Guo, Y.S.; Tang, Y.L.; Liu, J.B.; Guo, D.S. A Reaction-Type Receptor for the Multi-Feature Detection of Hg2+ in Water and Living Cells. New J. Chem. 2020, 44, 12538–12545. [Google Scholar] [CrossRef]
- Zhong, W.; Wang, L.; Qin, D.; Zhou, J.; Duan, H. Two Novel Fluorescent Probes as Systematic Sensors for Multiple Metal Ions: Focus on Detection of Hg2+. ACS Omega 2020, 5, 24285–24295. [Google Scholar] [CrossRef]
- Zhong, W.; Wang, L.; Fang, S.; Qin, D.; Zhou, J.; Yang, G.; Duan, H. Two Novel Colorimetric Fluorescent Probes: Hg2+ and Al3+ in the Visual Colorimetric Recognition Environment. RSC Adv. 2020, 10, 3048–3059. [Google Scholar] [CrossRef]
- Li, W.; Jiang, C.; Lu, S.; Wang, F.; Zhang, Z.; Wei, T.; Chen, Y.; Qiang, J.; Yu, Z.; Chen, X. A Hydrogel Microsphere-Based Sensor for Dual and Highly Selective Detection of Al3+ and Hg2+. Sens. Actuators 2020, 321, 128490. [Google Scholar] [CrossRef]
- Pang, X.; Dong, J.; Gao, L.; Wang, L.; Yu, S.; Kong, J.; Li, L. Dansyl-Peptide Dual-Functional Fluorescent Chemosensor for Hg2+ and Biothiols. Dye. Pigment. 2020, 173, 107888. [Google Scholar] [CrossRef]
- Lv, P.; Cao, Y.; Liu, Z.; Wang, R.; Ye, B.; Li, G. Dual Luminescent Lanthanide Coordination Polymers for Ratiometric Sensing and Efficient Removal of Hg2+. Anal. Methods 2020, 12, 91–96. [Google Scholar] [CrossRef]
- Wang, P.; An, Y.; Wu, J. Highly Sensitive Turn-On Detection of Mercury (II) in Aqueous Solutions and Live Cells with a Chemosensor Based on Tyrosine. Spectrochim. Acta 2020, 230, 118004. [Google Scholar] [CrossRef]
- Muzey, B.; Naseem, A. An AIEE active 1, 8-Naphthalimide-Sulfamethizole Probe for Ratiometric Fuorescent Detection of Hg2+ Ions in Aqueous Media. J. Photochem. Photobiol. 2020, 391, 112354. [Google Scholar] [CrossRef]
- Mondal, T.; Mondal, I.; Biswas, S.; Mane, M.V.; Panja, S.S. Mechanistic Insight into Selective Sensing of Hazardous Hg2+ and Explosive Picric Acid by Using a Pyrene-Azine-Hydroxyquinoline Framework in Differential Media. ChemistrySelect 2020, 5, 9336–9349. [Google Scholar] [CrossRef]
- Rodríguez-Lavado, J.; Lorente, A.; Flores, E.; Ochoa, A.; Godoy, F.; Jaque, P.; Saitz, C. Elucidating Sensing Mechanisms of a Pyrene Excimer-Based Calix [4] Arene for Ratiometric Detection of Hg (II) and Ag(I) and Chemosensor Behaviour as INHIBITION or IMPLICATION Logic Gates. RSC Adv. 2020, 10, 21963–21973. [Google Scholar] [CrossRef]
- Li, X.; Duan, Q.; Yu, Y.; Wang, K.; Zhu, H.; Zhang, X.; Liu, C.; Jia, P.; Li, Z.; Sheng, W. A Coumarin-Based Fluorescent Probe for Hg2+ and Its Application in Living Cells and Zebrafish. Luminescence 2020, 35, 941–946. [Google Scholar] [CrossRef] [PubMed]
- Wu, X.; Li, Y.; Yang, S.; Tian, H.; Sun, B. A Multiple-Detection-Point Fluorescent Probe for the Rapid Detection of Mercury (II), Hydrazine and Hydrogen Sulphide. Dye. Pigment. 2020, 174, 108056. [Google Scholar] [CrossRef]
- Wu, X.; Li, Y.; Yang, S.; Tian, H.; Sun, B. Discriminative Detection of Mercury (II) and Hydrazine Using a Dual-Function Fluorescent Probe. Luminescence 2020, 35, 754–762. [Google Scholar] [CrossRef] [PubMed]
- Pan, Z.; Xu, Z.; Chen, J.; Hu, L.; Li, H.; Zhang, X.; Gao, X.; Wang, M.; Zhang, J. Coumarin Thiourea-Based Fluorescent Turn-On Hg2+ Probe that can be Utilized in a Broad pH Range 1–11. J. Fluoresc. 2020, 30, 505–514. [Google Scholar] [CrossRef]
- Yu, Y.; Liu, C.; Tian, B.; Cai, X.; Zhu, H.; Jia, P.; Li, Z.; Zhang, X.; Sheng, W.; Zhu, B. A Novel Highly Selective Ratiometric Fluorescent Probe with Large Emission Shift for Detecting Mercury Ions in Living Cells and Zebrafish. Dye. Pigment. 2020, 177, 108290. [Google Scholar] [CrossRef]
- Wu, X.; Duan, N.; Li, Y.; Yang, S.; Tian, H.; Sun, B. A Dual-Mode Fluorescent Probe for the Separate Detection of Mercury (II) and Hydrogen Sulfide. J. Photochem. Photobiol. 2020, 388, 112209. [Google Scholar] [CrossRef]
- Singh, P.; Kumar, K.; Kaur, N.; Kaur, S.; Kaur, S. Perylene Diimide Dye Threaded with Dual-React able Sites for Detection of H2S and Hg2+: Diagnostic Kit and Cell Imaging. Dye. Pigment. 2020, 180, 108448. [Google Scholar] [CrossRef]
- Aliaga, M.E.; Gazitua, M.; Rojas-Bolaños, A.; Fuentes-Estrada, M.; Durango, D.; García-Beltrán, O. A Selective Thioxothiazolidin-Coumarin Probe for Hg2+ Based on Its Desulfurization Reaction. Exploring its Potential for Live Cell Imaging. Spectrochim. Acta 2020, 224, 117372. [Google Scholar] [CrossRef] [PubMed]
- Sun, Y.; Wang, L.; Zhou, J.; Qin, D.; Duan, H. A New Phenothiazine-Based Fluorescence Sensor for Imaging Hg2+ in Living Cells. Appl. Organomet. Chem. 2020, 34, e5945. [Google Scholar] [CrossRef]
- Huang, S.; Gao, T.; Bi, A.; Cao, X.; Feng, B.; Liu, M.; Du, T.; Feng, X.; Zeng, W. Revealing Aggregation-Induced Emission Effect of Imidazolium Derivatives and Application for Detection of Hg2+. Dye. Pigment. 2020, 172, 107830. [Google Scholar] [CrossRef]
- Wang, Z.; Zhang, Y.; Yin, J.; Yang, Y.; Luo, H.; Song, J.; Xu, X.; Wang, S. A Novel Camphor-Based “Turn-On” Fluorescent Probe with High Specificity and Sensitivity for Sensing Mercury (II) in Aqueous Medium and Its Bioimaging Application. ACS Sustain. Chem. Eng. 2020, 8, 12348–12359. [Google Scholar] [CrossRef]
- Li, C.; Niu, Q.; Wang, J.; Wei, T.; Li, T.; Chen, J.; Qin, X.; Yang, Q. Bithiophene-Based Fluorescent Sensor for Highly Sensitive and Ultrarapid Detection of Hg2+ in Water, Seafood, Urine and Live Cells. Spectrochim. Acta 2020, 233, 118208. [Google Scholar] [CrossRef] [PubMed]
- Tian, M.; Wang, C.; Ma, Q.; Bai, Y.; Sun, J.; Ding, C. A Highly Selective Fluorescent Probe for Hg2+ Based on a 1, 8-Naphthalimide Derivative. ACS Omega 2020, 5, 18176–18184. [Google Scholar] [CrossRef] [PubMed]
- Zhao, L.; Zhang, Z.; Liu, Y.; Wei, J.; Liu, Q.; Ran, P.; Li, X. Fibrous Strips Decorated with Cleavable Aggregation-Induced Emission Probes for Visual Detection of Hg2+. J. Hazard. Mater. 2020, 385, 121556. [Google Scholar] [CrossRef]
- Sarkar, A.; Chakraborty, A.; Chakraborty, T.; Purkait, S.; Samanta, D.; Maity, S.; Das, D. A Chemodosimetric Approach for Fluorimetric Detection of Hg2+ Ions by Trinuclear Zn (II)/Cd (II) Schiff Base Complex: First Case of Intermediate Trapping in a Chemodosimetric Approach. Inorg. Chem. 2020, 59, 9014–9028. [Google Scholar] [CrossRef]
- Li, C.; Xiao, L.; Zhang, Q.; Cheng, X. Reaction-Based Highly Selective and Sensitive Monomer/Polymer Probes with Schiff Base Groups for the Detection of Hg2+ and Fe3+ Ions. Spectrochim. Acta 2020, 243, 118763. [Google Scholar] [CrossRef]
- Li, X.; Du, K.; Xie, C.; Wu, Y.; Zhang, B.; Tang, D. A Highly Sensitive and Selective Colorimetric Probe Based on a Cycloruthenated Complex: An Hg2+-Promoted Switch of Thiophene Coordination. Dalton Trans. 2020, 49, 2024–2032. [Google Scholar] [CrossRef]
- Wu, Y.; Cheng, X.; Xie, C.; Du, K.; Li, X.; Tang, D. A Polymer Membrane Tethered with a Cycloruthenated Complex for Colorimetric Detection of Hg2+ Ions. Spectrochim. Acta 2020, 228, 117541. [Google Scholar] [CrossRef]
- Kumar, A.; Kumar, A.; Sahoo, P.R.; Kumar, S. A Light Controlled, Reversible, Sensitive and Highly Selective Colorimetric Sensor for Mercuric Ions in Water. J. Mol. Struct. 2020, 1206, 127702. [Google Scholar] [CrossRef]
- Karuppusamy, P.; Senthilvelan, J.; Vijayakumar, V.; Sarveswari, S. A Pyrazole-Based Highly Selective Colorimetric Chemosensor for Hg2+ Ion in Semi-Aqueous Medium. ChemistrySelect 2020, 5, 49–53. [Google Scholar] [CrossRef]
- Tripathy, M.; Subuddhi, U.; Patel, S. An Azo Dye Based D-π-A Chromogenic Probe for Selective Naked-Eye Detection of Hg2+ Ion: Application in Logic Gate Operation. ChemistrySelect 2020, 5, 4803–4815. [Google Scholar] [CrossRef]
- Kim, A.; Kim, S.; Kim, C. A Conjugated Schiff Base-Based Chemosensor for Selectively Detecting Mercury Ion. J. Chem. Sci. 2020, 132, 82. [Google Scholar] [CrossRef]
- Madhesan, T.; Mohan, A.M. Porous Silica and Polymer Monolith Architectures as Solid-State Optical Chemosensors for Hg2+ Ions. Anal. Bioanal. Chem. 2020, 412, 7357–7370. [Google Scholar] [CrossRef] [PubMed]
- Kongasseri, A.; Sompalli, N.K.; Rao, B.C.; Nagarajan, S.; Mohan, A.M.; Deivasigamani, P. Solid-State Optical Sensing of Ultra-Trace Hg2+ Ions Using Chromoionophoric Probe Anchored Silica Monolithic Architectures. Sens. Actuators 2020, 321, 128558. [Google Scholar] [CrossRef]
- Jeon, H.; Ryu, H.; Nam, I.; Noh, D.Y. Heteroleptic Pt (II)-Dithiolene-Based Colorimetric Chemosensors: Selectivity Control for Hg (II) Ion Sensing. Materials 2020, 13, 1385. [Google Scholar] [CrossRef] [Green Version]
- Kaur, B.; Gupta, A.; Kaur, N. A Novel, Anthracene-Based Naked Eye Probe for Detecting Hg2+ Ions in Aqueous as well as Solid State Media. Microchem. J. 2020, 153, 104508. [Google Scholar] [CrossRef]
- Lv, H.; Yuan, G.; Zhang, G.; Ren, Z.; He, H.; Sun, Q.; Zhang, X.; Wang, S. A Novel Benzopyran-Based Colorimetric and Near-Infrared Fluorescent Sensor for Hg2+ and Its Imaging in Living Cell and Zebrafish. Dye. Pigment. 2020, 172, 107658. [Google Scholar] [CrossRef]
- Zhang, L.; Tang, Z.; Hou, L.; Qu, Y.; Deng, Y.; Zhang, C.; Xie, C.; Wu, Z. Selective Mercury (II) Detection in Aqueous Solutions Upon the Absorption Changes Corresponding to the Transition Moments Polarized Along the Short Axis of an Azobenzene Chemosensor. Analyst 2020, 145, 1641–1645. [Google Scholar] [CrossRef] [PubMed]
- Anand, T.; Sankar, M. A Dual Colorimetric Chemosensor for Hg (II) and Cyanide Ions in Aqueous Media Based on a Nitrobenzoxadiazole (NBD)–Antipyrine Conjugate with INHIBIT Logic Gate Behaviour. Anal. Methods 2020, 12, 4526–4533. [Google Scholar] [CrossRef] [PubMed]
- Divya, D.; Thennarasu, S. A Novel Isatin-Based Probe for Ratiometric and Selective Detection of Hg2+ and Cu2+ Ions Present in Aqueous and Environmental Samples. Spectrochim. Acta 2020, 243, 118796. [Google Scholar] [CrossRef] [PubMed]
- Hosseinjani-Pirdehi, H.; Mahmoodi, N.O.; Nadamani, M.P.; Taheri, A. Novel Synthesized Azo-Benzylidene-Thiourea as Dual Naked-Eye Chemosensor for Selective Detection of Hg2+ and CN¯ Ions. J. Photochem. Photobiol. 2020, 391, 112365. [Google Scholar] [CrossRef]
- Dhaka, G.; Jindal, G.; Kaur, R.; Rana, S.; Gupta, A.; Kaur, N. Multianalyte Azo Dye as an On-Site Assay Kit for Colorimetric Detection of Hg2+ Ions and Electrochemical Sensing of Zn2+ Ions. Spectrochim. Acta 2020, 229, 117869. [Google Scholar] [CrossRef] [PubMed]
- Raju, V.; Kumar, R.S.; Kumar, S.A.; Madhu, G.; Bothra, S.; Sahoo, S.K. A Ninhydrin-Thiosemicarbazone Based Highly Selective and Sensitive Chromogenic Sensor for Hg2+ and F− Ions. J. Chem. Sci. 2020, 132, 89. [Google Scholar] [CrossRef]
- Singh, G.; Satija, P.; Singh, A.; Sharma, G. First Report on the Synthesis of Antipyrine Crowned Siloxy Framework: Optical Recognition of Fe2+ and Hg2+ Ions. ChemistrySelect 2020, 5, 8823–8830. [Google Scholar] [CrossRef]
Figure 1.
Schematic representation showing the design of a chemosensor.

Figure 2.
Molecular structure of the chelating agents used for mercury intoxication.

Figure 3.
Molecular structures of the sensors 1 to 4.

Figure 4.
(a) Fluorescence spectra of 1 (K1 = 1) and (b) photographs of 1 (B = 1) under UV in the absence and presence of 20 µM metal ions in water. Reproduced with permission from [32]. Copyright 2020 Elsevier.
Figure 4.
(a) Fluorescence spectra of 1 (K1 = 1) and (b) photographs of 1 (B = 1) under UV in the absence and presence of 20 µM metal ions in water. Reproduced with permission from [32]. Copyright 2020 Elsevier.

Figure 5.
Molecular structures of the sensors 5 to 8.

Figure 6.
(A) Coordination mode of 5 with Hg2+, and (B) the UV absorption (a) and fluorescence (b) spectra of sensor 5 (10 μM) in CH3CN/H2O (1:1, v/v, pH = 7.4) upon the addition of different cations. Reproduced with permission from [36]. Copyright 2020 Elsevier.
Figure 6.
(A) Coordination mode of 5 with Hg2+, and (B) the UV absorption (a) and fluorescence (b) spectra of sensor 5 (10 μM) in CH3CN/H2O (1:1, v/v, pH = 7.4) upon the addition of different cations. Reproduced with permission from [36]. Copyright 2020 Elsevier.

Figure 7.
Molecular structures of the sensors 9 to 13.

Figure 8.
Molecular structures of the sensors 15 to 22.

Figure 9.
Molecular structures of the sensors 23 to 27.

Figure 10.
(A) Proposed binding mode and responding mechanism of 25 with Hg2+. (B) Confocal fluorescence images of HeLa cells incubated by 25 (a, d, and g), 25-Hg2+ (b, e, and h) and 25-Hg2+ + S2− (c, f, and i), respectively. Reproduced with permission from [56]. Copyright 2020 Elsevier.
Figure 10.
(A) Proposed binding mode and responding mechanism of 25 with Hg2+. (B) Confocal fluorescence images of HeLa cells incubated by 25 (a, d, and g), 25-Hg2+ (b, e, and h) and 25-Hg2+ + S2− (c, f, and i), respectively. Reproduced with permission from [56]. Copyright 2020 Elsevier.

Figure 11.
Molecular structures of the sensors 28 to 34.

Figure 12.
(A) Proposed binding mode and responding mechanism of 29 with Hg2+. (B) Fluorescence images of three-day-old zebrafish incubated with 29 (20 μM) at 28 °C for 30 min (a–c), subsequent treatment with Hg2+ (40 μM) for 30 min (d–f) and further incubation with I− (40 μM) for 30 min (g–i). λex = 488 nm; yellow channel: λem = 500–600 nm; scale bar: 500 μm. Reproduced with permission from [59]. Copyright 2020 Elsevier.

Figure 13.
Molecular structures of the sensors 36 to 40.

Figure 14.
Molecular structures of the sensors 41 to 44.

Figure 15.
Molecular structures of the sensors 45 to 47.

Figure 16.
(A) Fluorescence responses of 47 (1 in image represents sensor 47) (10 μM) in the presence of various metal ions; (B) Fluorescence intensity at 613 nm of 47 (red bars: 47 with other metal ions, green bars: 47 with other metal ions and Hg2+, λex = 390 nm). (C) The color image of 47 (10 μM) with other metal ions. (D) The fluorescence photo of 47 (10 μM) upon addition Hg2+ (20 eq.) in the existence of other metal ions (20 eq.). (E) The FRET process of 47 detecting Hg2+. Reproduced with permission from [76]. Copyright 2020 Elsevier.

Figure 17.
Molecular structures of the sensors 48 to 51.

Figure 18.
Molecular structures of the sensors 52 to 55.

Figure 19.
(A) Sensing mechanism of 53 for Hg2+. (B) Confocal fluorescence images of HeLa cells with an excitation filter of 488 nm. Probe 53 loaded HeLa cells: (a) Bright field image; (b) Dark field image; (c) Merged images of a and b. Reproduced with permission from [82]. Copyright 2020 Elsevier.
Figure 19.
(A) Sensing mechanism of 53 for Hg2+. (B) Confocal fluorescence images of HeLa cells with an excitation filter of 488 nm. Probe 53 loaded HeLa cells: (a) Bright field image; (b) Dark field image; (c) Merged images of a and b. Reproduced with permission from [82]. Copyright 2020 Elsevier.

Figure 20.
Molecular structures of the sensors 56 to 59.

Figure 21.
Molecular structures of the sensors 61 to 65.

Figure 22.
Proposed principle of 62 for detecting Hg2+. Reproduced with permission from [90]. Copyright 2020 Elsevier.
Figure 22.
Proposed principle of 62 for detecting Hg2+. Reproduced with permission from [90]. Copyright 2020 Elsevier.

Figure 23.
Molecular structures of the sensors 66 to 73.

Figure 24.
Reaction-based sensing mechanism of 67 with Hg2+, N2H4 and H2S. Reproduced with permission from [95]. Copyright 2020 Elsevier.
Figure 24.
Reaction-based sensing mechanism of 67 with Hg2+, N2H4 and H2S. Reproduced with permission from [95]. Copyright 2020 Elsevier.

Figure 25.
Molecular structures of the sensors 74 to 79.

Figure 26.
(A) Proposed sensing mechanism of 77 (2TS = 77) for Hg2+. (B) Fluorescence spectra of 77 (10 μM) after addition of 20 μM of various tested ions in 100% aqueous solution; Inset: fluorimetric responses of 77 (10 μM) in 100% aqueous solution after the addition of various tested ions. Reproduced with permission from [105]. Copyright 2020 Elsevier.

Figure 27.
Molecular structures of the sensors 80 to 84.

Figure 28.
Molecular structures of the sensors 85 to 89.

Figure 29.
The possible sensing mechanism of 85 with Hg2+. Reproduced with permission from [110]. Copyright 2020 The Royal Society of Chemistry.
Figure 29.
The possible sensing mechanism of 85 with Hg2+. Reproduced with permission from [110]. Copyright 2020 The Royal Society of Chemistry.

Figure 30.
Molecular structures of the sensors 90 to 94.

Figure 31.
Molecular structures of the sensors 95 to 102.


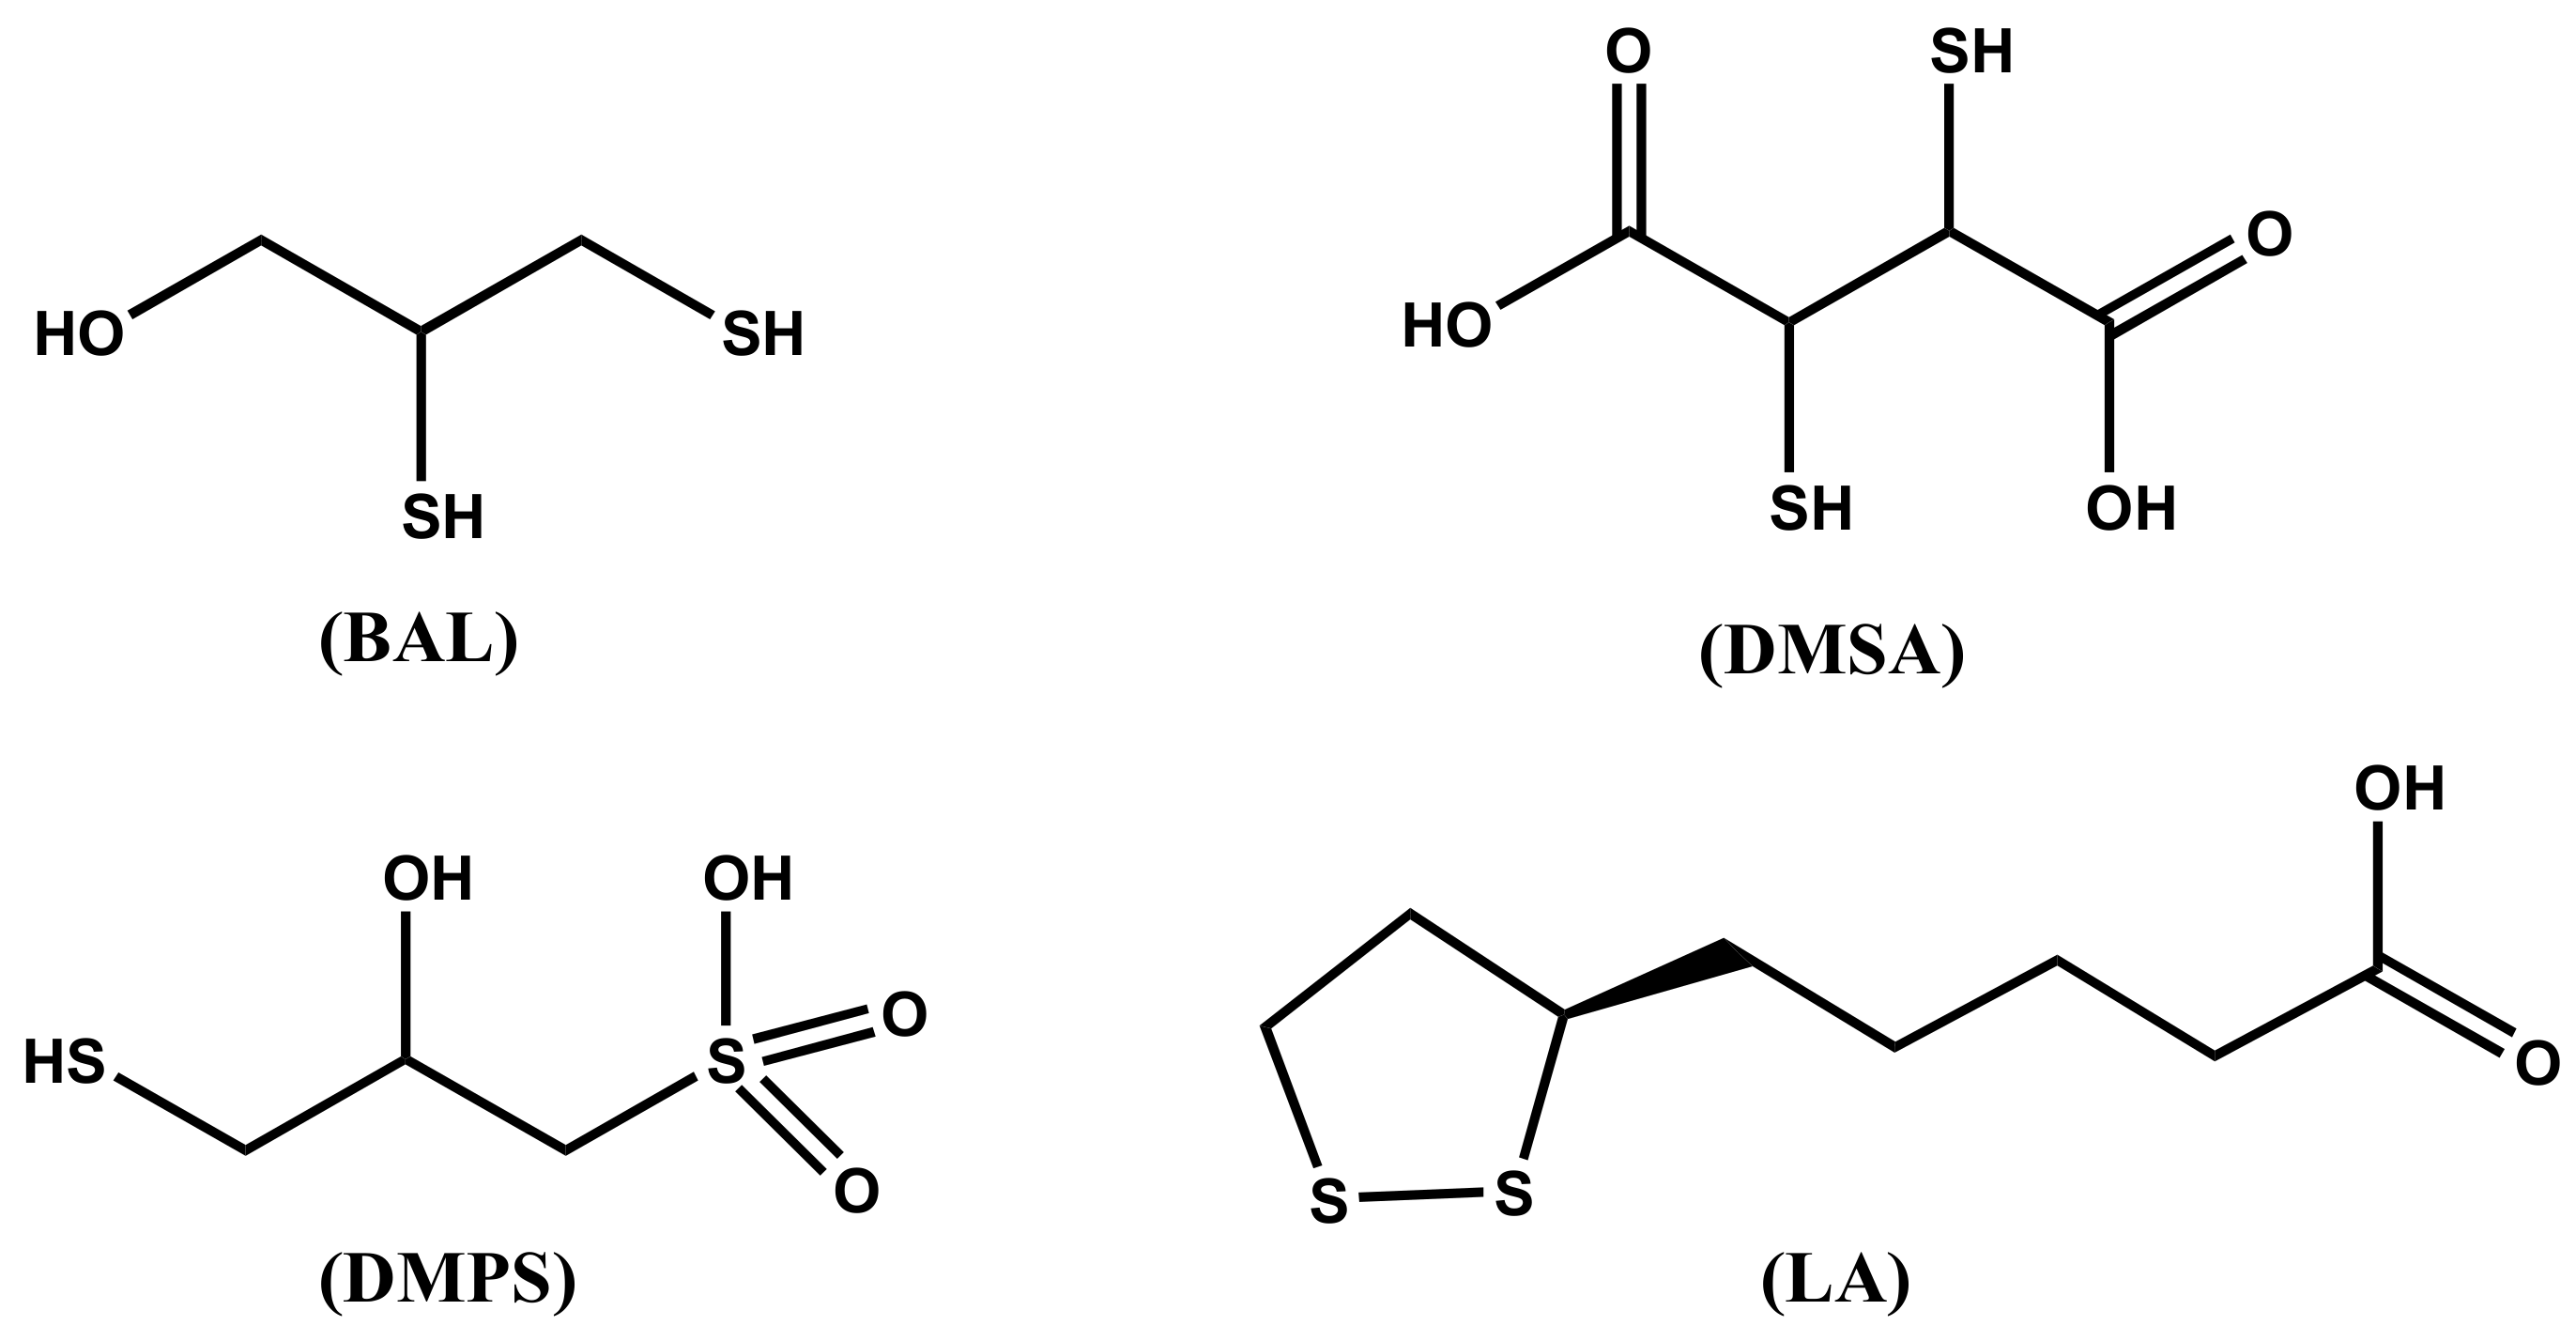
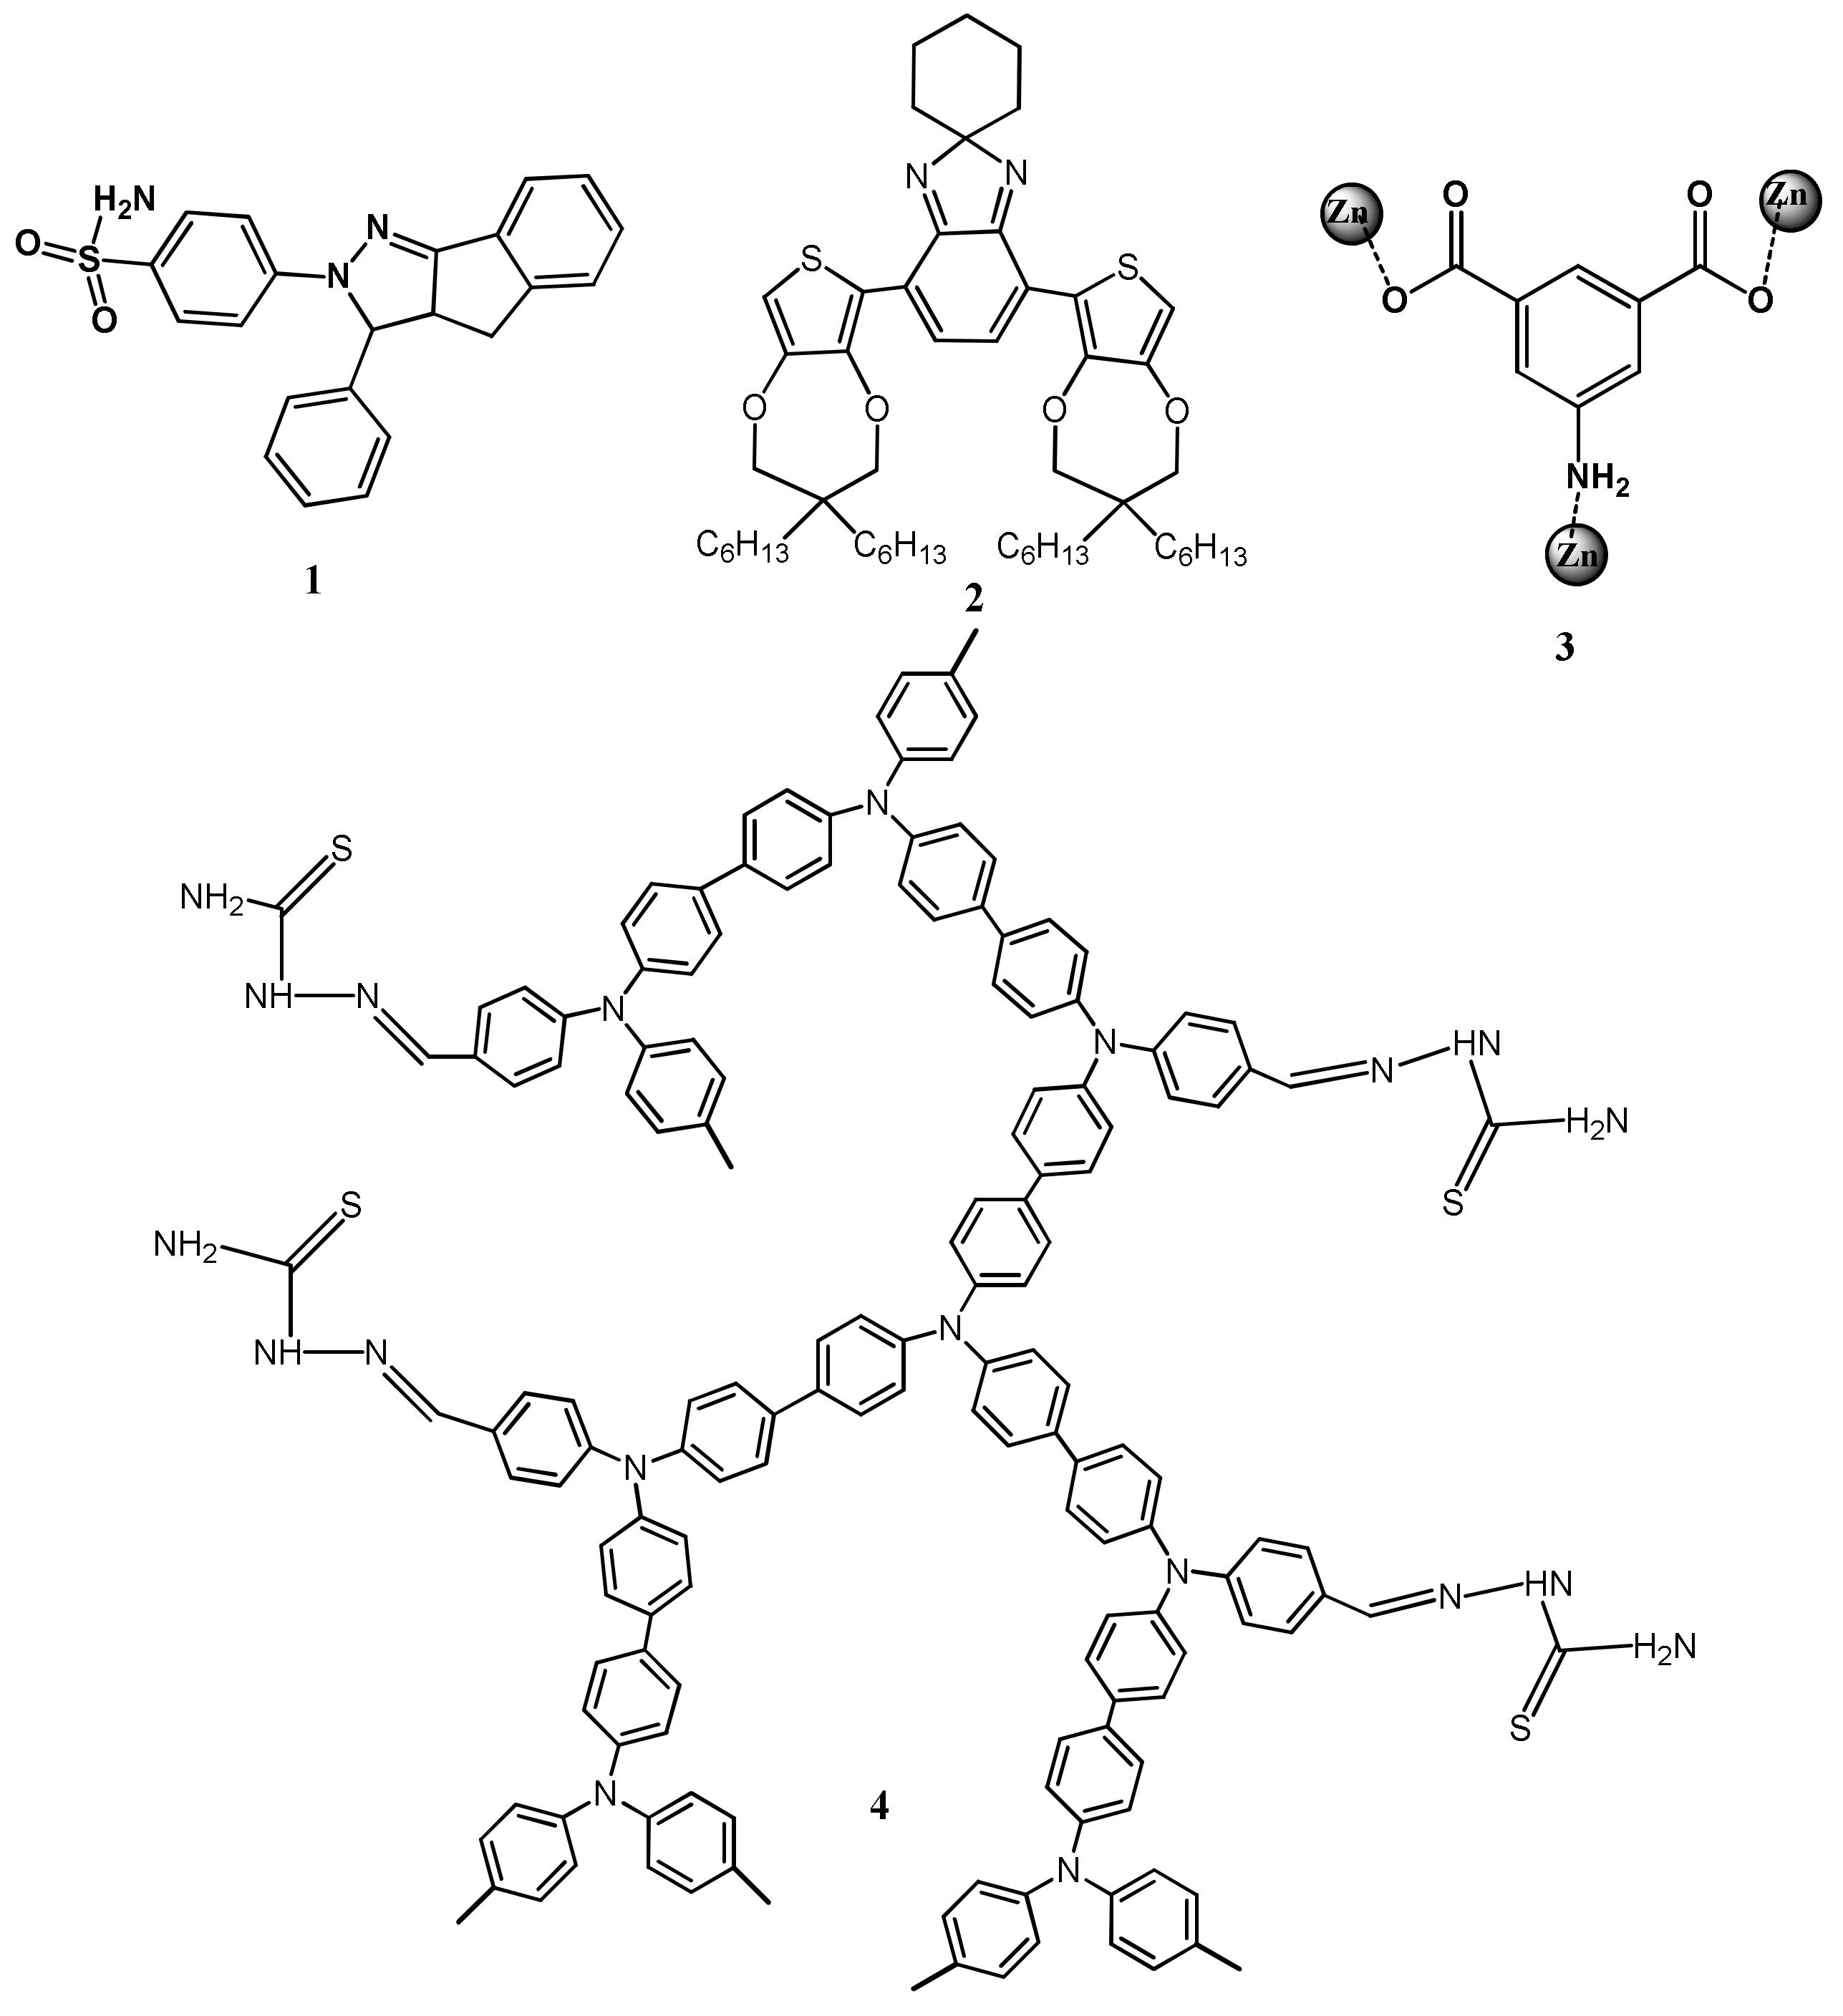
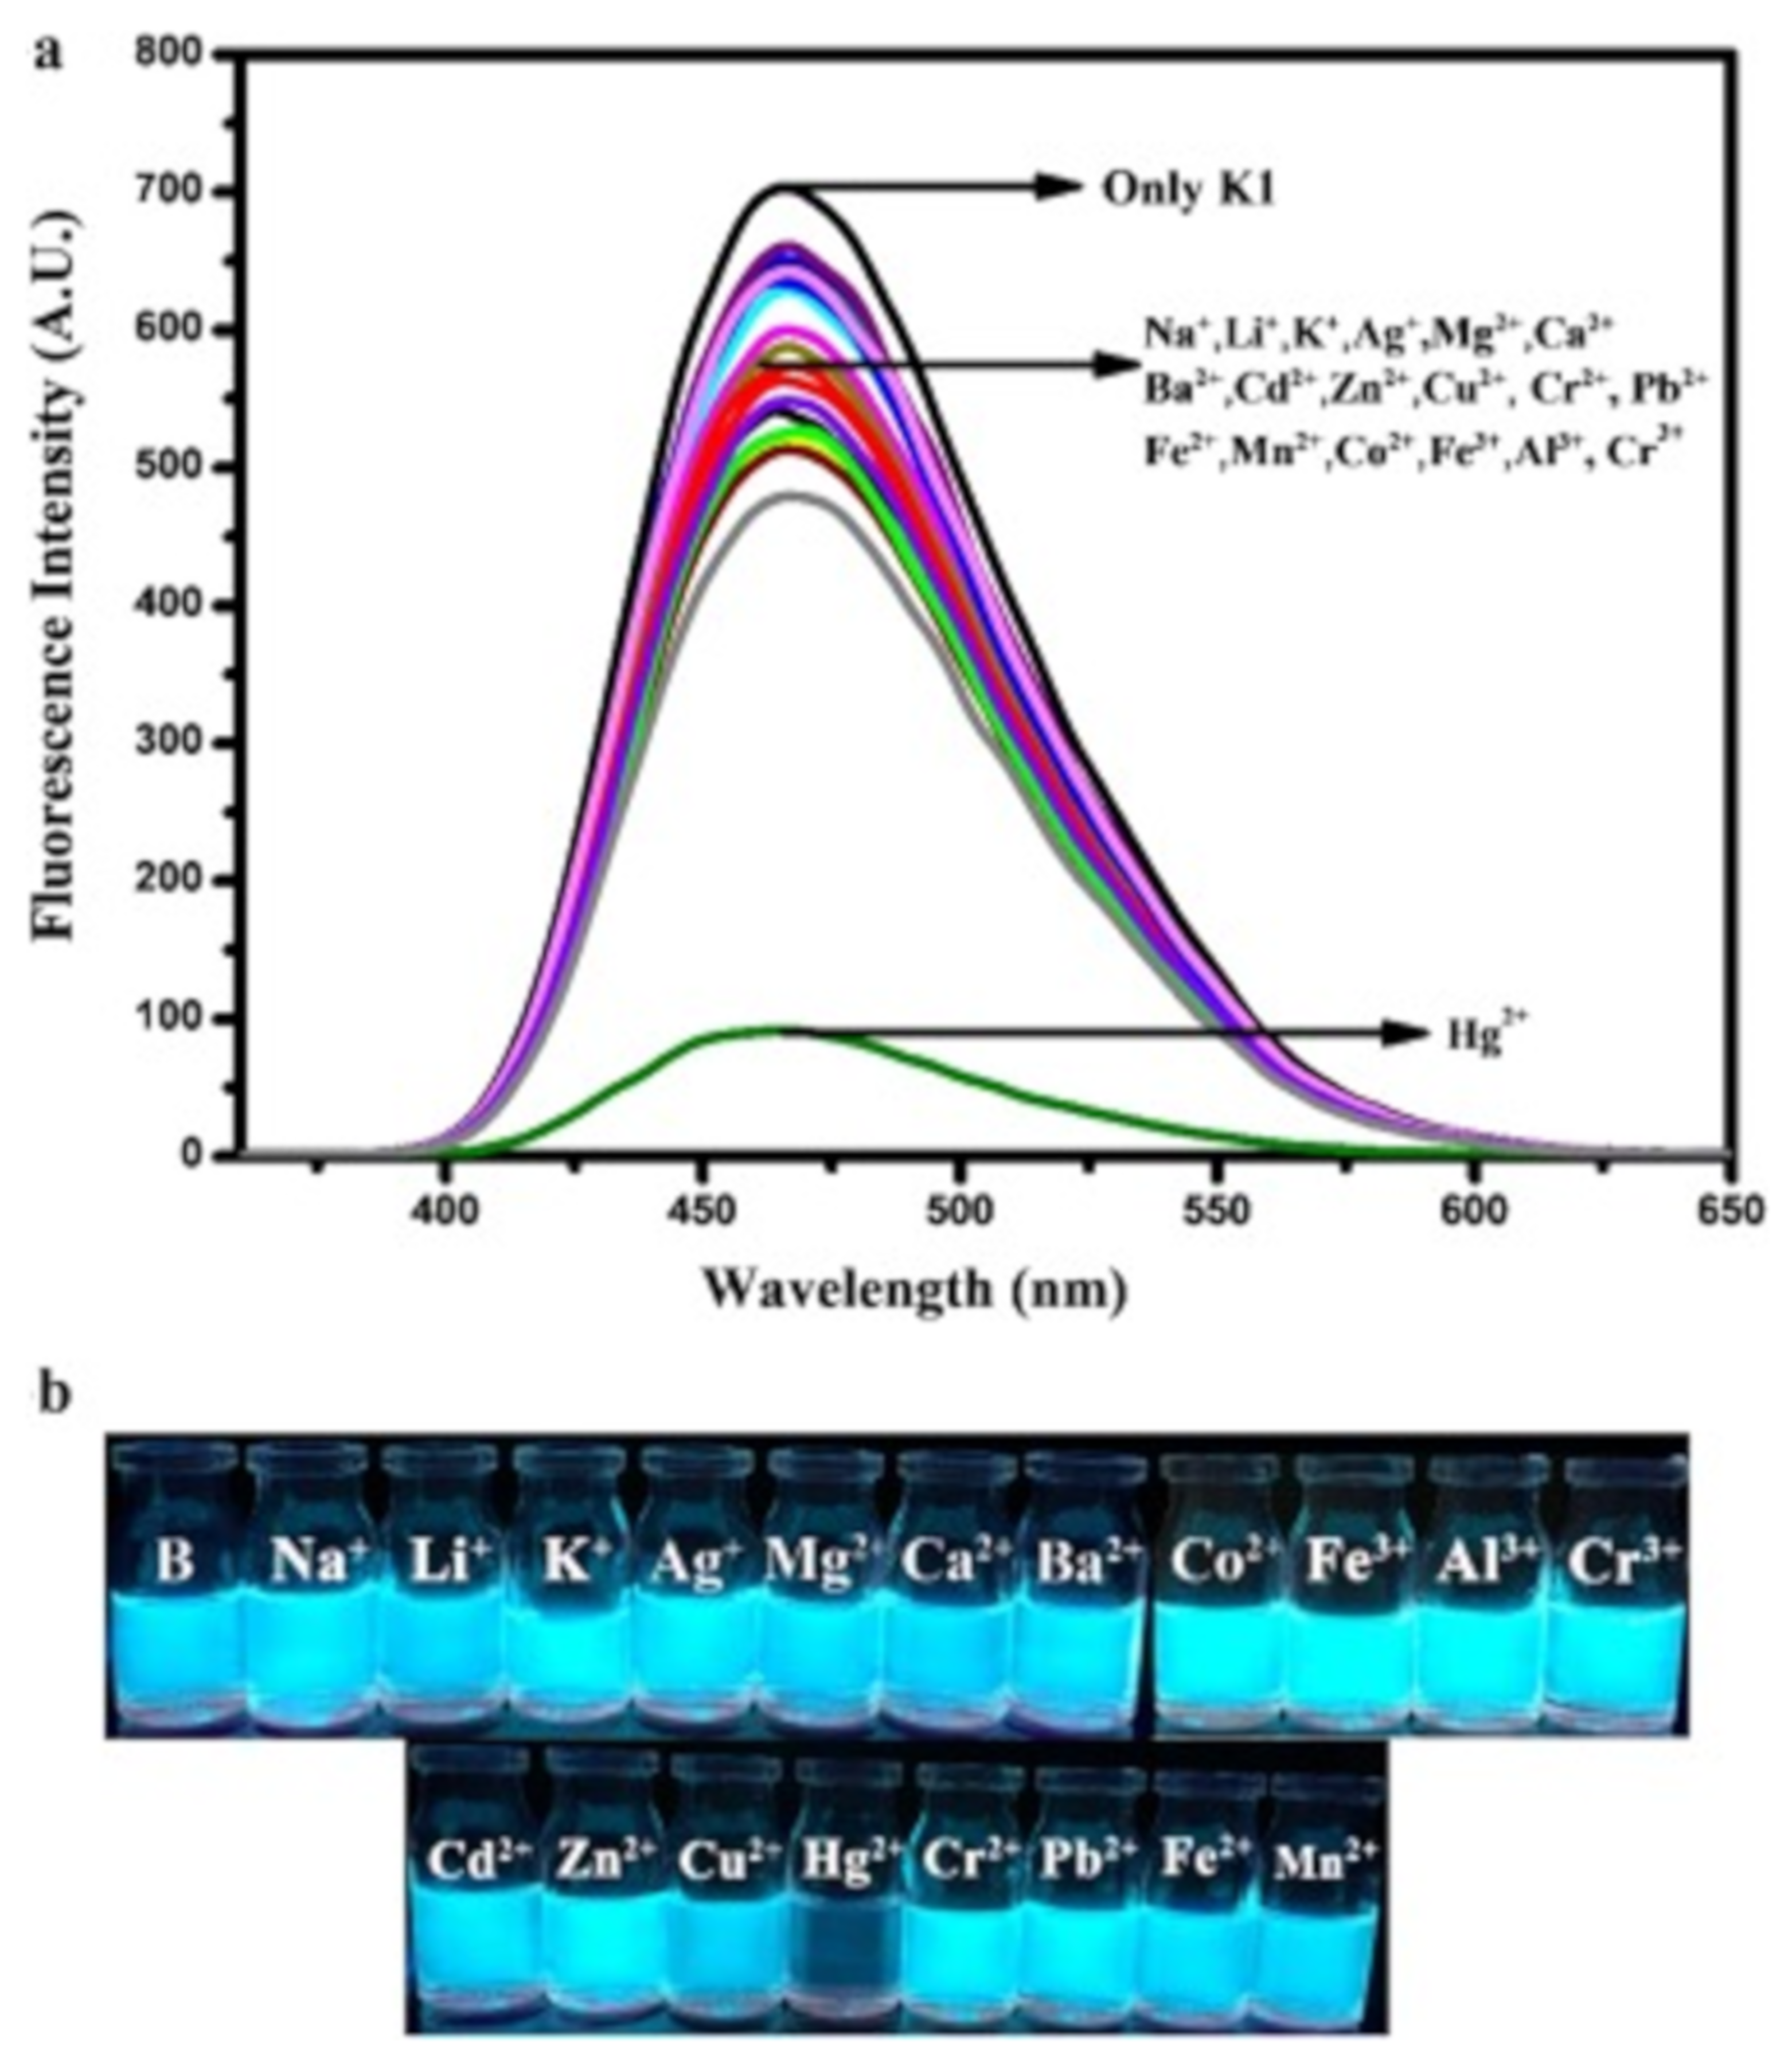
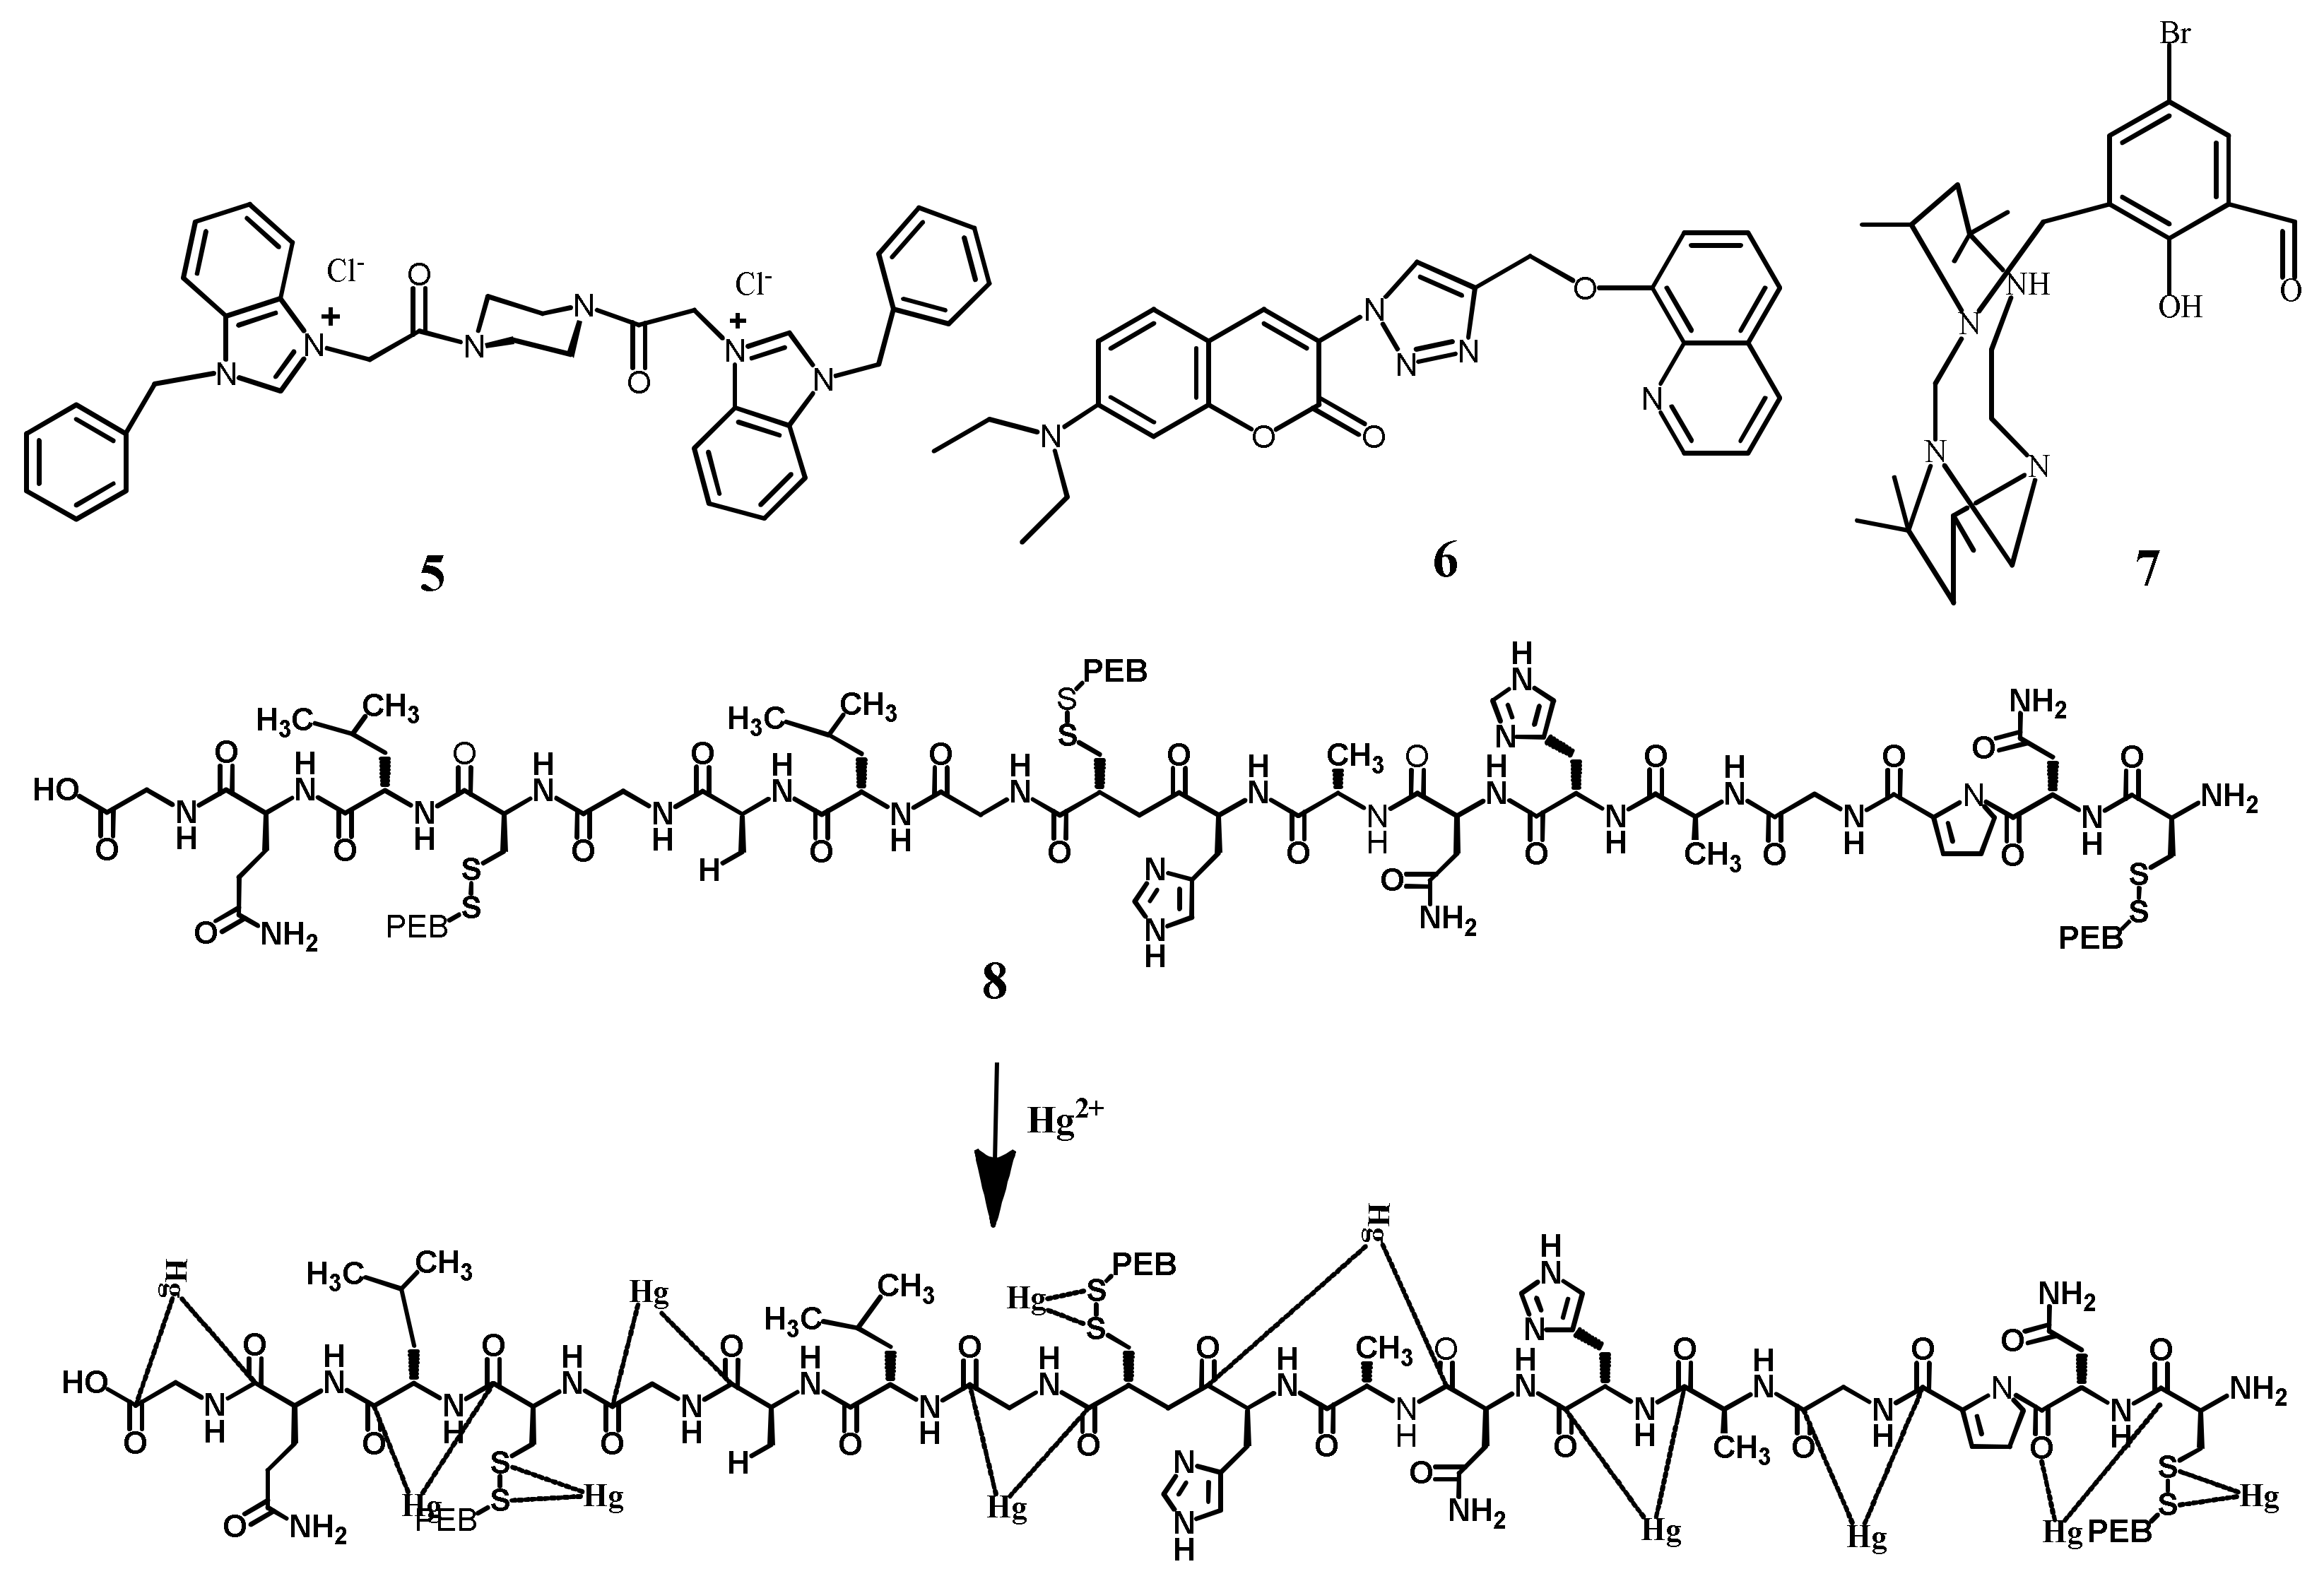
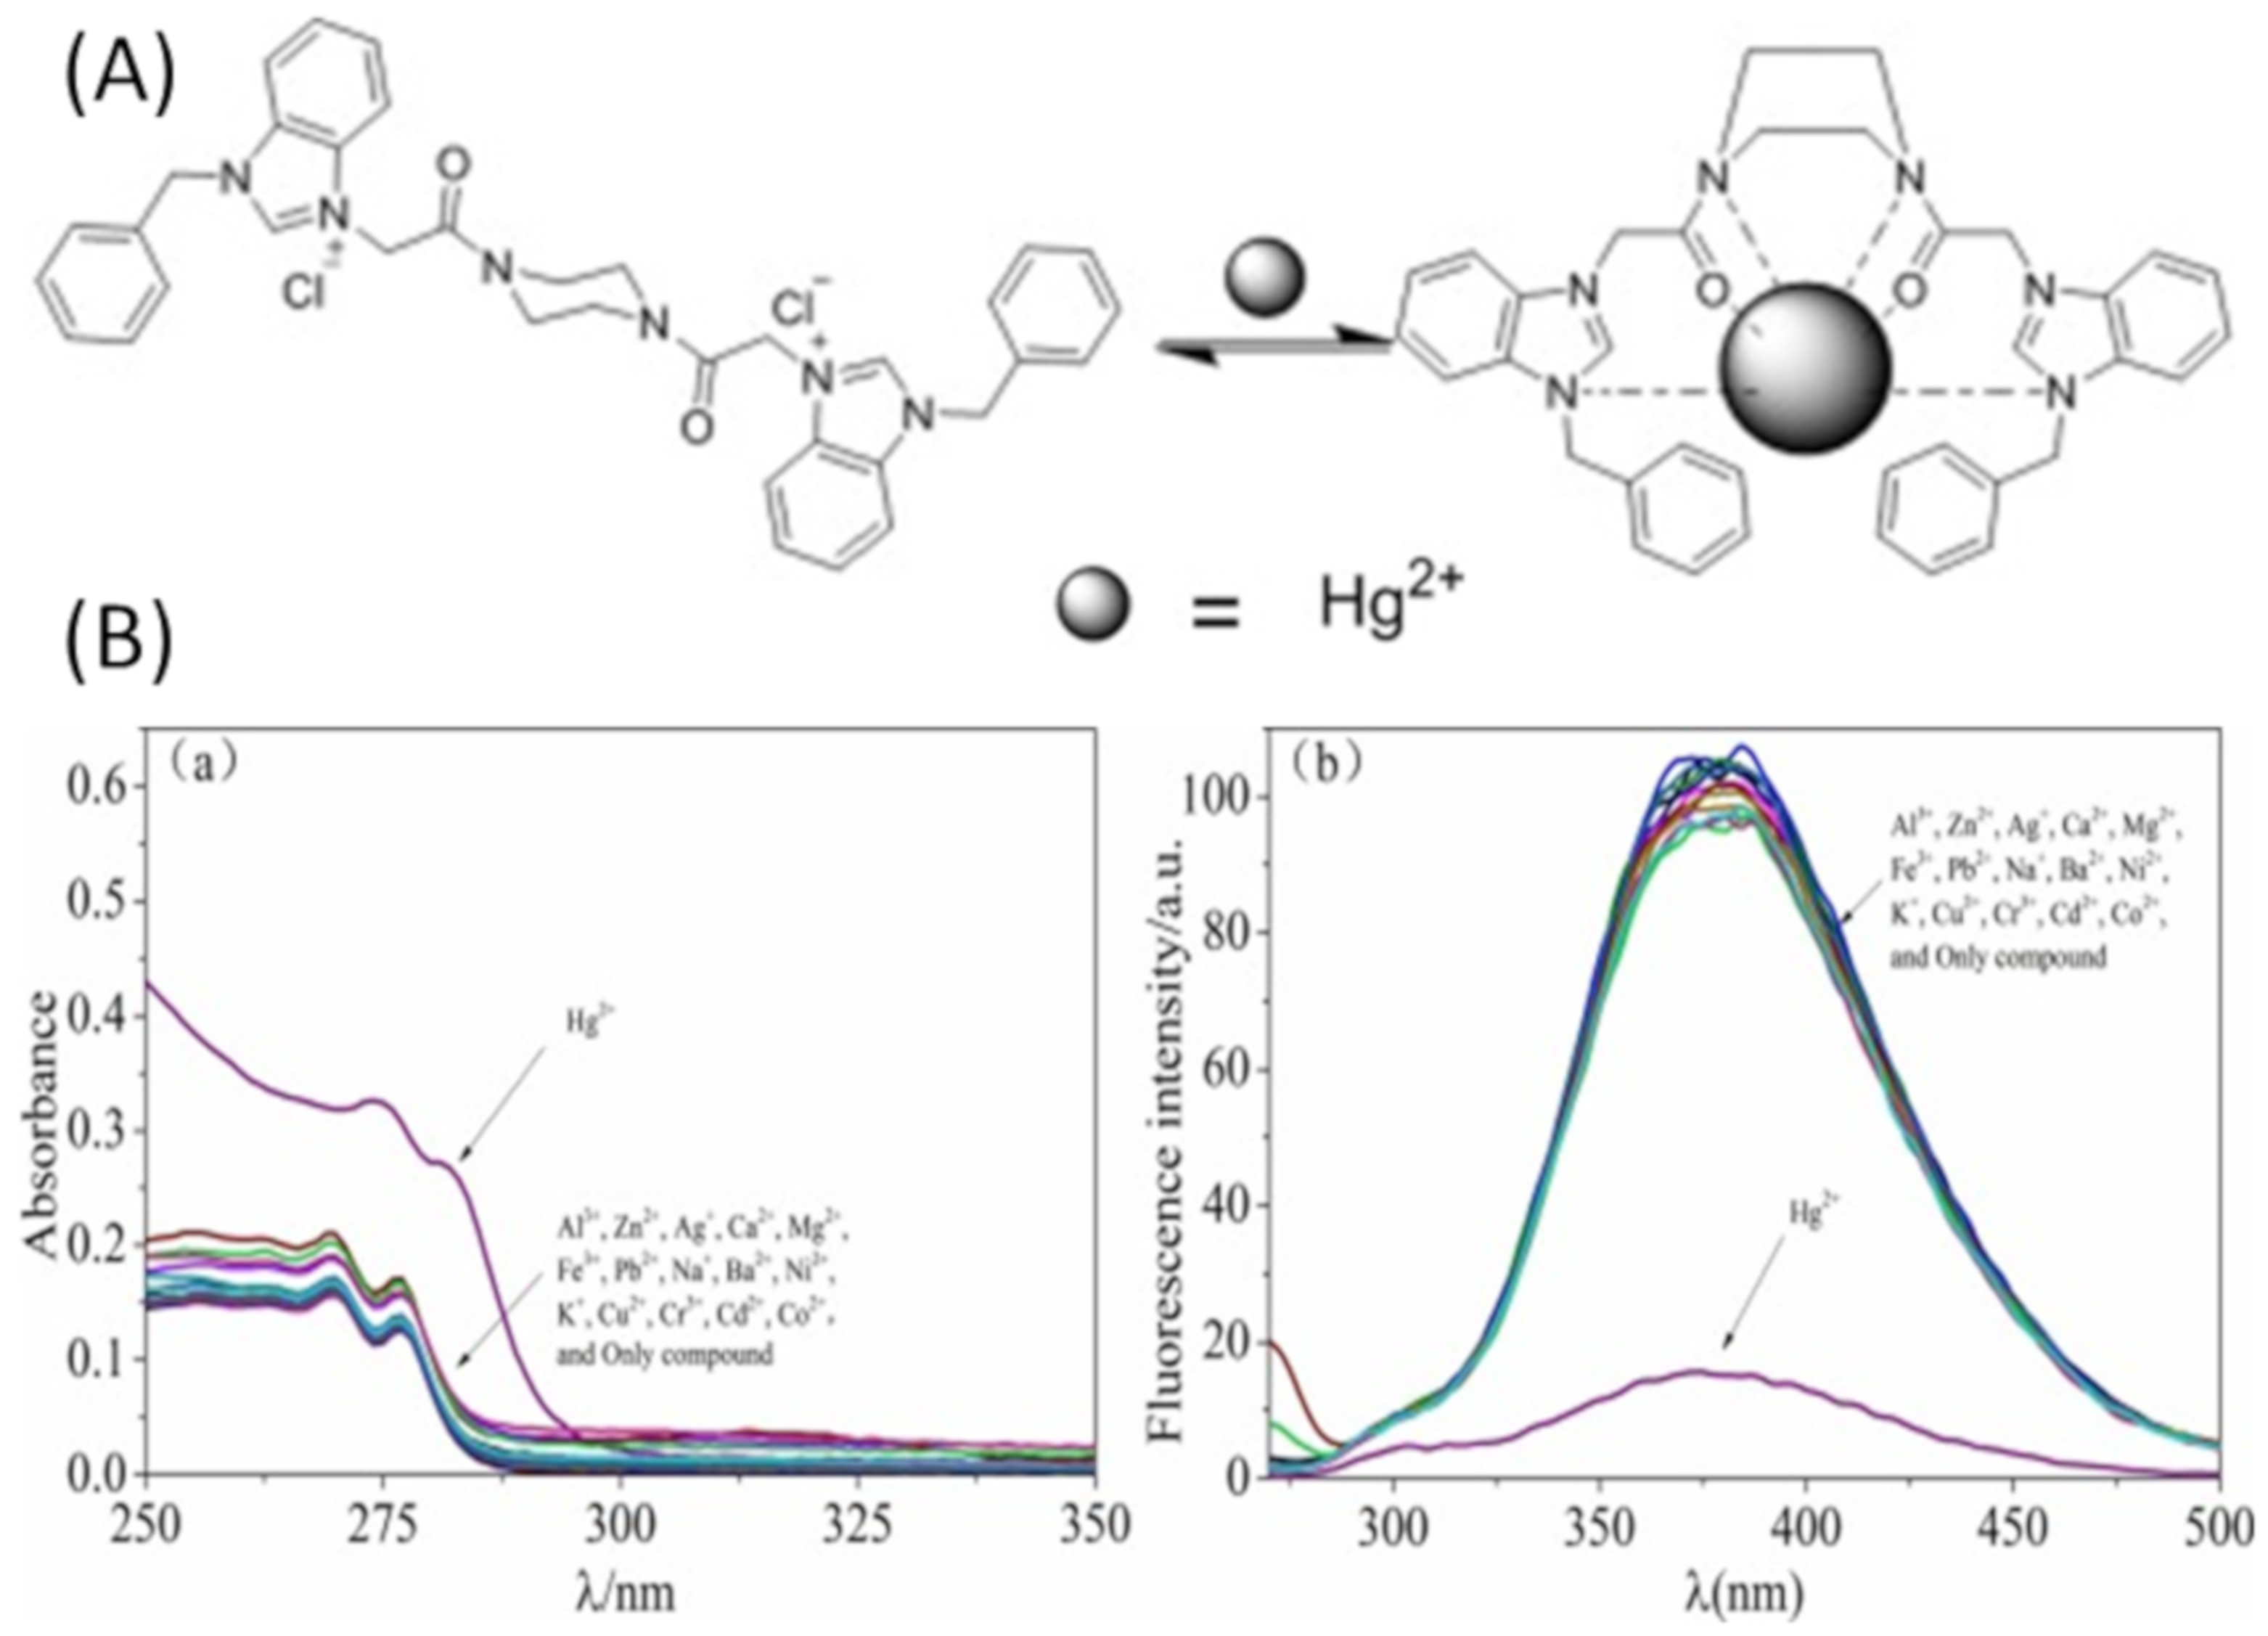
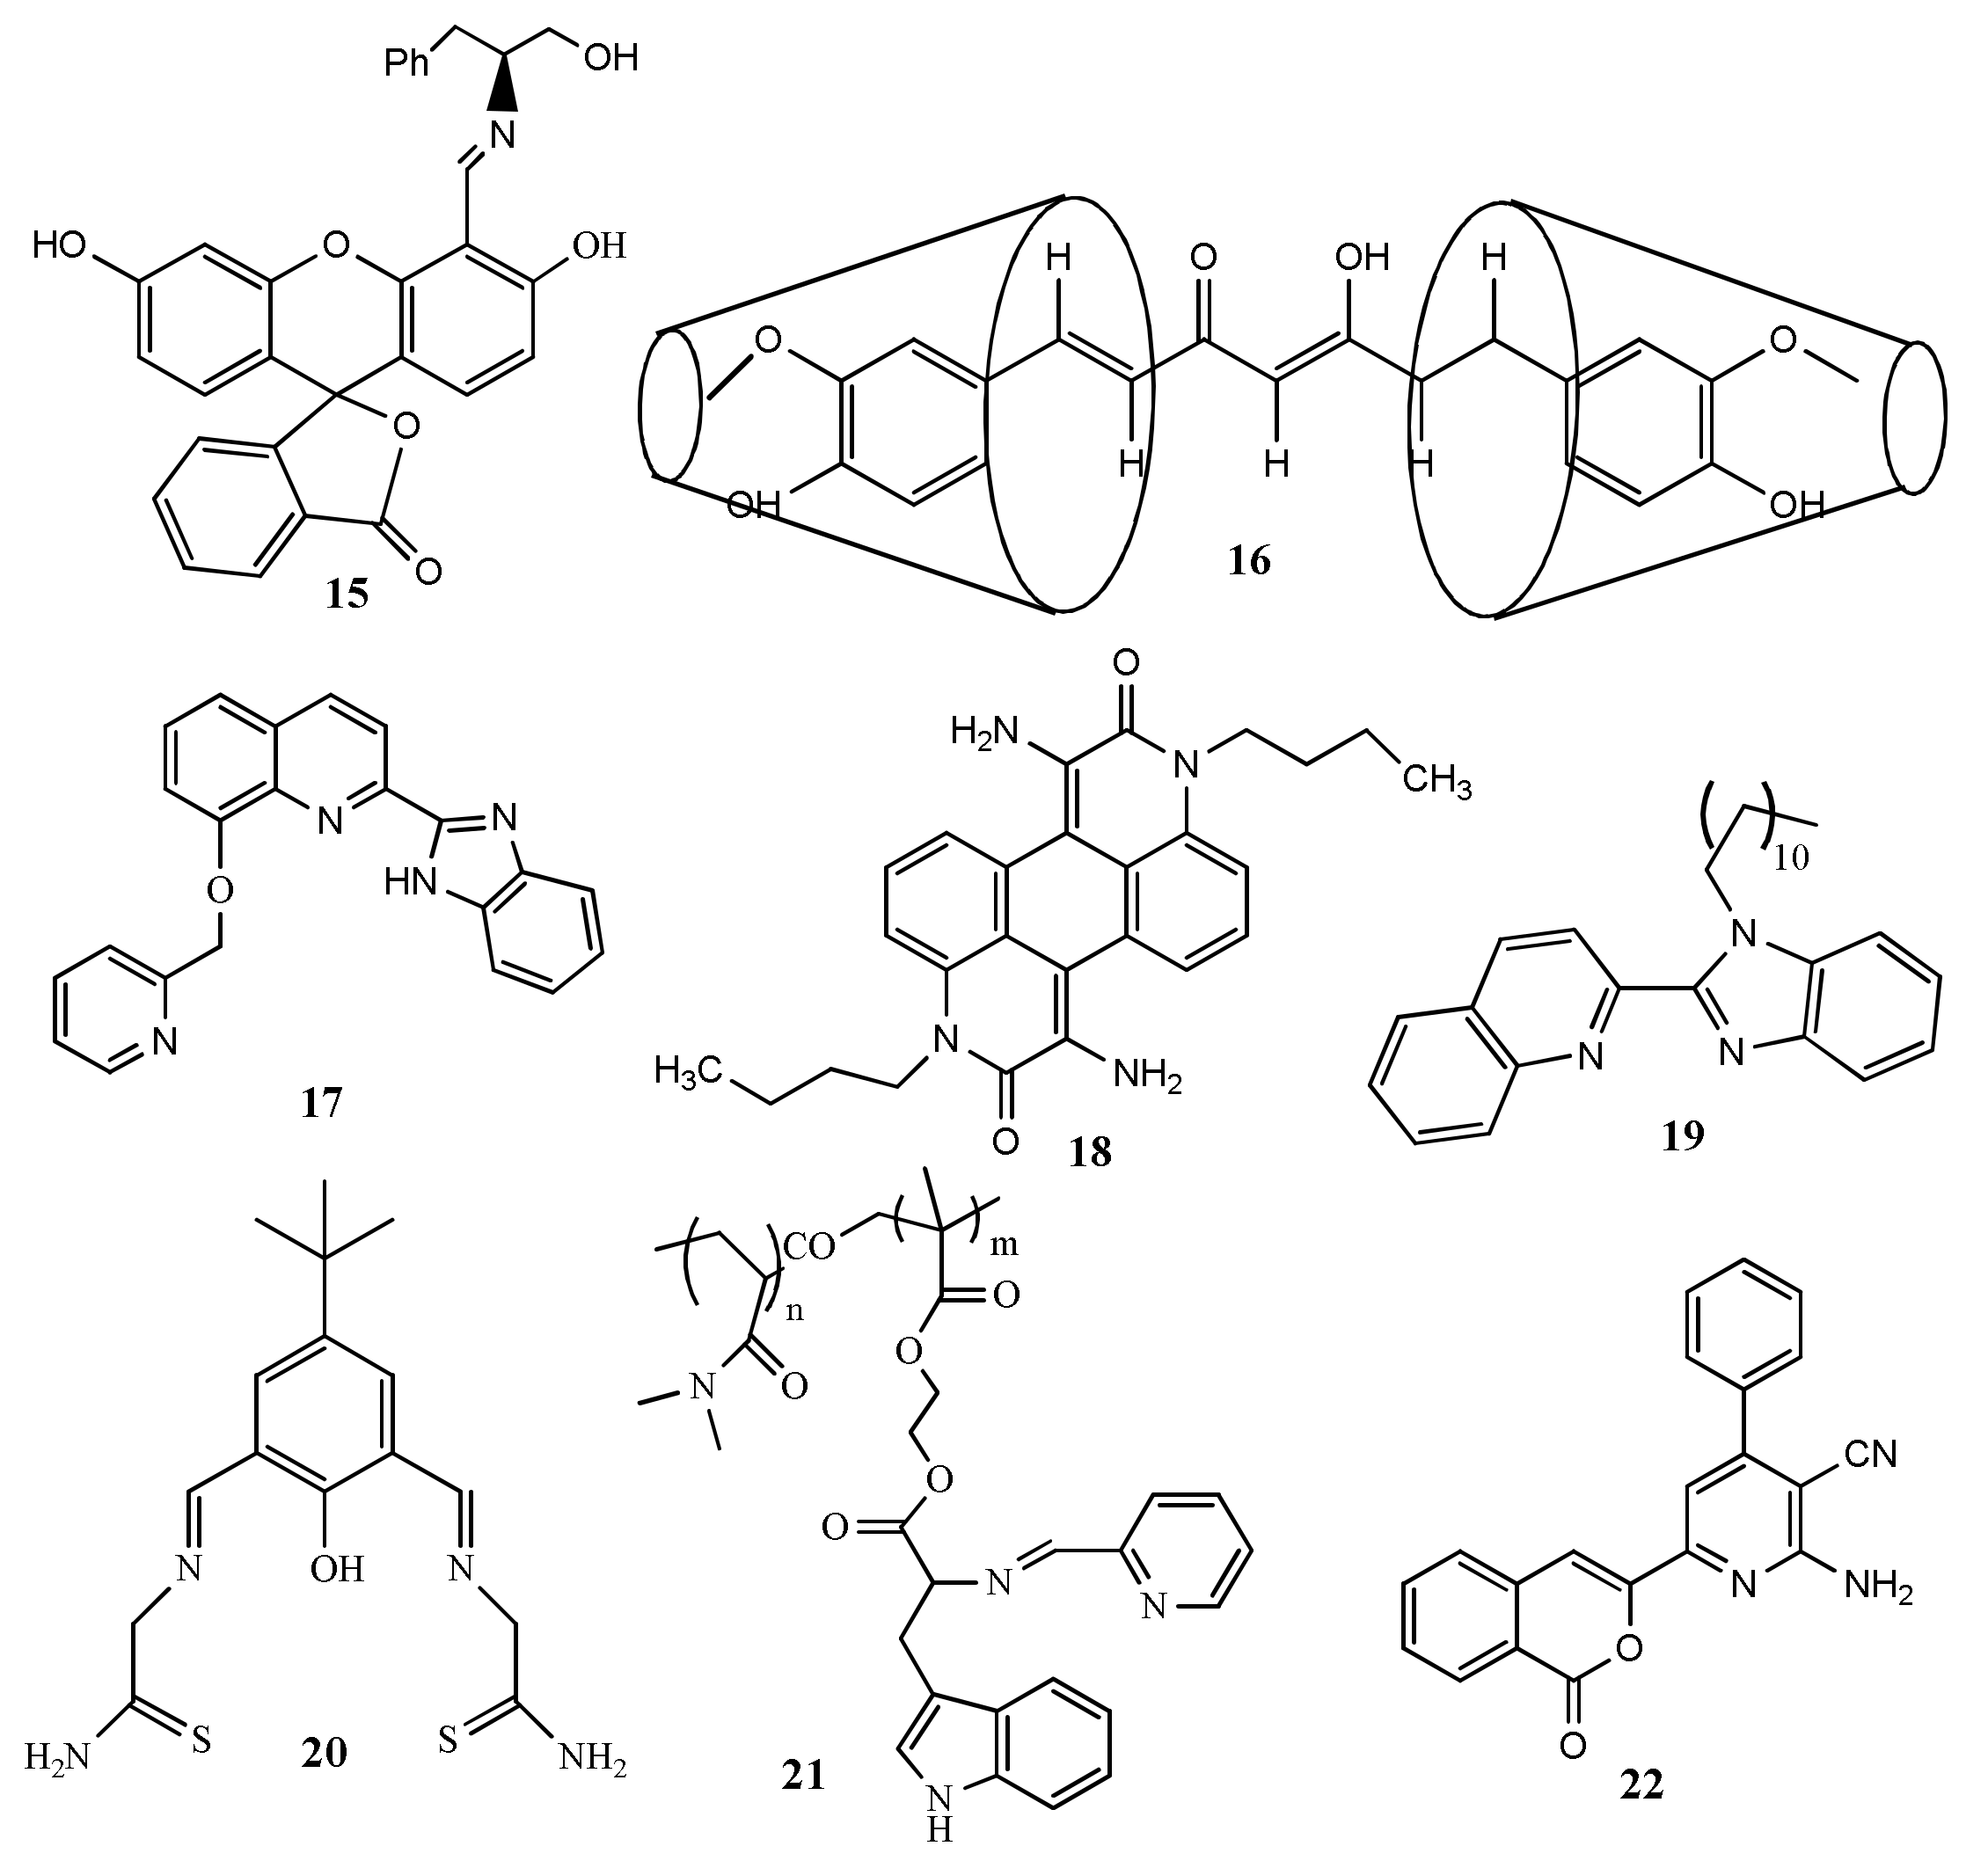
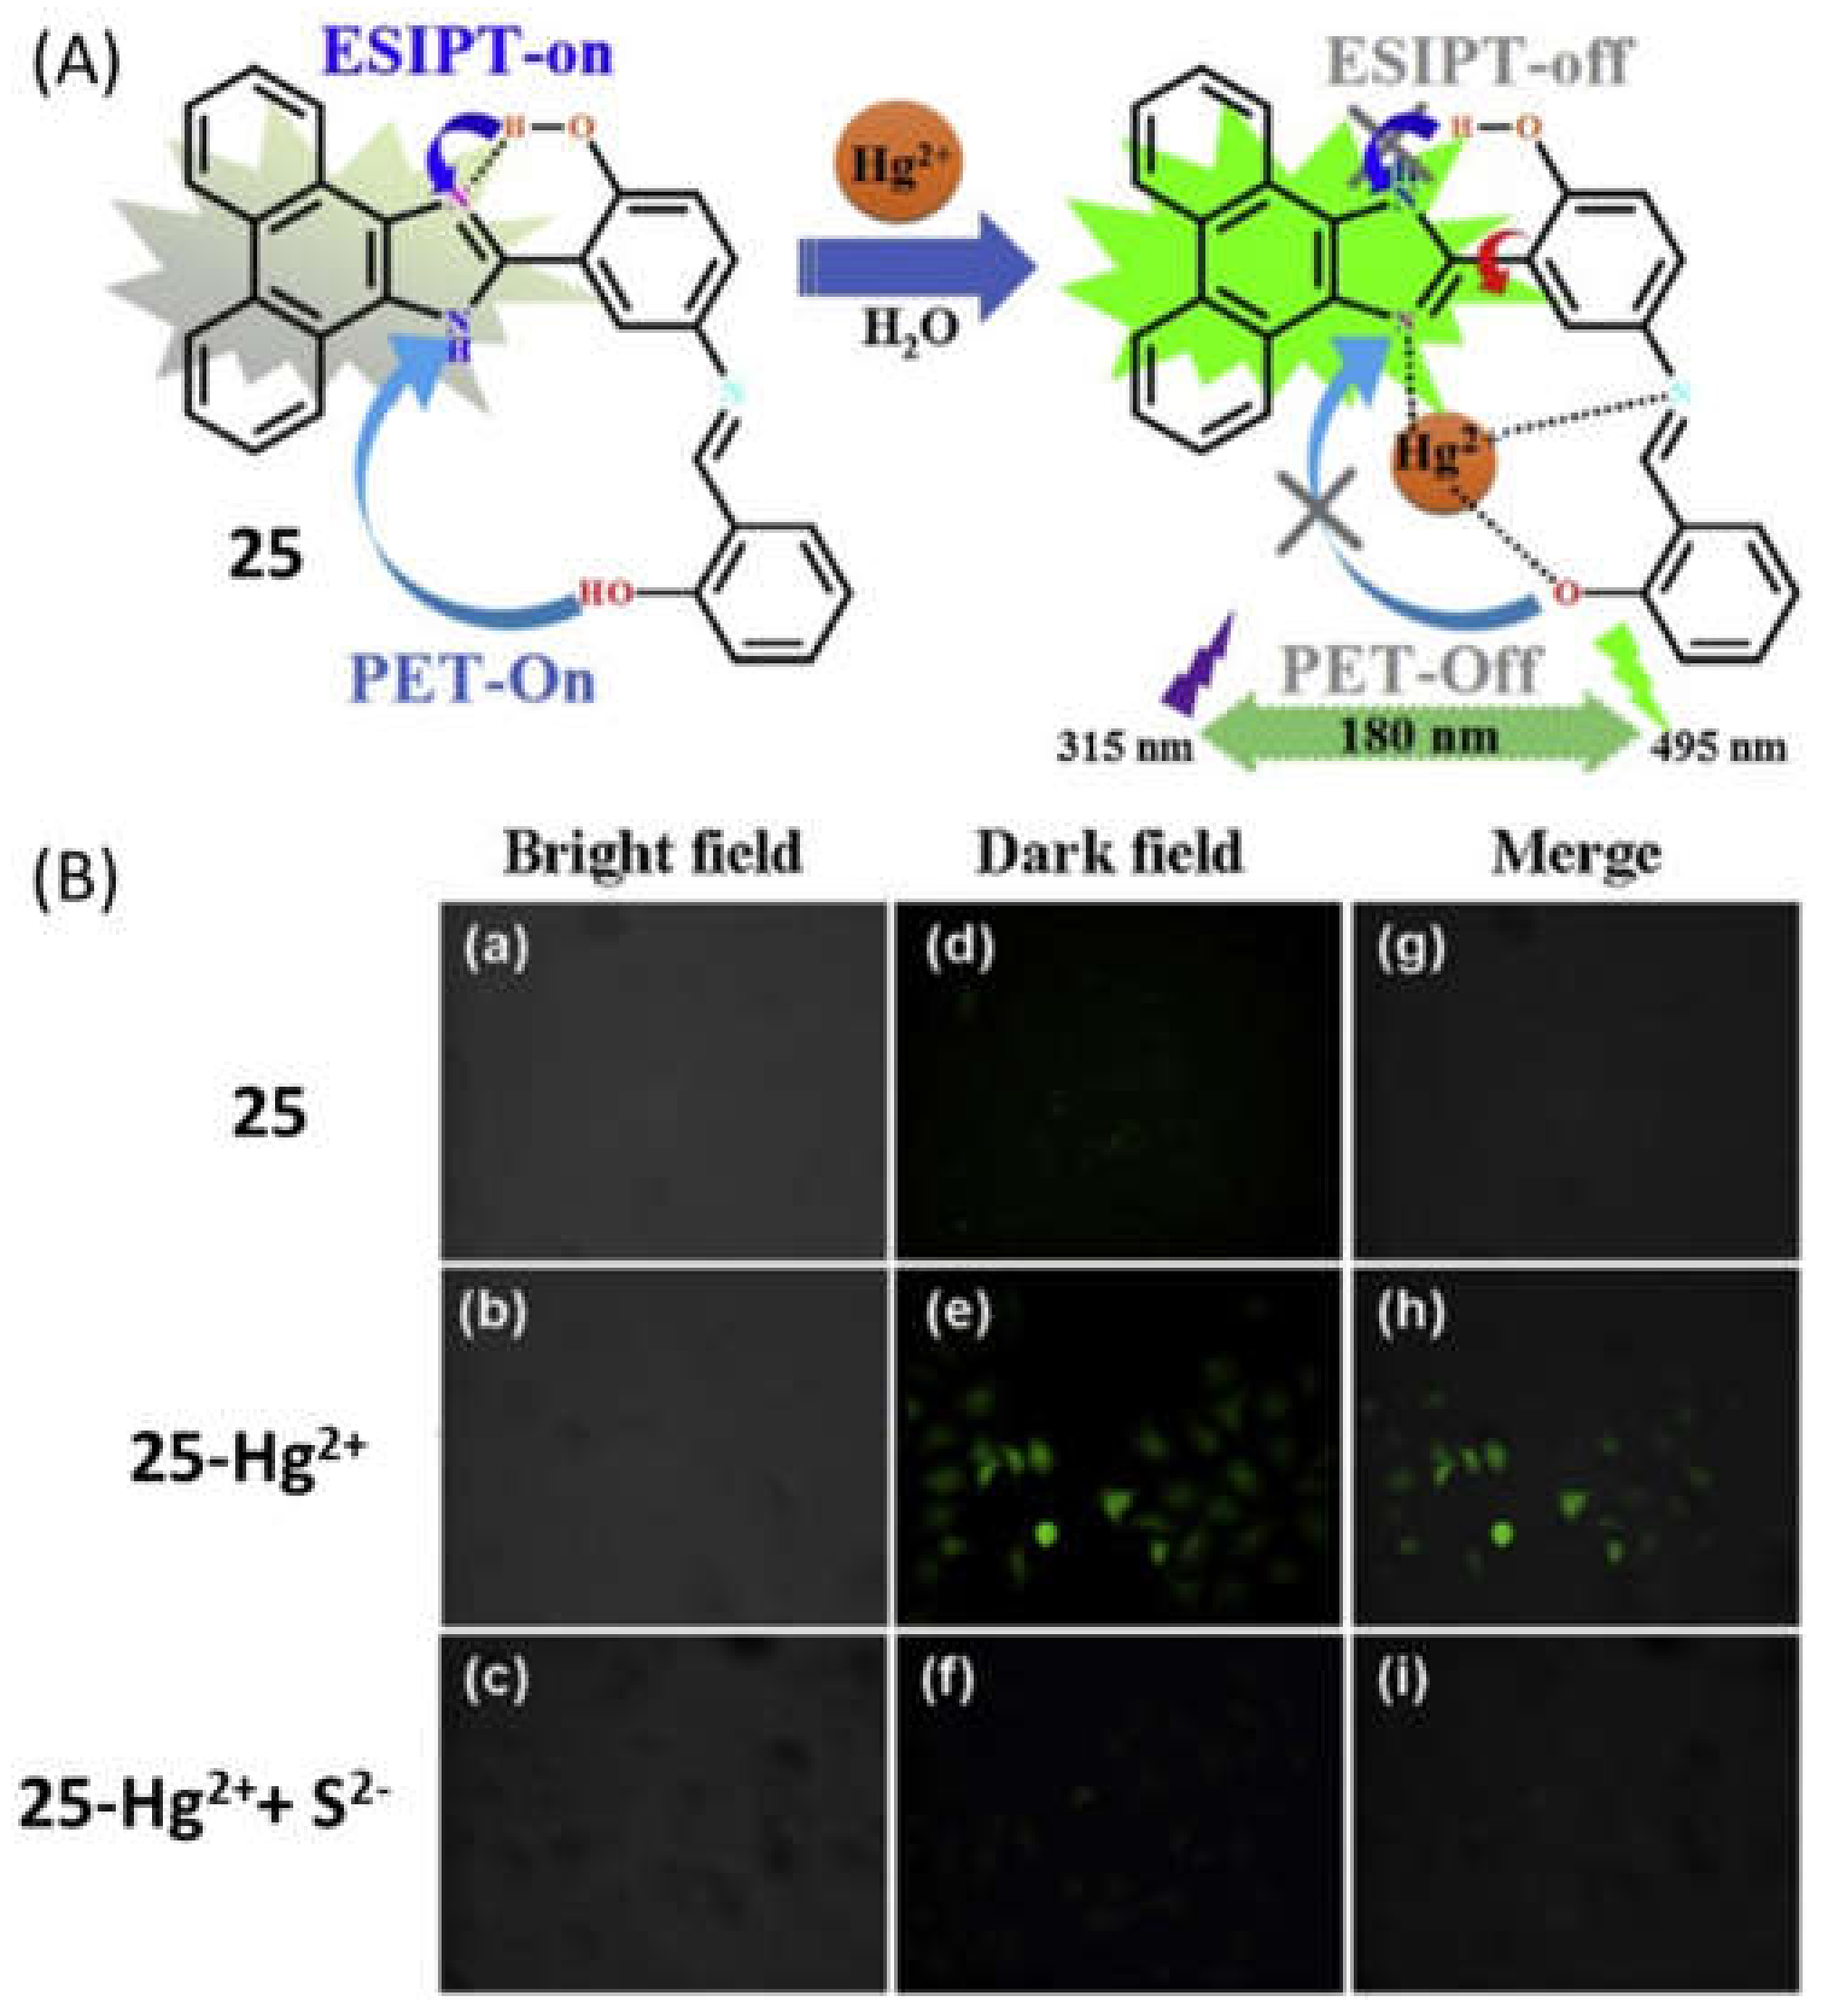
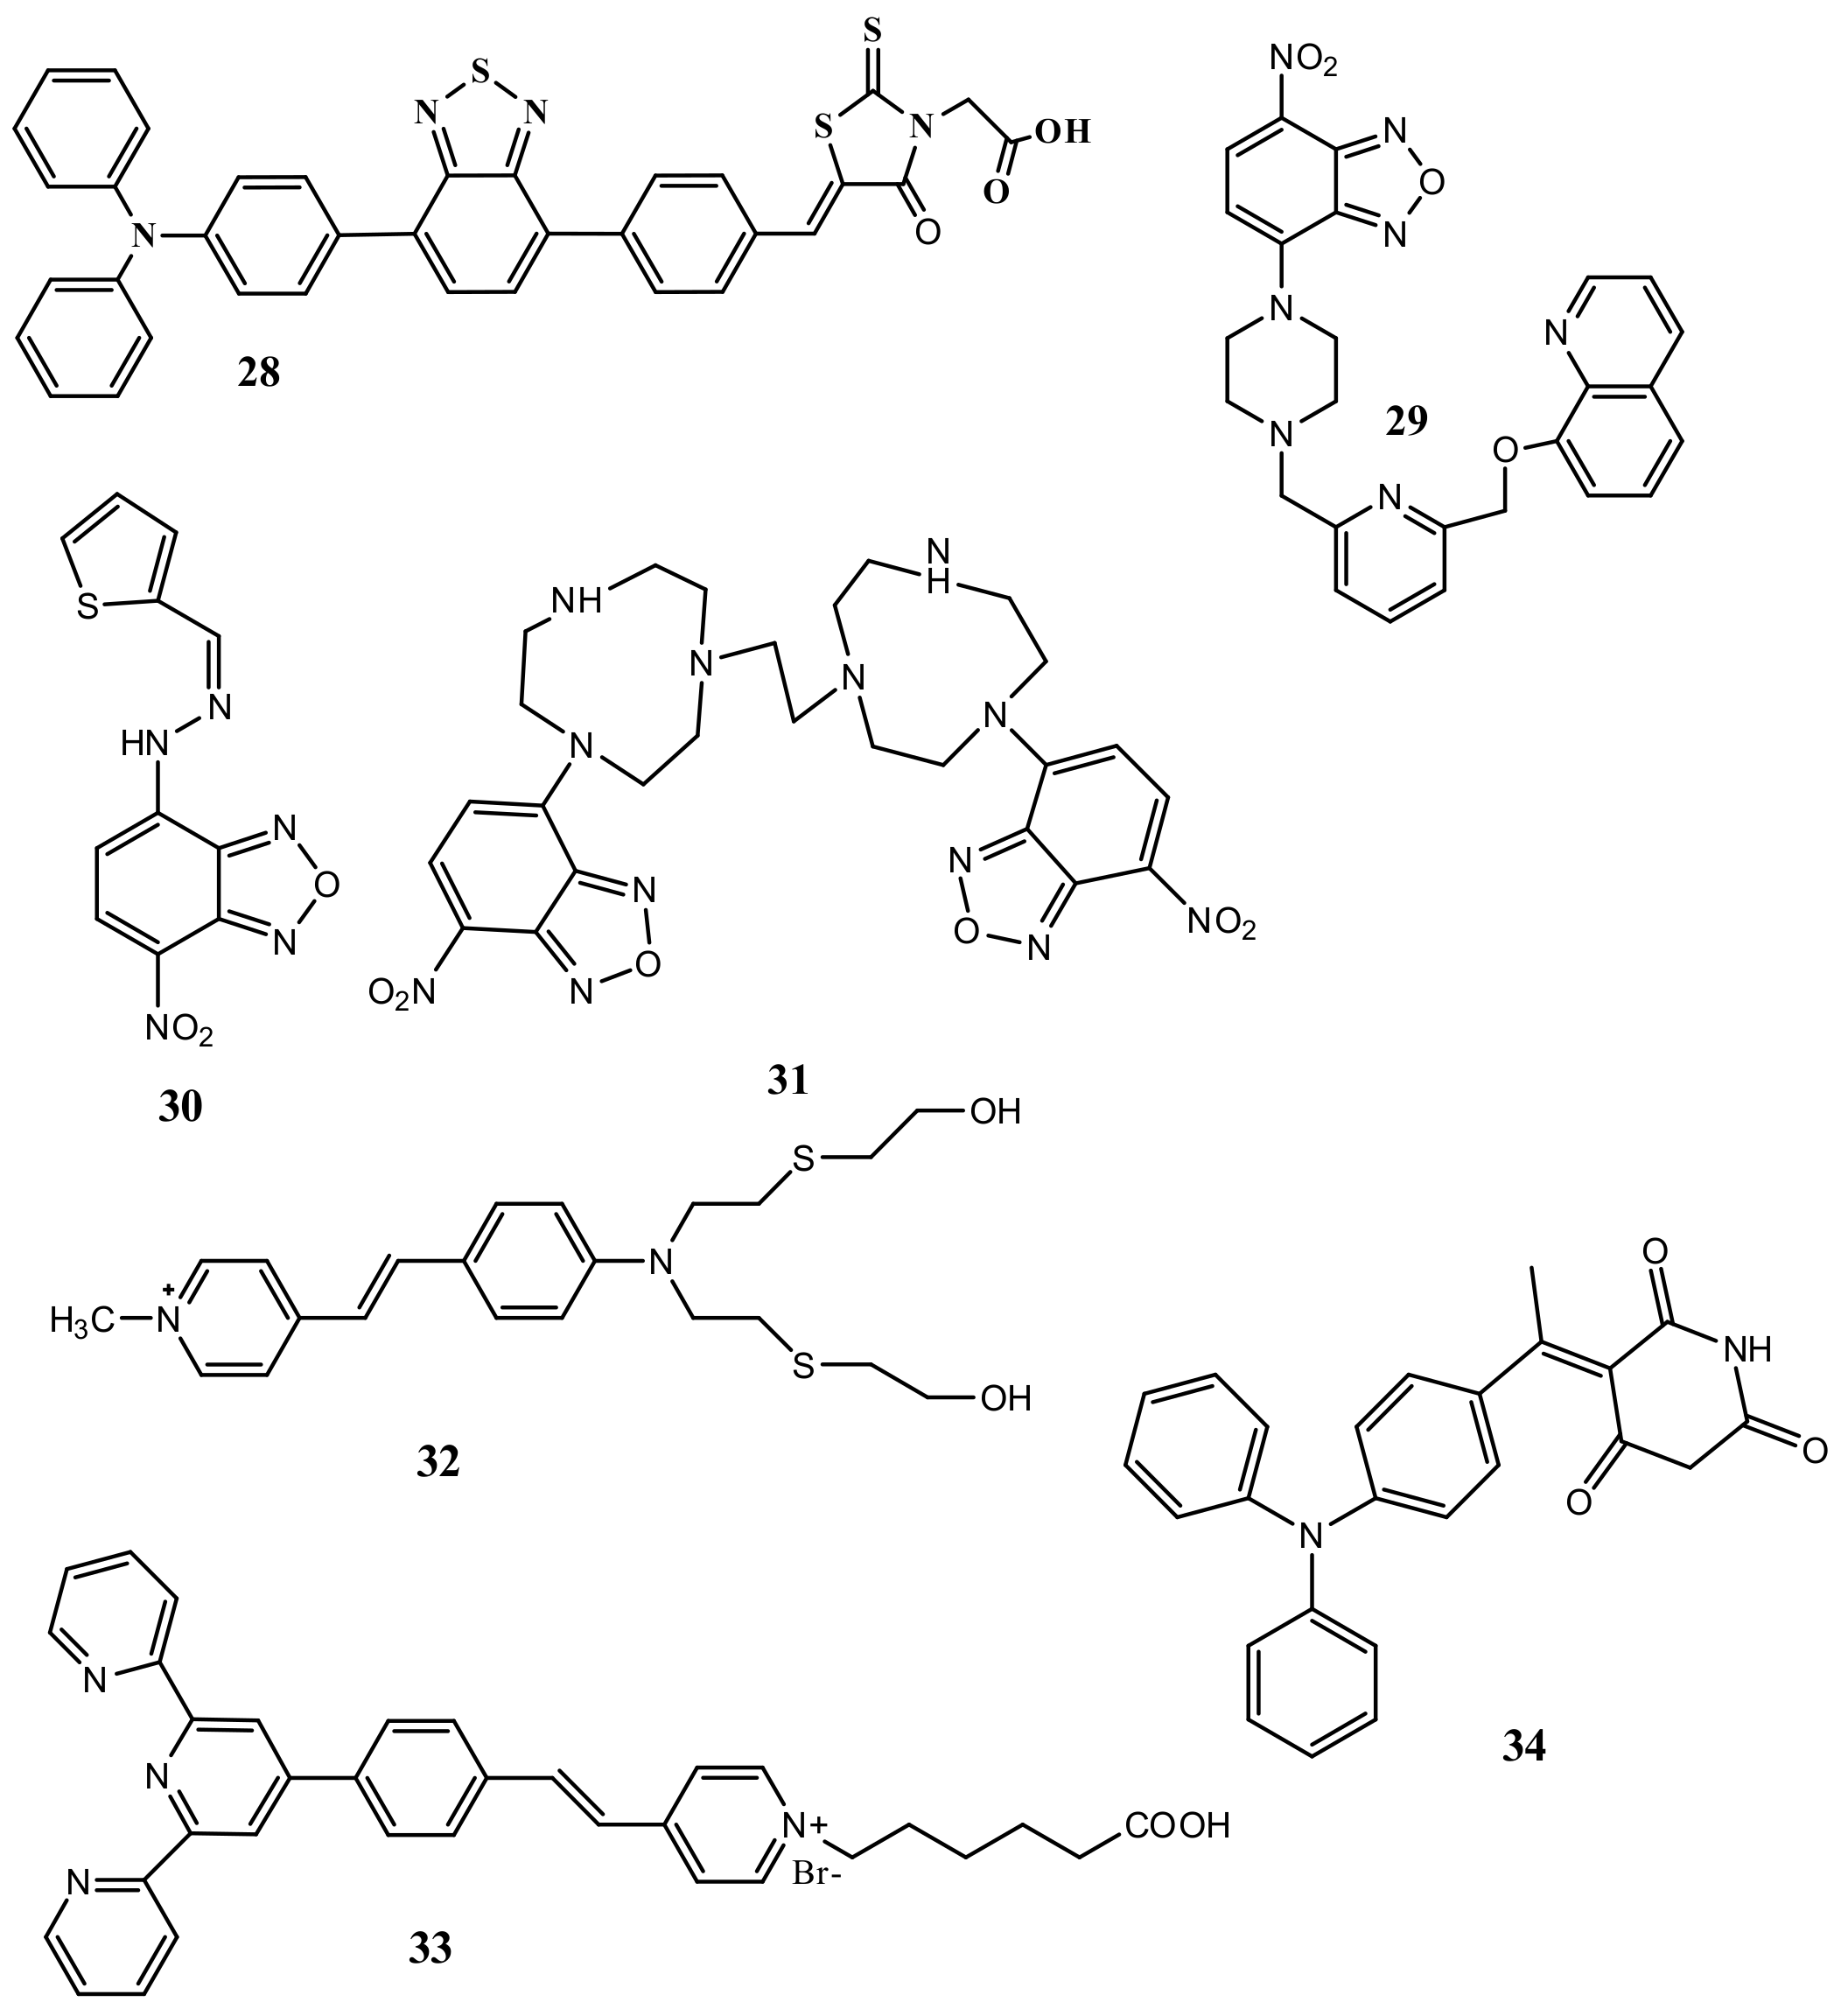
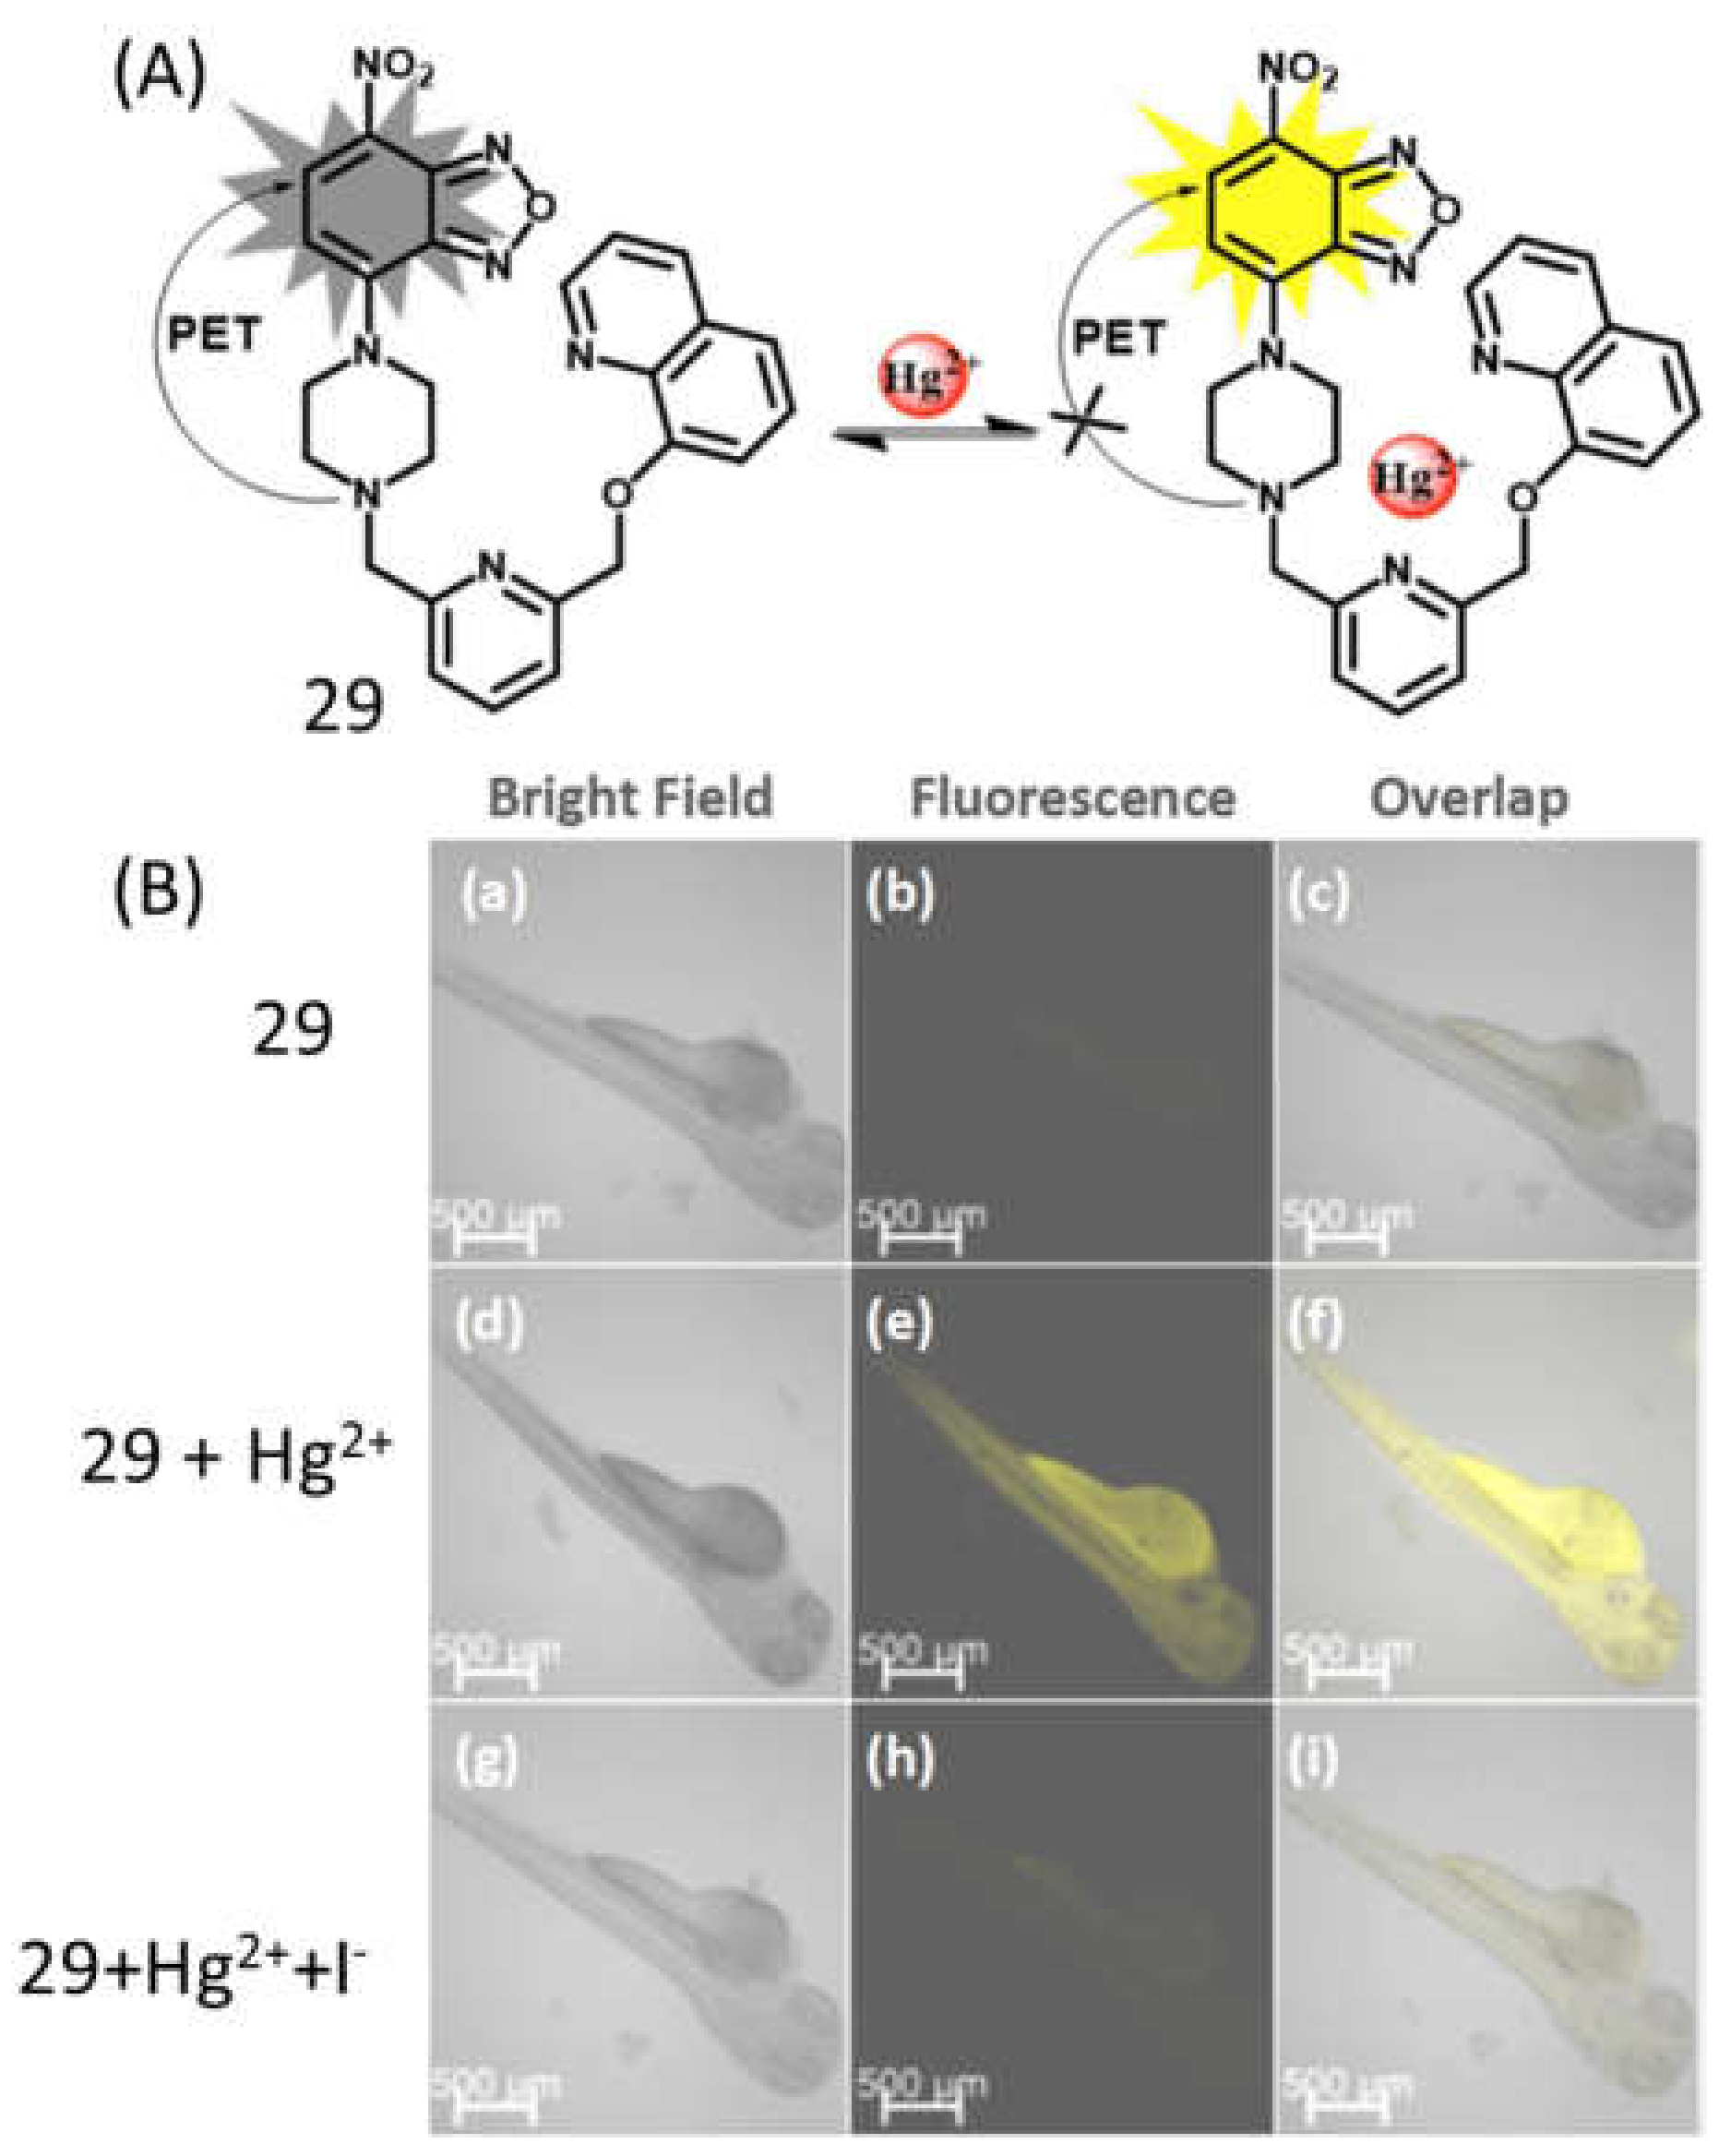
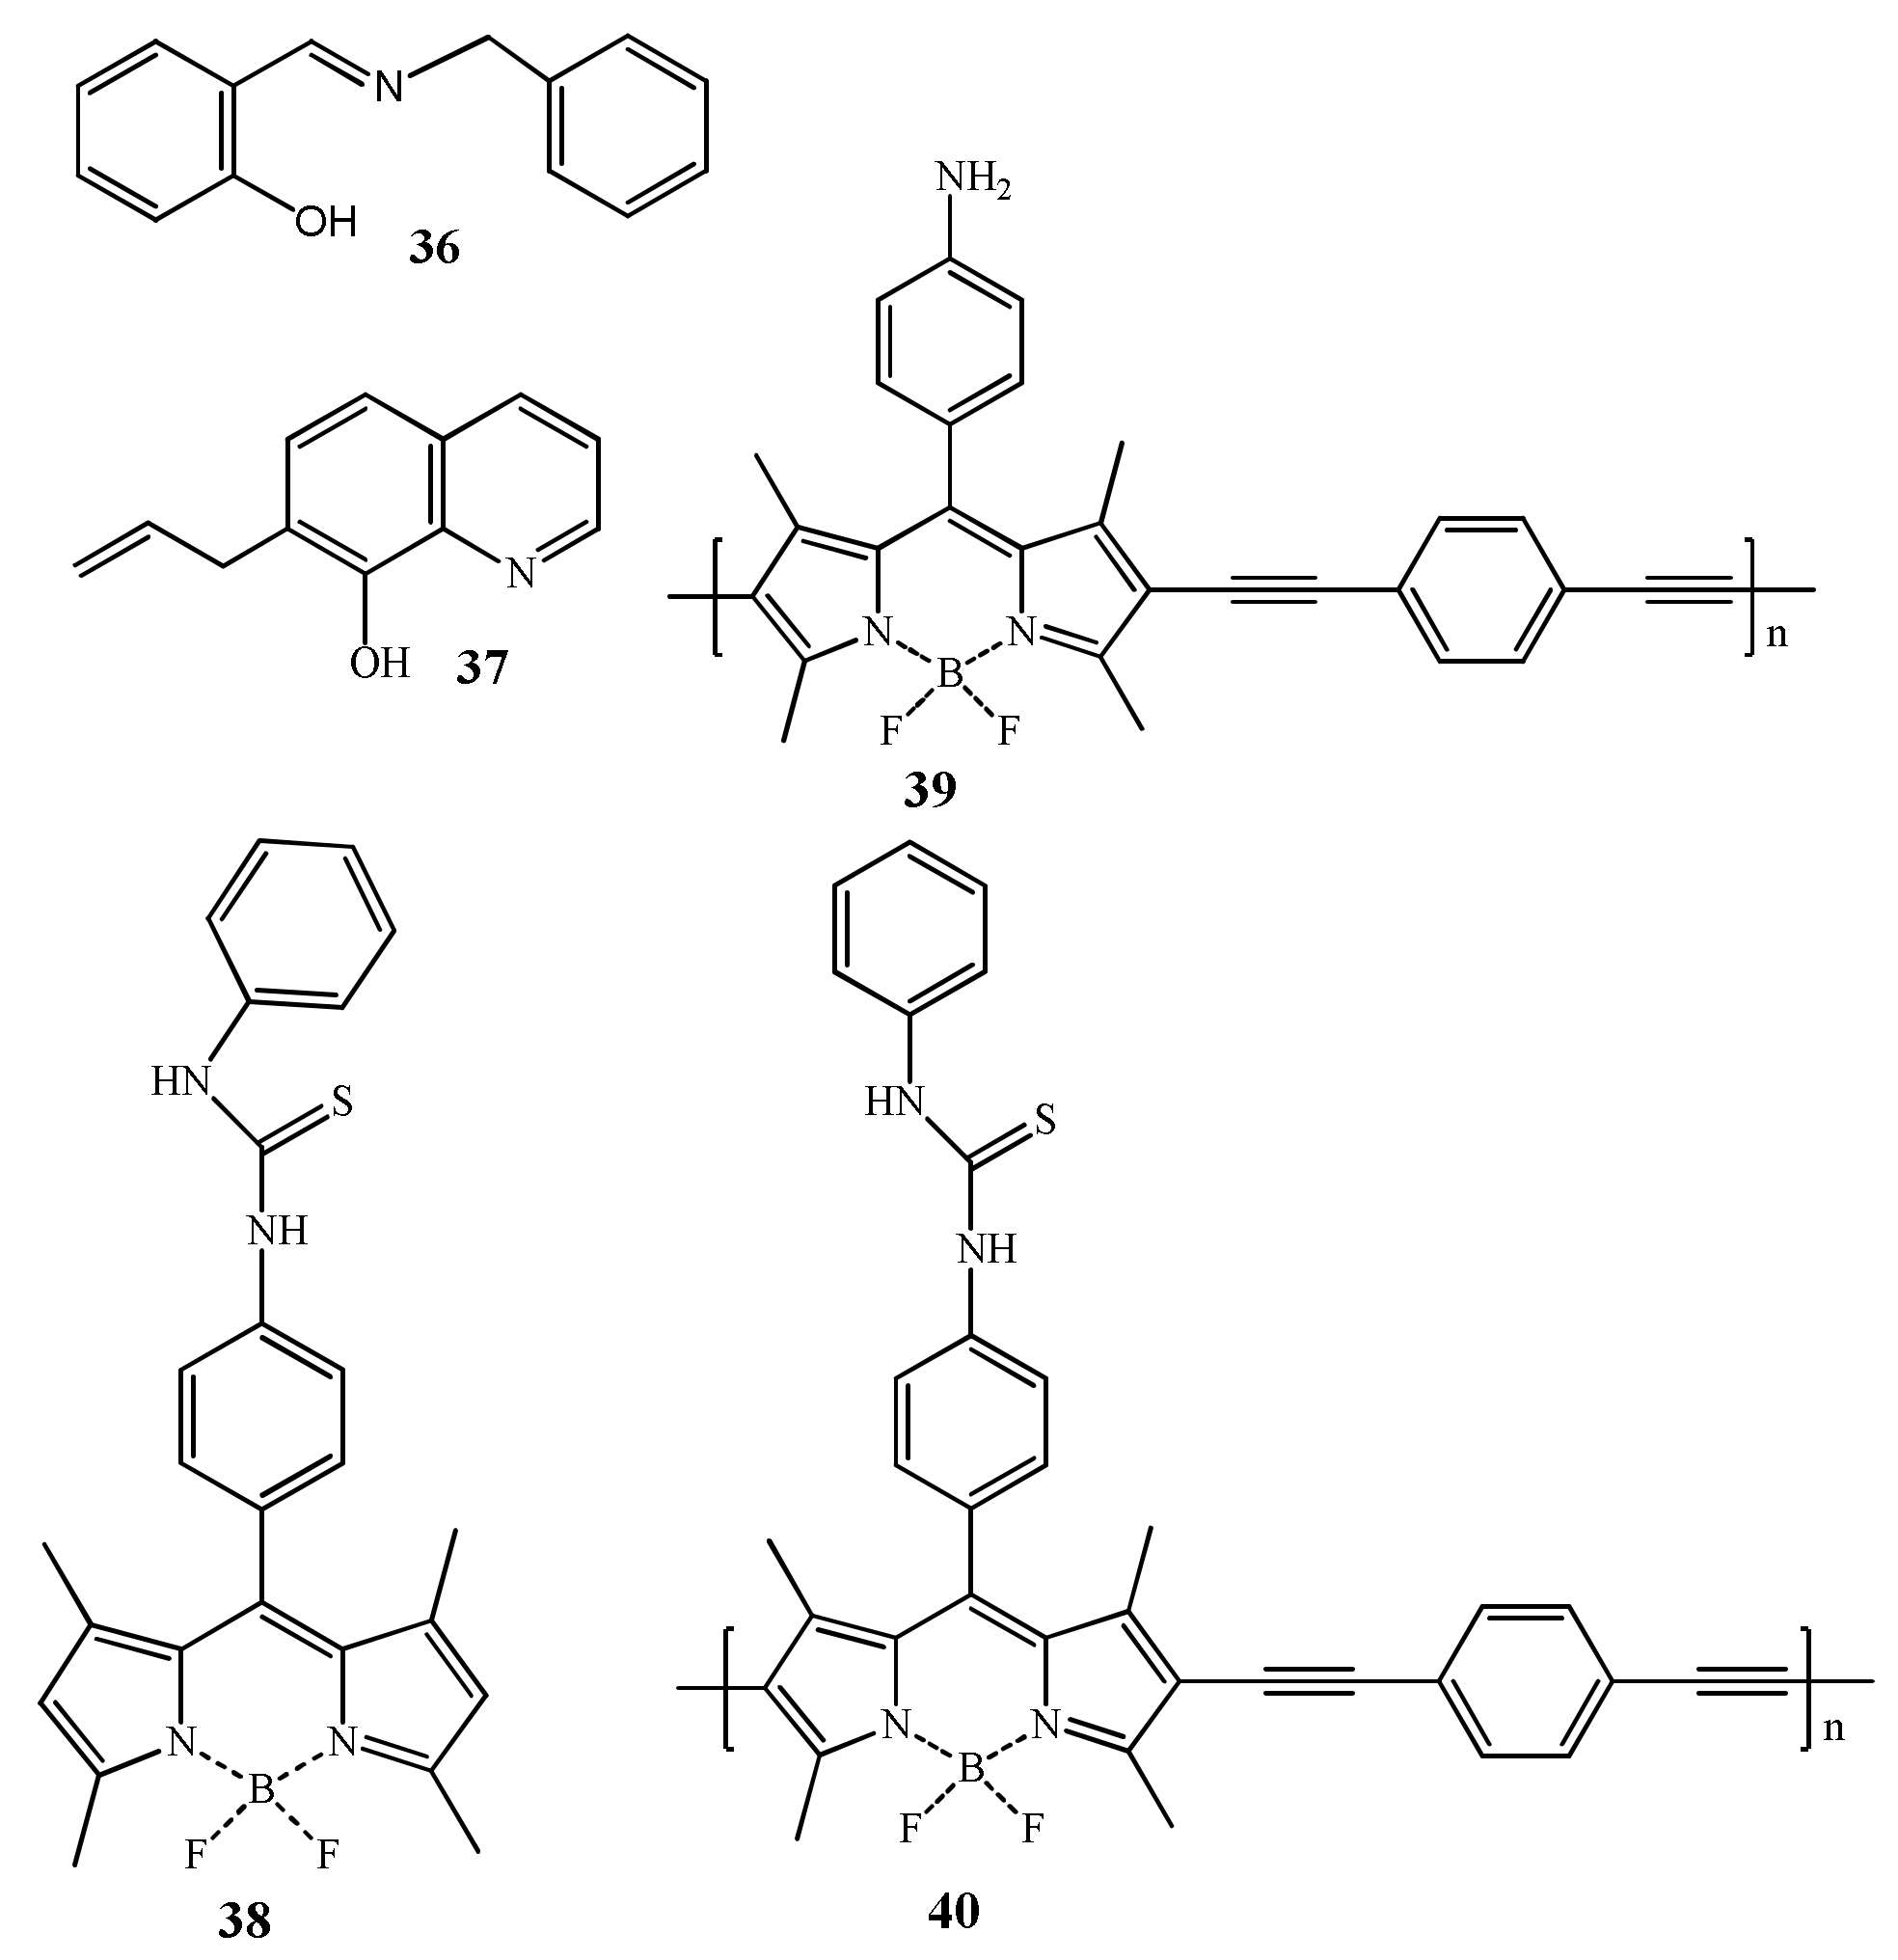
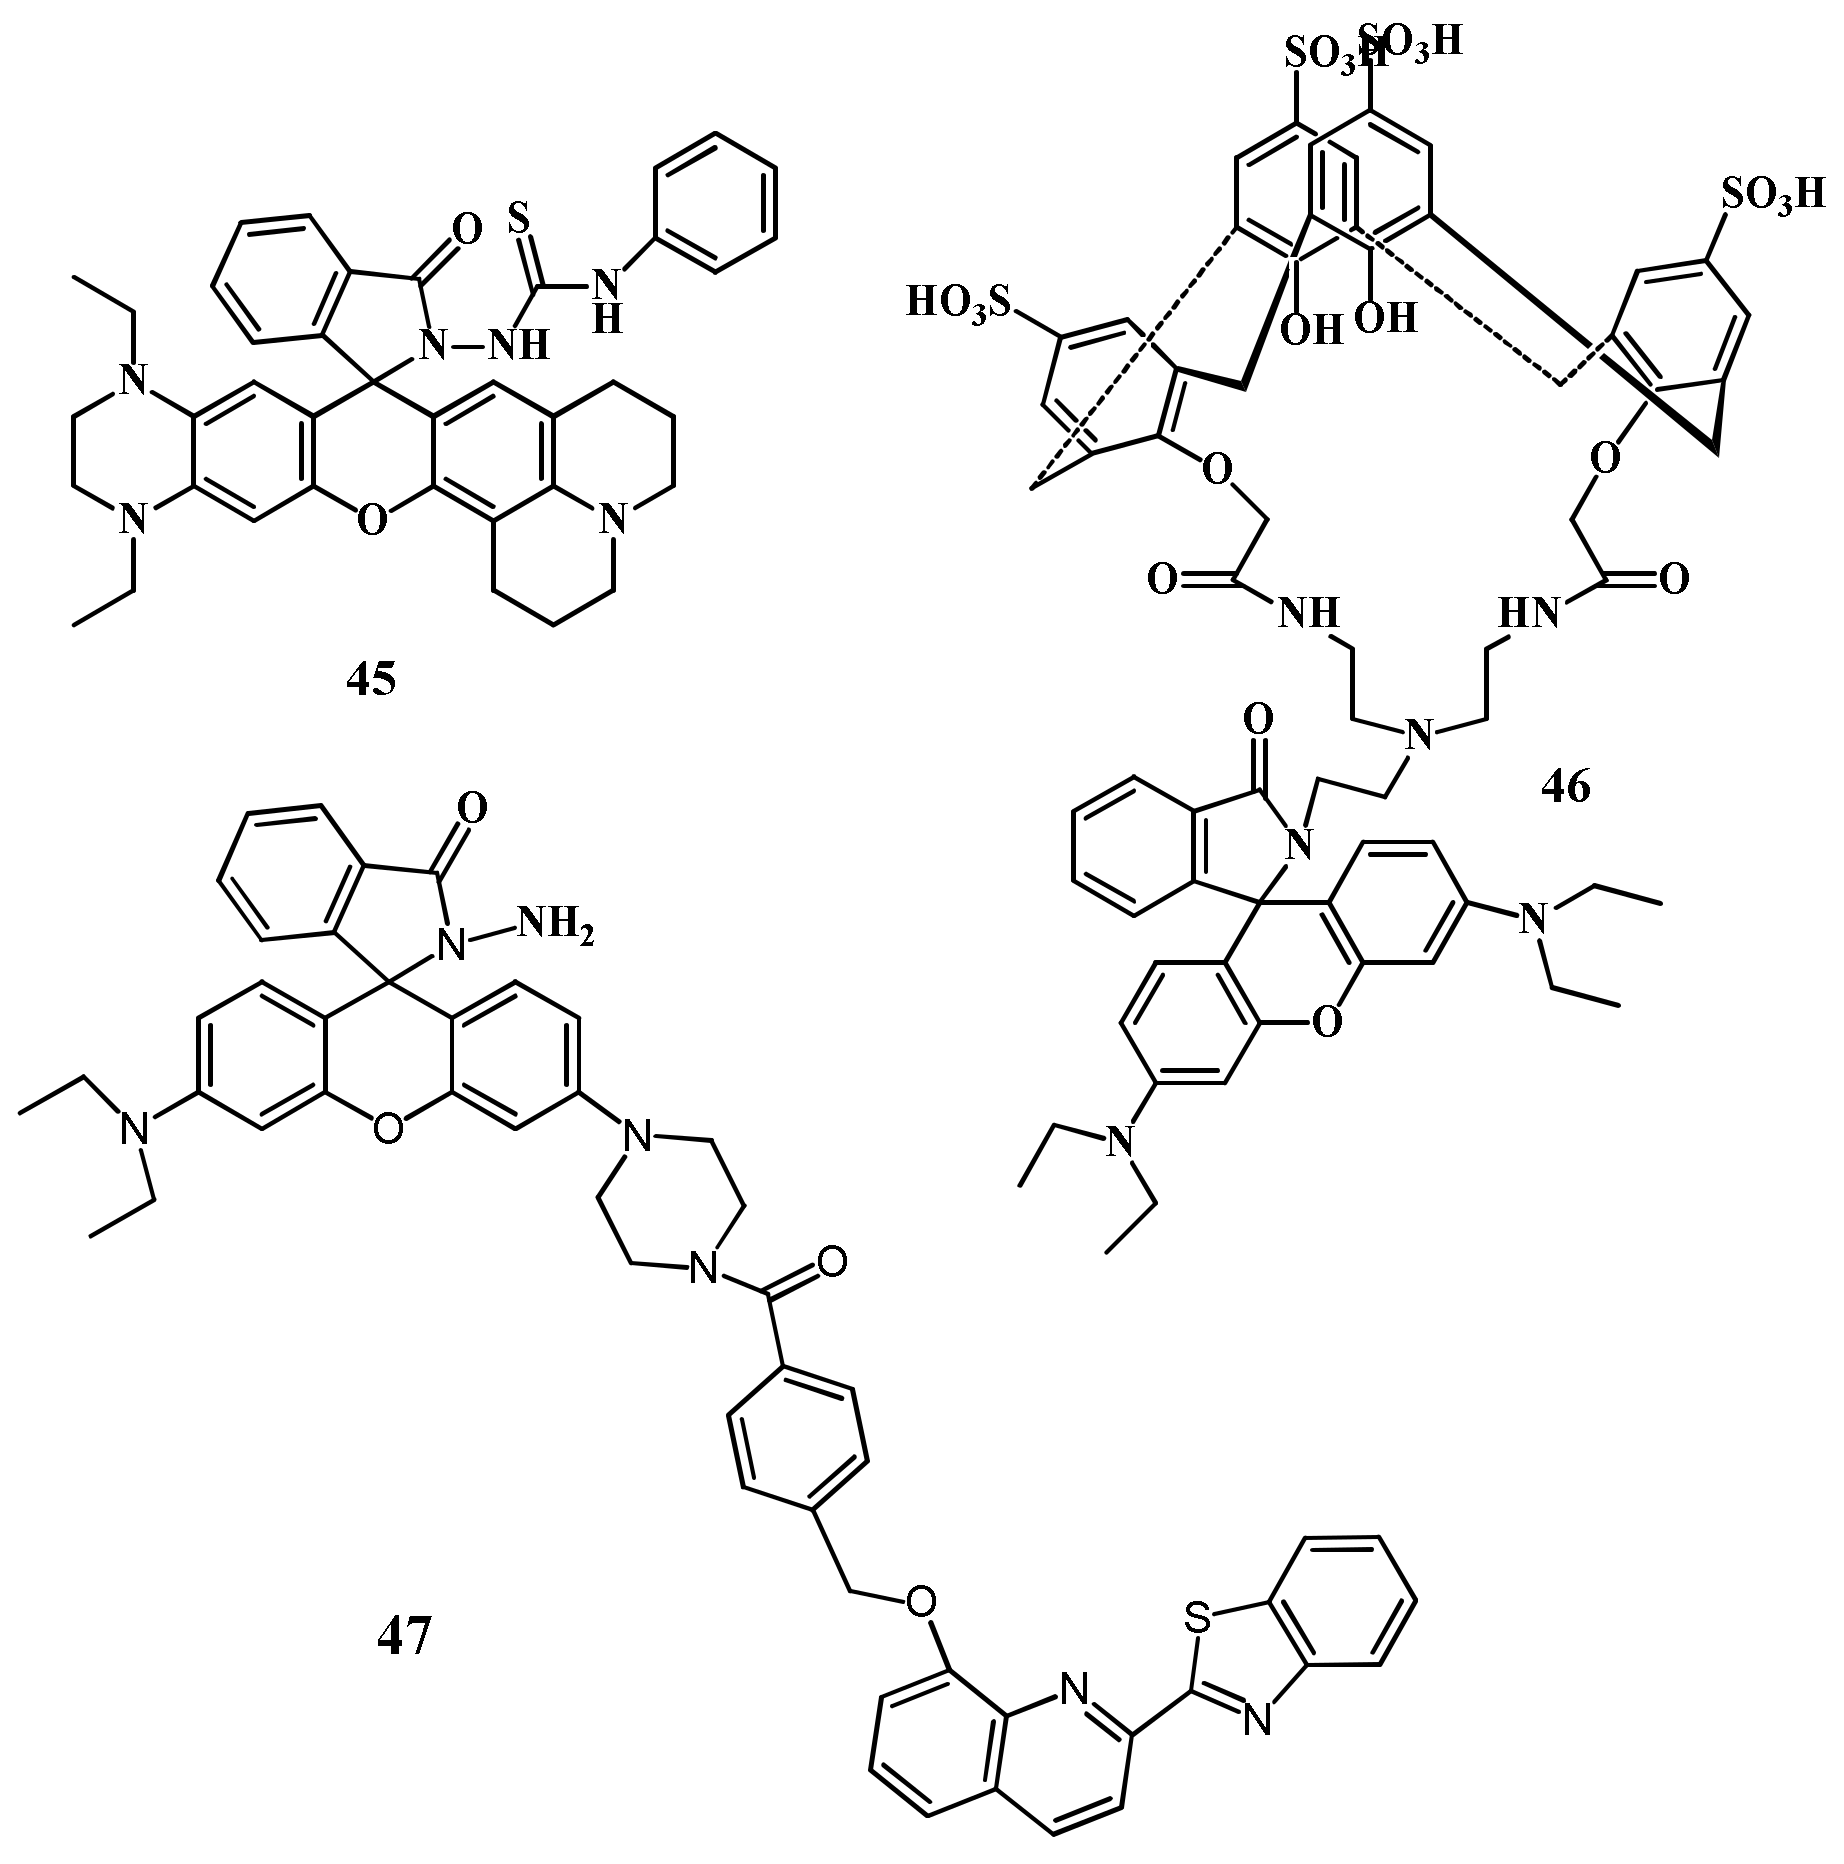
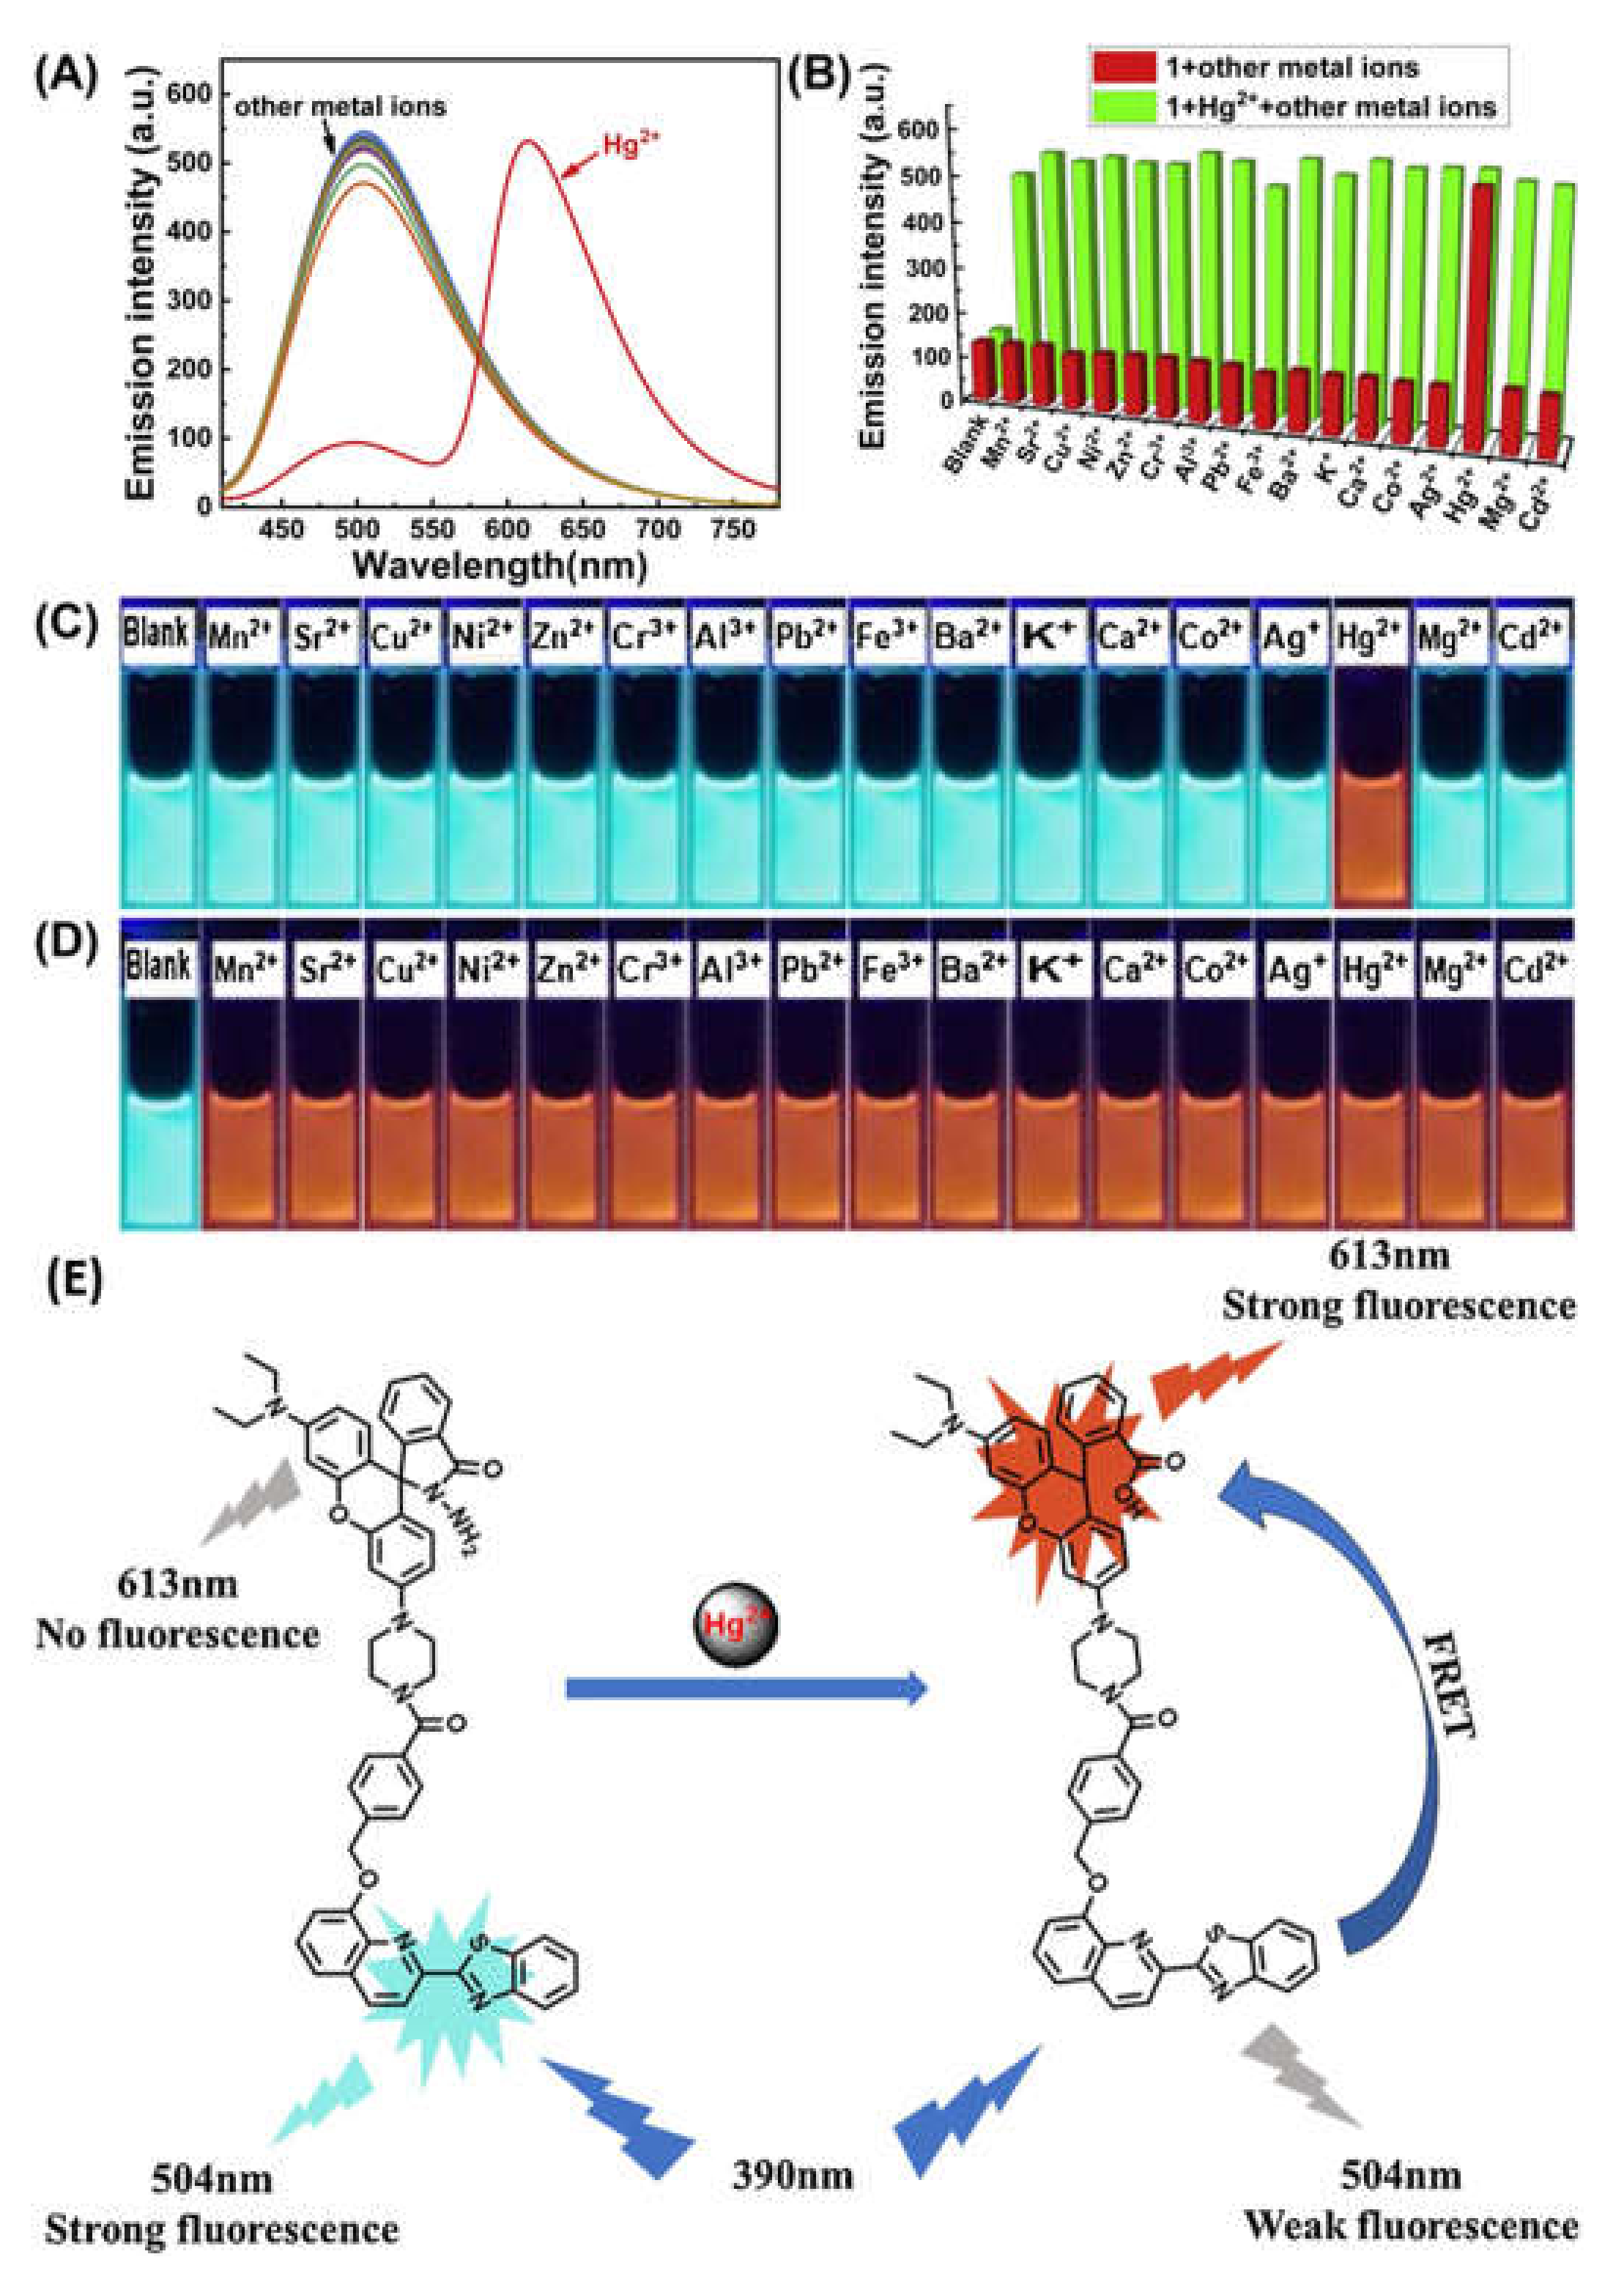
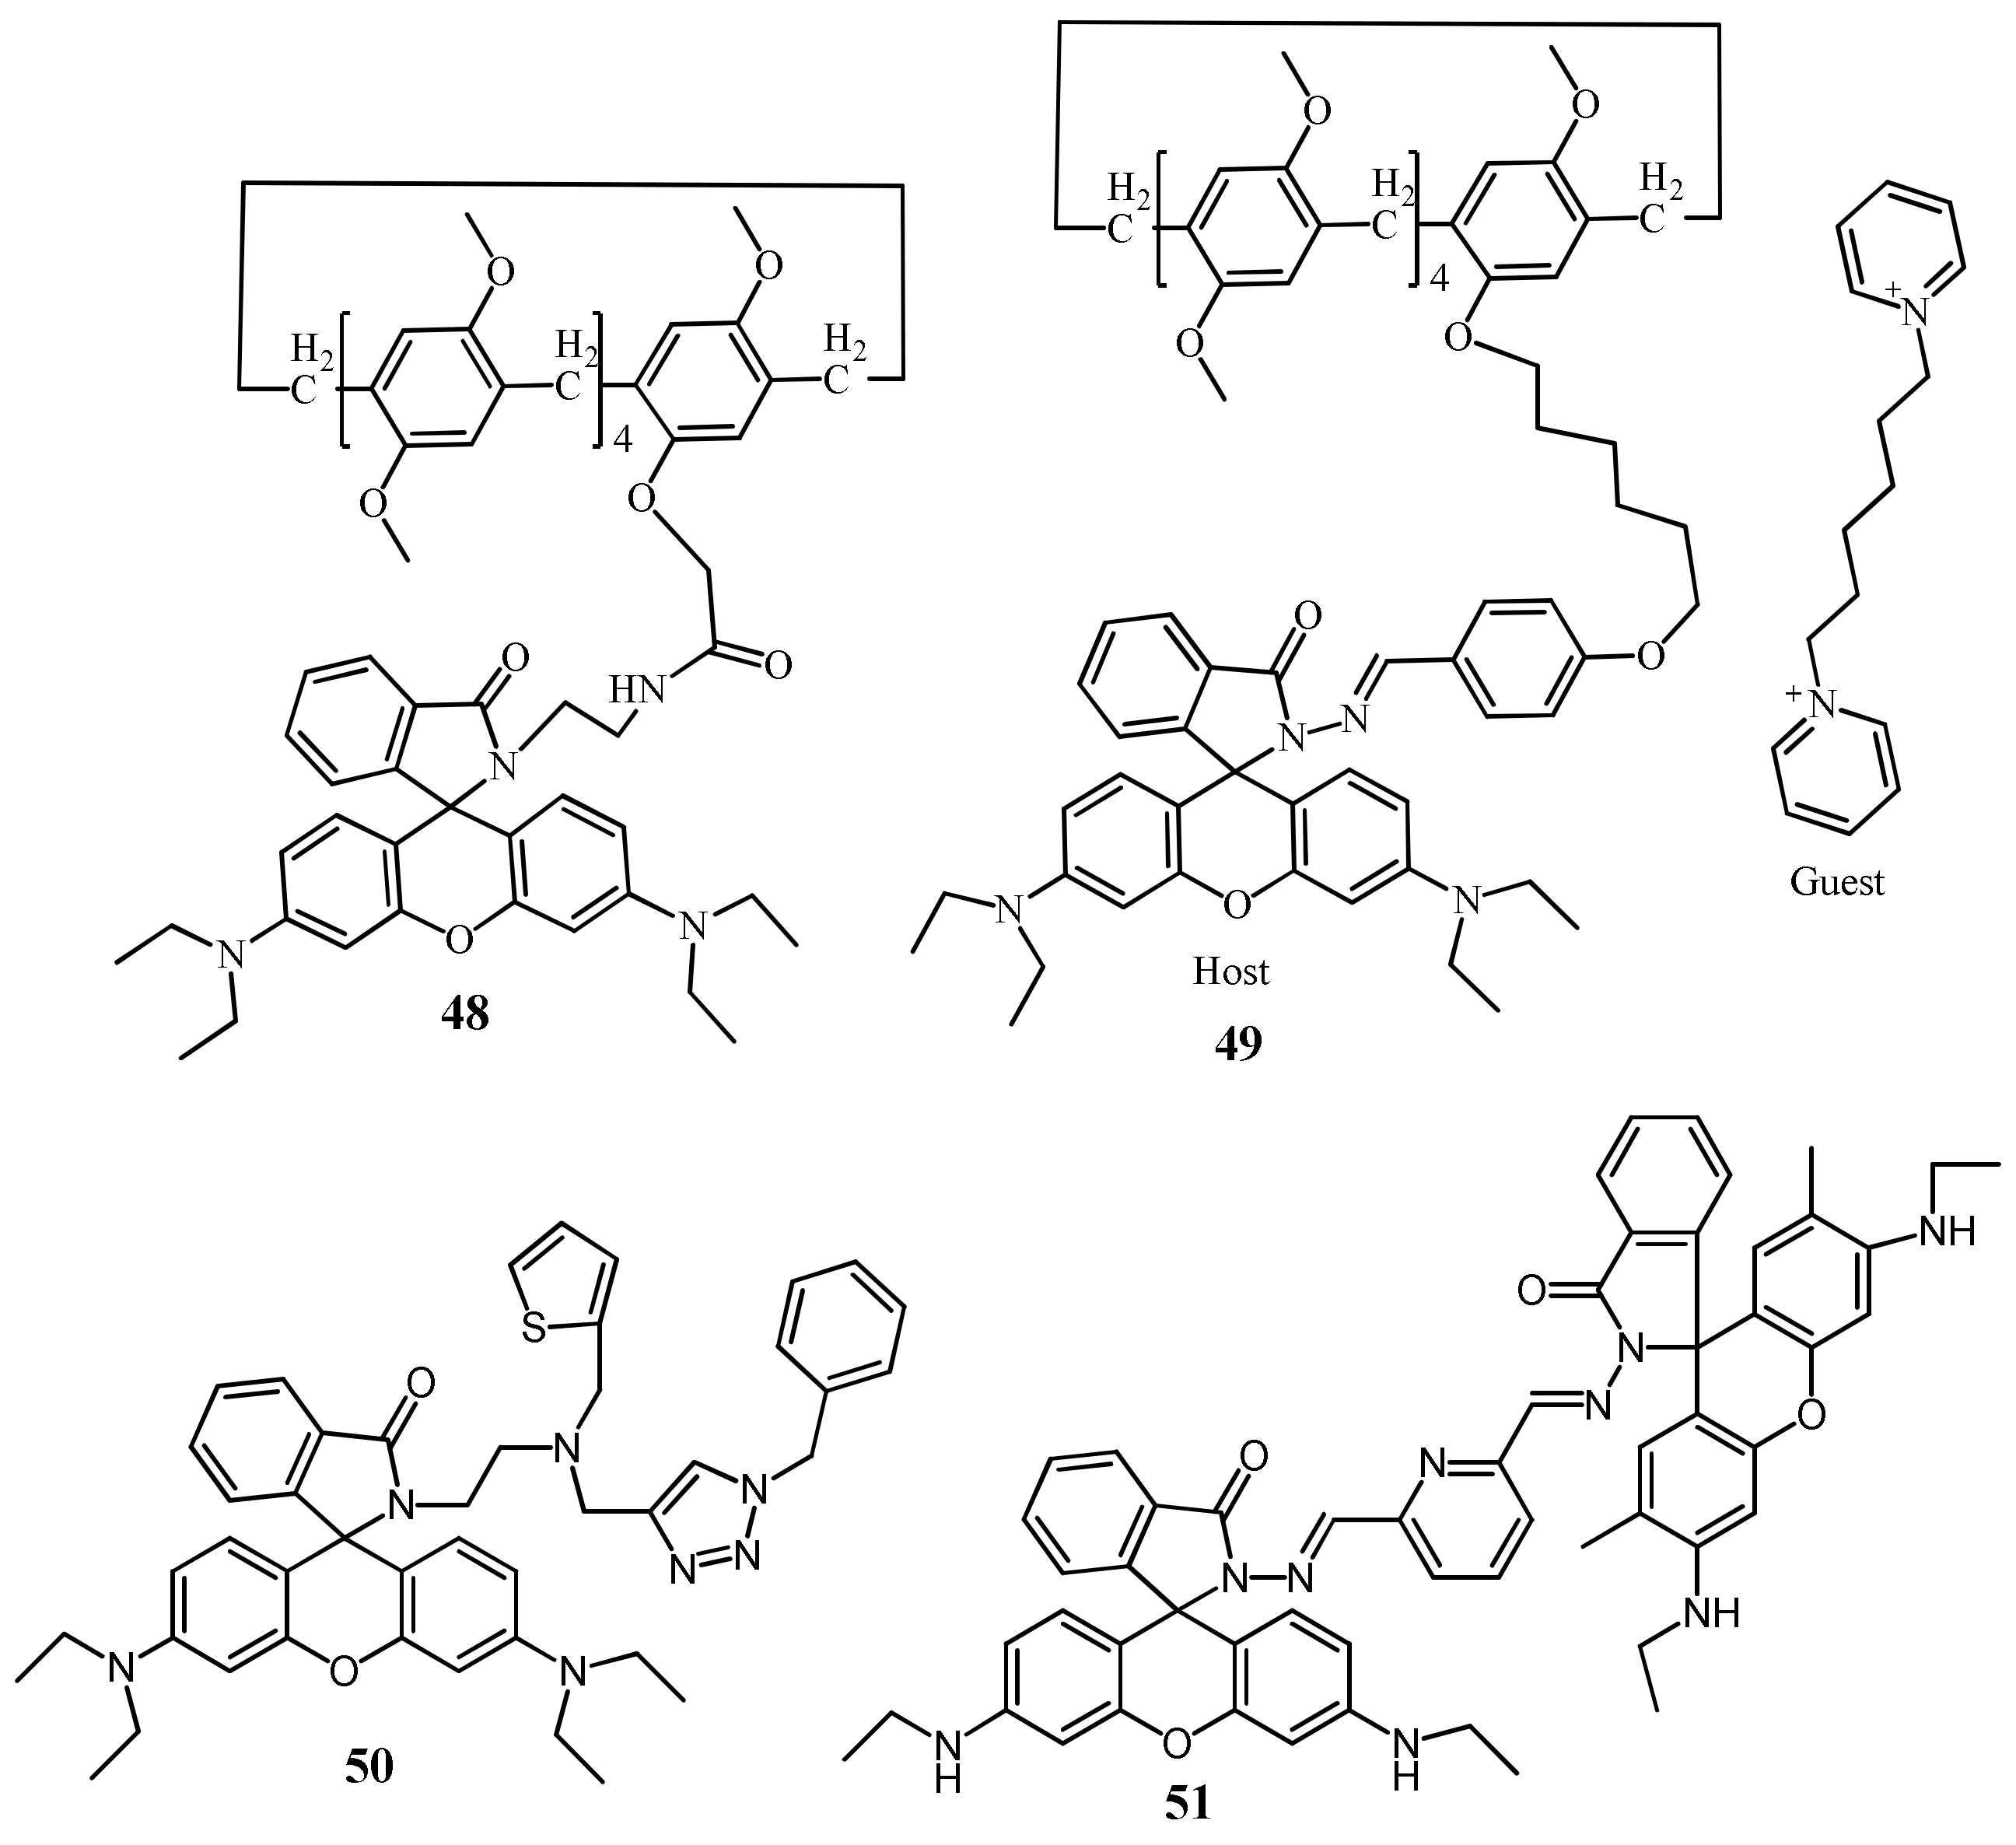
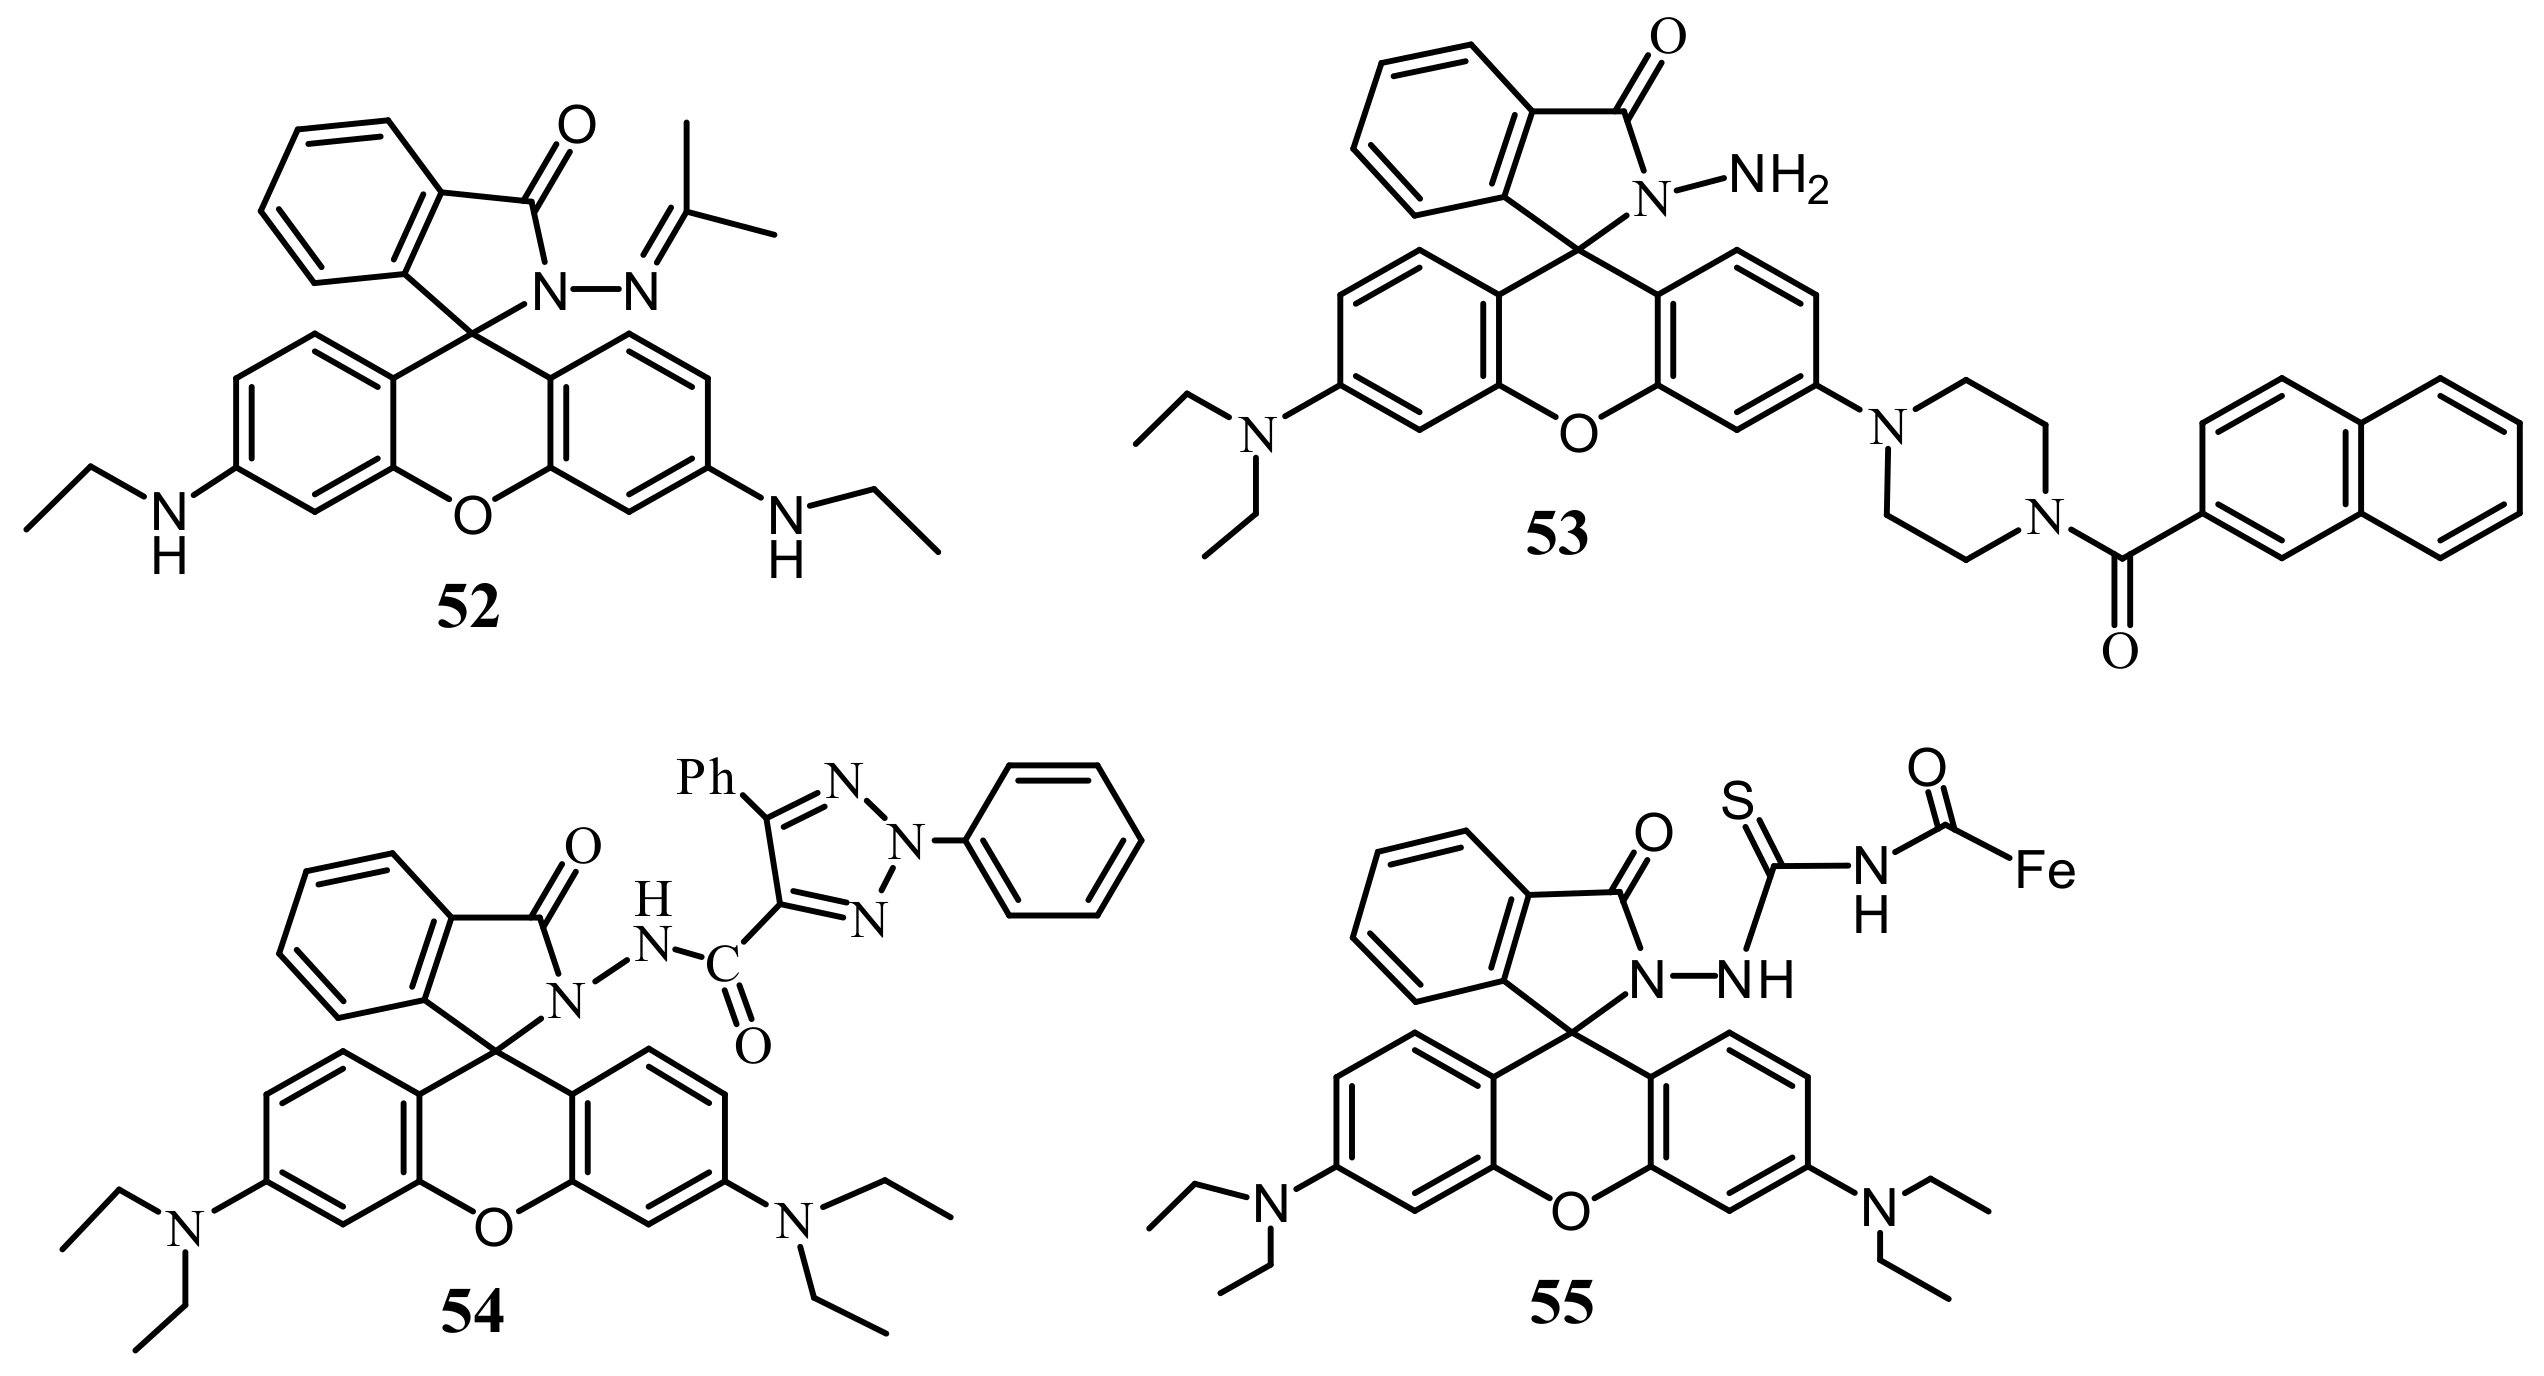
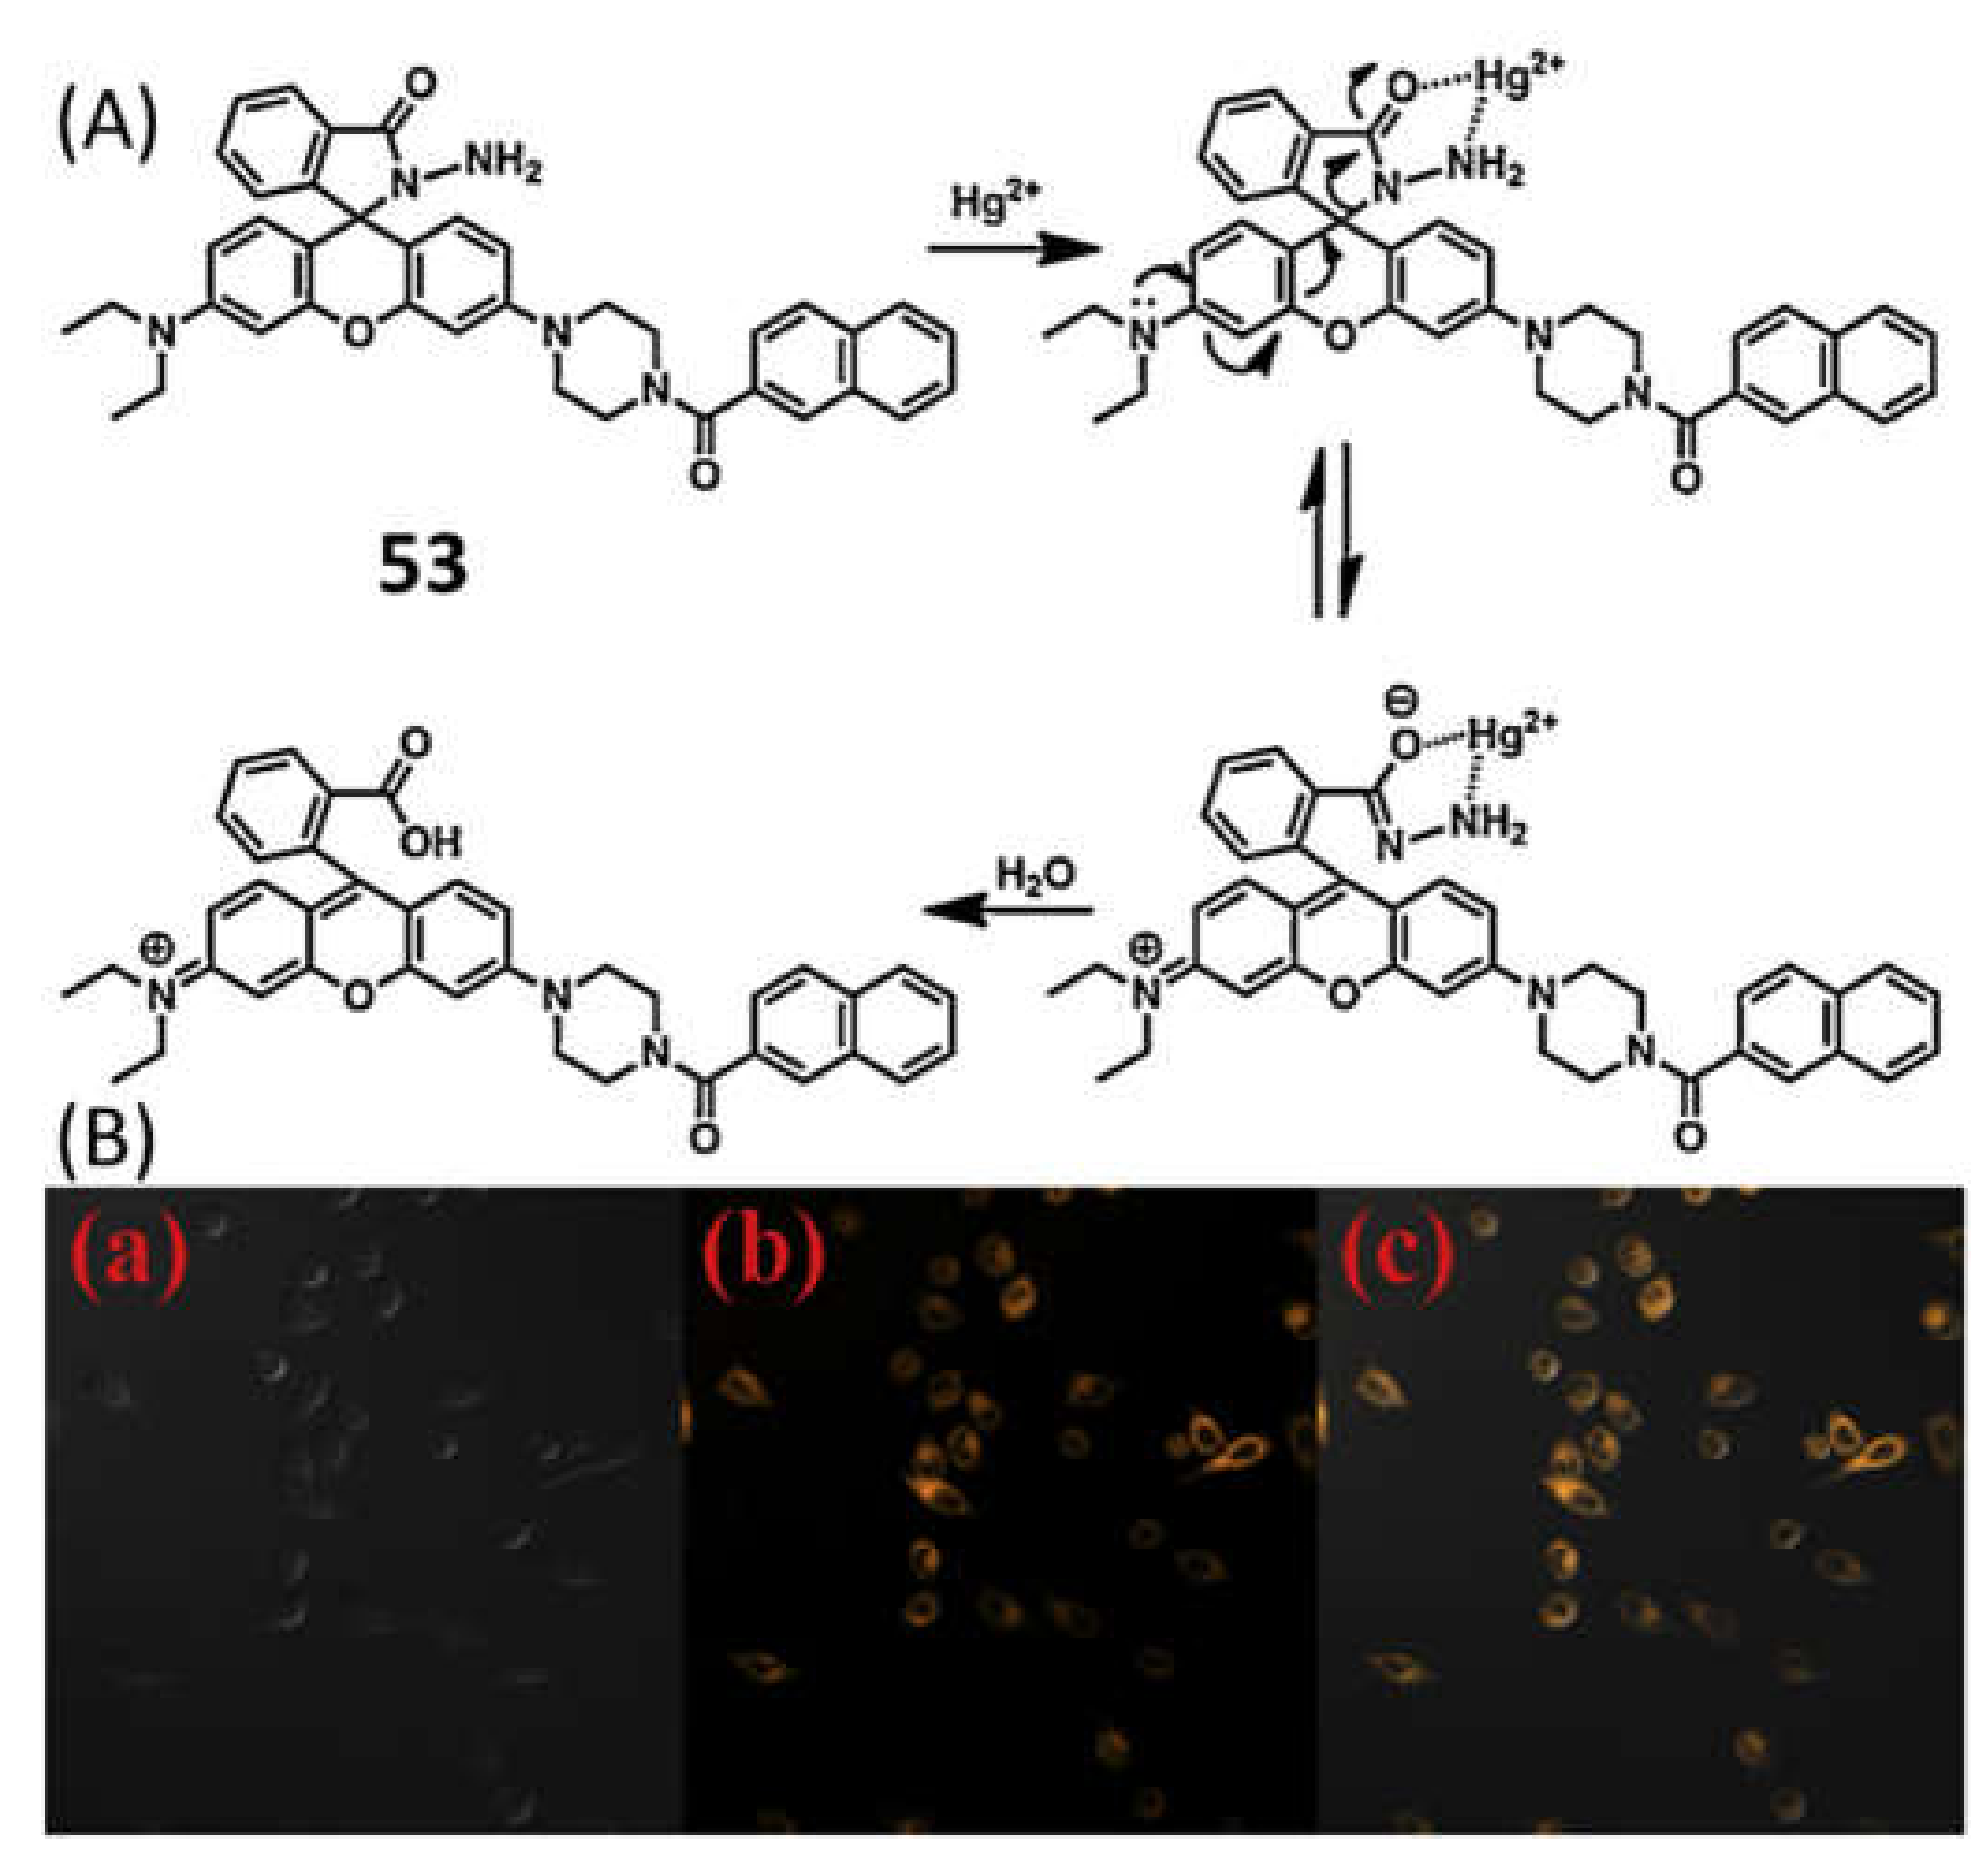
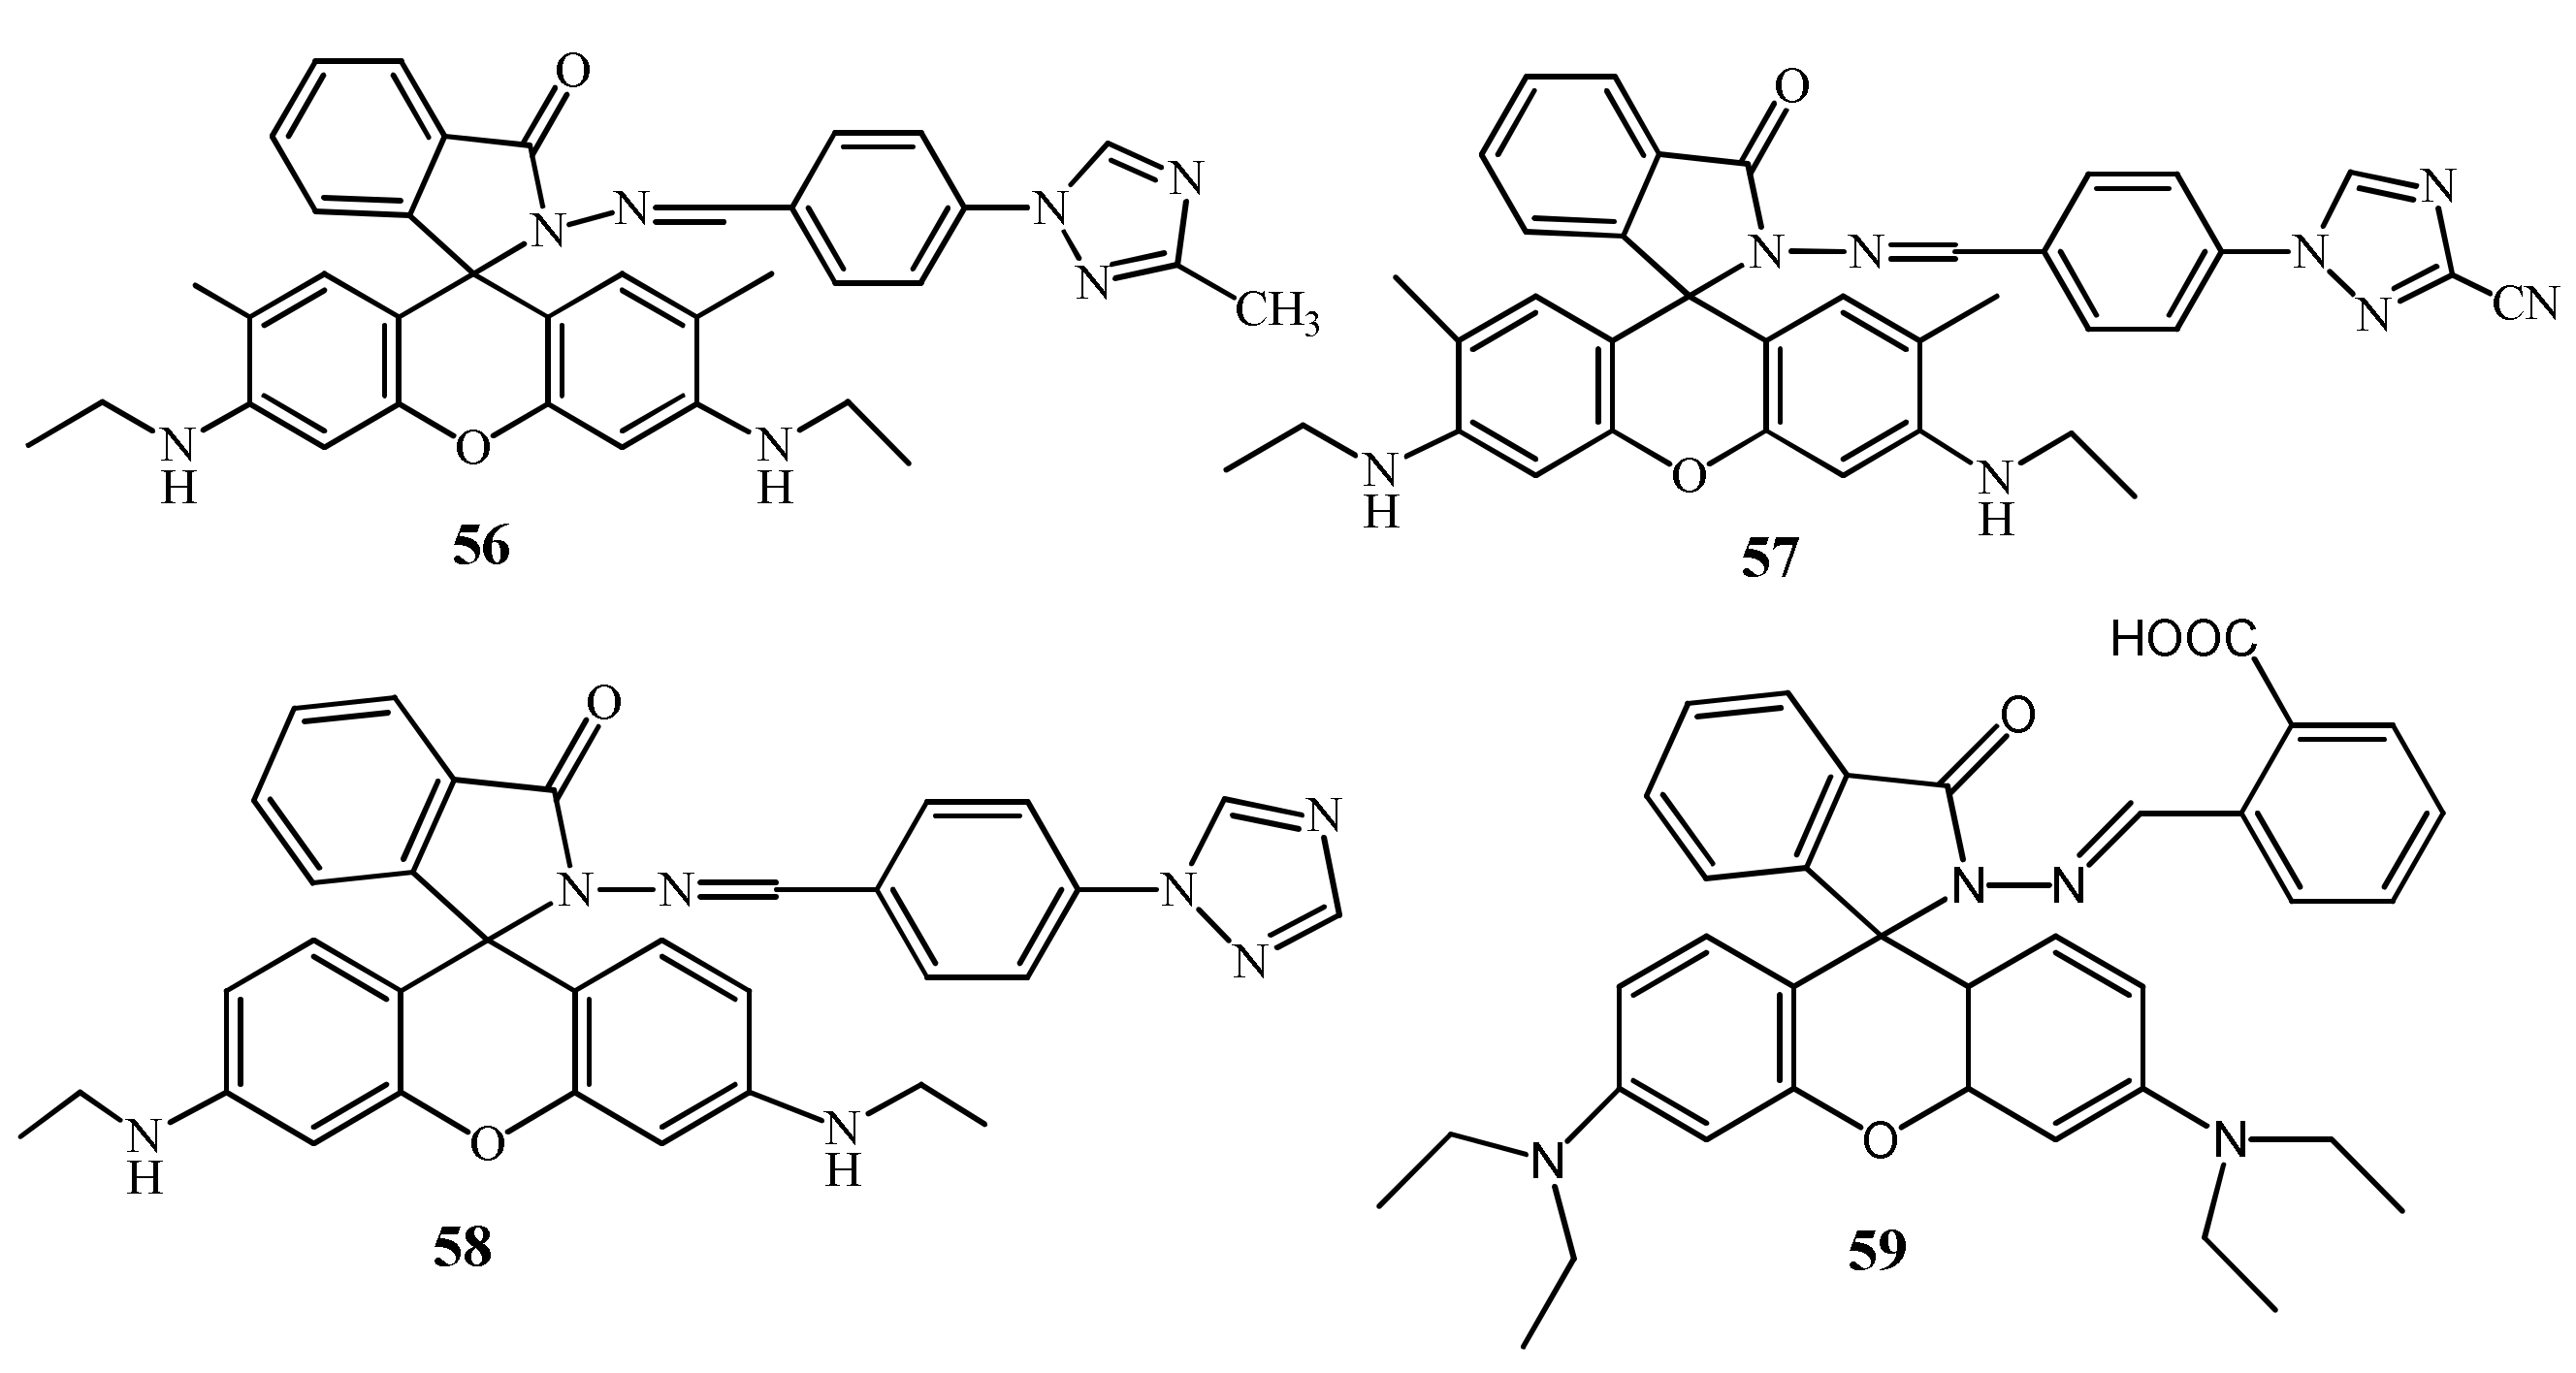
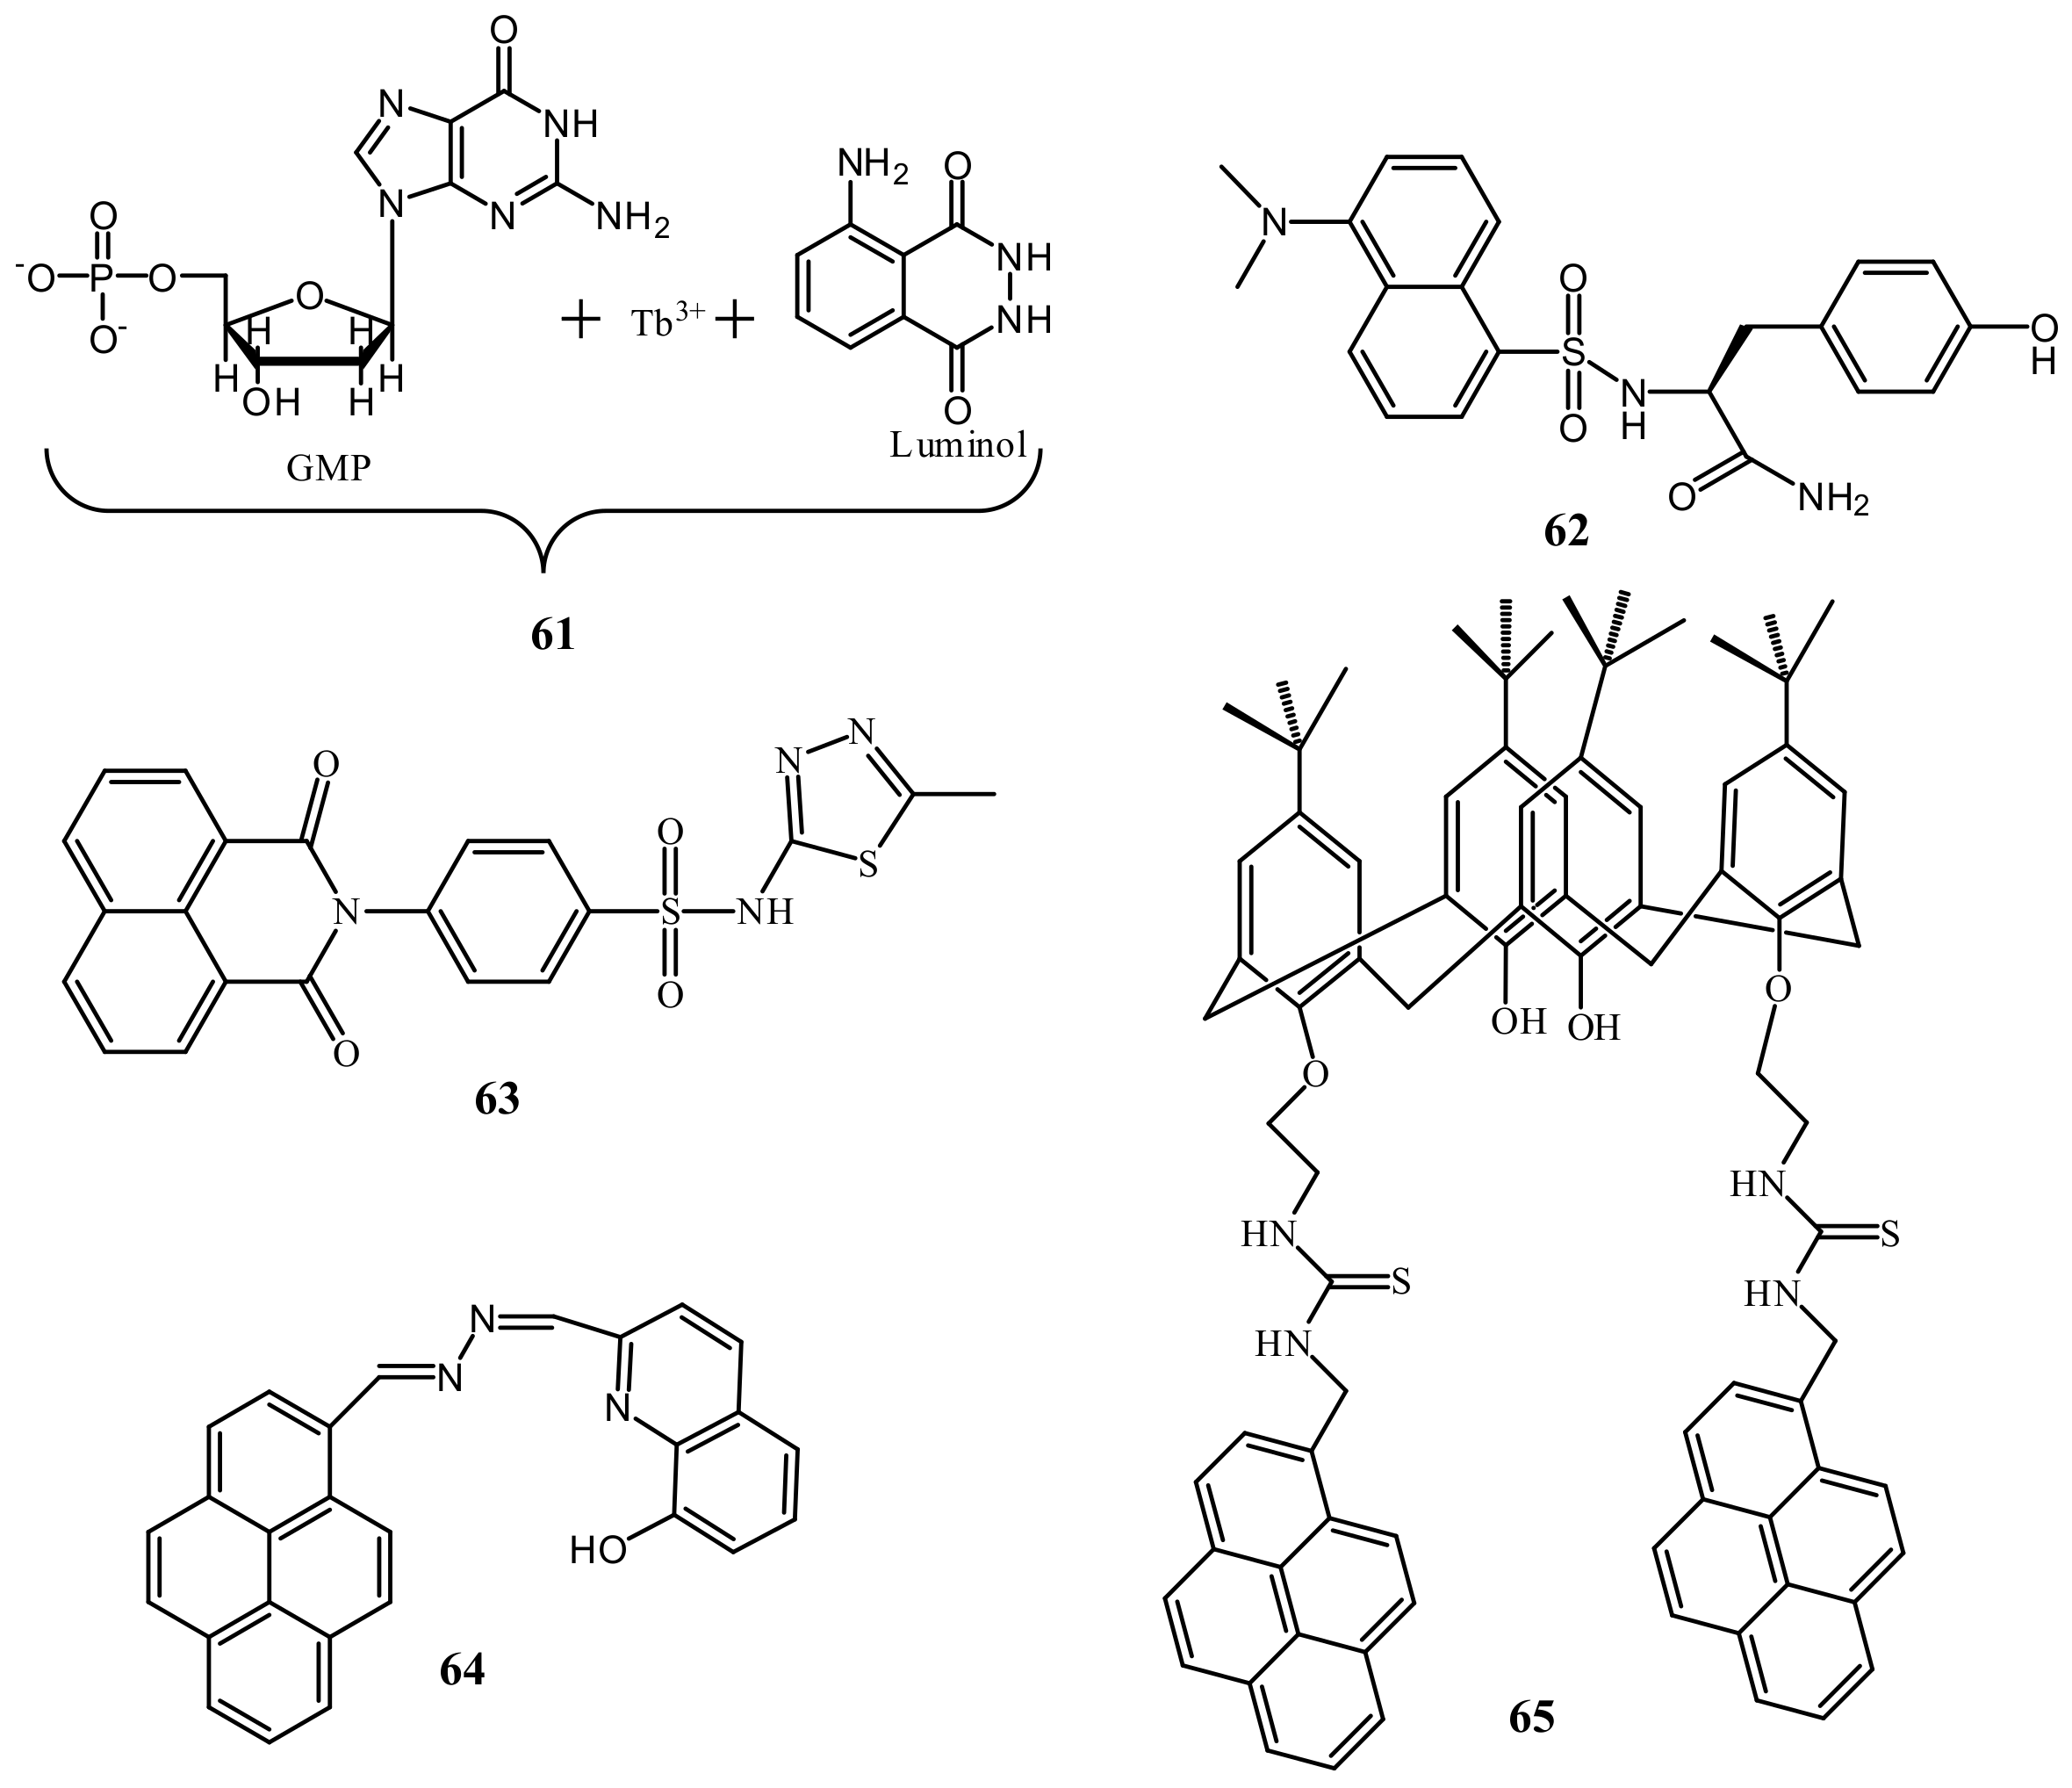
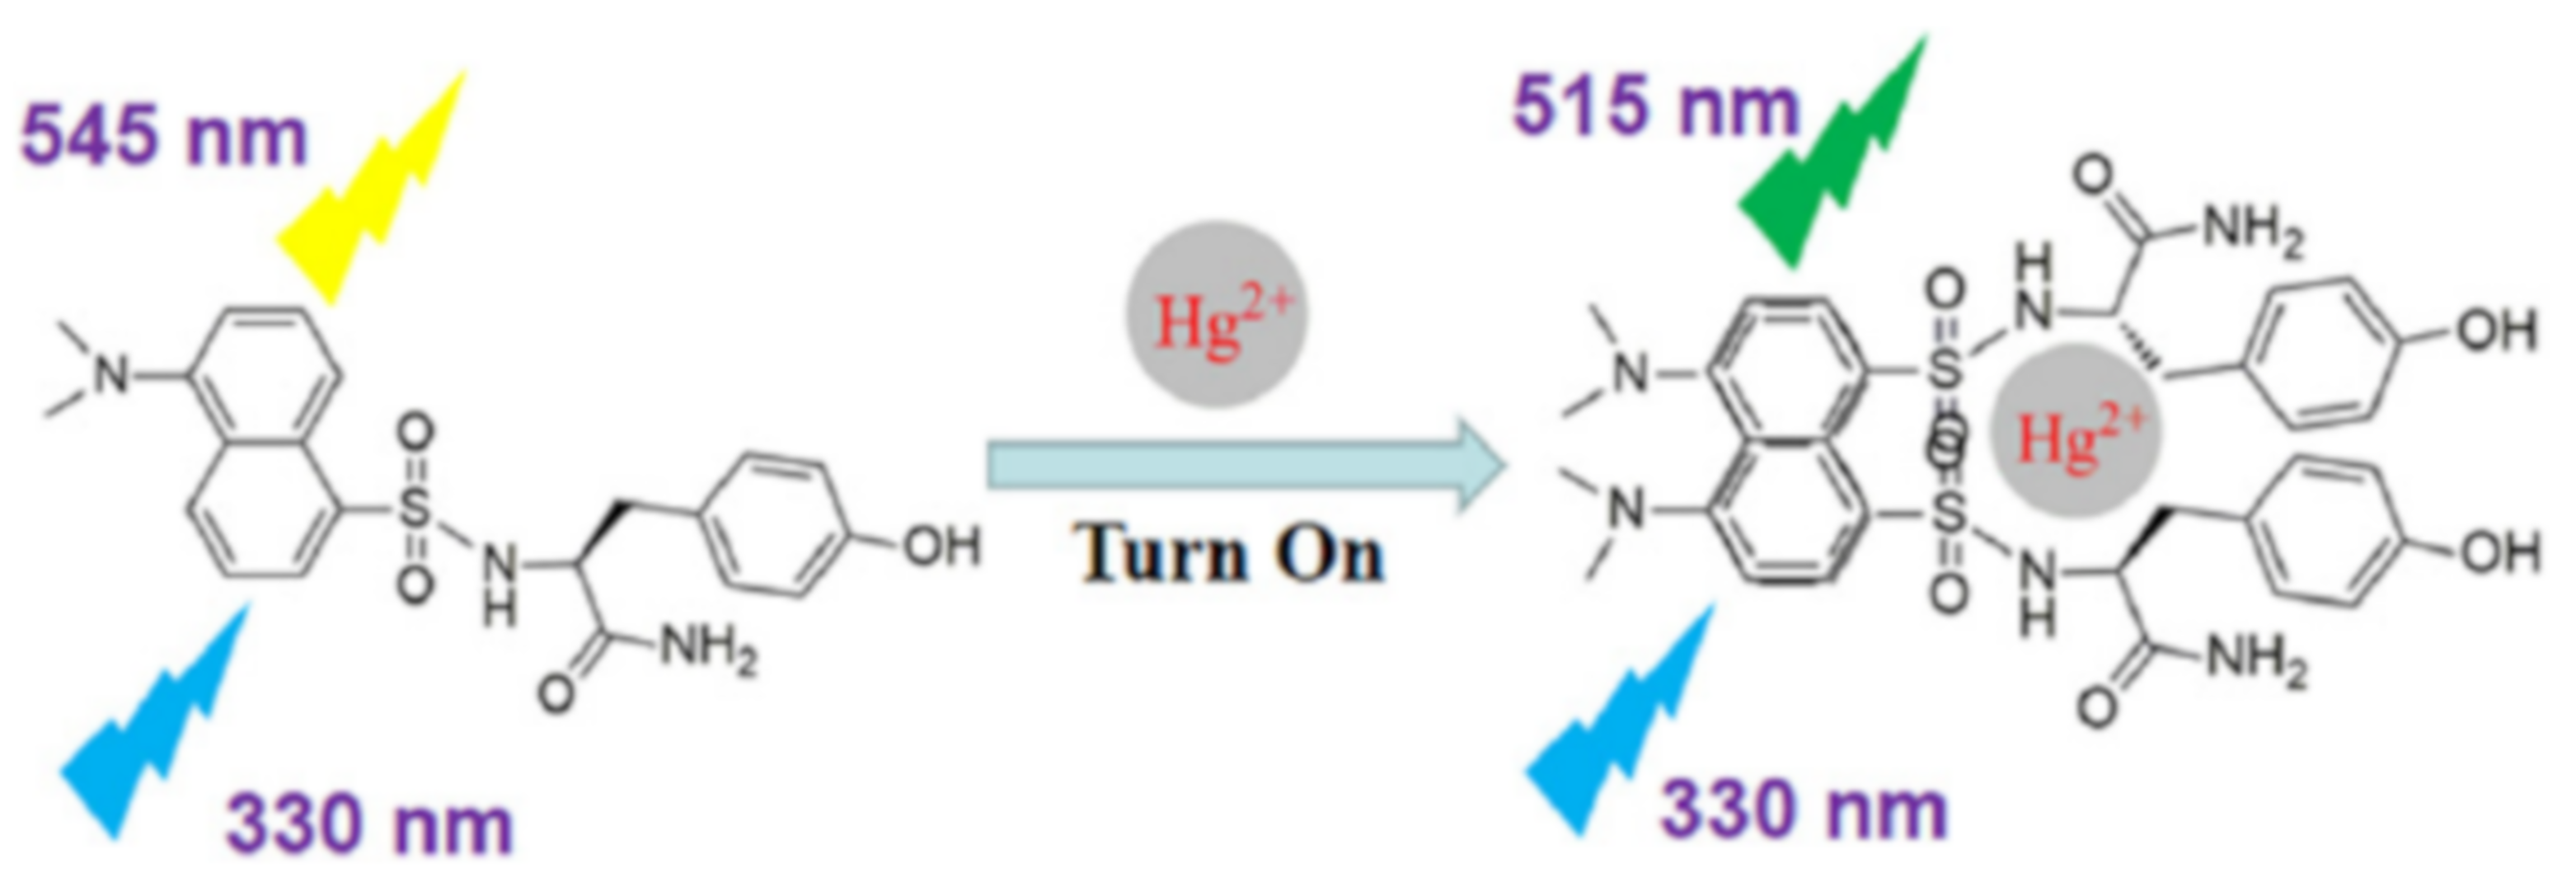
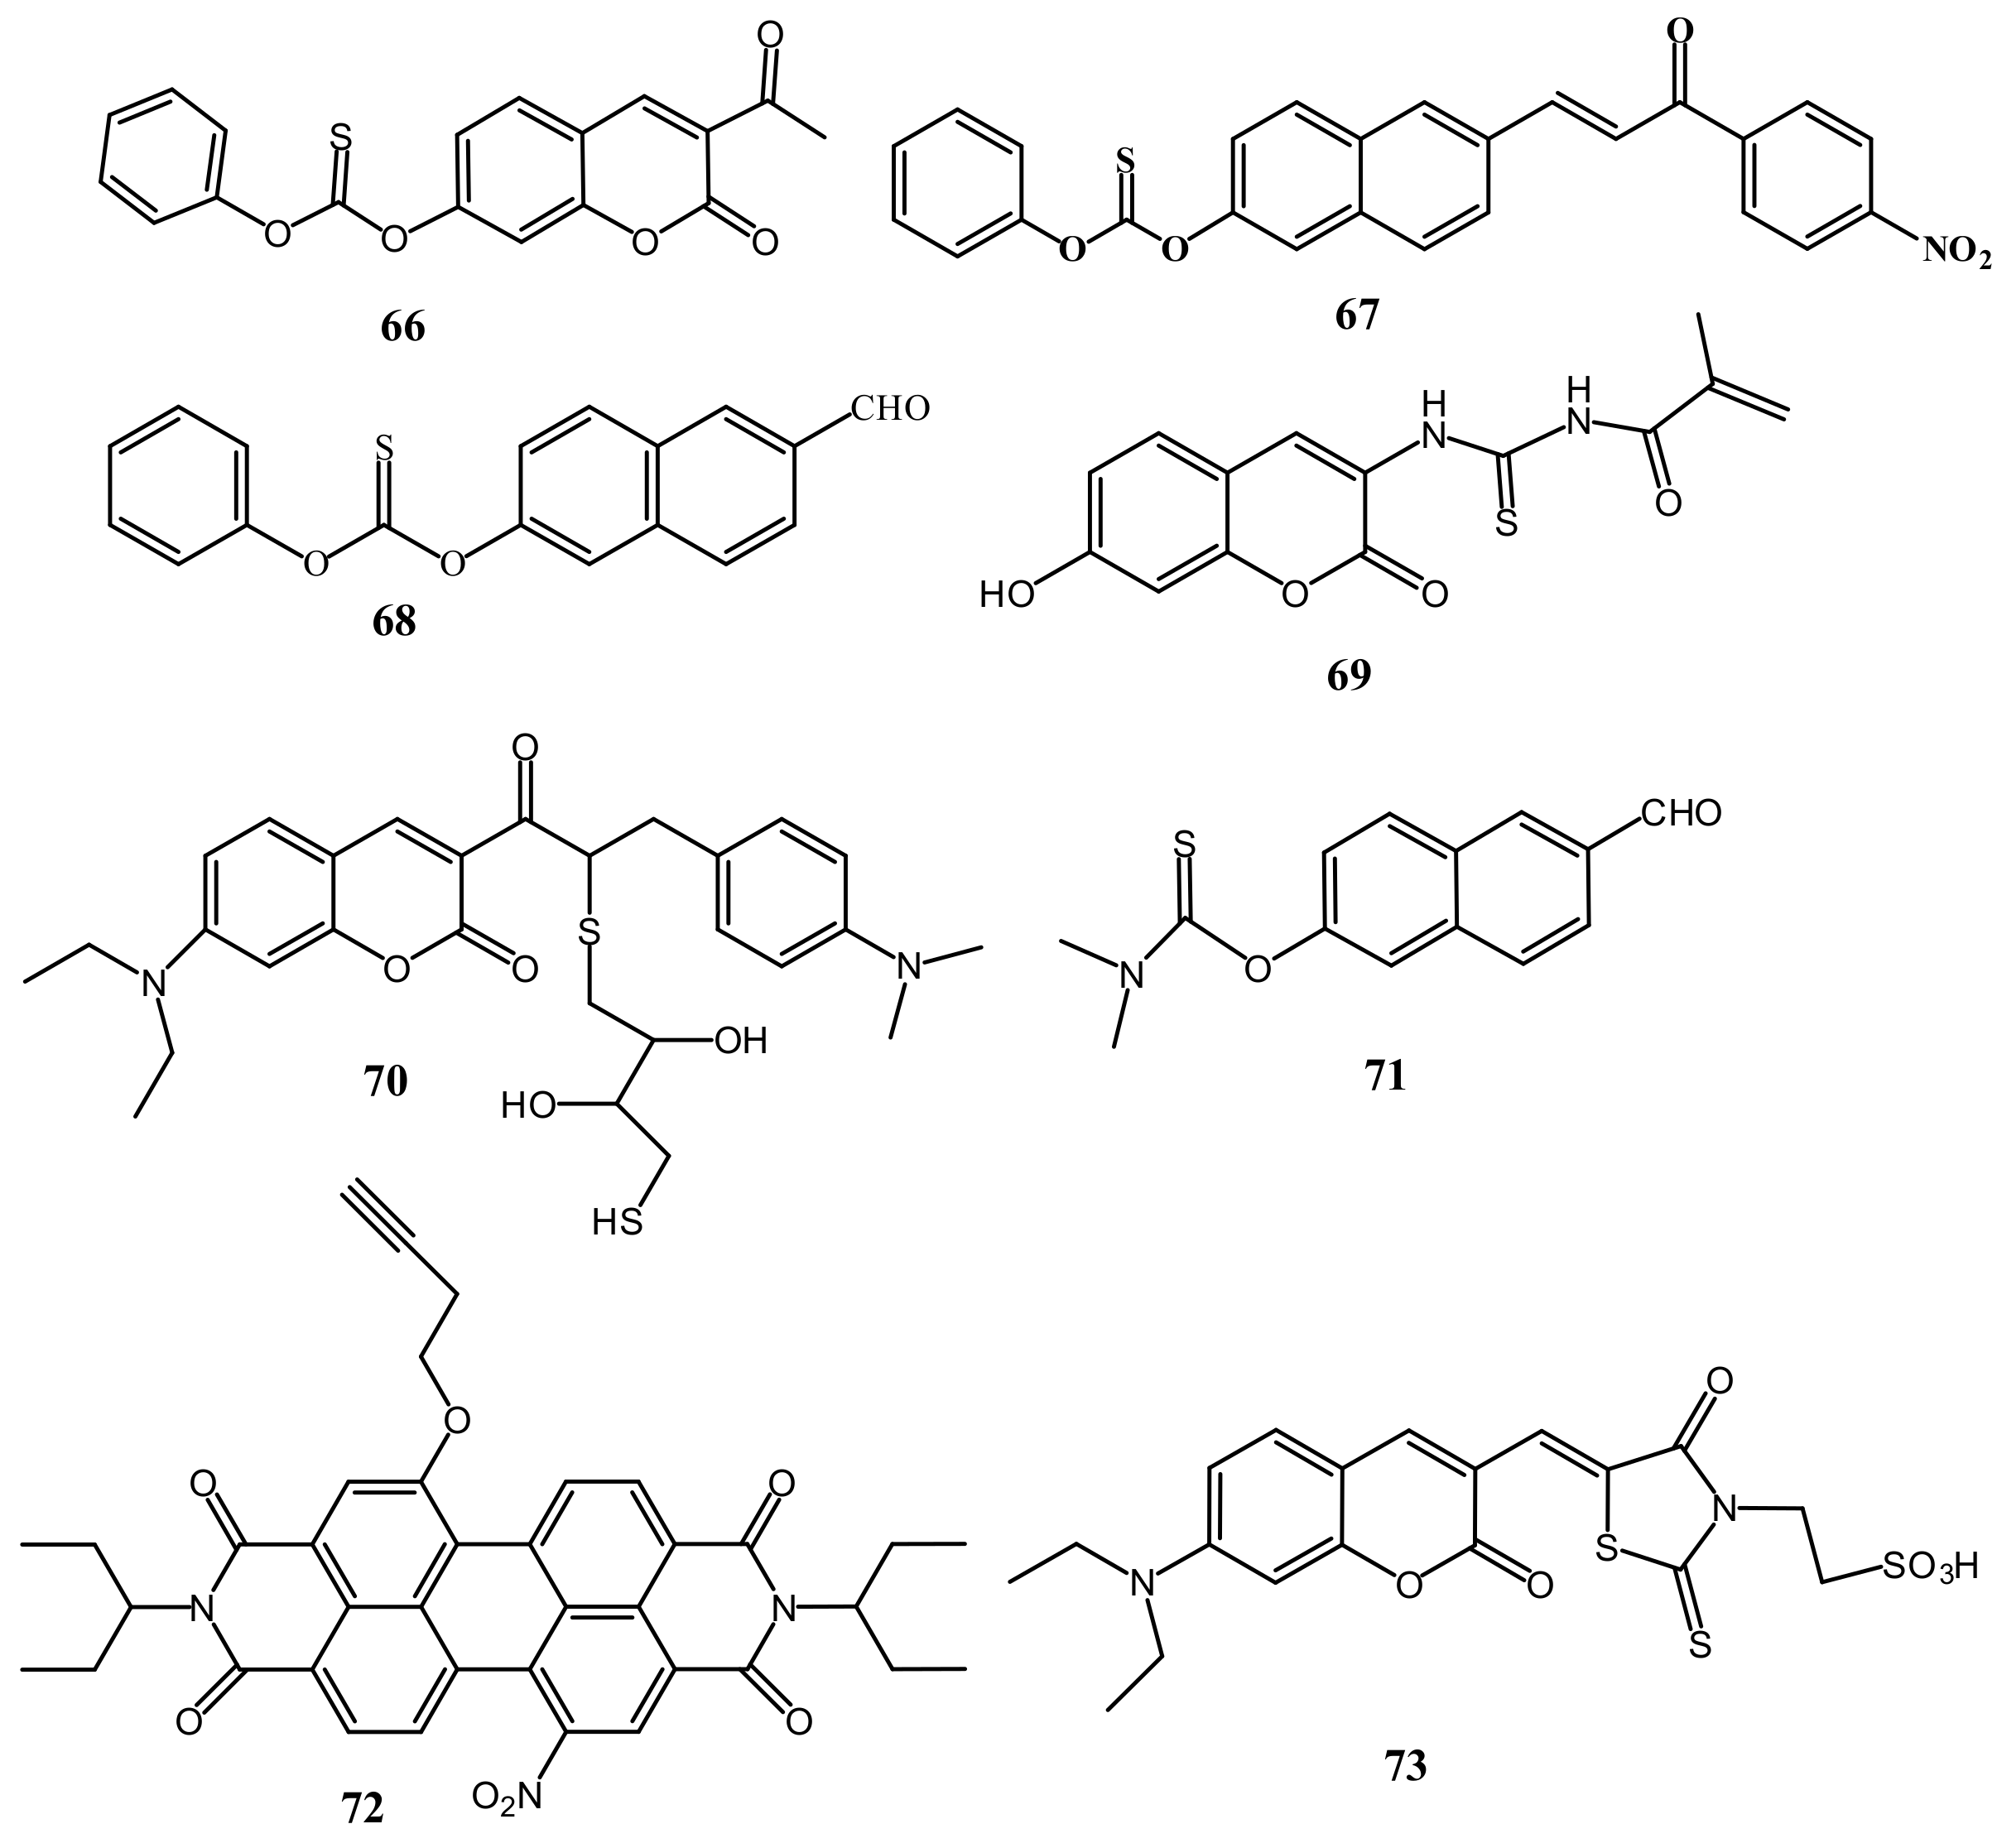
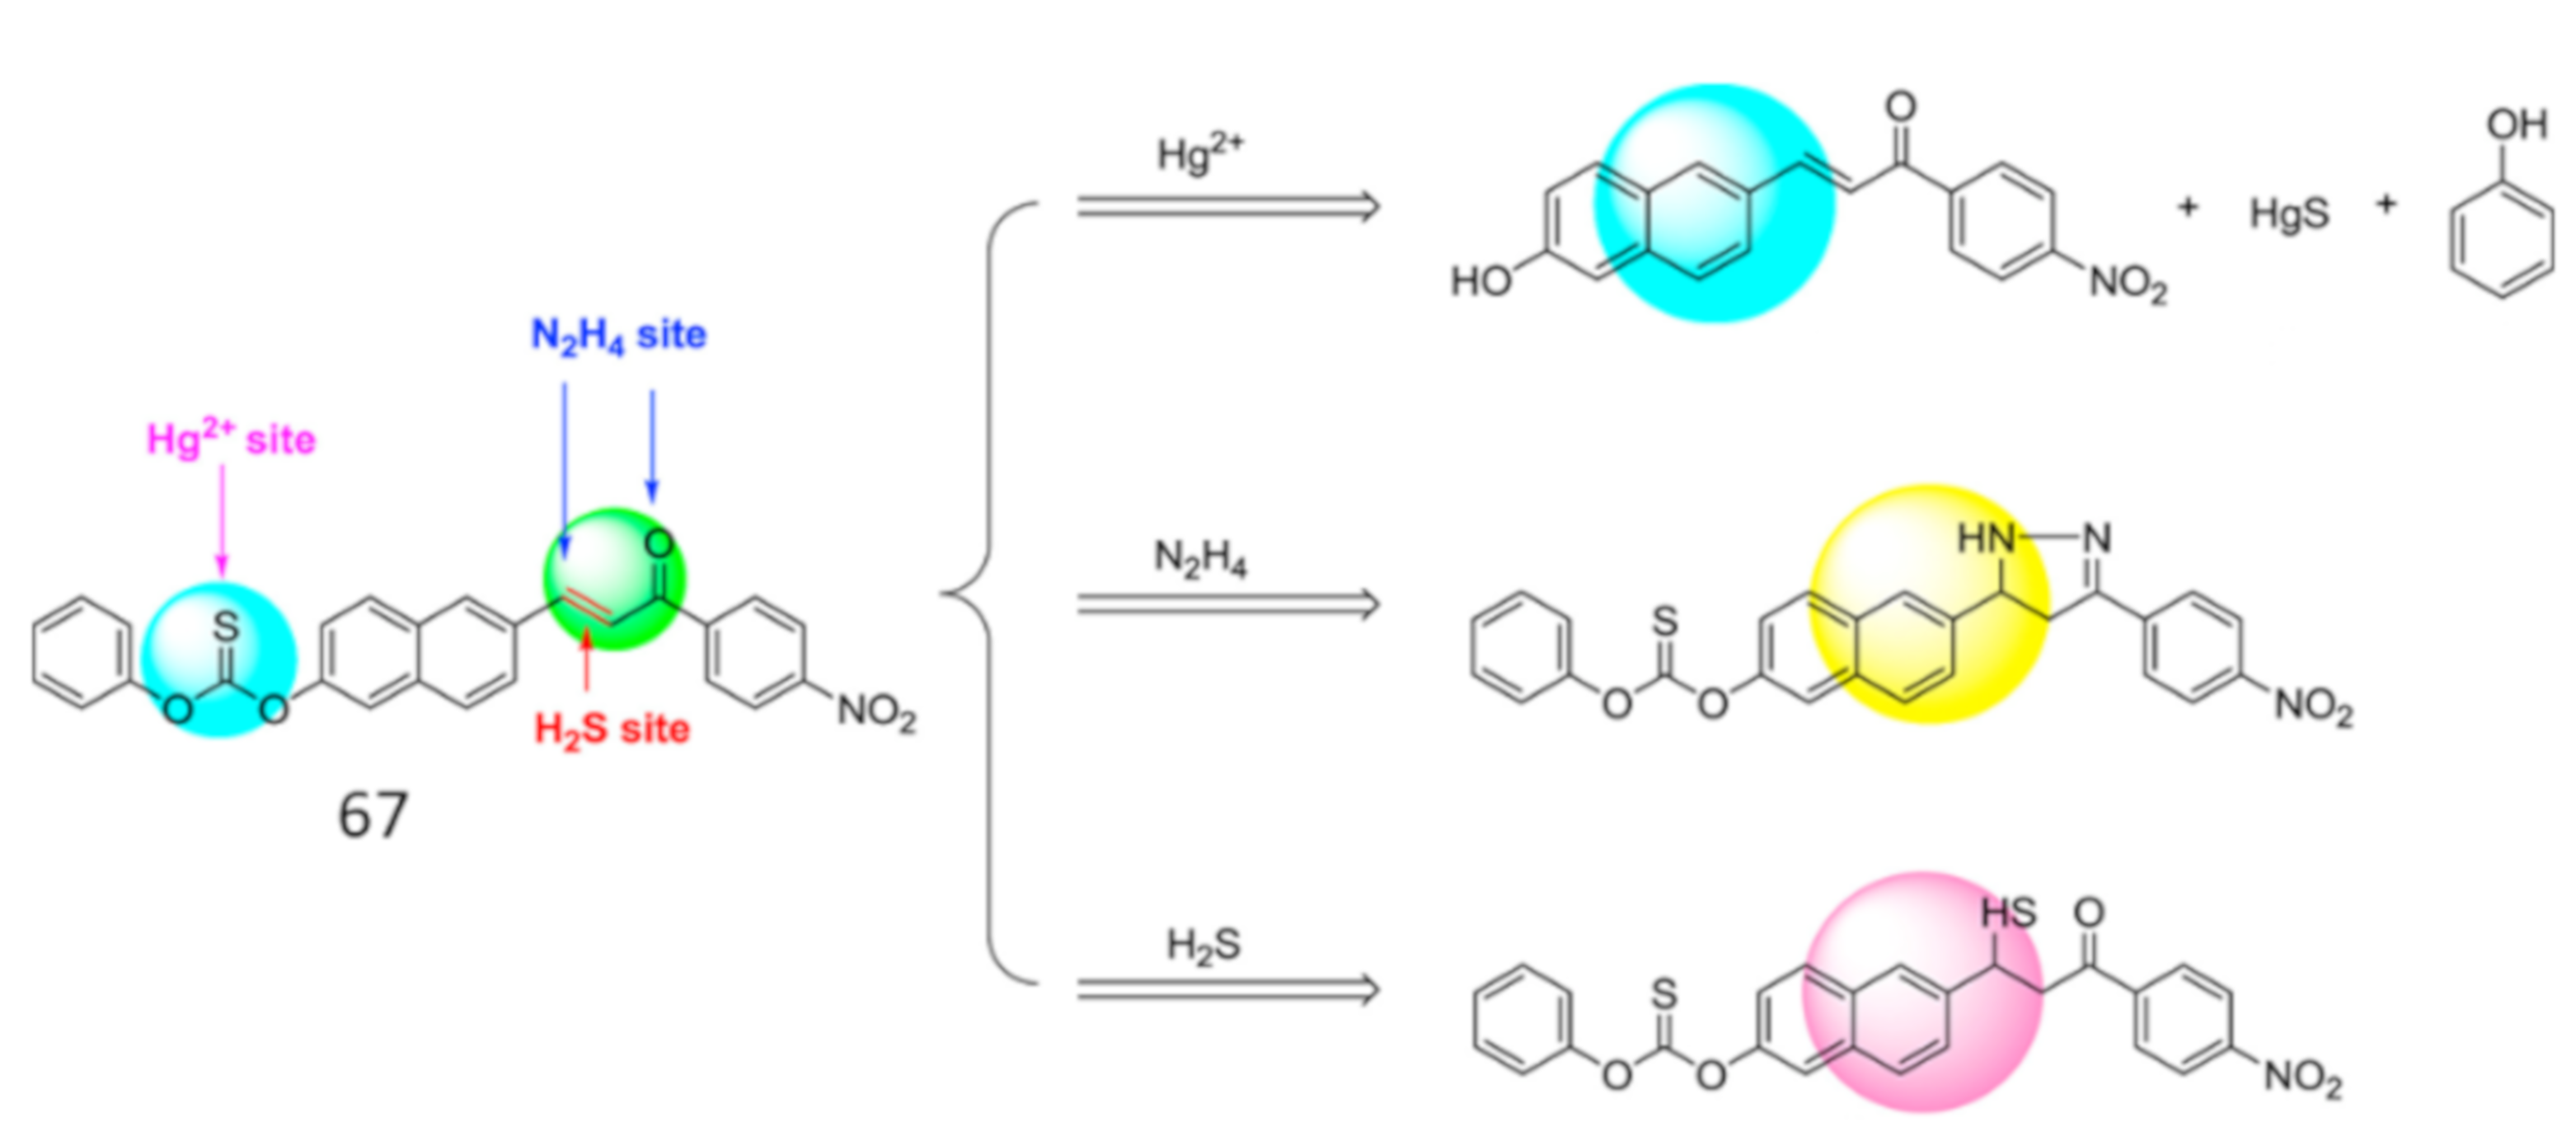
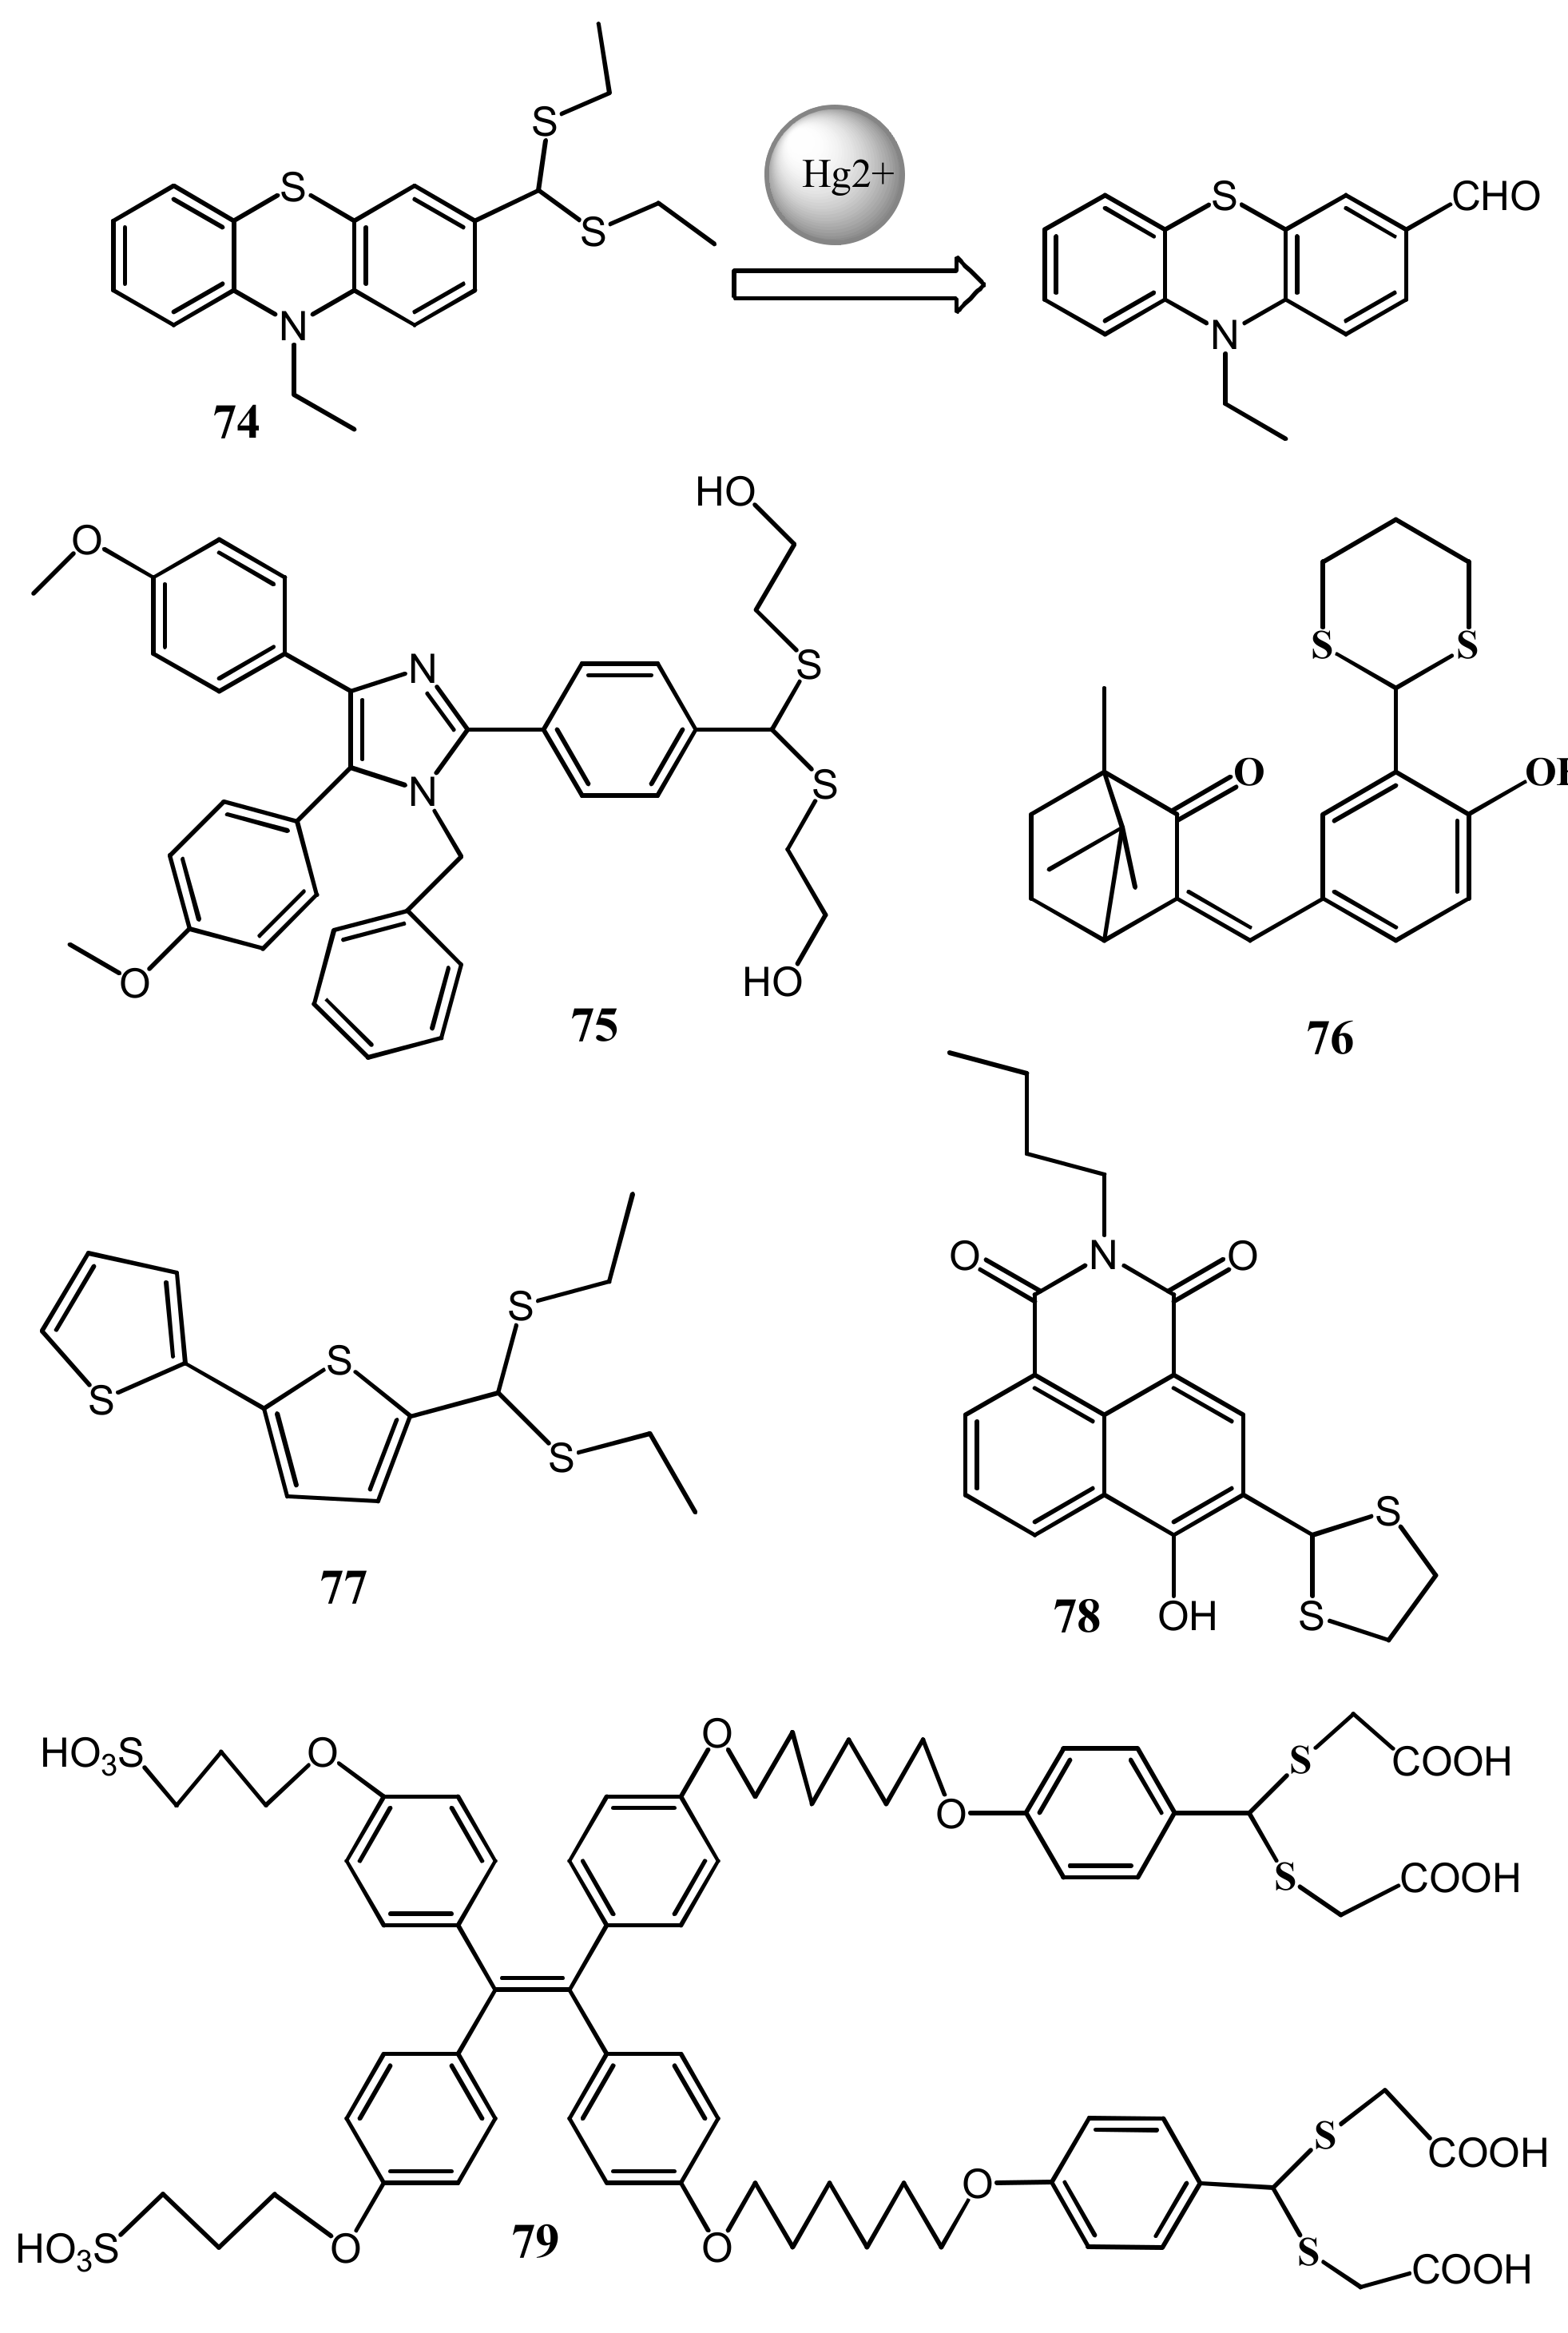
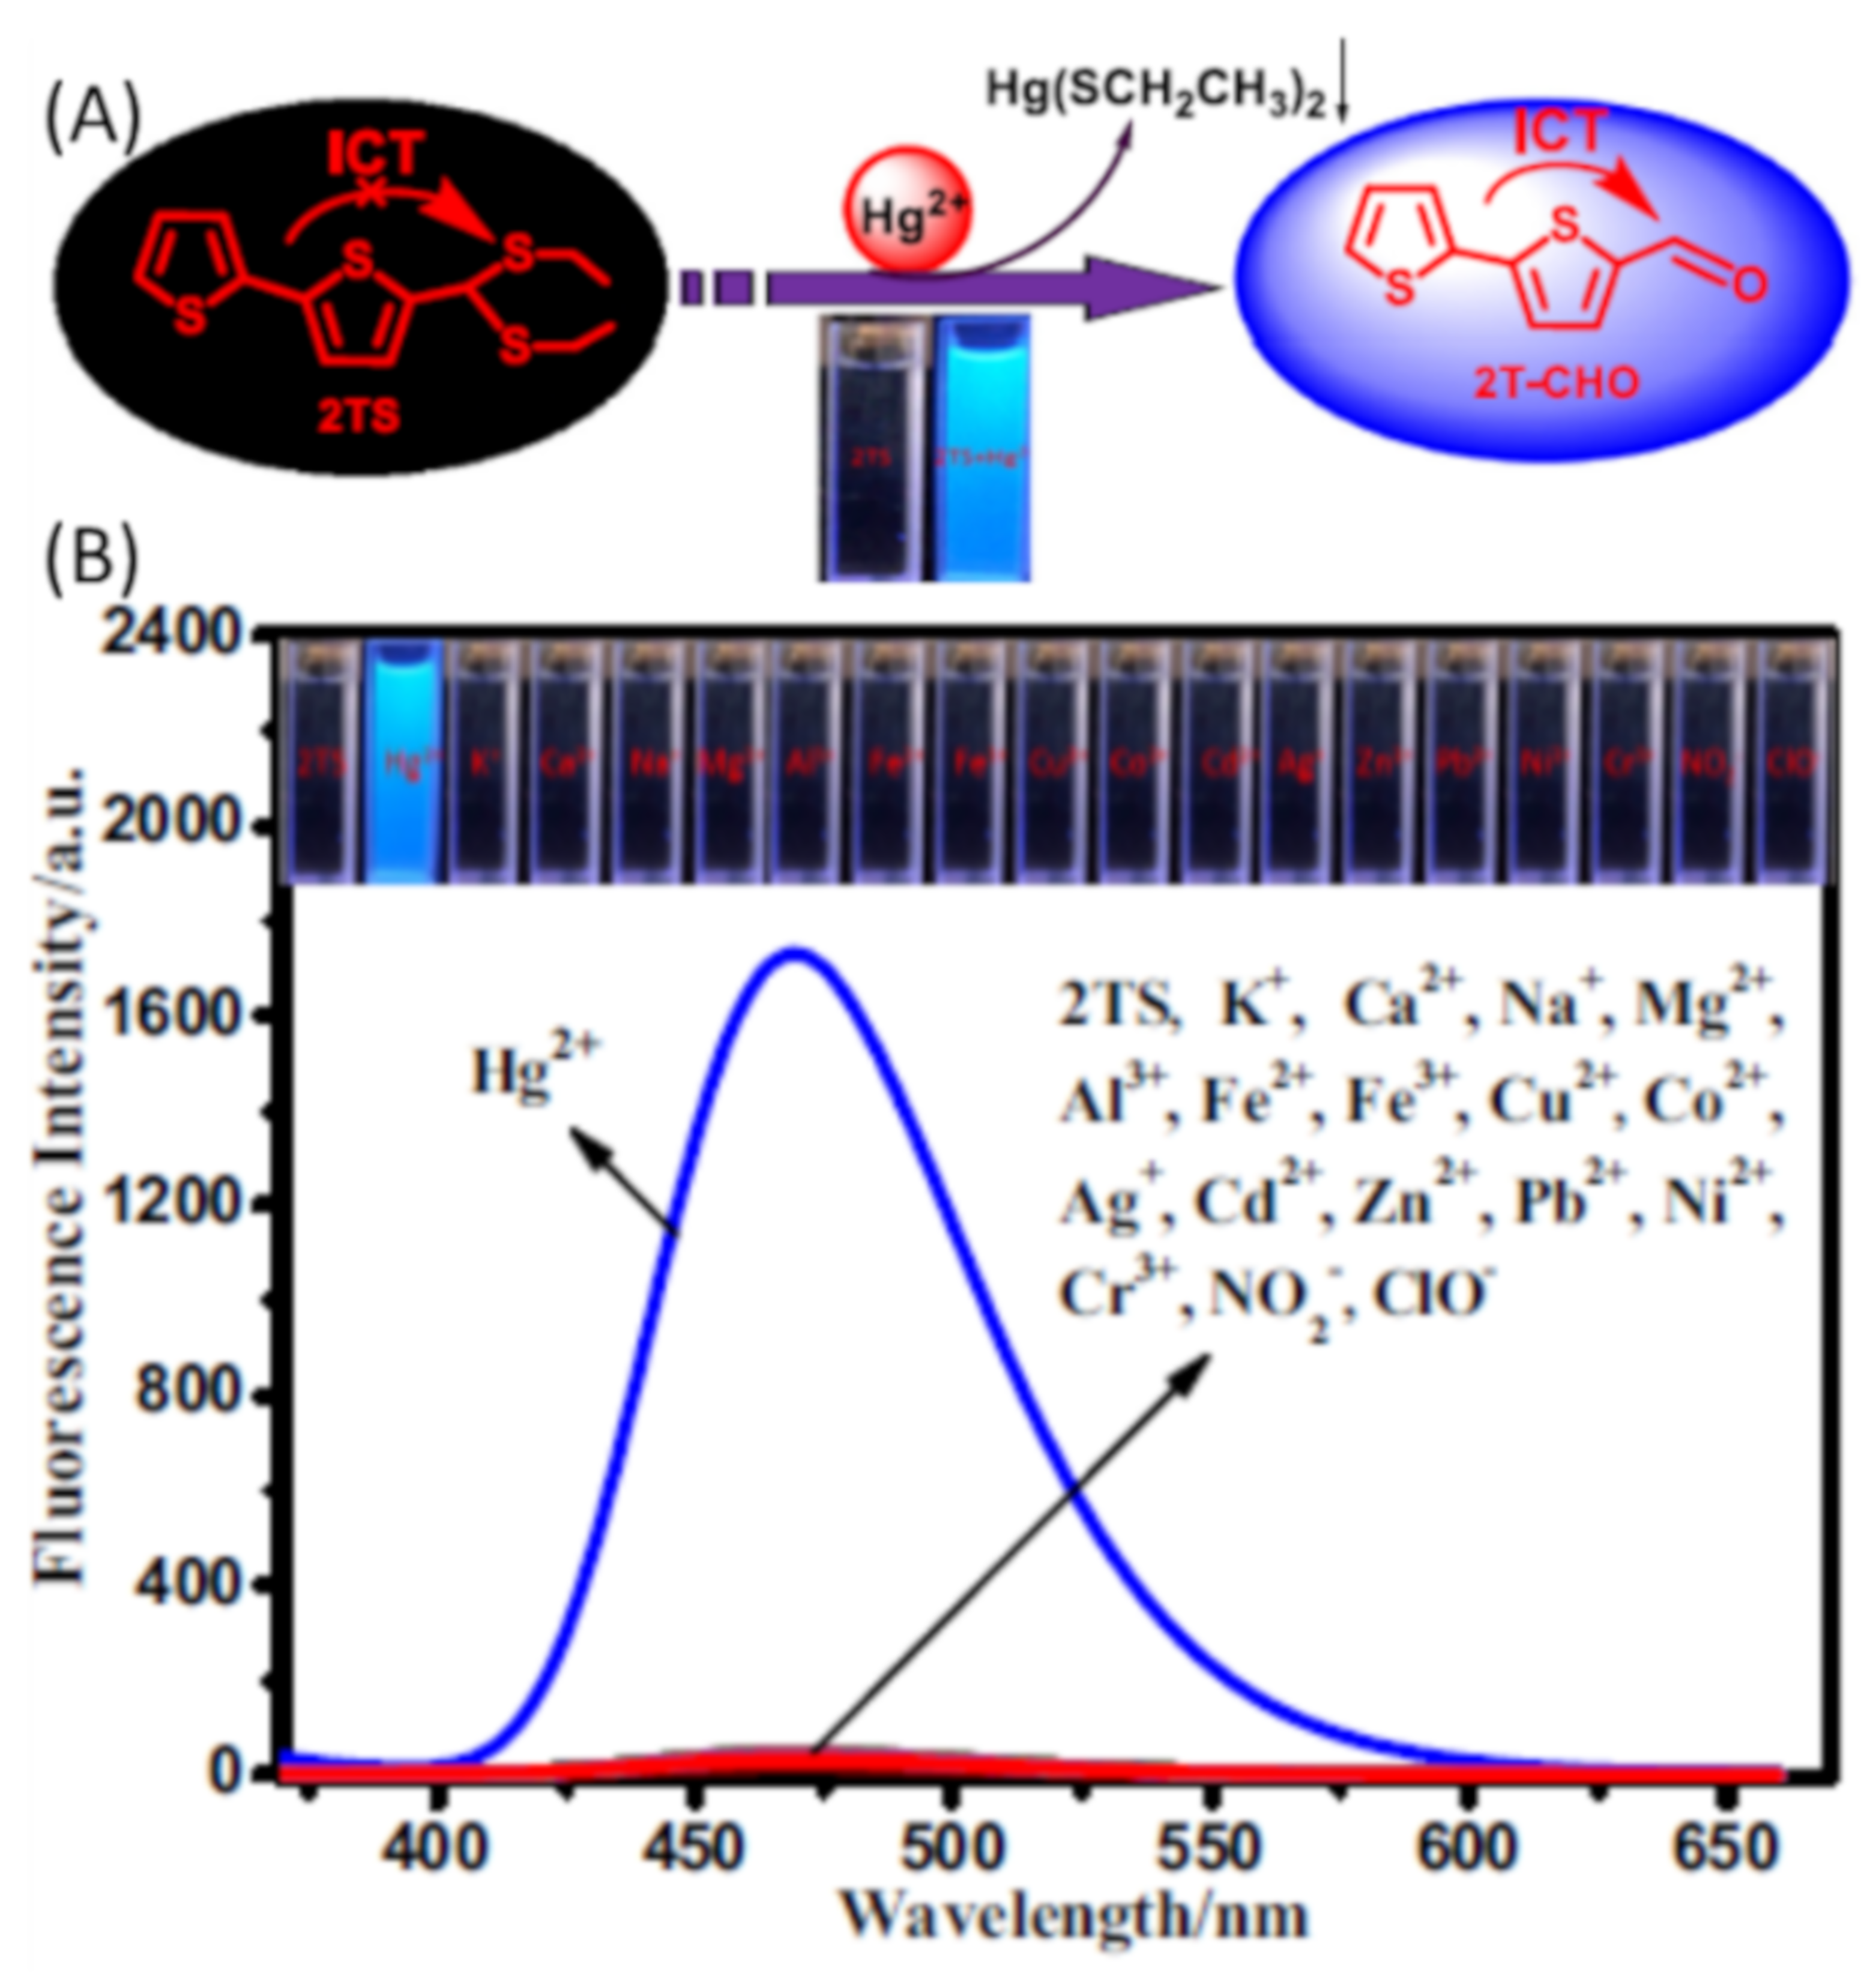
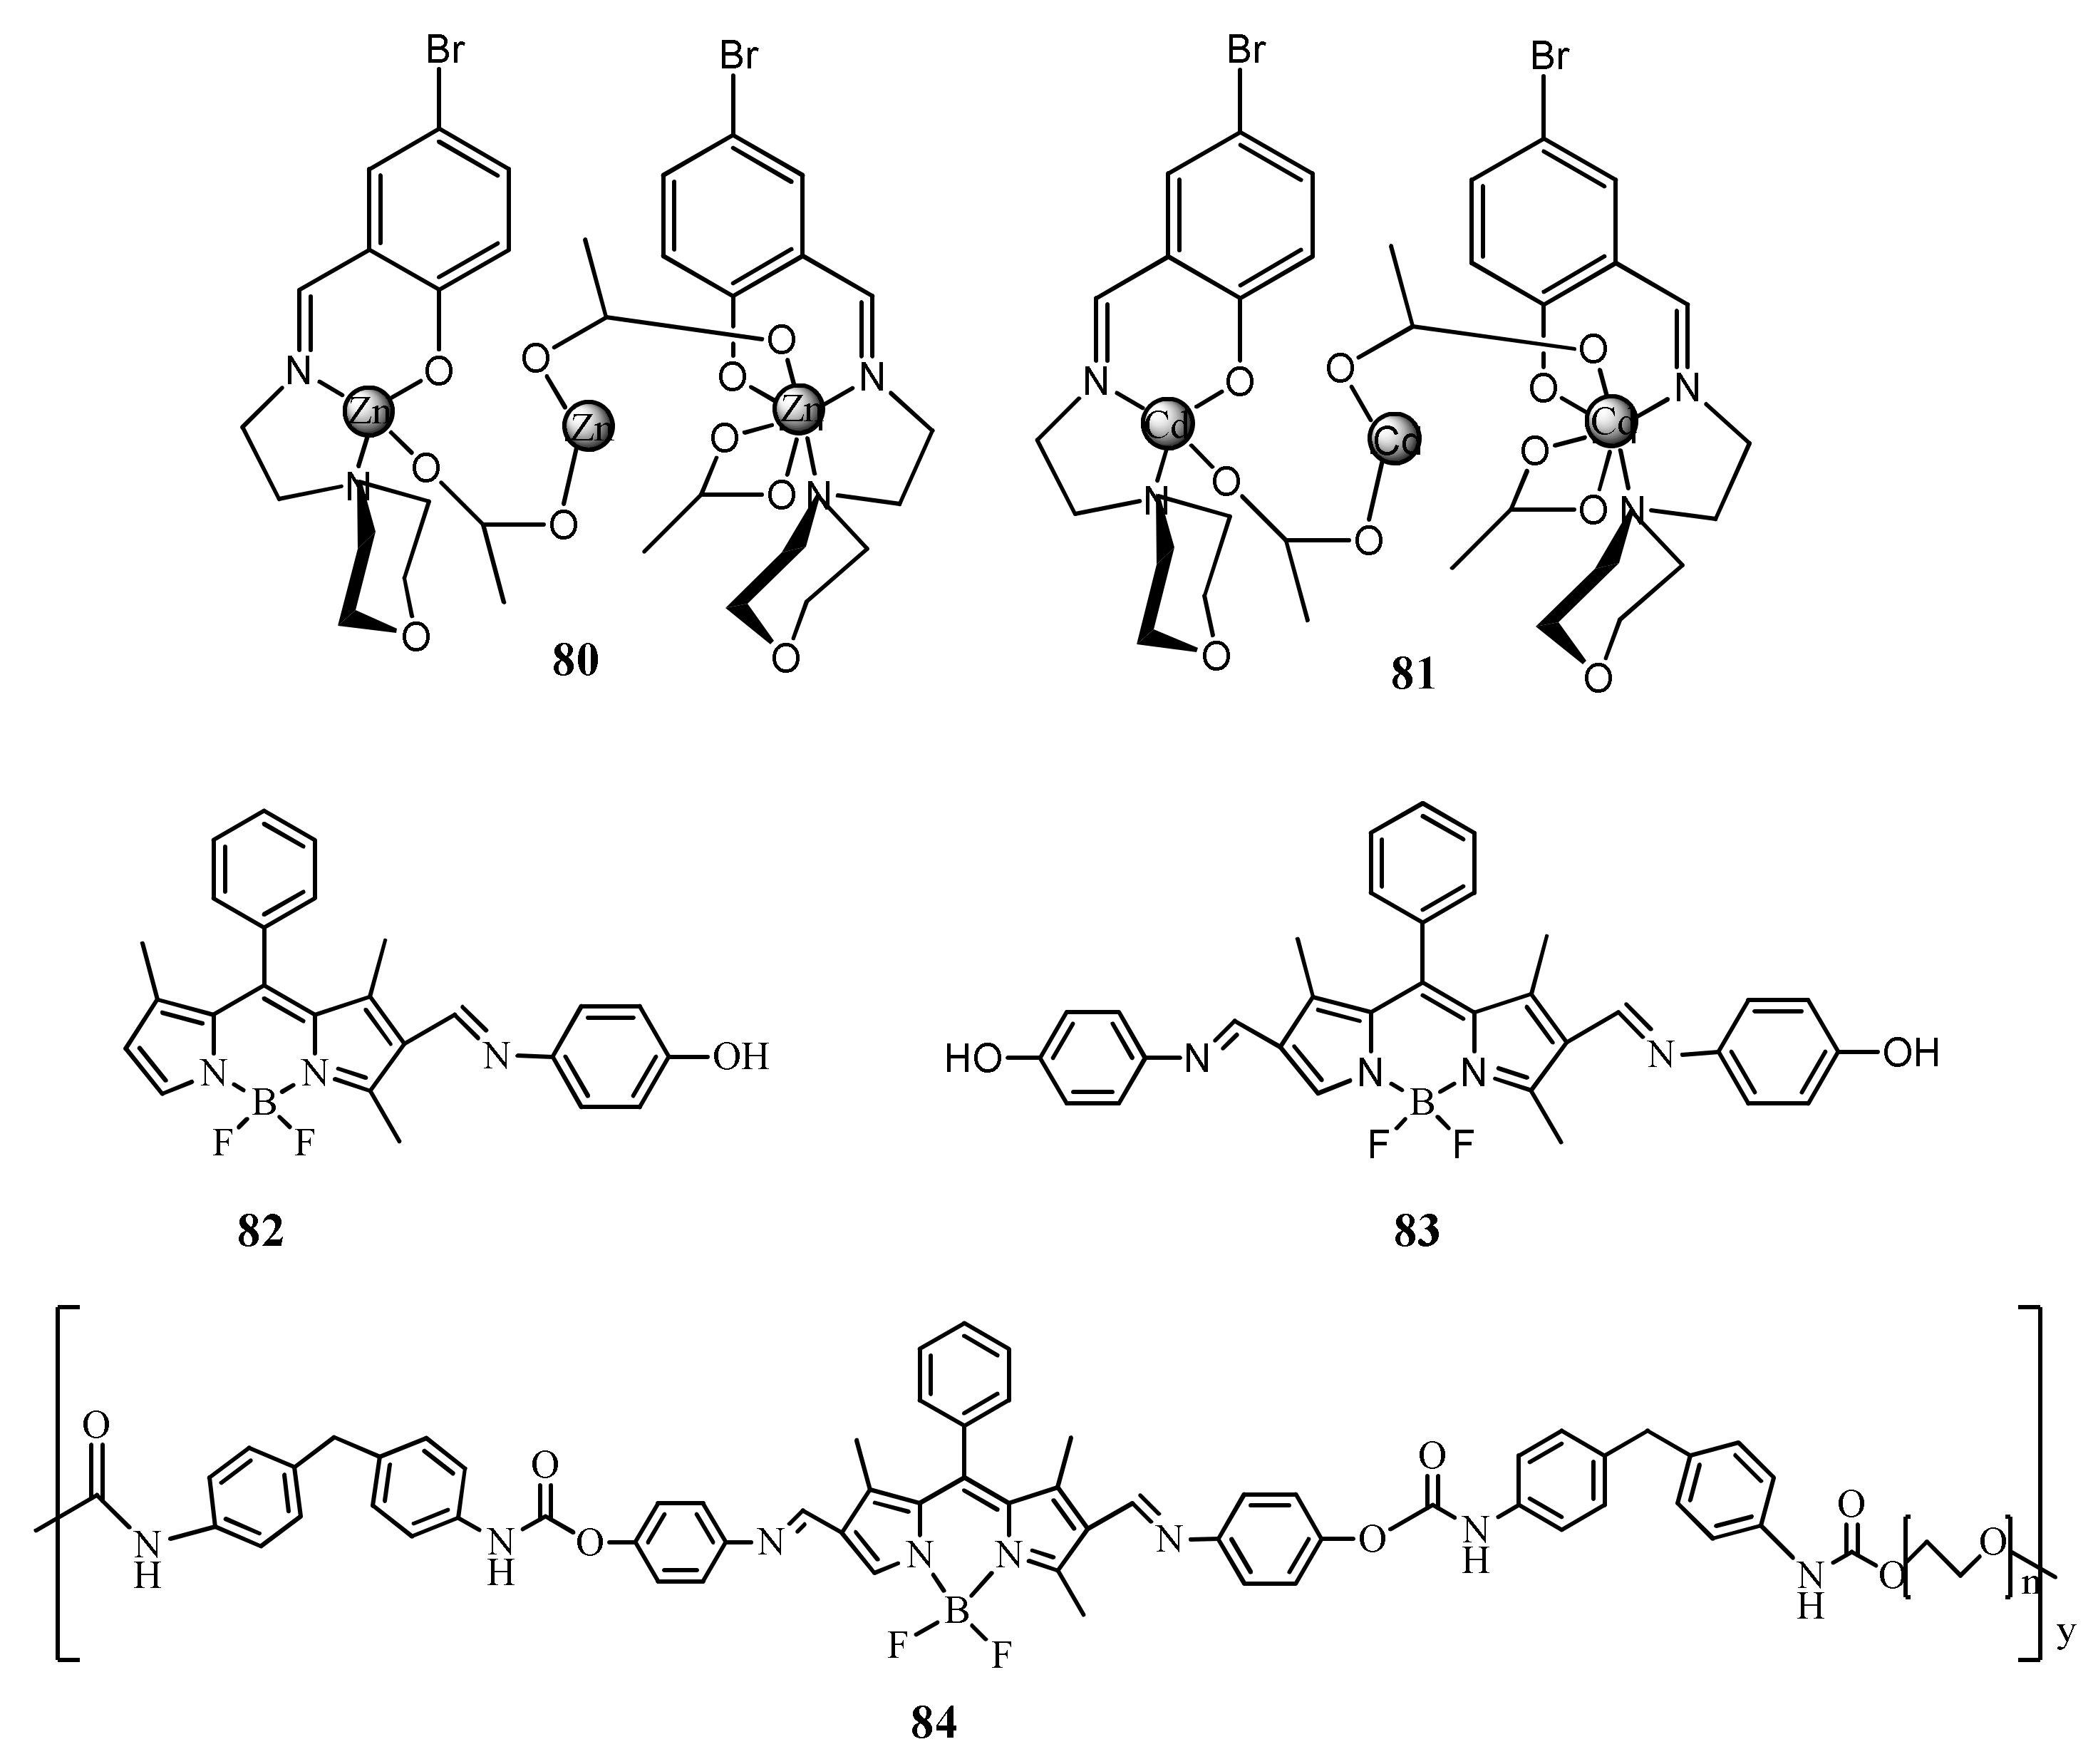
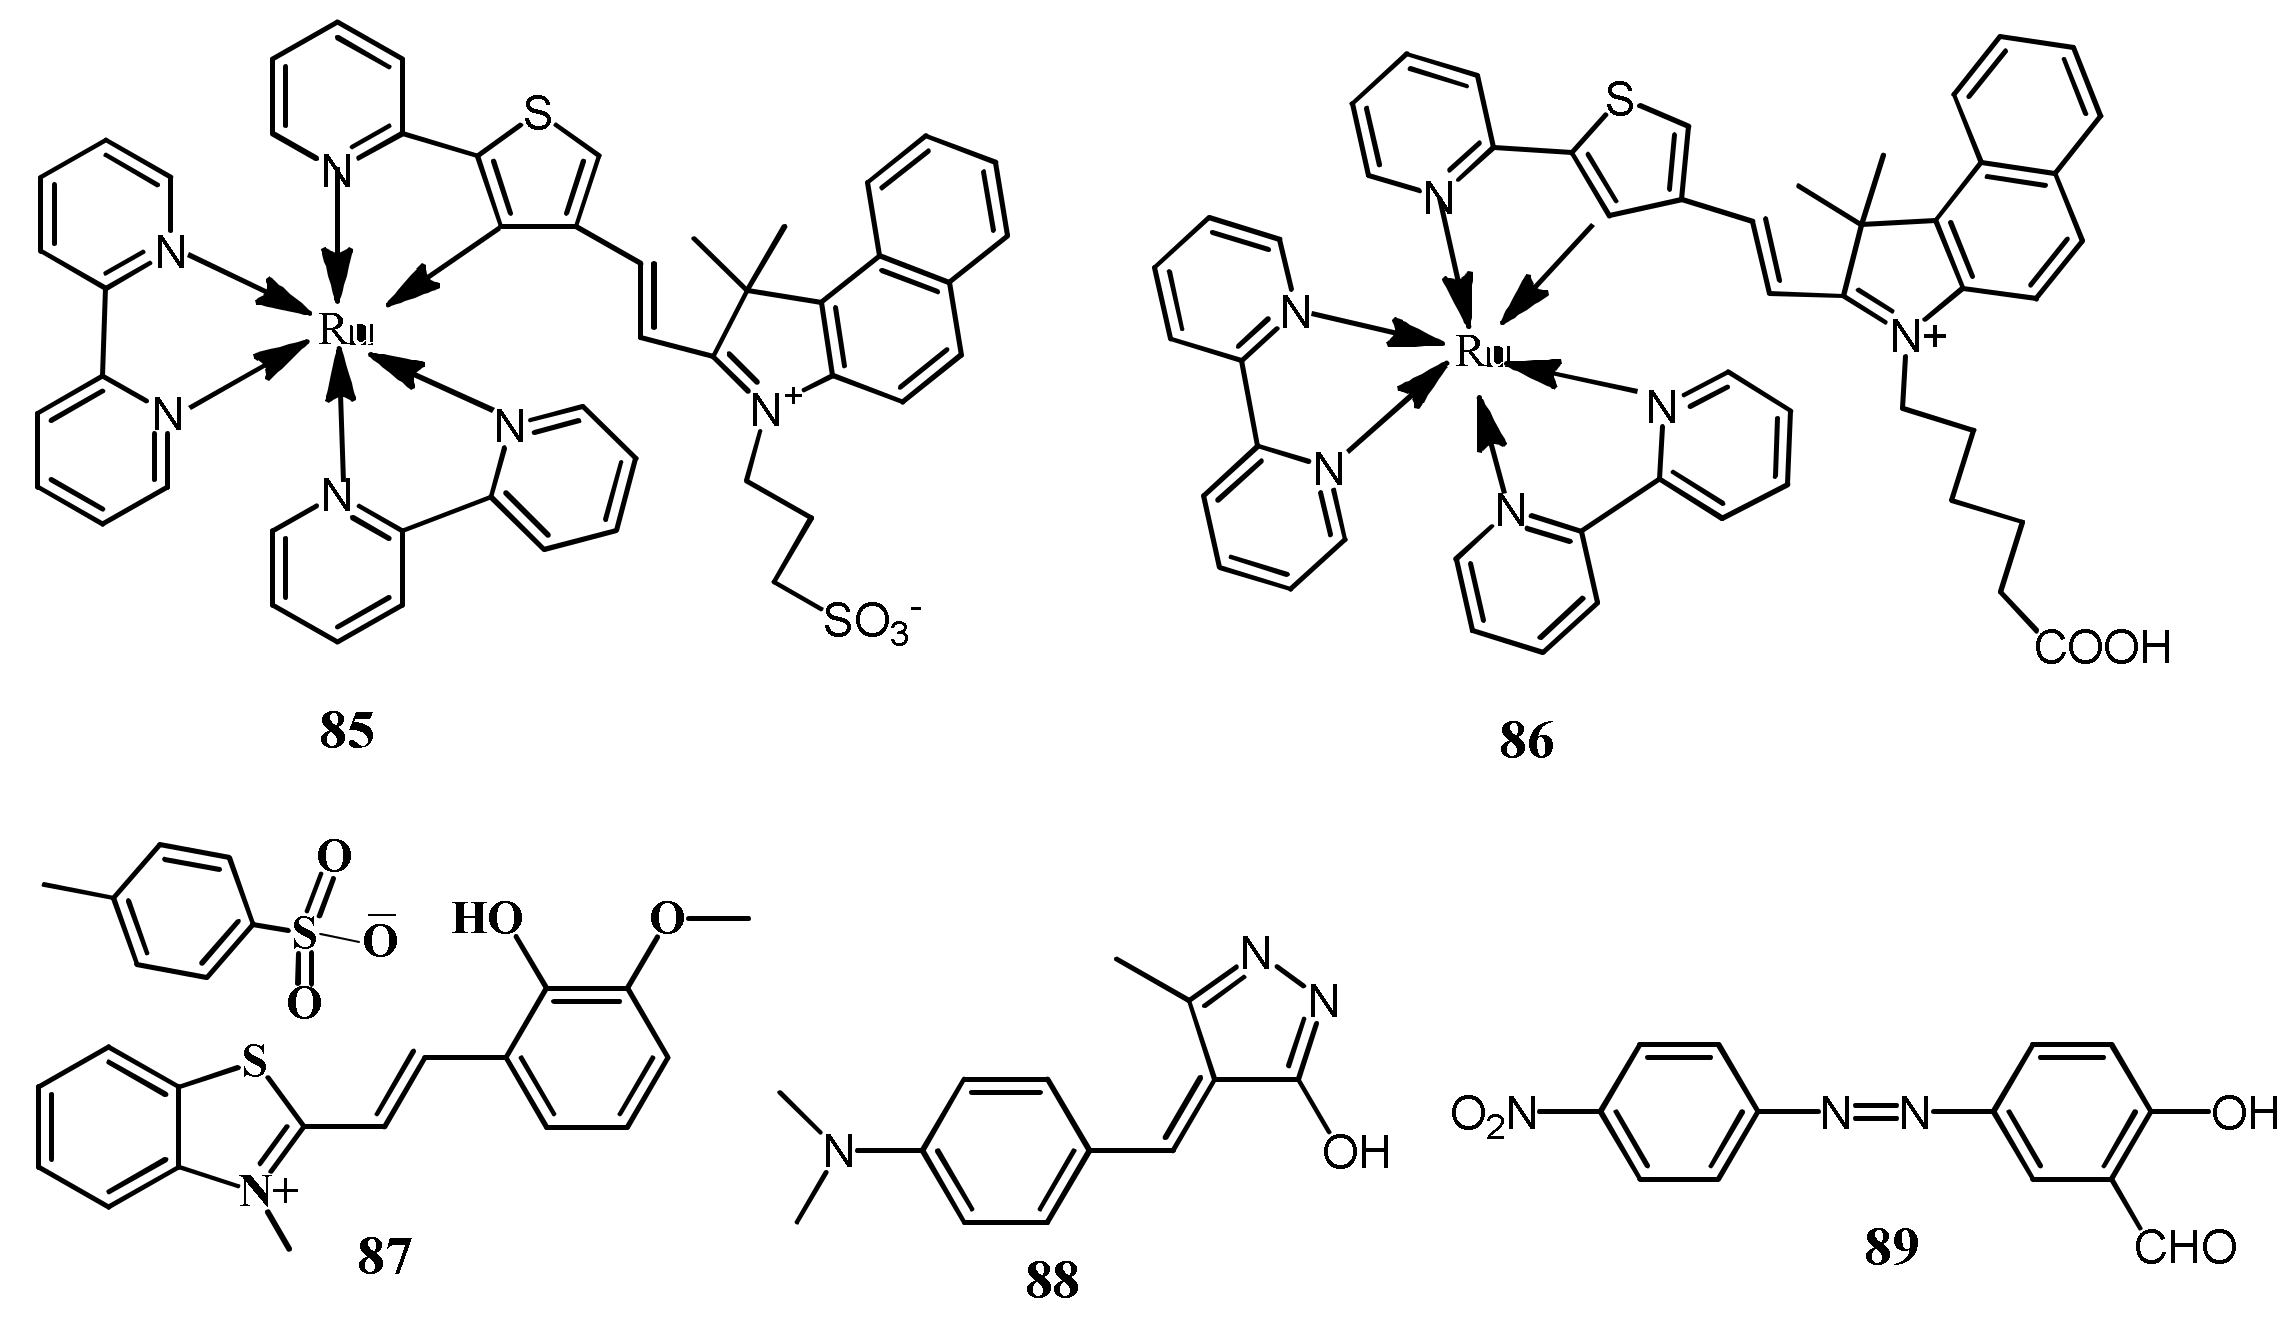
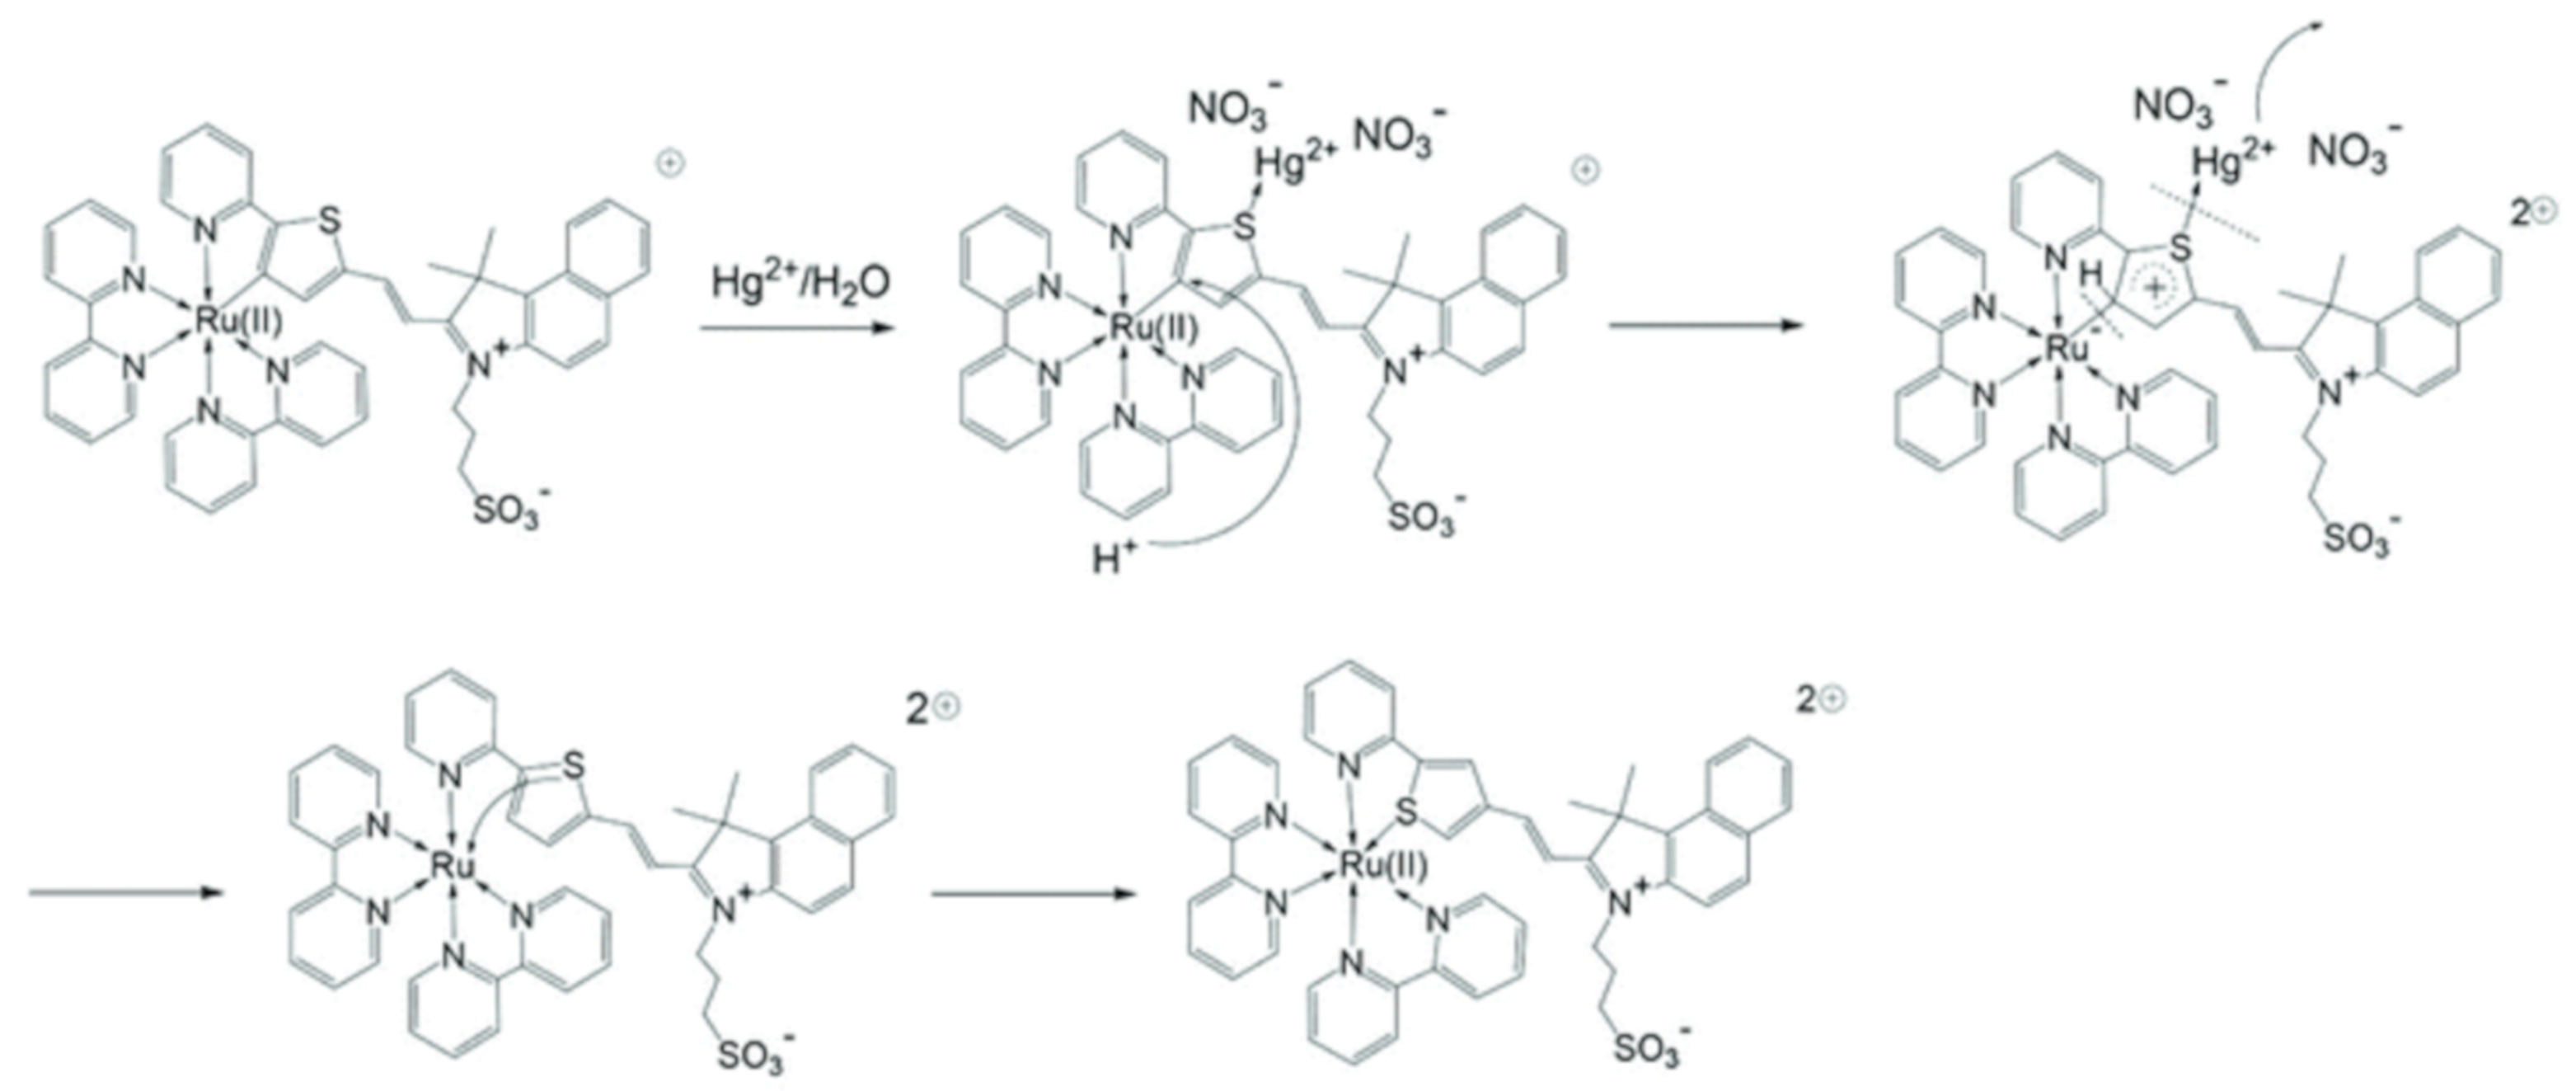
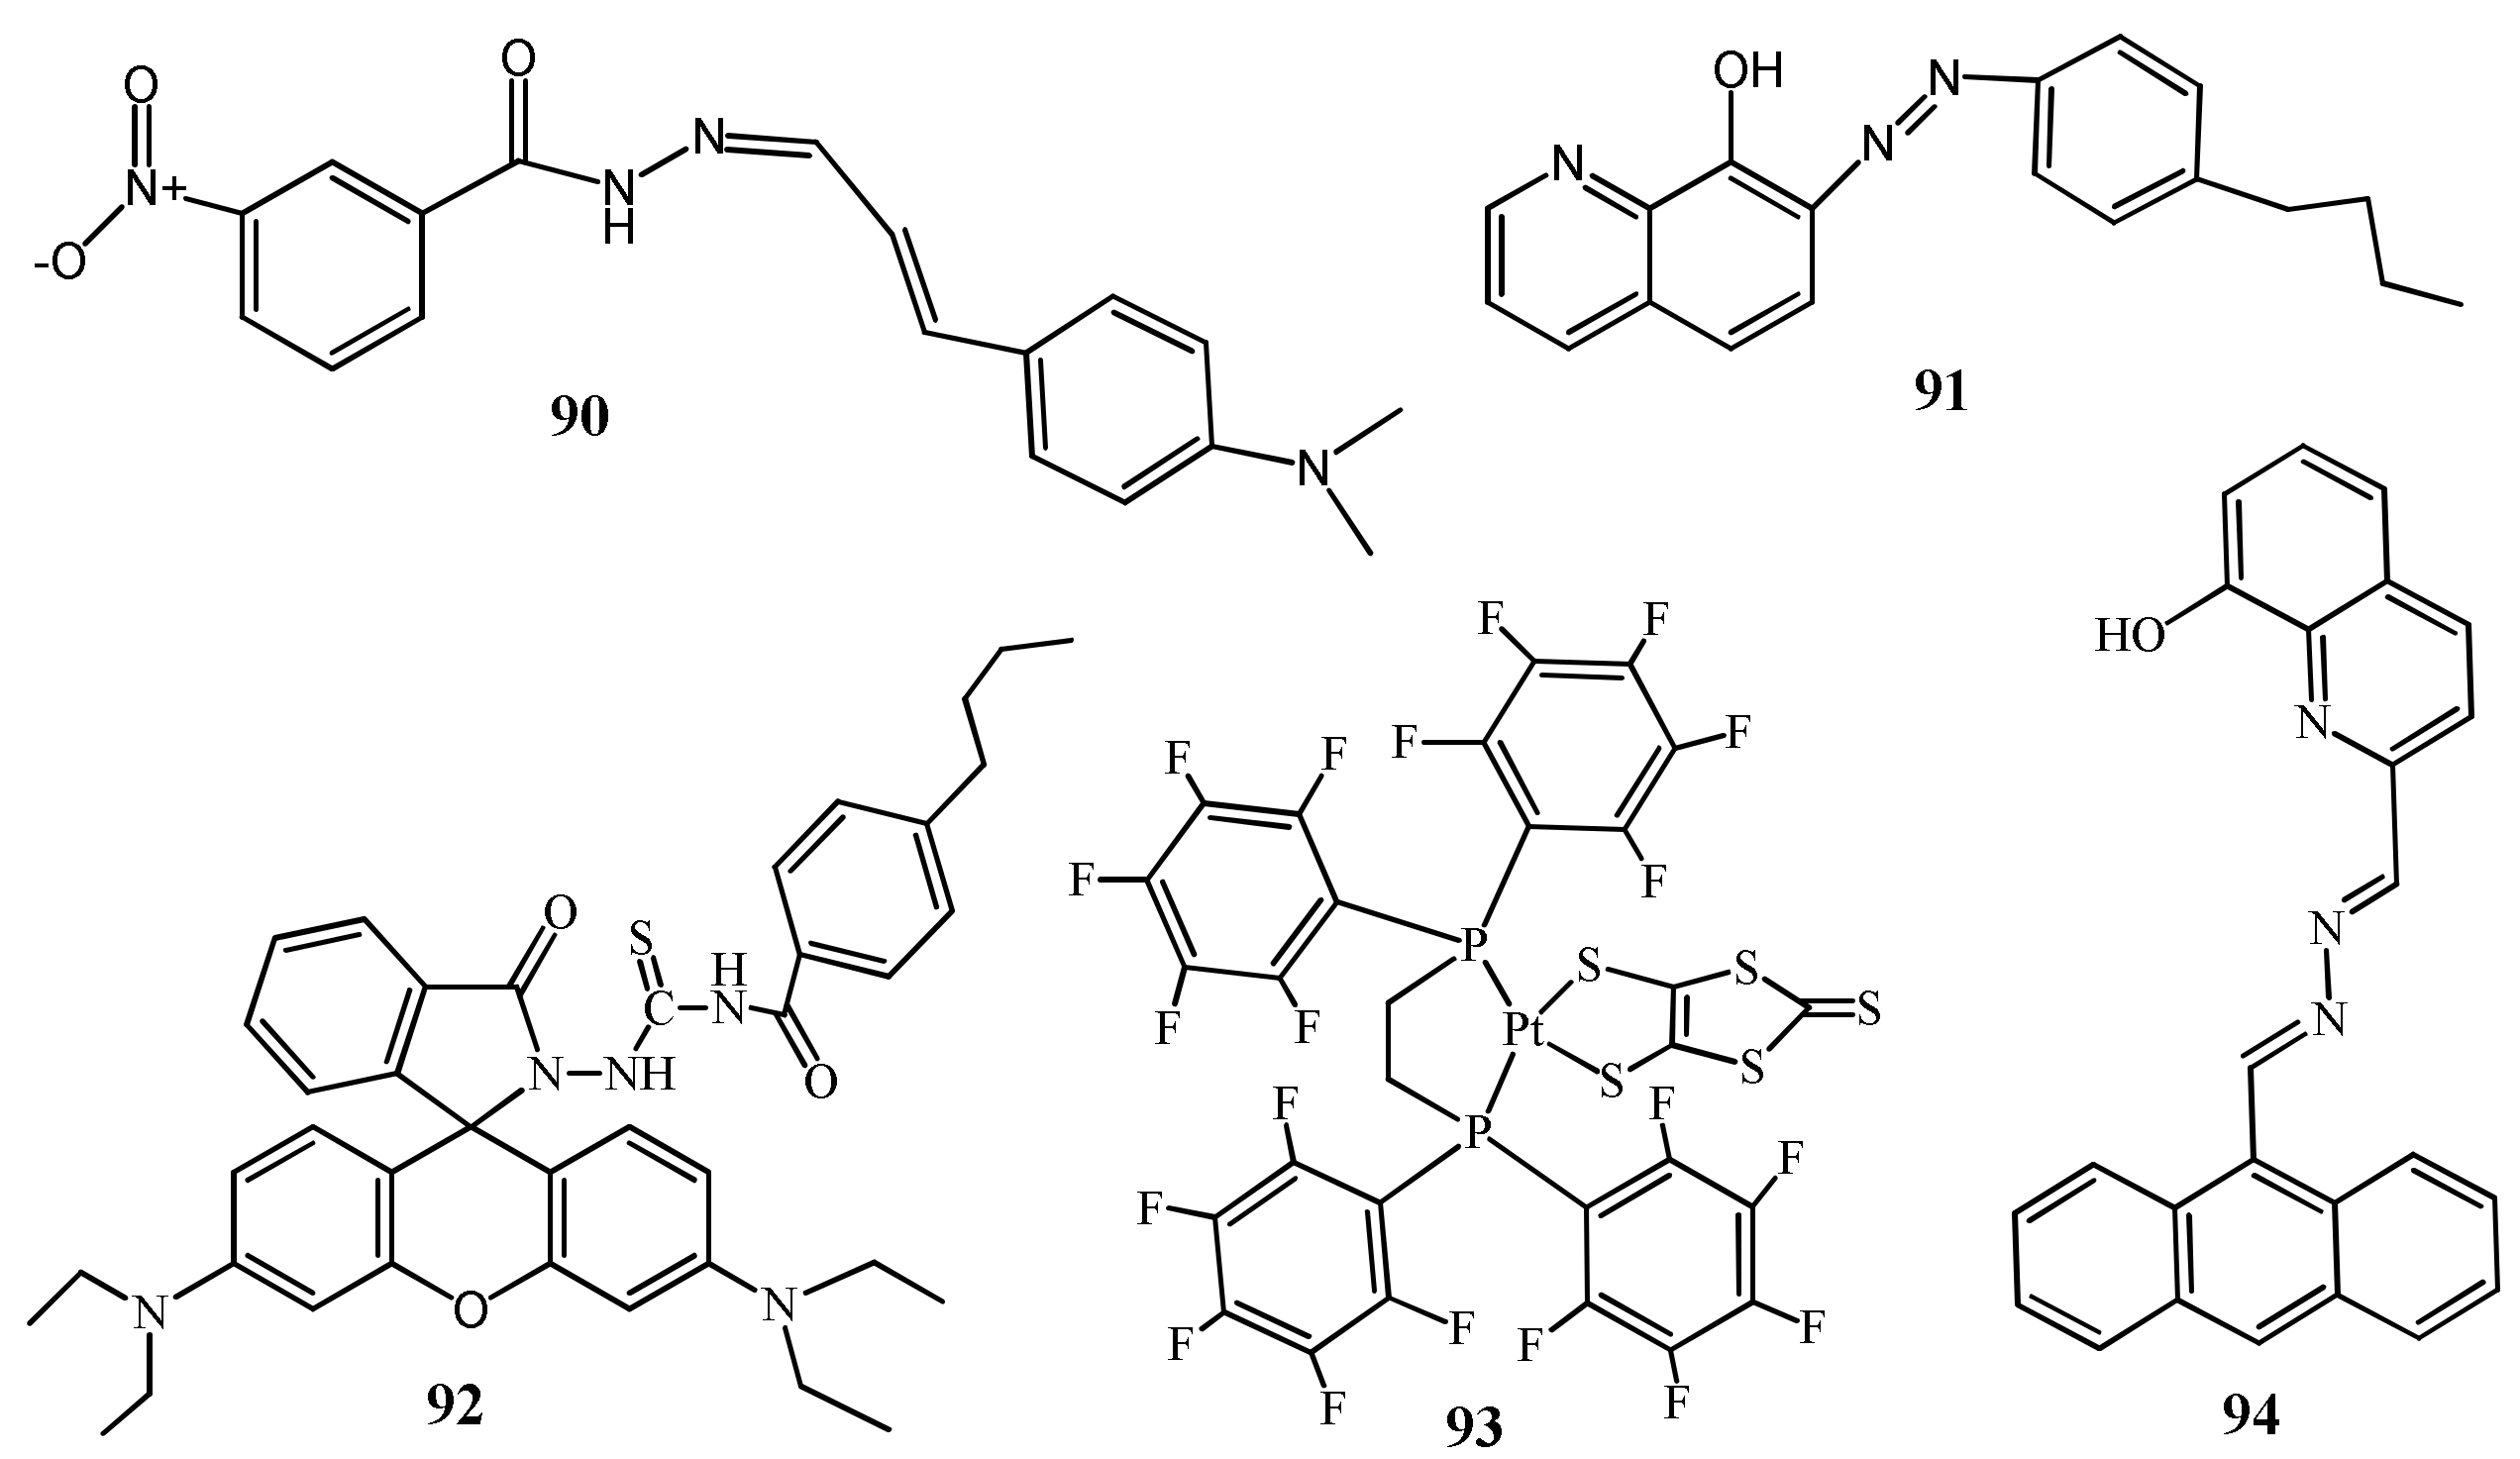
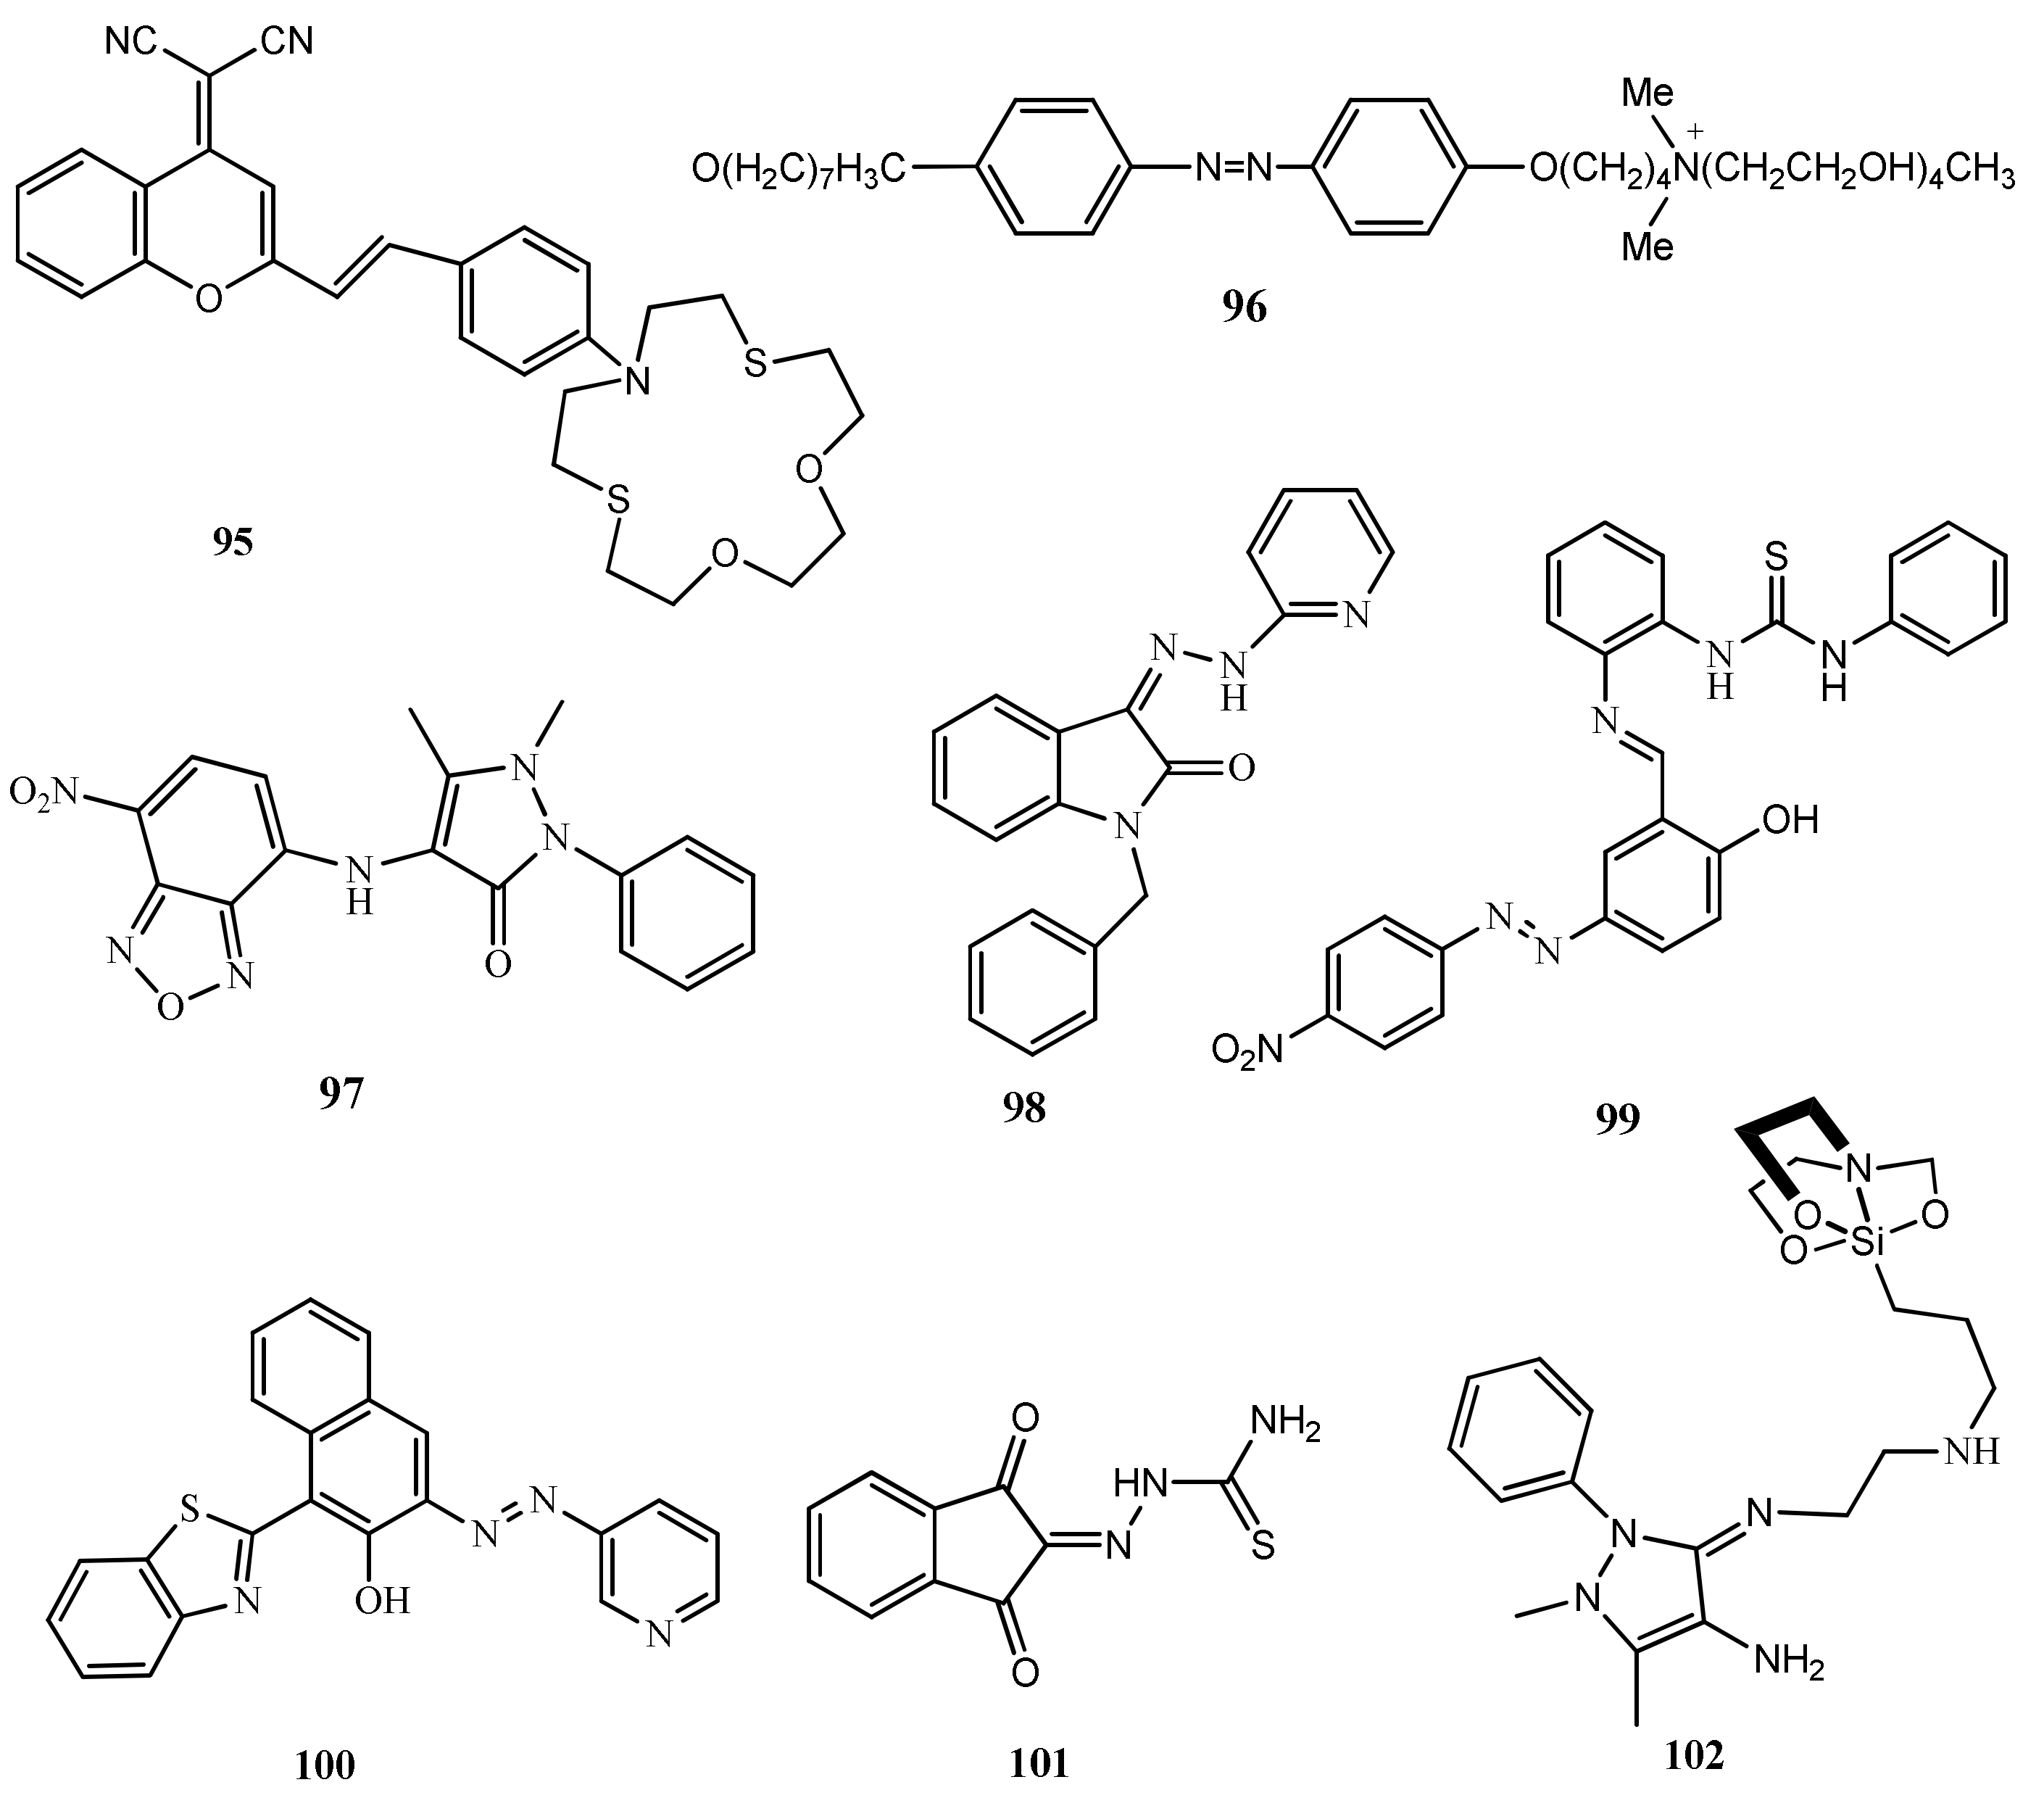
Table 1.
Some representative sources of exposure of the different forms of mercury, and the main affected organs [21].
Table 1.
Some representative sources of exposure of the different forms of mercury, and the main affected organs [21].
| Species | Occupational Exposure | Environmental Exposure | Routes of Exposure | Affected Organs |
|---|---|---|---|---|
| Elemental mercury, Hg | Chlor-alkali plants, gold extraction, incineration of wastes, coal burning, dental amalgam handling | Dental amalgam | Inhalation | Nervous system |
| Organic mercury, CH3Hg+ | - | Food (Fish and seafood) | Ingestion | Nervous system |
| Inorganic mercury, Hg2+ | - | Medicinal uses, dermatological creams | Ingestion, transdermal | Kidneys |
Table 2.
Analytical parameters for the fluorescent sensors 1 to 84.
| Sensors | Medium | λexc/λem (nm) | LOD | Applications | Ref. |
|---|---|---|---|---|---|
| 1 | H2O | 350/464 | 0.16 μM | Real water sample analysis | [32] |
| 2 | H2O | 500/632 | 39.2 nM | - | [33] |
| 3 | H2O | 316/416 | 0.1243 µM | Real water sample analysis | [34] |
| 4 | THF:H2O (1:49, v/v) | 380/500 | 22.8 ppb | - | [35] |
| 5 | CH3CN:H2O (1:1, v/v) | 270/380 | 0.68 μM | Real water analysis and pH sensing | [36] |
| 6 | EtOH | 410/485 | 172 nM | Living cell imaging | [37] |
| 7 | CH3CN:HEPES buffer (2:8, v/v) | 369/490 | 1 nM | Live-cell imaging | [38] |
| 8 | H2O | 490/574 | 312 nM | Real water sample analysis | [39] |
| 9 | Tris-HCL buffer | 358/445 | 4.40 μM | Real water sample analysis and live cell imaging | [40] |
| 10 | HEPES buffer | 330/550 | 7.59 nM | Real water samples and live cell imaging | [41] |
| 11 | CH3CN:H2O (6:4 v/v) | 375/485 | 1.26 nM | Test paper strip and real water analysis | [42] |
| 12 | CH3CN | 420/603 | 20 ppb | Removal from water | [43] |
| 13 | DMF | 325/463 | 17 nM | Air and real water samples | [44] |
| 14 | MeOH | 280/436 | 0.01 μM | - | [45] |
| 15 | H2O | 495/521 | 0.34 μM | Industrial effluents and paper strip | [46] |
| 16 | H2O | 430/512 | 5.02 mM | Real water analysis | [47] |
| 17 | MeOH:H2O (1/4, v/v) | 340/455 | 3.12 nM | Live cell imaging | [48] |
| 18 | CH3CN | 440/492 | 200 nM | Real water sample analysis | [49] |
| 19 | DMF:H2O (1:1, v/v) | 337/378 | 16 nM | - | [50] |
| 20 | H2O:DMSO (95:5, v/v) | 360/540 | 0.51 μM | - | [51] |
| 21 | H2O | 285/364,464 | 7.41 nM | Bioimaging | [52] |
| 22 | DMSO:HEPES buffer (9:1, v/v) | 355/455 | 8.12 nM | Live cell imaging | [53] |
| 23 | H2O | 359/495 | 22 nM | Real water analysis and bioimaging | [54] |
| 24 | MeOH:H2O (4:1, v/v) | 305/387 | 0.28 ppb | Real water analysis | [55] |
| 25 | DMF:HEPES buffer (1:1, v/v) | 315/495 | 0.645 µM | Real water analysis and live cell imaging | [56] |
| 26 | Acetonitrile:HEPES buffer (1:1, v/v) | 401/520 | 1.01 µM | Real water analysis | [57] |
| 27 | Acetonitrile:HEPES buffer (1:1, v/v) | 405/525 | 1.98 µM | - | [57] |
| 28 | THF:H2O (9:1, v/v) | 480/675 | 13.1 nM | Live cell imaging | [58] |
| 29 | H2O:DMSO (99.6: 0.4, v/v) | 495/543 | 19.2nM | Test color strips and bio-imaging | [59] |
| 30 | CH3CN/:H2O (4:6, v/v) | 520/587 | 3.9 ppb | Drinking water, live cells and plant tissues | [60] |
| 31 | CH3CN:HEPES (1:9, v/v) | 470/530 | 27 nM | Live cell imaging | [61] |
| 32 | MeOH:H2O (4:1, v/v) | 360/590 | 4.8 μM | Test paper strips, bioimaging | [62] |
| 33 | DMSO:H2O mixture | 360/453 | 406 nM | Adsorption of H2S | [63] |
| 34 | DMSO:H2O (2:8, v/v) | -/600 | 30 nM | Real food samples and live cell imaging | [64] |
| 35 | HEPES buffer (pH 7.4) | 480/518 | 3 nM | Real water and biological analysis | [65] |
| 36 | EtOH:H2O mixture | 366/491 | 750 nM | Real water sample analysis | [66] |
| 37 | CH3CN/H2O (0.2:99.8, v/v) | 366/463 | 2.1 nM | - | [67] |
| 38 | DMF:buffer (8:2, v/v) | 315/529 | 2.40 μM | Live cell imaging | [68] |
| 39 | DMF:buffer (8:2, v/v) | 470/621 | 2.86 μM | Live cell imaging | [68] |
| 40 | DMF:buffer (8:2, v/v) | 470/614 | 0.22 μM | Live cell imaging | [68] |
| 41 | H2O | 480/532 | 8.619 nM | Real water analysis and live cell imaging | [69] |
| 42 | PBS buffer | 460/515 | 0.4 nM | Real water analysis and live cell Imaging | [70] |
| 43 | CH3CN:HEPES buffer (1:9, v/v). | 545/580 | - | - | [71] |
| 44 | DMSO | 520/606 | 0.13 µM | INHIBIT logic gate | [72] |
| 45 | CH3CN:HEPES buffer(2:8, v/v) | 580/691 | 1.5 nM | Living cells imaging | [73] |
| 45 | EtOH:HEPES buffer (1:1 v/v) | 590/664 | 1.87 ppb | Real water sample analysis | [74] |
| 46 | H2O | 335/574 | 3.55×10⁻¹³ mL−1 | - | [75] |
| 47 | DMF:H2O (7/3, v/v) | 390/504,613 | 0.2 µM | Living cells | [76] |
| 48 | CH3CN | 510/573 | 28.5 nM | - | [77] |
| 49 | DMSO:H2O (6:4, v/v) | 505/585 | 16.9 nM | - | [78] |
| 50 | CH3CN | 520/585 | 16 nM | Real water sample analysis | [79] |
| 51 | DMSO:H2O (1:1; v/v) | 500/562 | 26 nM | Real water sample analysis | [80] |
| 52 | DMSO:H2O (7/3, v/v) | 490/581 | 14.9 nM | - | [81] |
| 53 | CH3CN:H2O (7/3, v/v) | 520/604 | 0.38 μM | Test color strips and biosensing | [82] |
| 54 | DMF:Tris-HCl buffer (1:1, v/v) | 562/557 | 1.61 nM | Bio-sensing and live cell imaging | [83] |
| 55 | H2O:THF (4:1, v/v) | 565/590 | 16 nM | Live cell imaging | [84] |
| 56 | DMSO:H2O (7:3, v/v) | 480/582 | 13.4 nM | Test color strips and live cell imaging | [85] |
| 57 | DMSO:H2O (7:3, v/v) | 480/578 | 15.6 nM | Test color strips and live cell imaging | [85] |
| 58 | DMSO:H2O (7:3, v/v) | -/560 | 16.1 nM | Test paper strips and real water analysis | [86] |
| 59 | H2O | - | 120 nM | Real water sample analysis | [87] |
| 60 | HEPES buffer | 330/550 | 23.0 nM | Test color strips and sensing of biothiols | [88] |
| 61 | HEPES buffer | 310/430,548 | 1.3 nM | Environmental water samples | [89] |
| 62 | HEPES buffer | 330/545 | 22.65 nM | Biosensing | [90] |
| 63 | DMSO:HEPES medium (1:99, v/v) | 340/390 | 14.7 nM | Real water sample analysis | [91] |
| 64 | EtOH-H2O (9:1, v/v) | 500/385,447 | 0.22 μM | - | [92] |
| 65 | CH3CN:DMSO (99:1, v/v) | 340/395 | 8.11 nM | IMPLICATION logic gates | [93] |
| 66 | H2O | 390/455 | 7.9 | River water and live cell imaging | [94] |
| 67 | EtOH | 300 580 | 1.10 μM | Test color strips and real water analysis | [95] |
| 68 | DMSO:H2O (1:3, v/v) | 321/444,644 | 48.79 nM | Real water and beverages samples | [96] |
| 69 | EtOH:H2O (2:8, v/v) | 332/475 | 146 nM | Real waste water analysis | [97] |
| 70 | EtOH:HEPES buffer (1:9, v/v) | 450/495,600 | 1.6 nM | Real water analysis and live cell imaging | [98] |
| 71 | H2O | 300/443 | 39.28 nM | Test color strips and real water analysis | [99] |
| 72 | THF-H2O (1:9, v/v) | 490/667 | 33 nM | Biological sample and live cell imaging | [100] |
| 73 | HEPES-DMSO (99:1, v/v) | 325/630 | 15.1 μM | Bioimaging | [101] |
| 74 | PBS buffer (pH 7.4) | 390/445 | 21.2 nM | Real water analysis and live cell imaging | [102] |
| 75 | DMSO:PBS buffer (1:99, v/v) | 380/475 | 36 nM | Real water analysis and live cell imaging | [103] |
| 76 | DMSO:PBS buffer (1:99, v/v) | 365/518 | 19.3 nM | Real sample analysis, test color strips and cell imaging | [104] |
| 77 | H2O | 370/470 | 19 nM | Real water, seafood, human urine samples, test color strips and bio-imaging | [105] |
| 78 | PBS buffer | 414/510 | 40 nM | Living cell imaging | [106] |
| 79 | THF:H2O (1/99, v/v) | 353/477 | 20 nM | Test color strips and real water analysis | [107] |
| 80 | H2O | 390/461 | 1.11 μM | - | [108] |
| 81 | H2O | 390/464 | 1.89 μM | - | [108] |
| 82 | DMF:H2O (1:1, v/v) | 330/549 | 0.21 µM | - | [109] |
| 83 | DMF:H2O (1:1, v/v) | 331/550 | 0.63 µM | - | [109] |
| 84 | DMF:H2O (1:1, v/v) | 335/559 | 0.19 µM | - | [109] |
Table 3.
Analytical parameters of the colorimetric sensors 85 to 102.
| Sensors | Medium | λabs (with/without Hg2+) | LOD | Applications | Ref. |
|---|---|---|---|---|---|
| 85 | Aqueous media | Quenching of bands at 506 and 730 nm | 21 nM | - | [110] |
| 86 | DMSO:HEPES (5:95, v/v) | Quenching at 503 with the new band formation at 610 nm | 53 nM | Polymer coated membrane | [111] |
| 87 | HEPES buffer | Quenching of bands at 390 and 530 nm | 0.27 μM | Test color strips | [112] |
| 88 | CH3CN:H2O (7:3, v/v) | Band at 447 nm shifted to 519 nm | 0.473 μM | Test color strips and real water analysis | [113] |
| 89 | DMSO:H2O (4:1 v/v) | Band at 502 nm shifted to 395 nm | 6.1 μM | Cellulose test strips, Logic Gate Operation | [114] |
| 90 | BufferDMF (98:2, v/v). | Quenching of bands at 350 and enhancement at 400 nm | 0.11 µM | Real water sample analysis | [115] |
| 91 | Aqueous medium | Enhancement of band at 540 nm | 0.100 and 0.180 μg/L | Real water sample analysis | [116] |
| 92 | Aqueous medium | Enhancement of band at 567 nm | 0.22 and 0.61µg/L | Real water sample analysis | [117] |
| 93 | CH3CN:H2O (1:1, v/v) | Band at 448 nm shifted to 523 nm | - | - | [118] |
| 94 | CH3OH:HEPES (7: 3, v/v) | Band at 414 nm shifted to 498 nm | 220 nM | Real water analysis, silica coating and test color strips | [119] |
| 95 | CH3CN:H2O (1:1, v/v). | Band at 517 nm shifted to 415 nm | - | Real water analysis | [120] |
| 96 | HEPES buffered | Band at 247 nm shifted to 234 nm | 40 nM | - | [121] |
| 97 | CH3OH:H2O (1: 1, v/v) | Band at 465 nm shifted to 485 nm | 25.7 nM | INHIBIT logic gate | [122] |
| 98 | MeCN:H2O (1:1, v/v) | Formation of new band at 470 and quenching at 380 nm | 0.95 nM | Real water sample analysis | [123] |
| 99 | DMSO:H2O (2:1, v/v) | Enhancement of band at 280 nm | 4.89 μM | Real water sample analysis | [124] |
| 100 | H2O:CH3CN (9:1, v/v) | Quenching of bands at 319 and 380 nm with the formation of new band at 610 nm | 8.5 μM | Test color strips and real water sample analysis | [125] |
| 101 | Aqueous medium | Band at 335 nm shifted to 305 nm | 1 μM | Real time application | [126] |
| 102 | DMSO:H2O (8:2, v/v) | Band at 290 nm shifted and two new bands formed at 255 and 292 nm | 0.10 mM | - | [127] |
Publisher’s Note: MDPI stays neutral with regard to jurisdictional claims in published maps and institutional affiliations. |
© 2021 by the authors. Licensee MDPI, Basel, Switzerland. This article is an open access article distributed under the terms and conditions of the Creative Commons Attribution (CC BY) license (http://creativecommons.org/licenses/by/4.0/).
Share and Cite
MDPI and ACS Style
Bhardwaj, V.; Nurchi, V.M.; Sahoo, S.K. Mercury Toxicity and Detection Using Chromo-Fluorogenic Chemosensors. Pharmaceuticals 2021, 14, 123. https://0-doi-org.brum.beds.ac.uk/10.3390/ph14020123
AMA Style
Bhardwaj V, Nurchi VM, Sahoo SK. Mercury Toxicity and Detection Using Chromo-Fluorogenic Chemosensors. Pharmaceuticals. 2021; 14(2):123. https://0-doi-org.brum.beds.ac.uk/10.3390/ph14020123
Chicago/Turabian StyleBhardwaj, Vinita, Valeria M. Nurchi, and Suban K. Sahoo. 2021. "Mercury Toxicity and Detection Using Chromo-Fluorogenic Chemosensors" Pharmaceuticals 14, no. 2: 123. https://0-doi-org.brum.beds.ac.uk/10.3390/ph14020123
Note that from the first issue of 2016, this journal uses article numbers instead of page numbers. See further details here.