2.1. Setup of Experimental Conditions
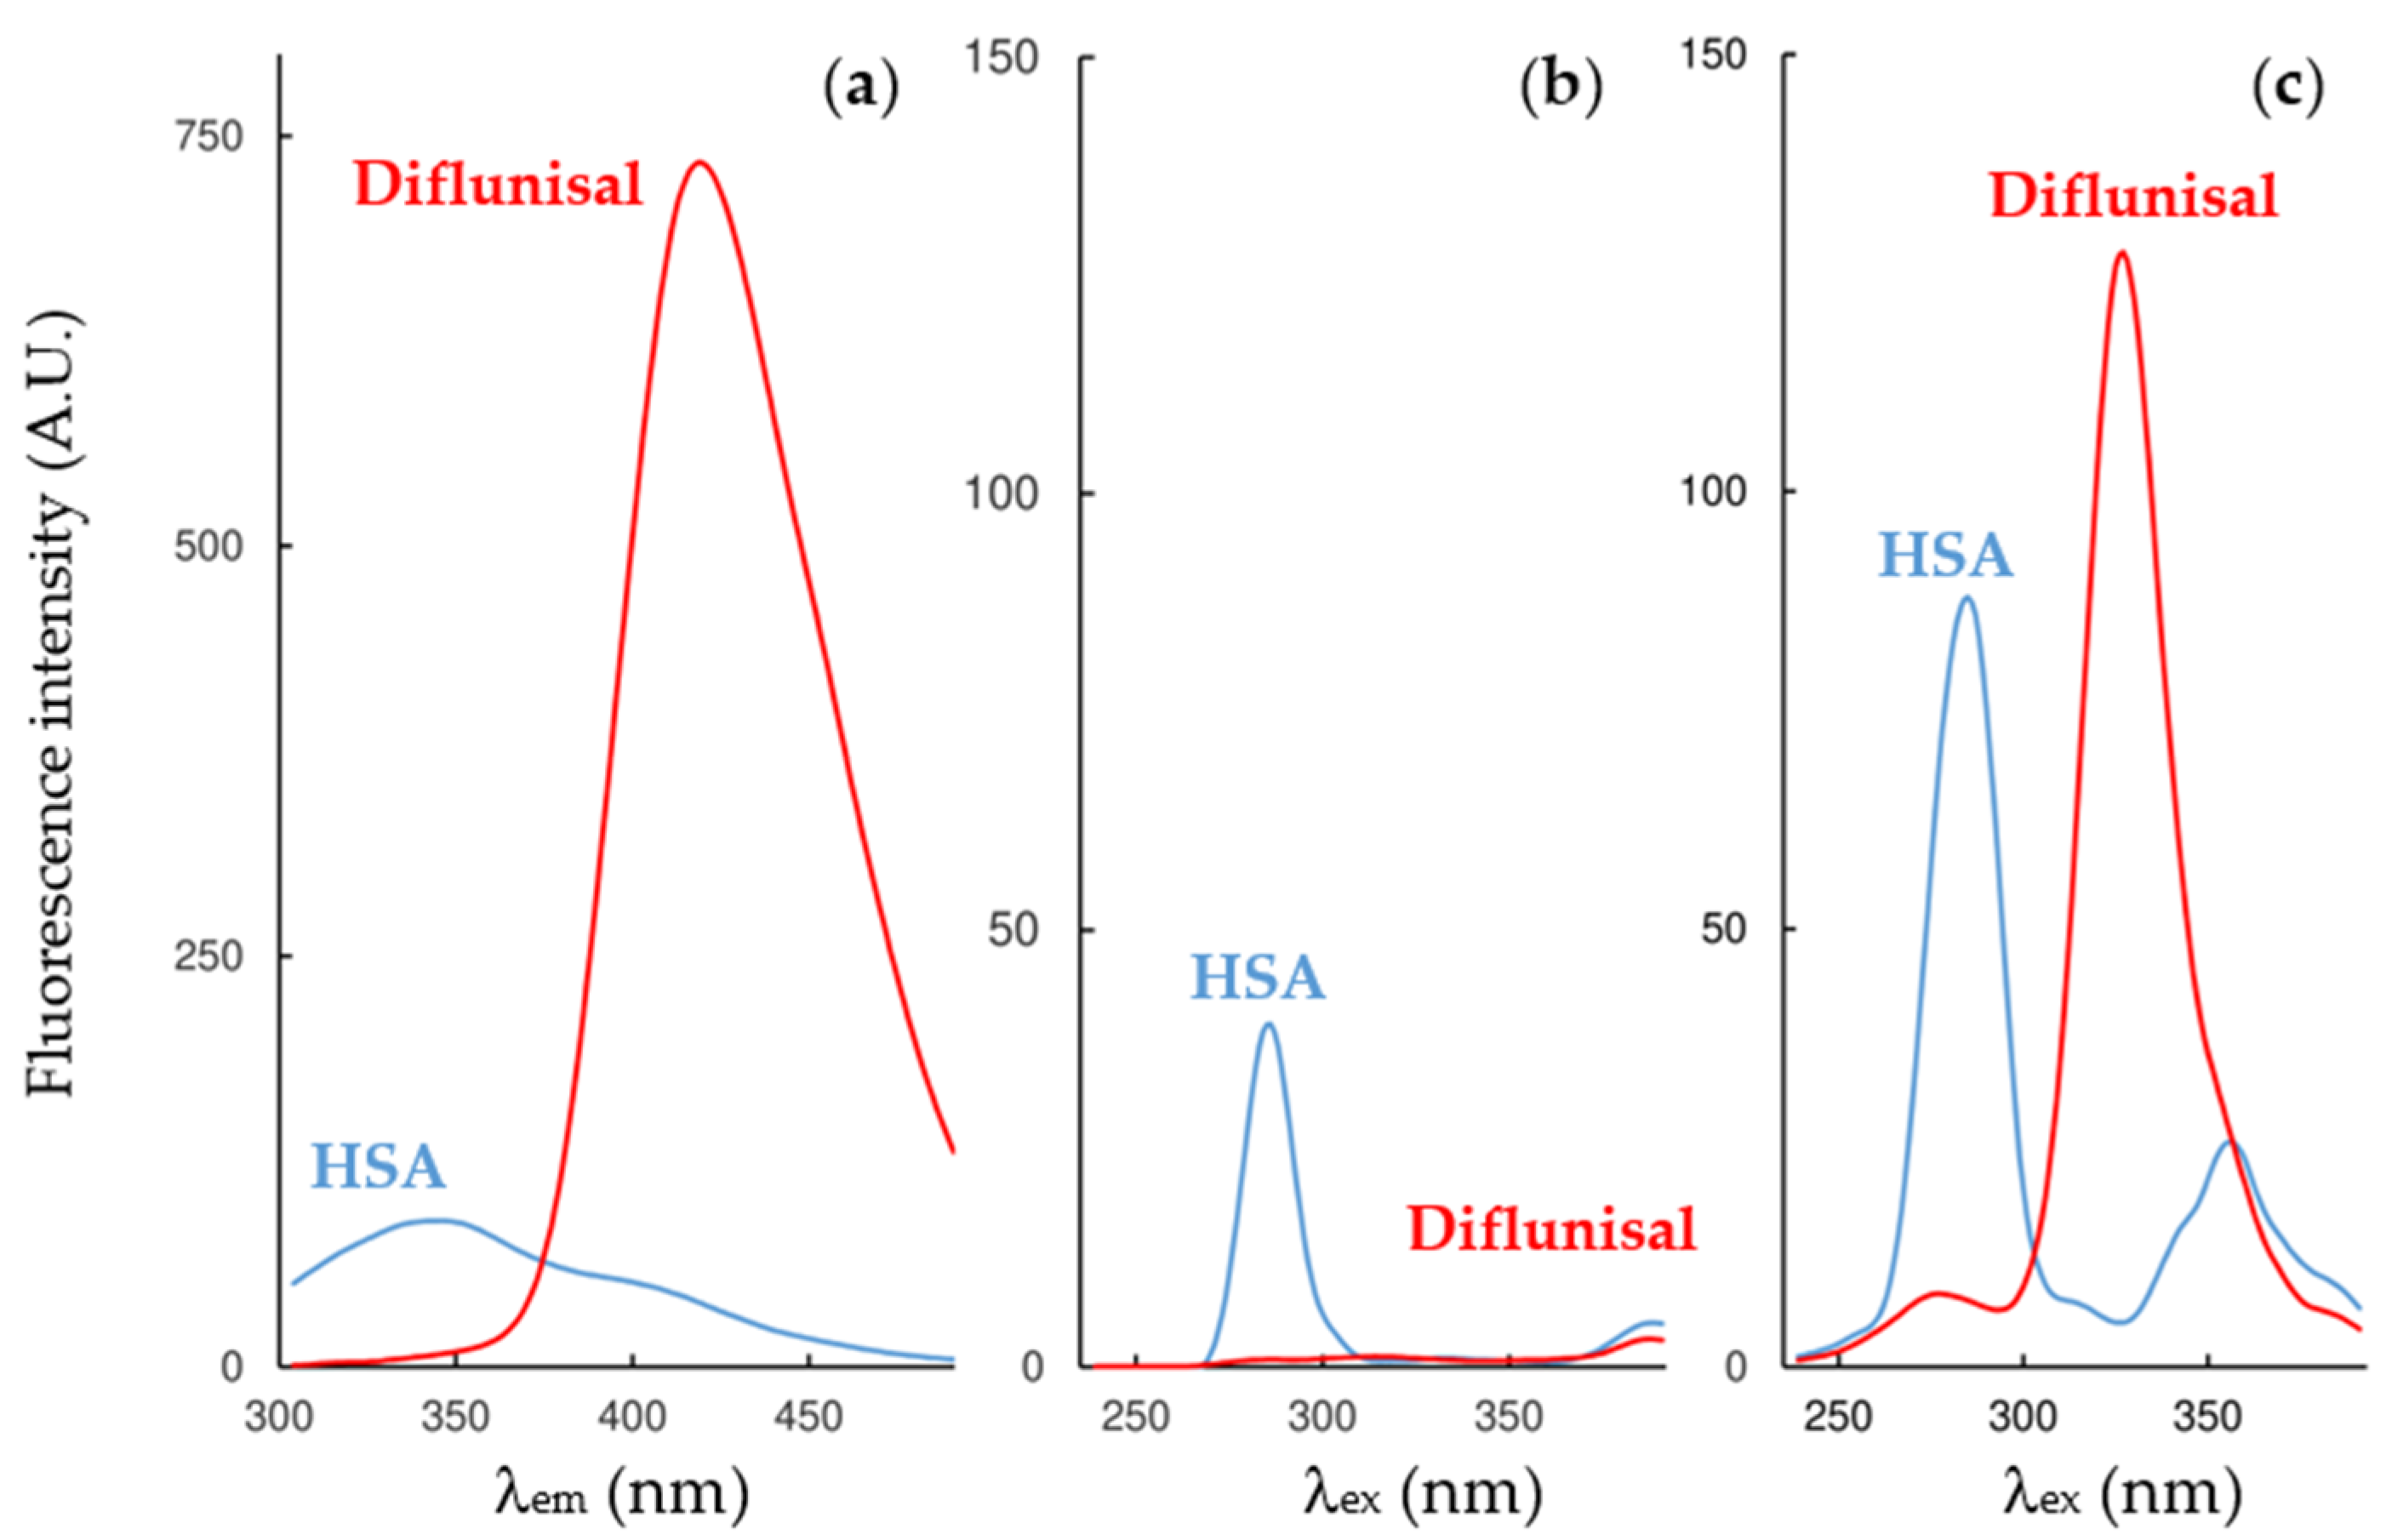
To select the optimal wavelengths for the DLSV approach, the single spectrum of each compound has been evaluated. HSA shows maximum fluorescence in the emission mode at 346 nm (
λex = 285 nm), and in the synchronous modes at 285–286 nm.
Table 1 shows the percentage of interferences (calculated as
Idrug/
Itotal × 100) produced by the inner fluorescence of the drugs over the HSA at the wavelength of its maximum fluorescence intensity. On the one hand, flurbiprofen shows significant interferences at the three modes of work, and naproxen in the emission mode and in the Δ
λ 60 nm synchronous mode. On the other, ibuprofen and diflunisal show minor interferences at the three modes, and naproxen in the Δ
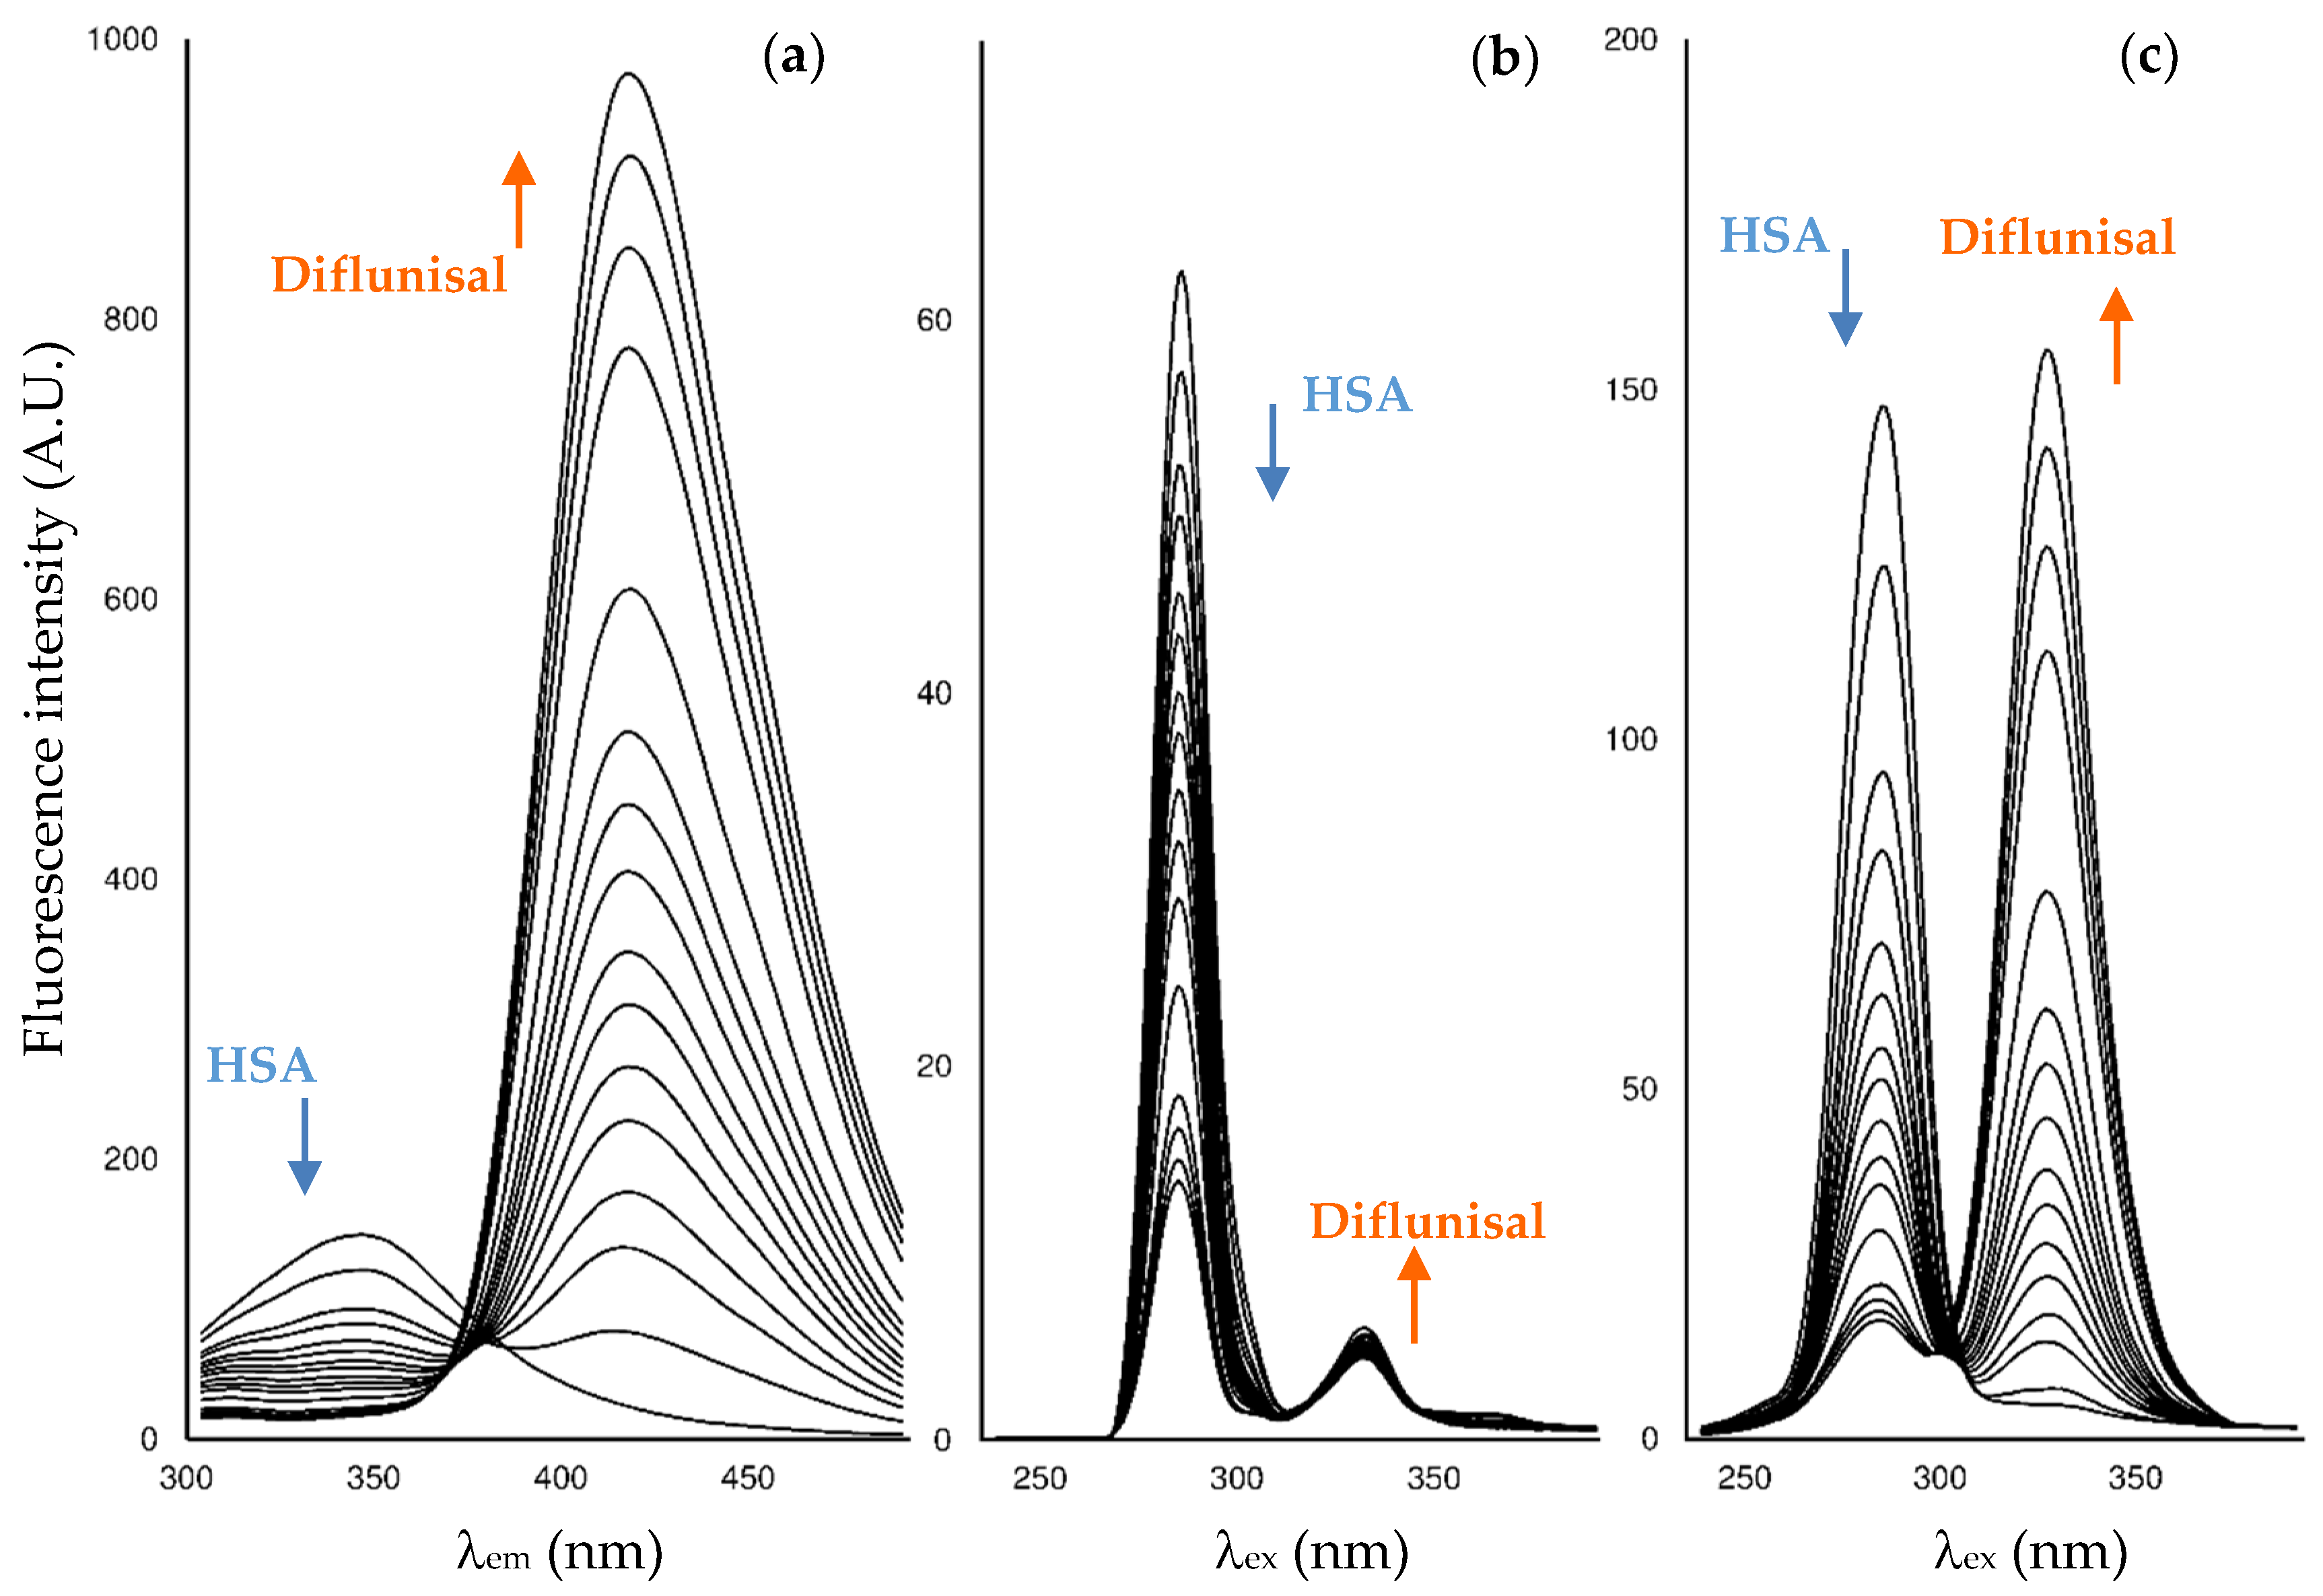
λ 5 nm synchronous mode. As an example, the fluorescence spectra of diflunisal and HSA at 25 °C at the three fluorescence modes of work are shown in
Figure 1.
The wavelengths selected for the DLSV approach and the corresponding spectral differences are indicated in
Table 1. The criterion for selection is to choose the wavelength with the maximum protein fluorescence signal and the minimum drug fluorescence interference. We assume that the interferences under 10% can be evaluated using the DLSV equation. In the case of ibuprofen and diflunisal (at the three modes), and naproxen (synchronous ∆
λ = 15 nm), it is possible to work at wavelengths near the maximum fluorescence intensity of the albumin. In the case of naproxen using the emission mode, it is possible to use the DLSV approach in conditions not far from the albumin fluorescence maximum, with the drawback to having lower sensitivities, and hence, higher experimental errors. Last, as flurbiprofen shows significant spectral interferences with the albumin in the whole range of work, it is not possible to evaluate this drug using the DLSV approach. The interactions of naproxen using the synchronous mode at ∆
λ = 60 nm cannot be evaluated either with this approach.
2.2. Fluorescence Measurements for Drug-Albumin Interaction
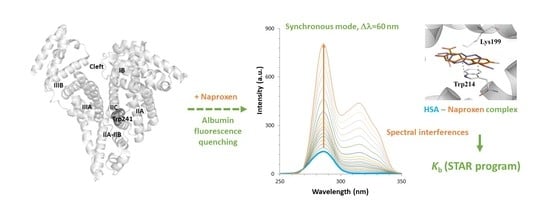
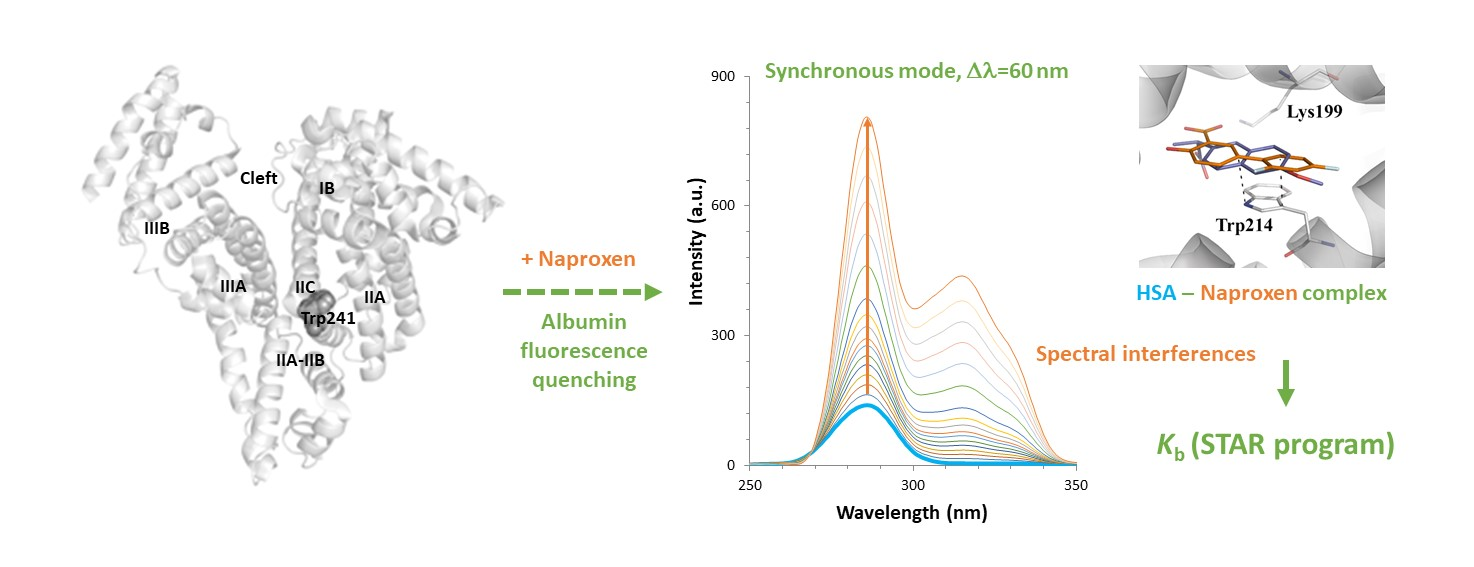
When successive amounts of the studied drugs are added to a fixed concentration of HSA, the albumin fluorescence is quenched. As an example,
Figure 2 shows the changes in the fluorescence spectra for HSA after the addition of increasing amounts of diflunisal. Here, HSA experiences fluorescence decay when the quencher is added, and the drug-protein complex is formed. On its behalf, as diflunisal also has fluorophore groups that emit in the emission and synchronous Δ
λ 60 nm modes, the fluorescence of the free-drug form increases when an excess of diflunisal is added to the cuvette (the fluorescence study on the other two NSAIDs is shown in
Supporting Information Figure S1).
The binding parameters have been calculated by evaluating the quenching event using first the DLSV approach (25 °C). In a first instance, we have checked that the formation of the ground-state complex occurs, as the bimolecular quenching constant obtained from the SV equation is higher than the maximum value possible for diffusion-limited quenching in water (∼10
10 M
−1 s
−1) for all the HSA-drug experiments (data not shown). Afterwards, the interactions have been evaluated by the DLSV equation (Equation (3)), considering the data obtained from the different fluorescence modes separately (
Table 2).
Next, the interactions have been quantified using the STAR program approach (at 20, 25, and 37 °C) (
Table 3). Here, due to the data handling ability of the program, the data from the different fluorescence modes has been treated simultaneously to obtain more precise binding parameters values. The simultaneous evaluation has been possible because in an initial data treatment, we did not observe significant differences in the binding results between the three fluorescence modes for the NSAIDs under study.
Ibuprofen. Fluorescence data, treated whether with the DLSV approach or the STAR program, have not provided quantitative binding data values for the HSA-ibuprofen complex. In the first case, a log
Kb1 in the order of 2–3 units could be intuited, although the error associated with the calculation was of the same order of magnitude. In the second, the errors during the mathematical evaluation of the data were high and did not detect any binding event (
Figure S1.1 in Supporting Information shows the small changes in the spectra produced with the addition of ibuprofen). Other complementary techniques, such as equilibrium dialysis, capillary electrophoresis, and ITC ([
13] and
Table 4 and
Table 5), indicate that the HSA-ibuprofen interaction occurs, and the associated binding constant is of the same order of magnitude as the binding constant determined for other NSAIDs. The reason for this difference is that the fluorescence quenching technique only evaluates those interactions that occur in the environment of the fluorophores. Therefore, it can be concluded that those interactions reported in the literature take place far from the fluorophores, particularly Trp214, present in the binding sites of HSA.
Naproxen. The STAR program approach has shown log
Kb values of ~4.8. Although previous studies show that naproxen can bind to albumin at different binding sites [
13], the best model obtained with the STAR program contains only one interaction. Moreover, the analysis of experimental data of the fluorescence quenching study treated with the STAR program at different temperatures shows that the binding constant is not temperature-dependent in the working range (20–37 °C). With respect to the DLSV approach, the slightly lower values obtained by this second method (log
Kb ~ 4.0) could be due to the restriction of the model to deal with spectral interferences coming from the drug itself.
As suggested in the literature, the fluorescence quenching studies have been performed at different acquisition modes to putatively distinguish between the contributions of the different fluorophores (emission for the global fluorescence, synchronous at Δλ = 15 nm for Tyr and synchronous at Δλ = 60 nm for Trp). Using either DLSV or STAR program approaches, the binding constant values do not vary to a high extent considering the three modes of acquisition.
In a previous study performed by recording the fluorescence decay by using time-correlated single-photon counting (TCSPC), the log
Kb value obtained for the HSA-naproxen complex was 5.59 [
16]. This log
Kb value is slightly lower than the main binding event obtained by ITC by our research group (5.95;
Table 4). The second binding event quantified by ITC (log
Kb2 = 4.85) and by CE-FA is similar to the value obtained by FS in the present study using the STAR program approach, and slightly higher than the one obtained by the DLSV approach.
Diflunisal. The results using the STAR program show the presence of two interactions with an affinity difference of one order of magnitude (log
Kb1 ~ 5.7 and log
Kb2 ~ 4.7, respectively). The log
Kb1 value agrees with those reported in the literature (
Table 5 and [
19]), although there are differences in the stoichiometry. When evaluating the data using the DLSV approach, only one interaction with an average value between log
Kb1 and log
Kb2 obtained with the STAR program is observed (log
Kb ~ 5.2). This value is similar to the one obtained when limiting the equilibrium model in STAR to a single possible interaction (data not shown) and to the one reported in the literature using the DLSV data treatment approach [
17]. Consequently, when multiple species are associated with the binding process, the DLSV approach calculates the main binding event, whereas the STAR program studies all the species in equilibrium. As the other NSAIDs considered in the present work, the binding values do not show temperature dependence in the working range, or a variation using different FS acquisition modes.
Flurbiprofen. In the case of HSA-flurbiprofen binding, the DLSV approach could not be used to perform the data treatment, due to the drug-related interferences (
Table 1). The STAR program can deal with the data with one restriction: The 1:1 binding equilibria had to be calculated considering the emission and synchronous Δ
λ = 15 nm mode and fixed, and next, the 1:2 binding equilibria was calculated using the data of the three fluorescence modes. The reason is that the synchronous Δ
λ = 60 nm mode offered spectra with such high intensities that they could not be considered together with those of the two other modes in a first instance.
Results show that there exist two binding events (1:1 and 1:2, respectively) with close binding constant values (both in the order of log
Kb ~ 5). These values are very similar at the three temperatures considered, and hence, it is not possible to evaluate thermodynamic parameters using the van’t Hoff equation. The binding values agree with other values reported in the literature [
13], though there are differences in the stoichiometry. If we consider the values that we obtained previously (
Table 4), the
Kb determined by FS corresponds to the
Kb2 value obtained by ITC and CE-FA. We assume that the first interaction obtained by ITC corresponds to the interaction that occurs in the main binding site of flurbiprofen, in an attachment point free from fluorophores in the nearby. As other binding events with different stoichiometries and binding constant values have been observed with different complementary techniques (
Table 4 and [
13]), there would exist other binding sites with a lower affinity to flurbiprofen.
2.3. Structural Analysis of NSAID-HSA Complexes
To examine the data obtained from FS measurements and the complementary techniques reported in the literature (
Table 4 and
Table 5), a crystallographic analysis of the albumin complexes with (
S)-ibuprofen, (
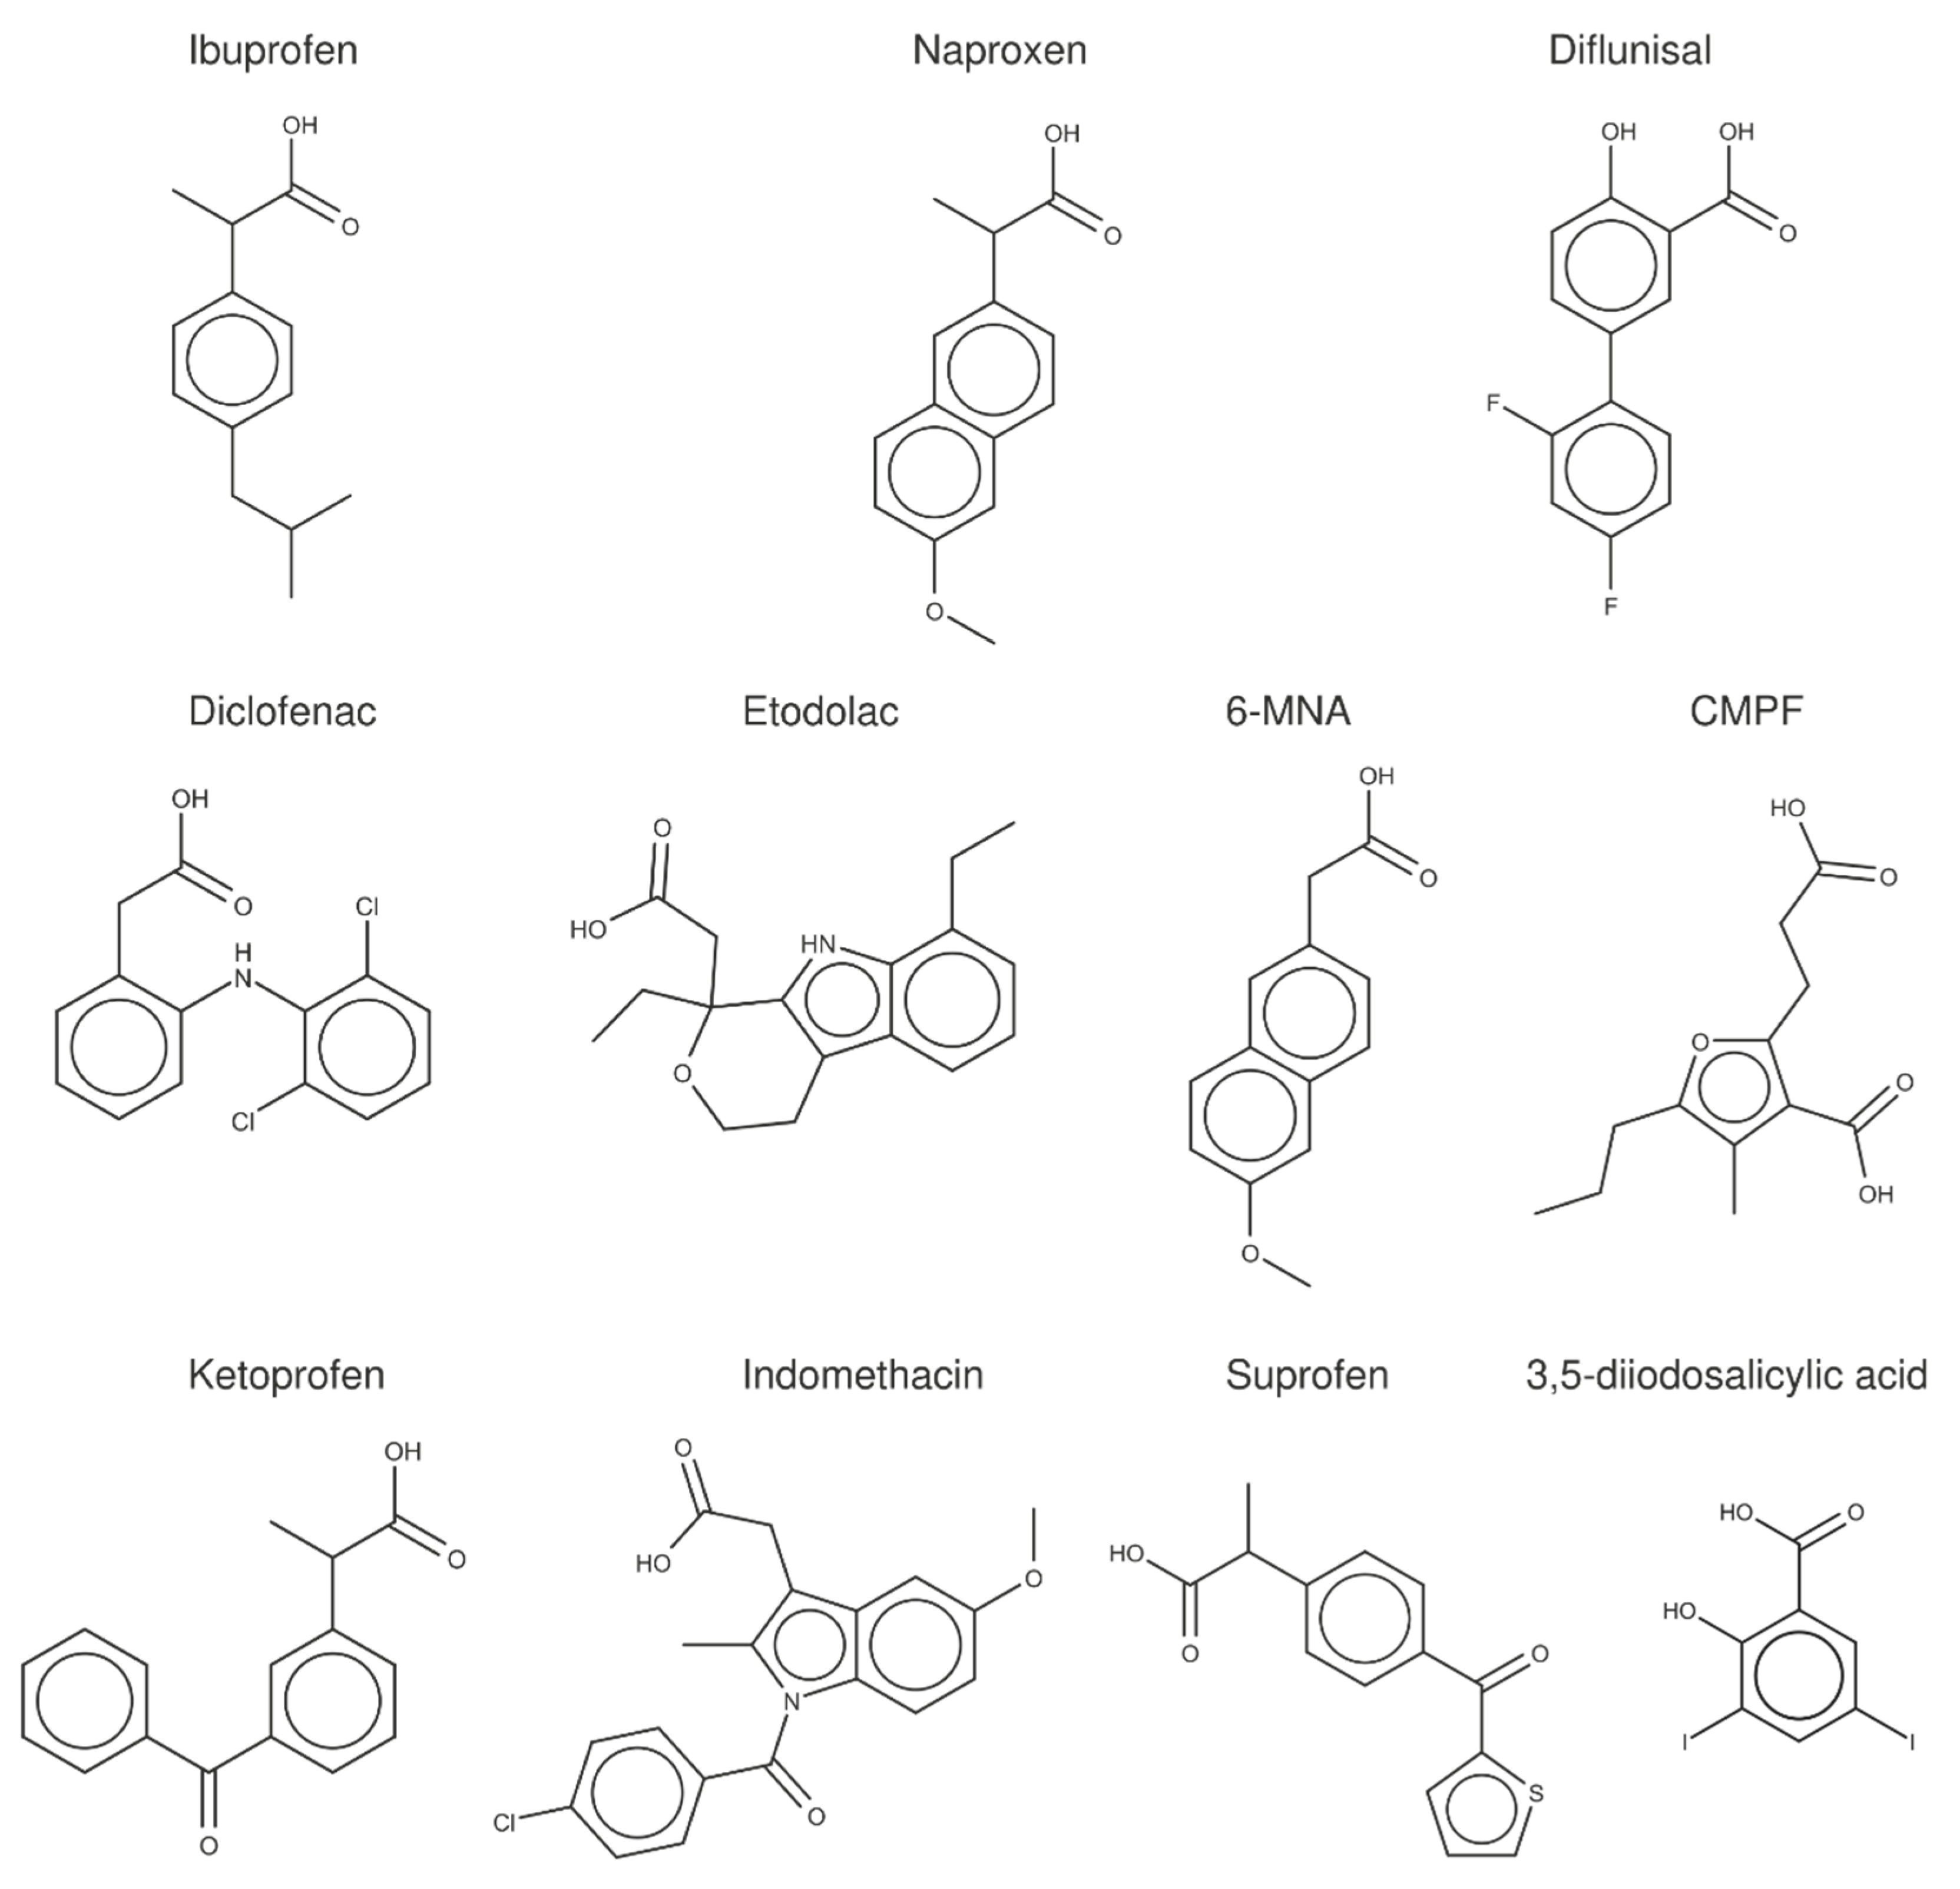
S)-naproxen, diflunisal, and a set of structurally related compounds (
Figure 3) was performed.
In the last years, previous studies have examined the binding of fatty acids, endogenous compounds, and a variety of drugs to albumin [
3,
20], expanding the previous work by Ghuman et al. [
5]. For our purposes here, the X-ray crystallographic analysis was specifically focused on compounds that exhibit an amphiphilic character, sharing a negatively charged carboxylate group bound directly or through a short methylenic chain to an aromatic ring. Furthermore, with the exception of 3,5-diiodosalicylic acid, they have a similar size and shape, as noted in an average surface and volume of 306 ± 44 Å
2 and 229 ± 33 Å
3 (
Supporting Information Table S1). On the other hand, the X-ray crystallographic structures correspond to the complexes formed with HSA (8 structures), but also with
Equus caballus (ESA; 13),
Bos taurus (BSA; 4),
Ovis aries (2),
Capra Hircus (1) and
Oryctolagus cuniculus (2), leading to 31 X-ray complexes (
Table 6). The inclusion of these complexes was motivated by the preservation of the global fold of the protein backbone (see
Figure 4), the high sequence identity found between the albumins of these organisms with HSA, which is higher than 75% (>87% when conservative changes are considered), and particularly to the preservation of the residues that shape the binding pockets (
Supporting Information Table S2).
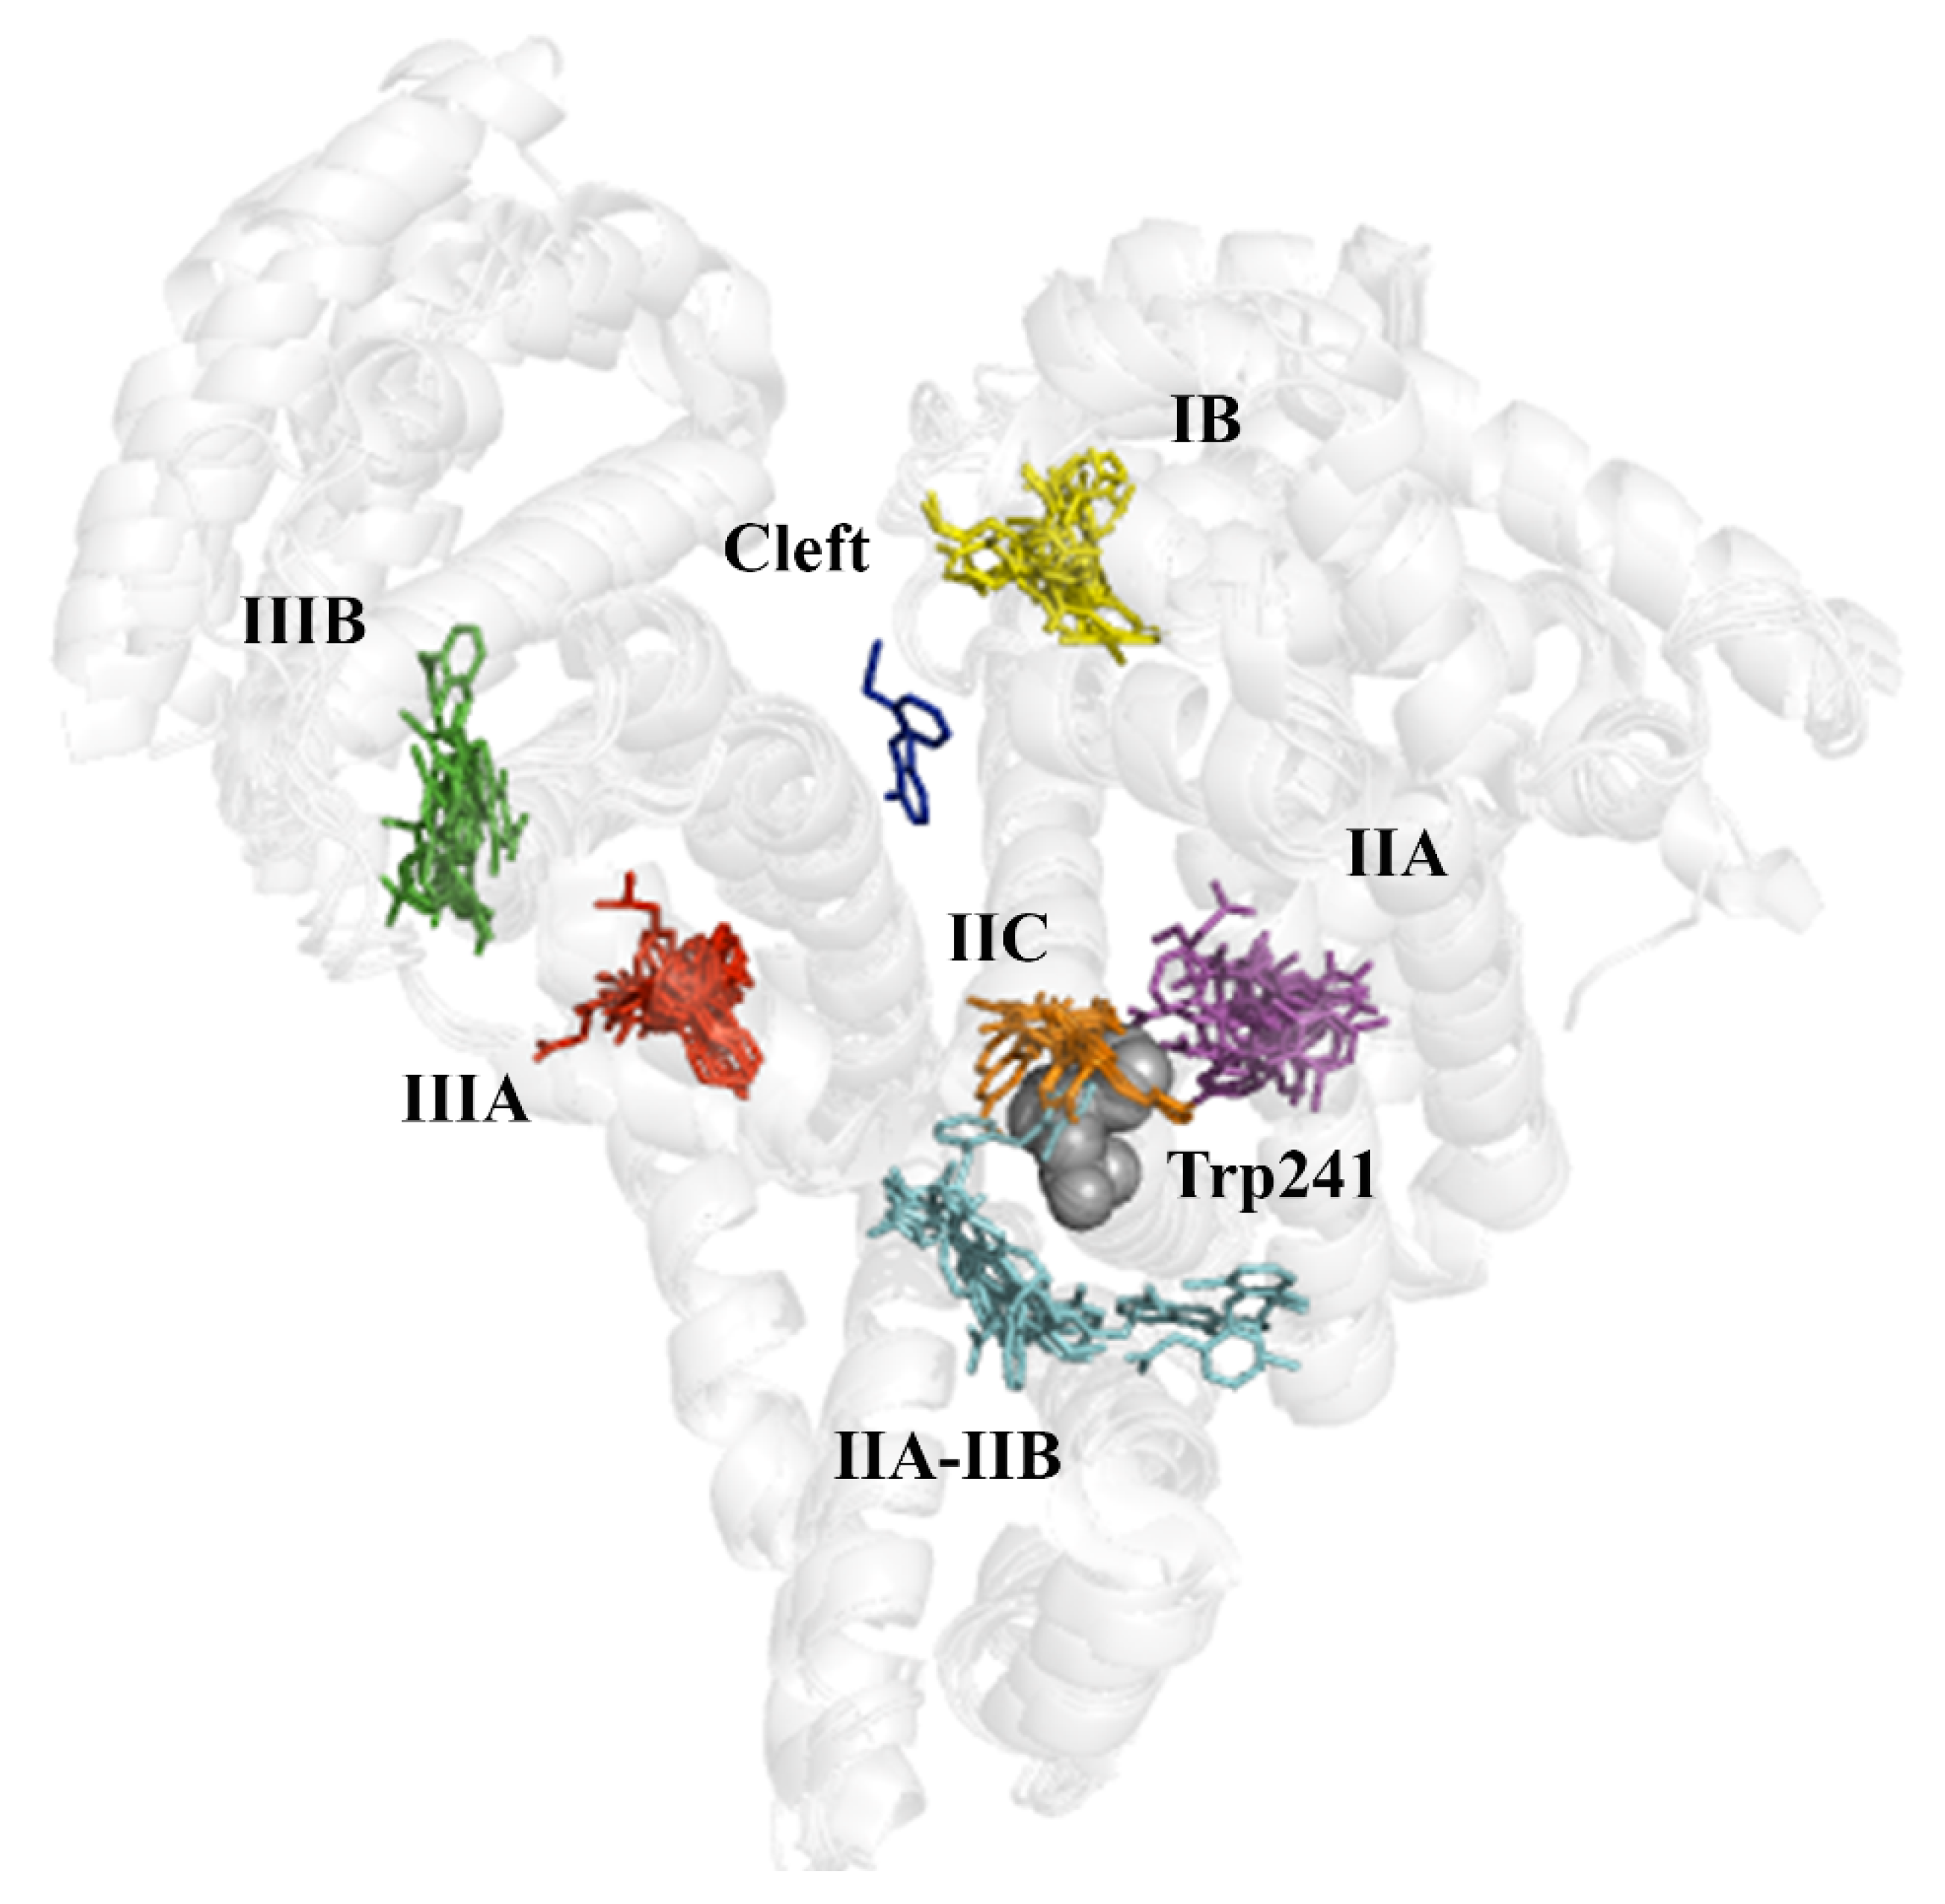
The superposition of all the X-ray crystallographic complexes reveals that the ligands are grouped in seven distinct clusters, which are shown in
Figure 4 following the numbering reported by Ghuman et al. [
5]. One of them is the cleft found between domains I and III, and corresponds to the binding of diclofenac to the ovine serum albumin (PDB entry 6HN0). In contrast, the other binding pockets exhibit a variety of bound ligands, supporting the ability of serum albumin to accommodate structurally related chemical scaffolds of the series of compounds, shown in
Figure 3, including the occupancy of several pockets by the same compound, as has been noticed for other molecules [
21].
Ibuprofen. In HSA (PDB entry 2BXG), (
S)-ibuprofen is bound to two binding sites, denoted as sites IIIA and IIA-IIB (see
Supporting Information Figure S2). In IIIA, the carboxylate group forms electrostatic interactions with Arg410 (distance of 2.8 Å from the guanidinium unit) and Lys414 (distance of 3.0 Å from the amino group), respectively, and forms a direct hydrogen bond (distance of 2.7 Å) with the hydroxyl group of Tyr411. In ESA (PDB entries 6OCI and 6U4X), the arrangement of the (2-methylpropyl)benzene unit is different in 6OCI and 6U4X, due to a conformational change of Tyr410 (equivalent to Tyr411 in HSA), although the interactions formed by the carboxylate moiety, especially regarding the hydrogen bond formed with Tyr410 (2.9 Å), are retained. On the other hand, the binding mode of (
S)-ibuprofen at site IIA-IIB is more variable. Thus, in HSA, the carboxylate group forms a salt bridge with Lys351 and a hydrogen bond with the backbone NH unit of Val482, but in ESA, the ligand adopts a different arrangement, as the carboxylate group is stabilized by a salt bridge with Arg208. The closest distance from the indole ring of Trp214 to the center of the benzene ring in (
S)-ibuprofen is 10.6 and 18.9 Å for IIA-IIB and IIIA, respectively.
Naproxen. Inspection of the X-ray structures of the complexes of (
S)-naproxen bound to ESA (PDB entries 4OT2, 4ZBR, and 5DBY) shows that the ligand binds to pockets in sites IIIA and IIA-IIB (see
Supporting Information Figure S3). In ESA-IIIA, the carboxylate group forms electrostatic interactions with Arg409 and Lys413, with distances of 3.3 and 3.8 Å from the guanidinium and amino groups, respectively, supplemented by a hydrogen bond with the hydroxyl group of Tyr410. This binding mode is also observed in the X-ray structure of the complex of naproxen with BSA (PDB entry 4OR0). Binding of (
S)-naproxen to site IIA-IIB is observed in X-ray structures 4OT2 and 4ZBR, but not in 5DBY, suggesting a weaker binding to this pocket. In site IIA-IIB, the carboxylate group interacts with Lys350 (distance of 3.6 and 4.1 Å in 4OT2 and 4ZBR), and forms hydrogen bonds with the hydroxyl group of Ser479 and the backbone NH units of Leu480 or Ala481. Finally, binding of (
S)-naproxen to sites IIIA and IIA-IIB is impeded by the presence of molecules of decanoic acid that occupy these pockets in HSA (PDB entry 2VDB). Instead, (
S)-naproxen fills the pocket IB, with the carboxylate group close to the guanidinium moiety of Arg186 (at 4.2 Å), although this binding mode may be affected by the presence of a decanoic acid molecule in the same pocket.
Interestingly, the X-ray structure of the BSA complexed with (
S)-naproxen reveals the occurrence of an additional binding site located between subdomains IIA-IIB and IIA (named IIC in
Figure 4), where the naphthalene ring of the ligand is partially stacked against the indole ring of Trp213 (equivalent to Trp214 in HSA), the shortest distance being ~3.6 Å, and the carboxylate group is stabilized by electrostatic interactions with Arg194, Arg198, and Ag217, and hydrogen bonded to the indole NH unit (distance of 2.8 Å).
Diflunisal. This ligand binds three pockets in HSA (PDB entry 2BXE): IIIA, IIA-IIB, and IIA (see
Supporting Information Figure S4). In site IIIA, the carboxylate group is stabilized by salt bridges with Arg410 and Lys414 (distances of 3.0 and 3.3 Å), and the hydroxyl group of the ligand forming a hydrogen bond (2.5 Å) with the hydroxyl group of Tyr411. In site IIA-IIB, binding is assisted by a double hydrogen bond of the carboxylate group with the backbone NH units of Leu481 and Val482, which supplements the electrostatic interaction with Lys351 (distance of 3.6 Å). Finally, in site IIA, the carboxylate group is hydrogen bonded to Arg257 (2.7 Å), His242 (3.7 Å), and Tyr150 (2.2 Å; note that this short distance may be affected by the lower accuracy of the electron density around the carboxylate moiety of the ligand). Here the shortest distance from the center of the difluorobenzene ring of diflunisal to the indole ring of Trp214 is 6.8 Å.
2.4. Evaluation of the Ligand Binding Events for NSAID-HSA Complexes
Ibuprofen. Since ibuprofen does not significantly modify the albumin fluorescence, the structural data suggest that binding to HSA takes place far from the main fluorophore (Trp214, shown as gray spheres in
Figure 4) present in HSA. Thus, the closest distance of (
S)-ibuprofen from the indole ring of Trp214 is 10.6 Å upon binding to site IIA-IIB, which increases to almost 19 Å when bound to site IIIA. According to these distances, one may expect a low efficiency in the quenching of Trp214 fluorescence, especially for the binding to site IIIA, since the efficiency of fluorescence emission quenching generally requires distances between Trp and quencher lower than 10 Å [
22]. Moreover, the interaction at site IIA-IIB can be expected to be weak, since different binding modes are observed in PDB entries 2BXG (HSA) and 6OCI (ESA), which cannot be attributed to species-related differences, since the residues that define the walls of site IIA-IIB in HSA and ESA are identical. Rather, they likely arise from the small size of this drug and the presence of several anchoring points in this pocket. On the other hand, although a Tyr residue is present in site IIIA, the quenching effect would not be enough to get quantitative binding data by fluorescence. If fluorescence quenching occurs in these two sites, it is hardly detectable, due to the distance to the fluorophore and the weak binding to a specific point in the protein. These putative weak interactions would be consistent with the ibuprofen-HSA binding values obtained using CE/FA [
13]. In this case, a weak
Kb value with a stoichiometry of
n = 5 was found, which would prove the ability of ibuprofen to bind to several sites with roughly equivalent affinity. In addition, it would justify why very weak interactions near a fluorophore are only intuited by fluorescence quenching in the present study.
Naproxen. The single interaction observed by fluorescence quenching, which is characterized by a log
Kb value of 4.80 (
Table 3), can be ascribed to the interaction event that occurs in site IIA-IIB. According to the X-ray data in PDB entries 4OT2, 4ZBR, and 4OR0, the closest distance between the aromatic ring of (
S)-naproxen and the main fluorophore (Trp213 in ESA and BSA, equivalent to Trp214 in HSA) ranges from 8.4 to 9.6 Å. Therefore, the stronger binding observed by ITC (log
Kb of 5.95;
Table 4) can be ascribed to site IIIA, where the distance between the aromatic rings of (
S)-naproxen and Trp213 is close to 17 Å. On the other hand, although the literature suggests that naproxen could diffuse into site IIA [
16], we have not observed this interaction upon inspection of the available crystallographic data. The additional interactions detected by ITC (
n = 2.5) and CE/FA (
n = 3.5) [
13] may reflect similar weak interactions at other sites that are quantified at once using calorimetry or electrophoretic measurements. As indicated in the literature, naproxen would have only one high-affinity binding site (IIIA) and several low-affinity binding sites [
23]. In the case of the secondary binding events, binding of the ligand might involve different conformations depending on the experimental conditions [
23].
As a final remark, it is worth noting that the binding to site IIC observed in the complex with BSA (PDB entry 4OR0) might justify the quenching of the Trp214 phosphorescence described in previous studies [
23]. In particular, the quenching of Trp214 phosphorescence has been interpreted resorting to a Dexter energy transfer mechanism, which requires orbital overlap of fluorophore and quencher, and hence, a short distance between (
S)-naproxen and Trp214, which would agree with the close contact observed between the aromatic rings of (
S)-naproxen and Trp214 in the X-ray data.
Diflunisal. The fluorescence quenching technique identifies two interactions with HSA characterized by log Kb values of 5.86 and 4.70, which could be attributed to the binding to sites close to Trp214. As noted above, one of them would be site IIA, as suggested by the X-ray structure 2BXE, which reveals a short ring-to-ring distance from the ligand to Trp214 (around 6.8 Å). We propose that the other binding site could be IIA-IIB, as the shortest distance from the indole ring of Trp214 to the aromatic ring of diflunisal is 8.7 Å.
Although there is no crystallographic evidence showing the binding of diflunisal to site IIC, docking calculations support the binding to this pocket with a docking score of –9.3 kcal/mol (
Figure 5). The predicted arrangement of diflunisal superposes well the structure of (
S)-naproxen bound to site IIC in BSA, as noted in the overlay of the aromatic rings present in diflunisal and (
S)-naproxen, revealing that the difluorobenzene moiety of diflunisal stacks against the indole ring (average distance of 3.7 Å). Furthermore, the similar arrangement of the carboxylate moiety in these compounds could be stabilized by electrostatic interactions with Lys195 and Lys199. Albeit caution is needed for quantitative comparison, due to the known deficiencies of the docking scoring functions, let us note that this pose has a better score than the crystallographic poses at sites IIA (–6.9 kcal/mol) and IIA-IIB (–5.1 kcal/mol), whereas it compares with the score of the pose at site IIIA (–9.0 kcal/mol). This may suggest that binding to site IIC may be kinetically slow, requiring dynamical rearrangements of certain structural elements of the protein. Accordingly, studies focused on the quenching of the Trp214 phosphorescence would be valuable to elucidate the potential binding of diflunisal to site IIC.
Finally, let us remark that other authors already noticed the multiplicity of binding events of diflunisal to HSA by using potentiometric measurements with
Kb values similar to the ones found by our group of research [
19]. Indeed, they reported an occupancy of
n = 4.28 for the strongest binding event that may correspond to the union of diflunisal to different sites with similar affinity.
2.5. Prospective Study of the Flurbiprofen-HSA Complex
On the basis of the preceding analysis, we have revisited the fluorescence results observed for the flurbiprofen-HSA complex, which revealed the occurrence of two binding events with similar binding affinities (both in the order of log
Kb ~ 5; see
Table 4). In particular, the
Kb values obtained by FS are in agreement with the
Kb2 attained by ITC (
Table 4), and the stronger binding affinity obtained by ITC (log
Kb1 of 6.70) should involve a site distant from fluorophores in HSA, particularly Trp241.
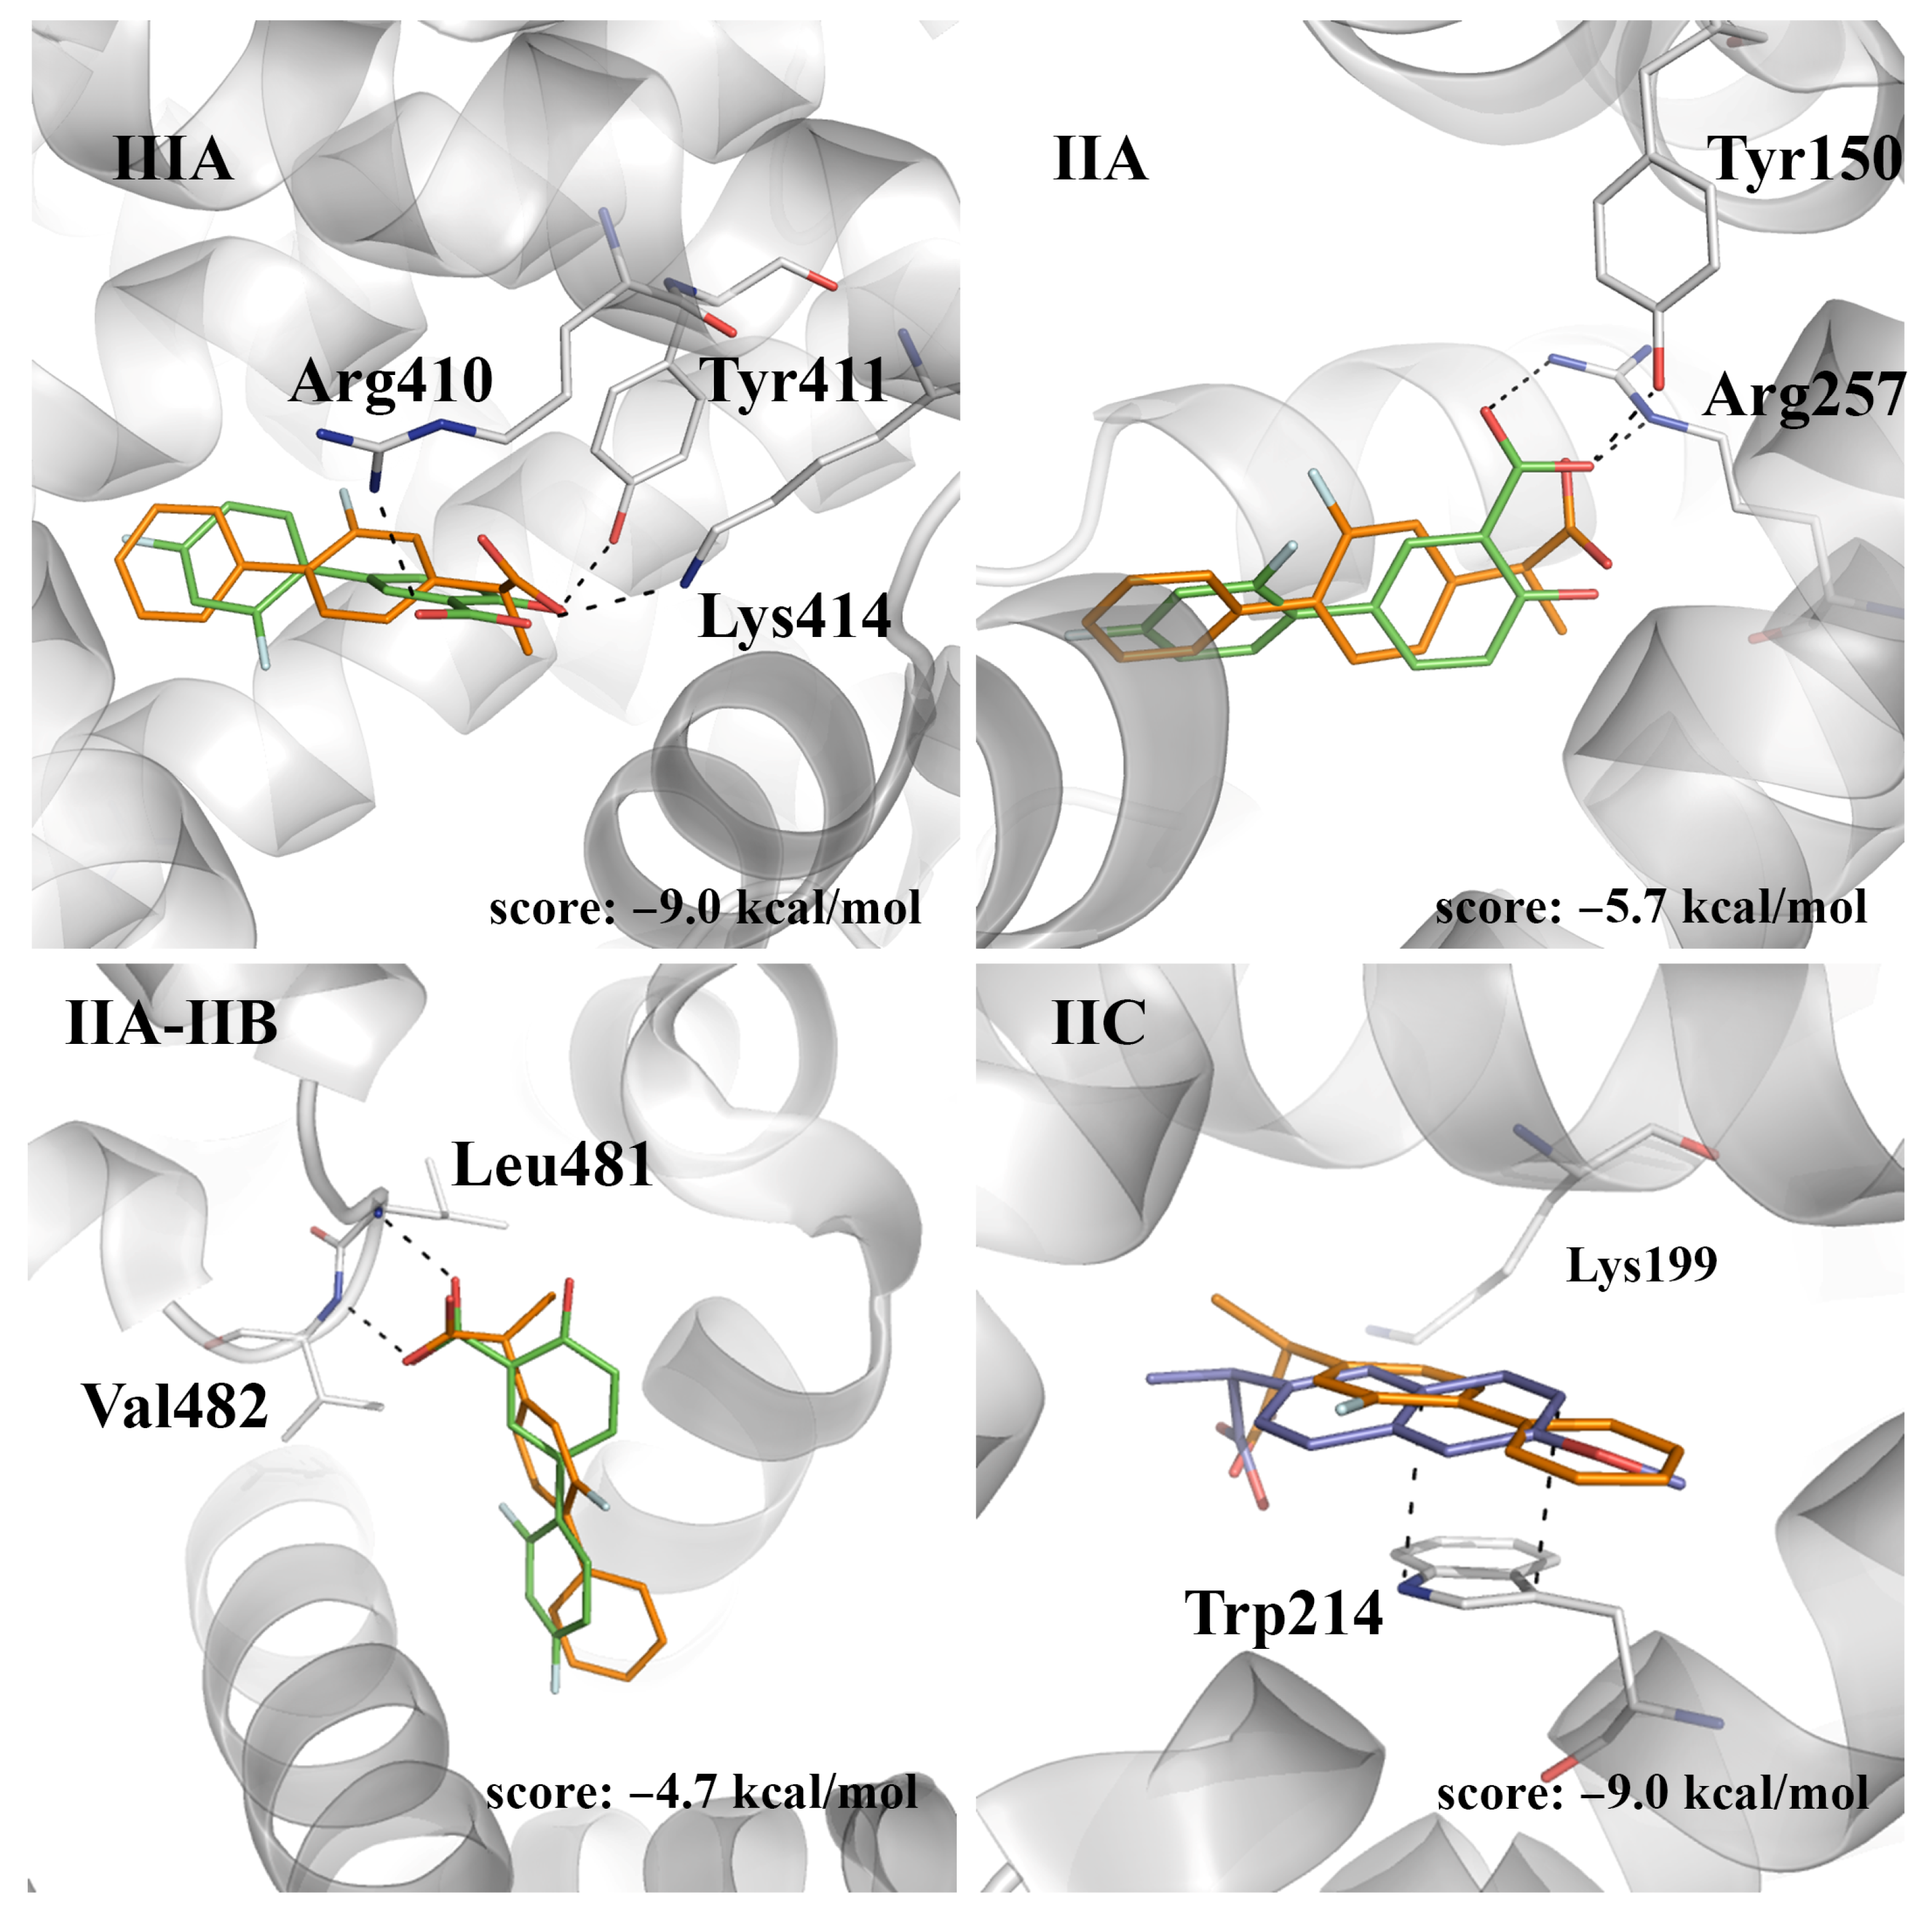
Docking computations reveal that (
S)-flurbiprofen binds to site IIIA matching the arrangement observed for (
S)-naproxen and (
S)-ibuprofen in this cavity, enabling the formation of a hydrogen bond between the carboxylate group of (
S)-flurbiprofen and the hydroxyl group of Tyr411 (
Figure 6; score of −9.0 kcal/mol). According to the results previously discussed for the other compounds, we assume that this interaction should have little quenching effect on the fluorescence of HSA, due to the large distance from Trp214. On the other hand, docking in IIA and IIC leads to poses with scores of −5.7 and −9.0 kcal/mol, respectively. It is worth noting that (
S)-flurbiprofen exhibits a large overlap with the X-ray crystallographic pose of (
S)-naproxen at site IIC, and diflunisal at site IIA (
Figure 6). Finally, docking of (
S)-flurbiprofen in site IIA-IIB leads to a binding mode that superposes well with diflunisal (score of −4.7 kcal/mol;
Figure 6).
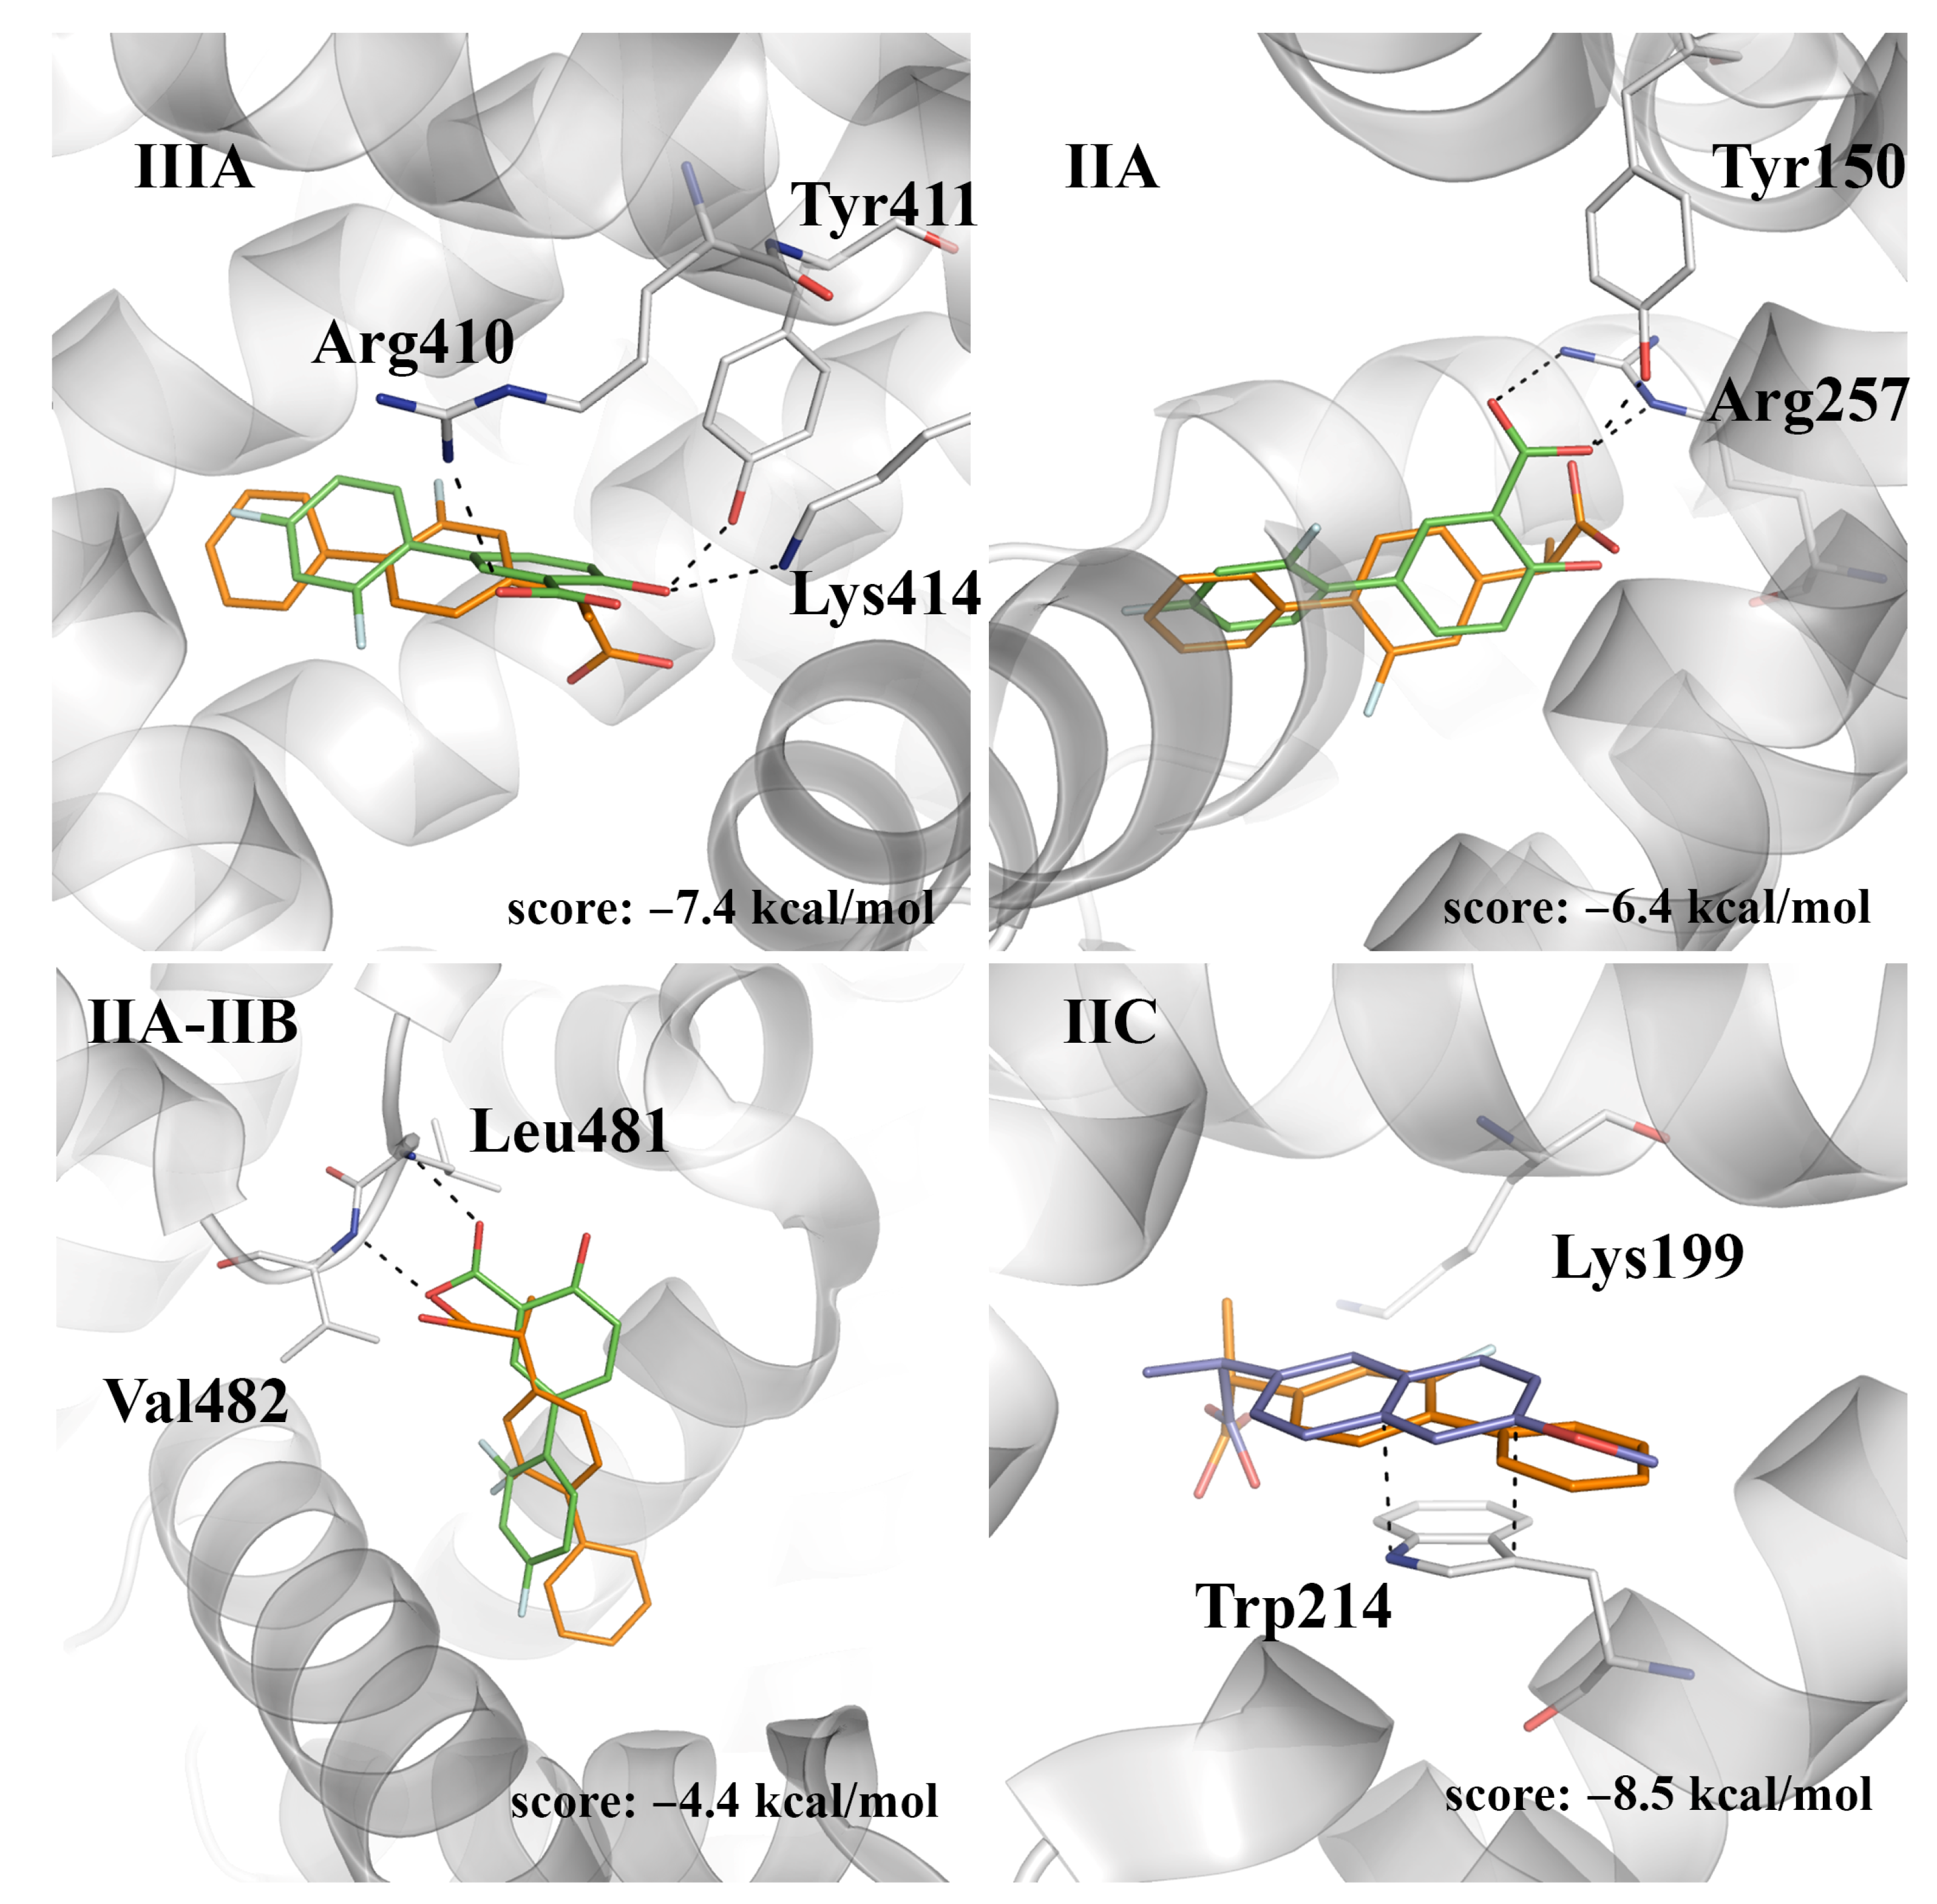
With regard to (
R)-flurbiprofen, site IIC appears to be the best binding site, leading to a close overlap of both the carboxylate moieties and aromatic rings of both (
R)-flurbiprofen and (
S)-naproxen (
Figure 7). The score of this pose (−8.5 kcal/mol) compares with the value obtained for (
S)-flurbiprofen in this pocket (−9.0 kcal/mol), whereas binding to site IIIA leads to a reduced score (−7.4 kcal/mol), which can be understood from the weakening of electrostatic interactions between the carboxylate unit and both Lys414 and Arg410. Lower scores are obtained for the binding to sites IIA and IIA-IIB.
Taking into account the analysis reported above for ibuprofen, naproxen, and diflunisal, present results suggest that the strongest binding site observed from ITC measurements (log
Kb ~ 6.7) may primarily correspond to the binding of flurbiprofen to site IIIA, where the shortest distance from the ligand to Trp214 is 19 Å, which would lead to a weak quenching efficiency. The two binding signals determined with fluorescence assays for the racemic sample of flurbiprofen (log
Kb ~ 5.5) may arise from the interaction of the two enantiomers at sites IIA or IIA-IIB, as the shortest distance from Trp214 range from 6 to 9 Å. Previous studies had already indicated that there exist spectral differences upon the interaction of (
S)- and (
R)-flurbiprofen, with HSA, which can be interpreted from distinctive signatures in the binding of the two enantiomers [
16,
24,
25]. At this point, it is worth noting that a recent theoretical study provided evidence that supports the ability of the two enantiomeric species to adopt similar binding modes at site IIA-IIB, and that this interaction justifies the quenching of Trp214 fluorescence, whereas the enantioselective quenching efficiency would arise from the increased flexibility of (
S)-flurbiprofen in the binding pocket [
26].
As noted above, docking calculations suggest a favorable binding to site IIC. Occupancy of this pocket, however, is scarcely observed in the X-ray crystallographic data. This may obey to factors, such as the occurrence of dicarboxylic acids, which may block access to this site, as found in the X-ray structure 4OT2, which corresponds to the complex of ESA with (
S)-naproxen bound to sites IIIA and IIA-IIB (
Supporting Information Figure S5). Similar cosolutes are also found at the entrance of site IIC in other structures, such as 4ZBQ, 4ZBR, 5DBY, and 6OCI (data not shown). Furthermore, the presence of other molecules bound to albumin may trigger structural changes that alter the shape of pocket IIC, as found in PDB entries 2VDB, 4Z69, and 2BXL, due to the binding of several molecules of palmitic and pentadecanoic acids to HSA (
Supporting Information Figure S6).
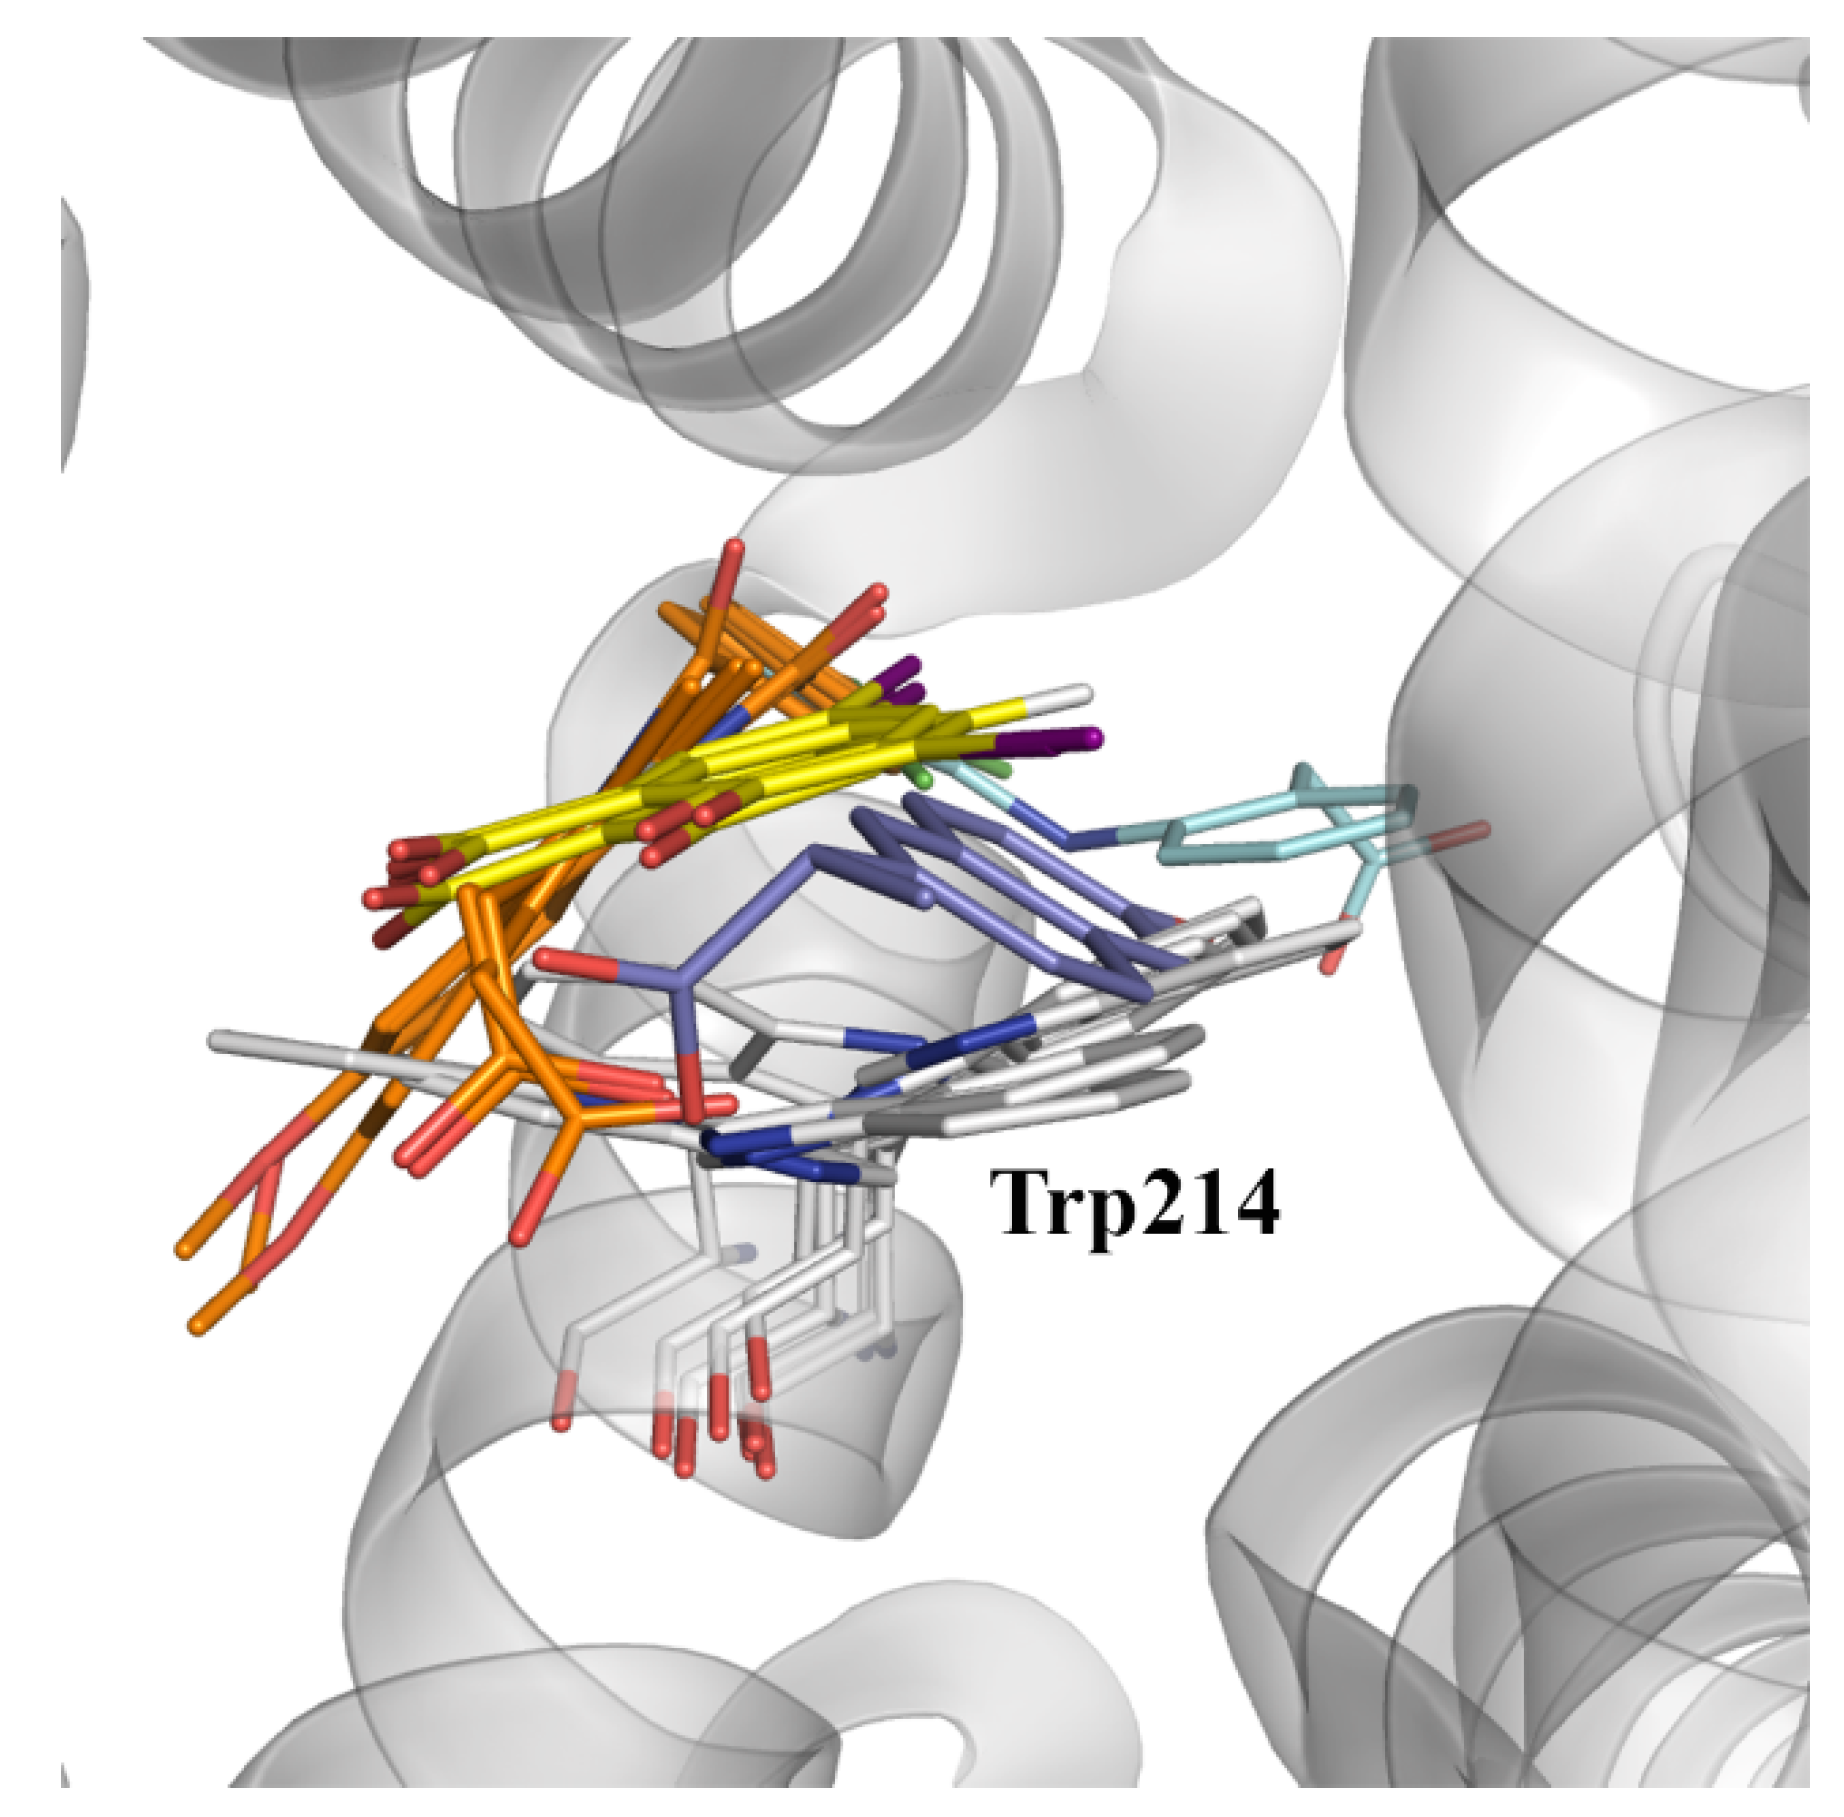
In spite of these considerations, a detailed inspection of the available X-ray structures reveals the ability of pocket IIC to accommodate a variety of ligands (
Figure 8), such as indomethacin (PDB entries 2BXK, 2BXM, and 2BXQ), 3,5-diiodosalycilic acid (PDB entries 4JK4, 4LUH, and 5OSW), diclofenac (PDB entry 4Z69), in addition to the complex with (
S)-naproxen (PDB entry 4OR0).
Let us note that the diversity of binding modes found for these compounds may be related to the plasticity of this pocket, as noted in the different orientations adopted for the side chain of Trp214, which can adopt two distinct conformations related by a rotation of 180 degrees around the Cβ-Cγ bond (
Figure 8). Therefore, it may be speculated that binding to site IIC may require a dynamical adjustment of the protein, leading to a kinetically slower binding that presumably may involve a preliminary binding to site IIA and the subsequent migration to site IIC, or alternatively the selective binding to distinct conformational states of the protein [
27,
28,
29].
Whereas, the larger solvent exposure of sites IIIA and IIA-IIB would facilitate a faster recognition and binding of NSAID-related compounds, enabling the effective quenching of Trp214 fluorescence upon binding to site IIA-IIB, binding to site IIC would provide an explanation to the effective quenching of Trp214 phosphorescence observed for (
S)-naproxen and flurbiprofen, according to the requirement of orbital overlap between donor and acceptor in the Dexter mechanism of electron transfer [
16,
24,
25].


 ,
, 


