
Pharmacokinetic Investigation of Commercially Available Edible Marijuana Products in Humans: Potential Influence of Body Composition and Influence on Glucose Control

 ,
, 
Abstract
:1. Introduction
2. Results
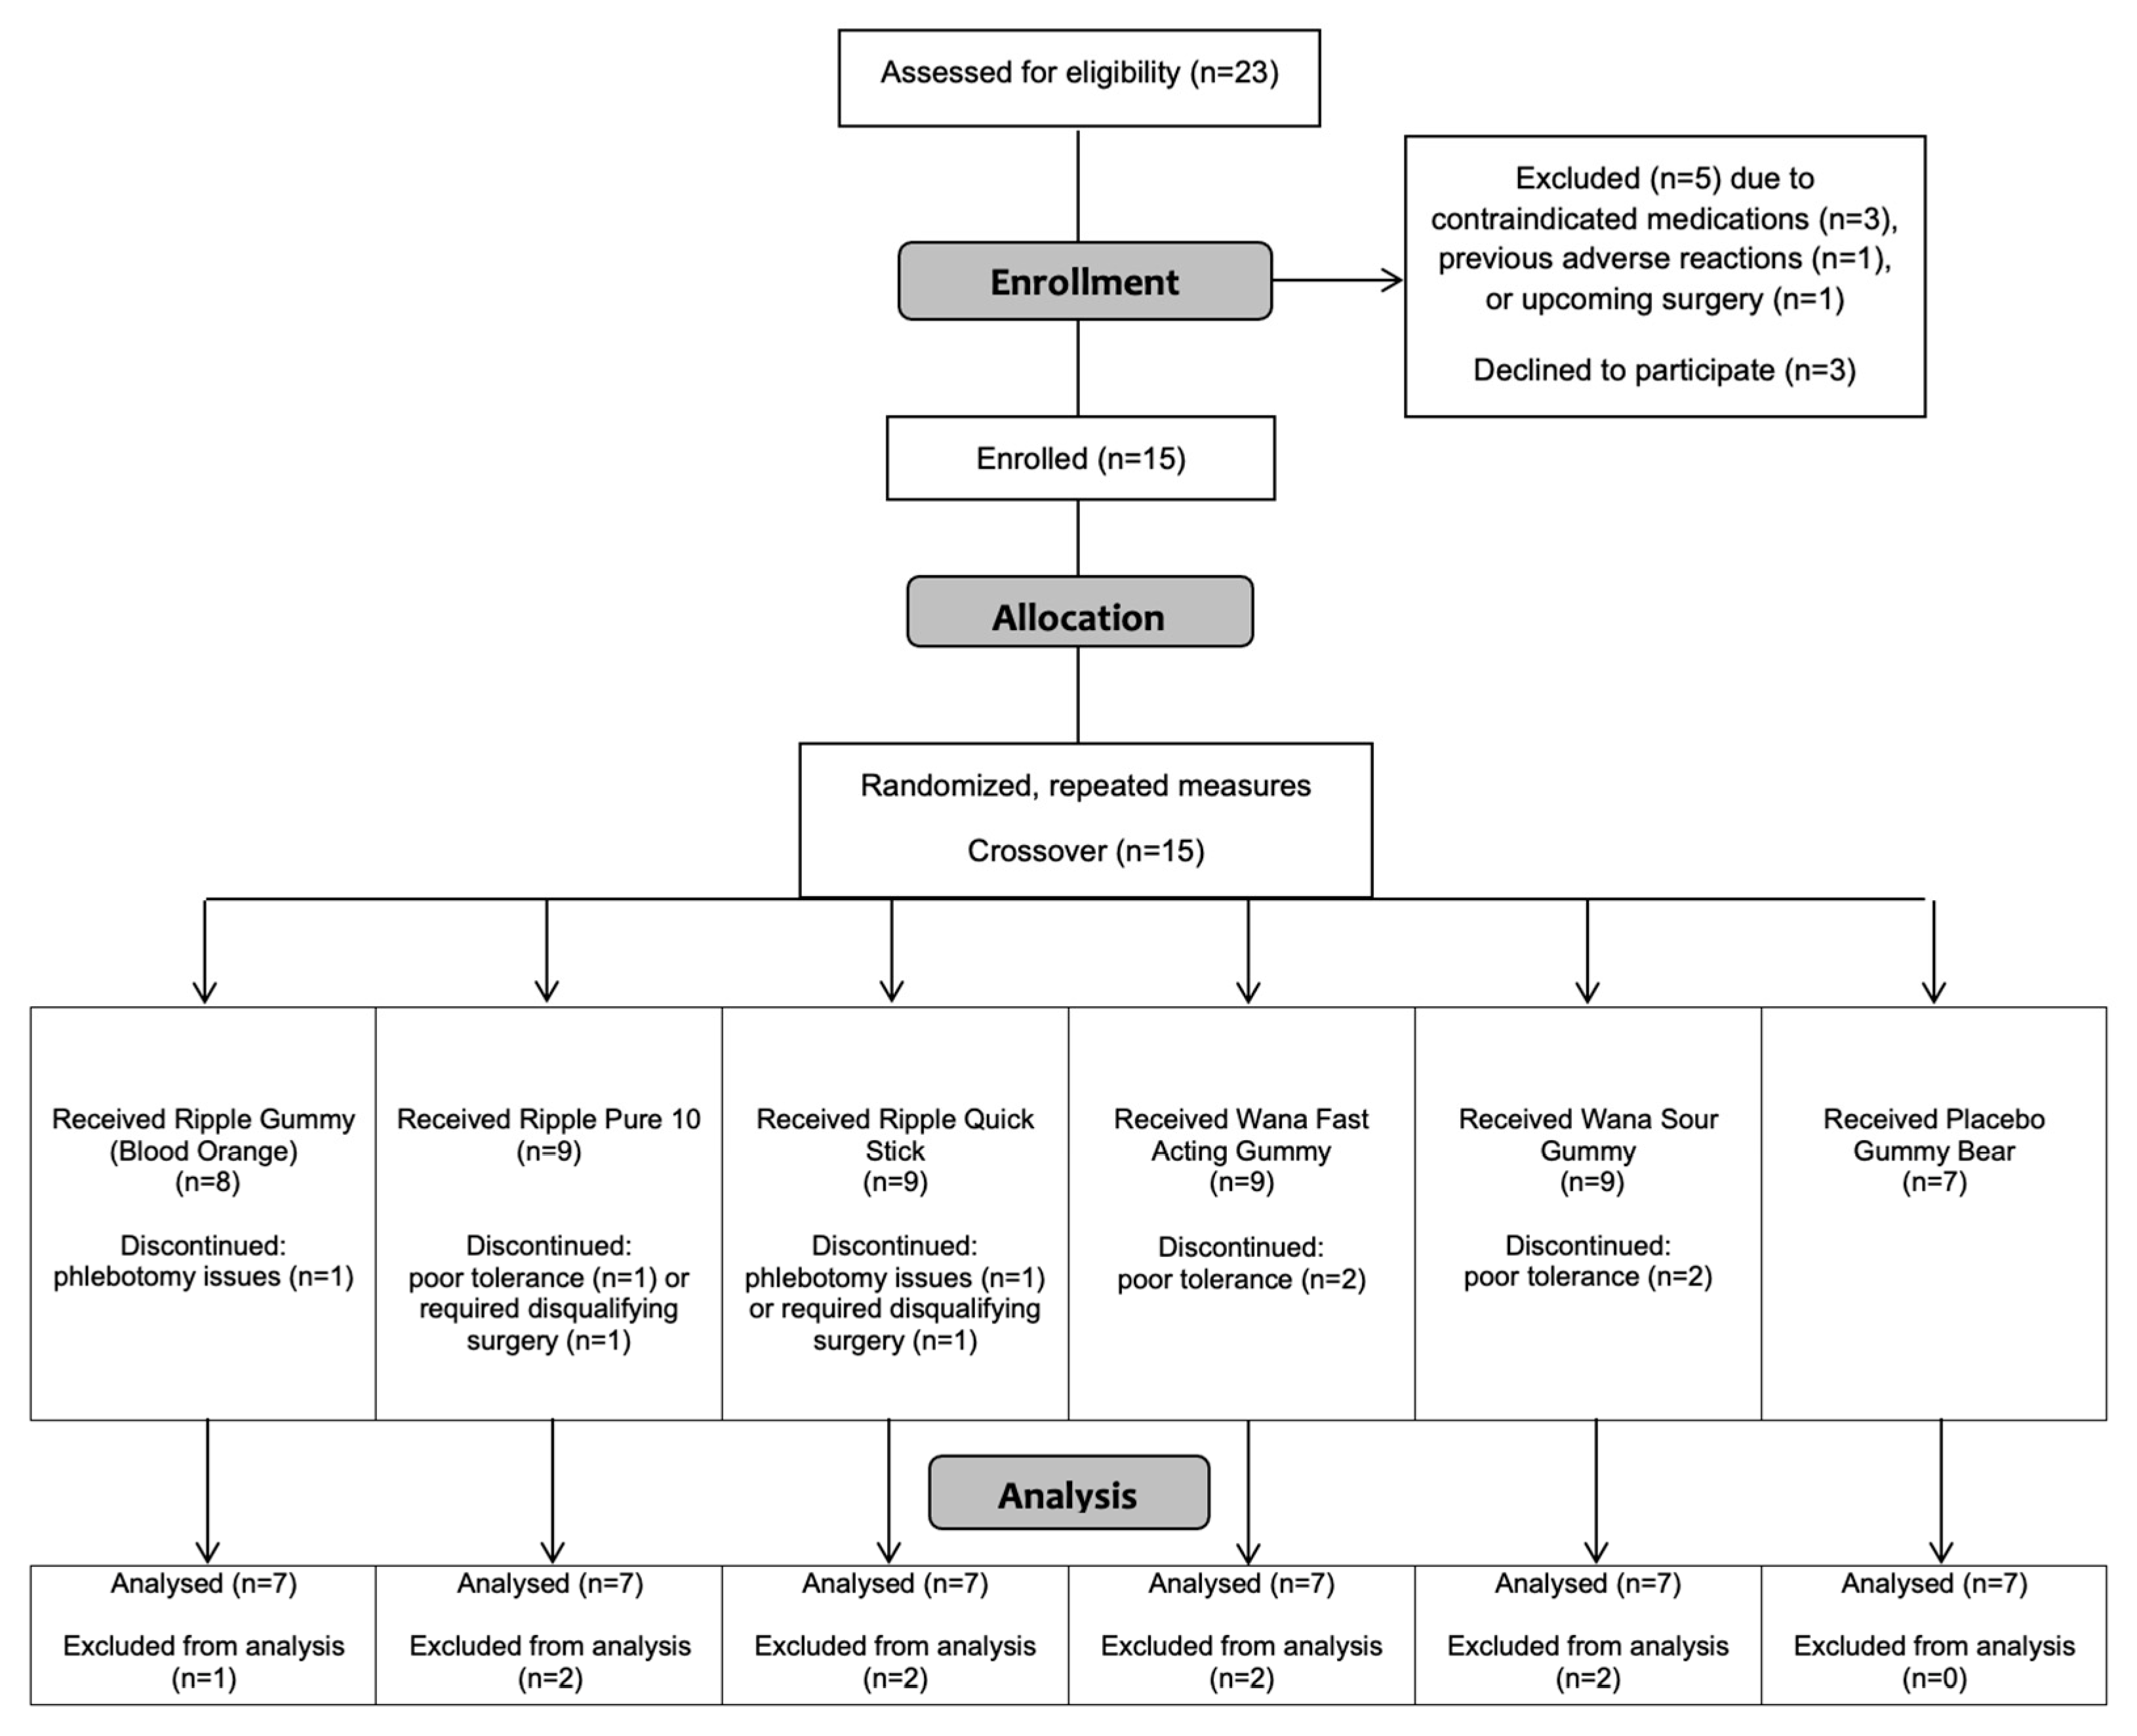
2.1. Participants
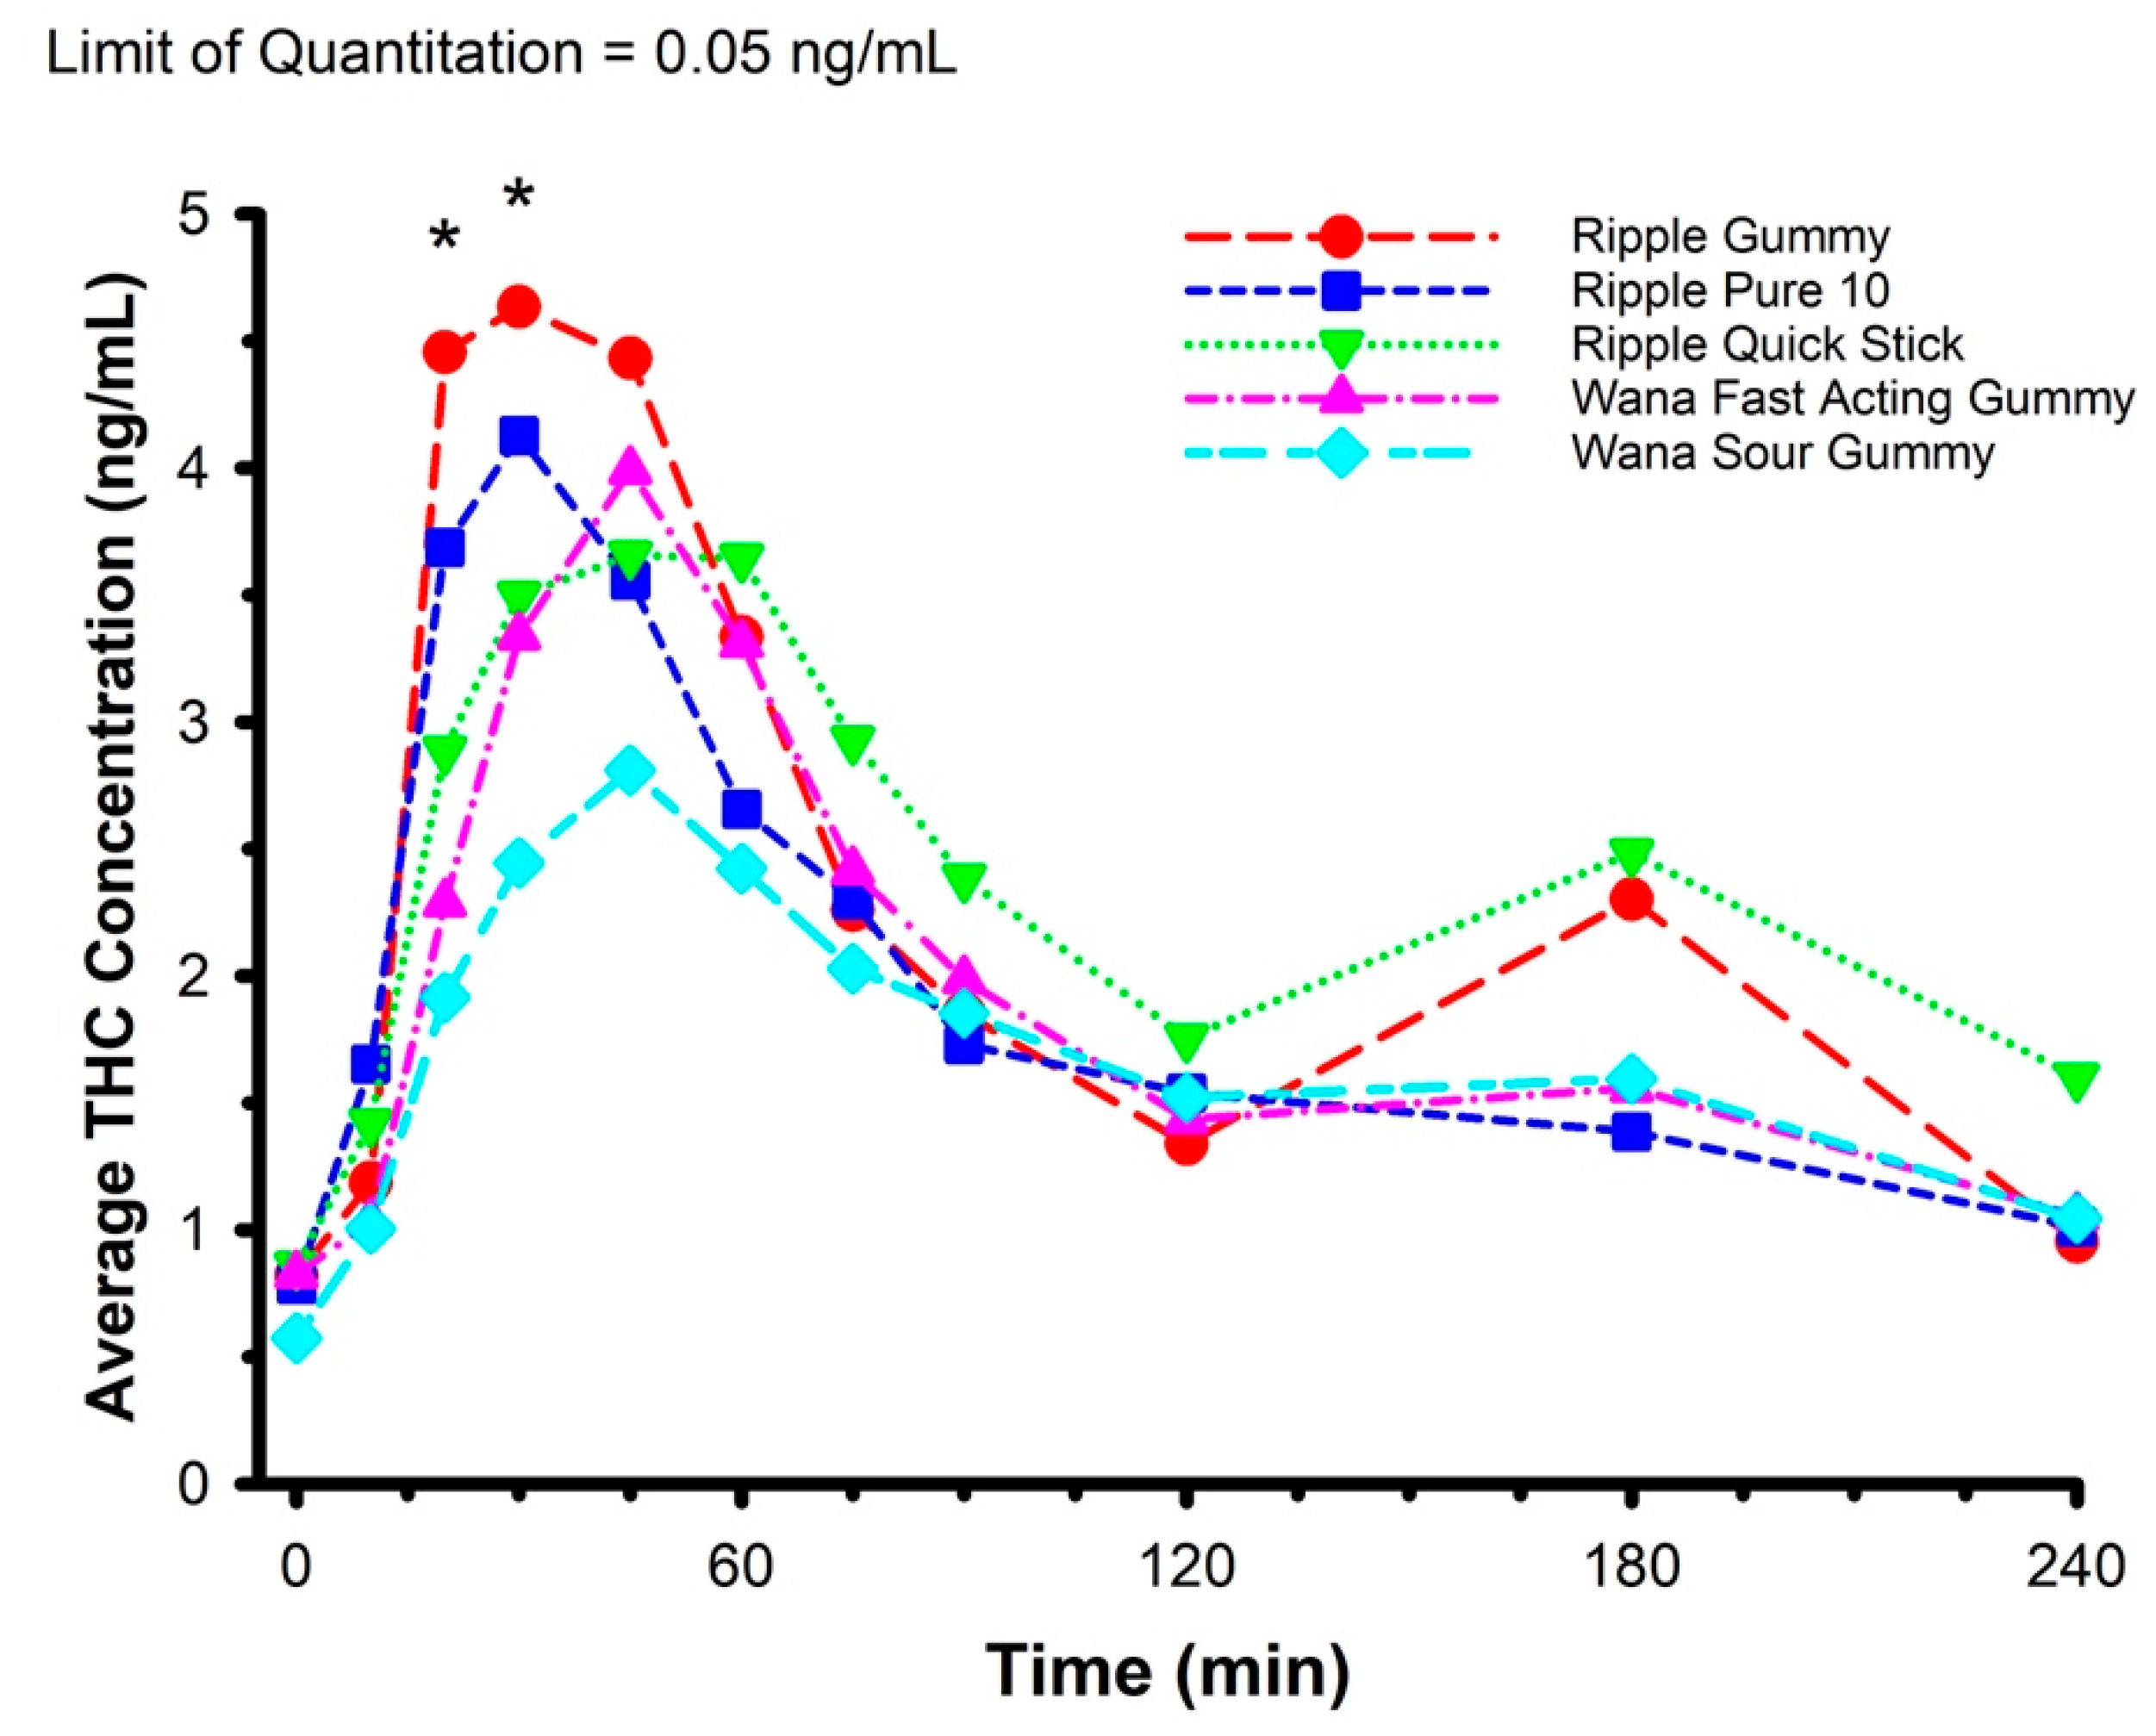
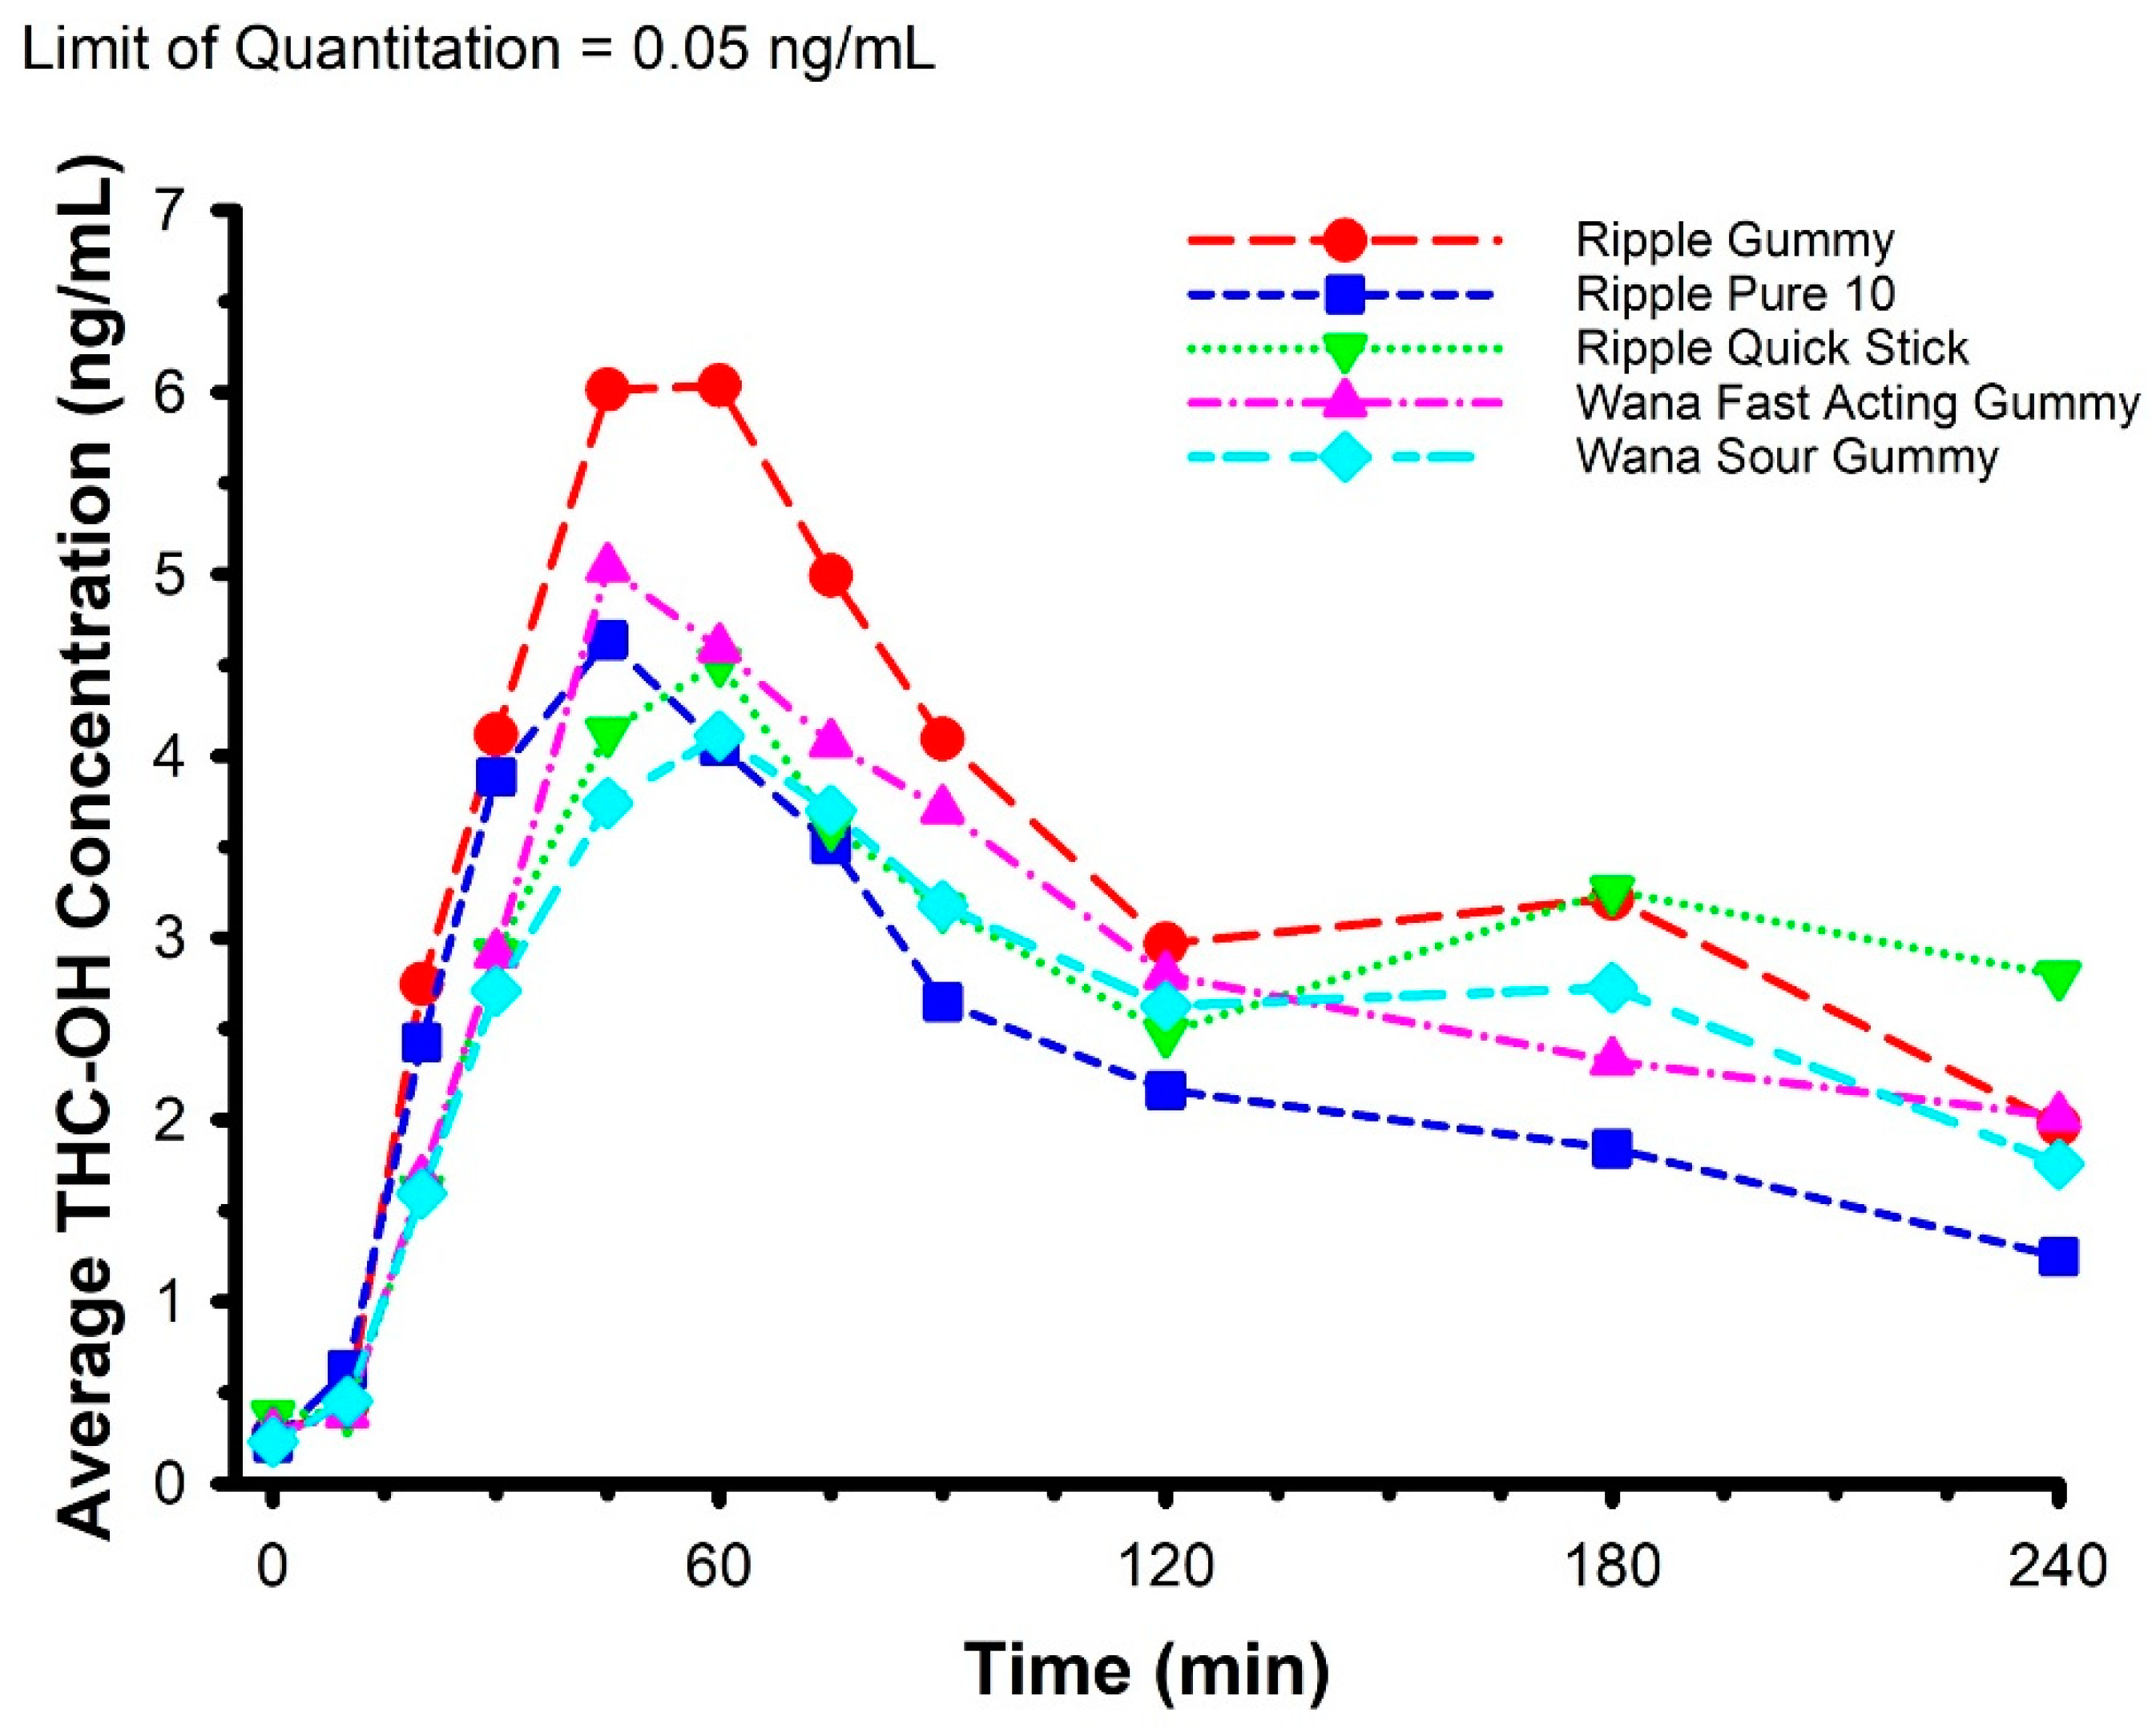
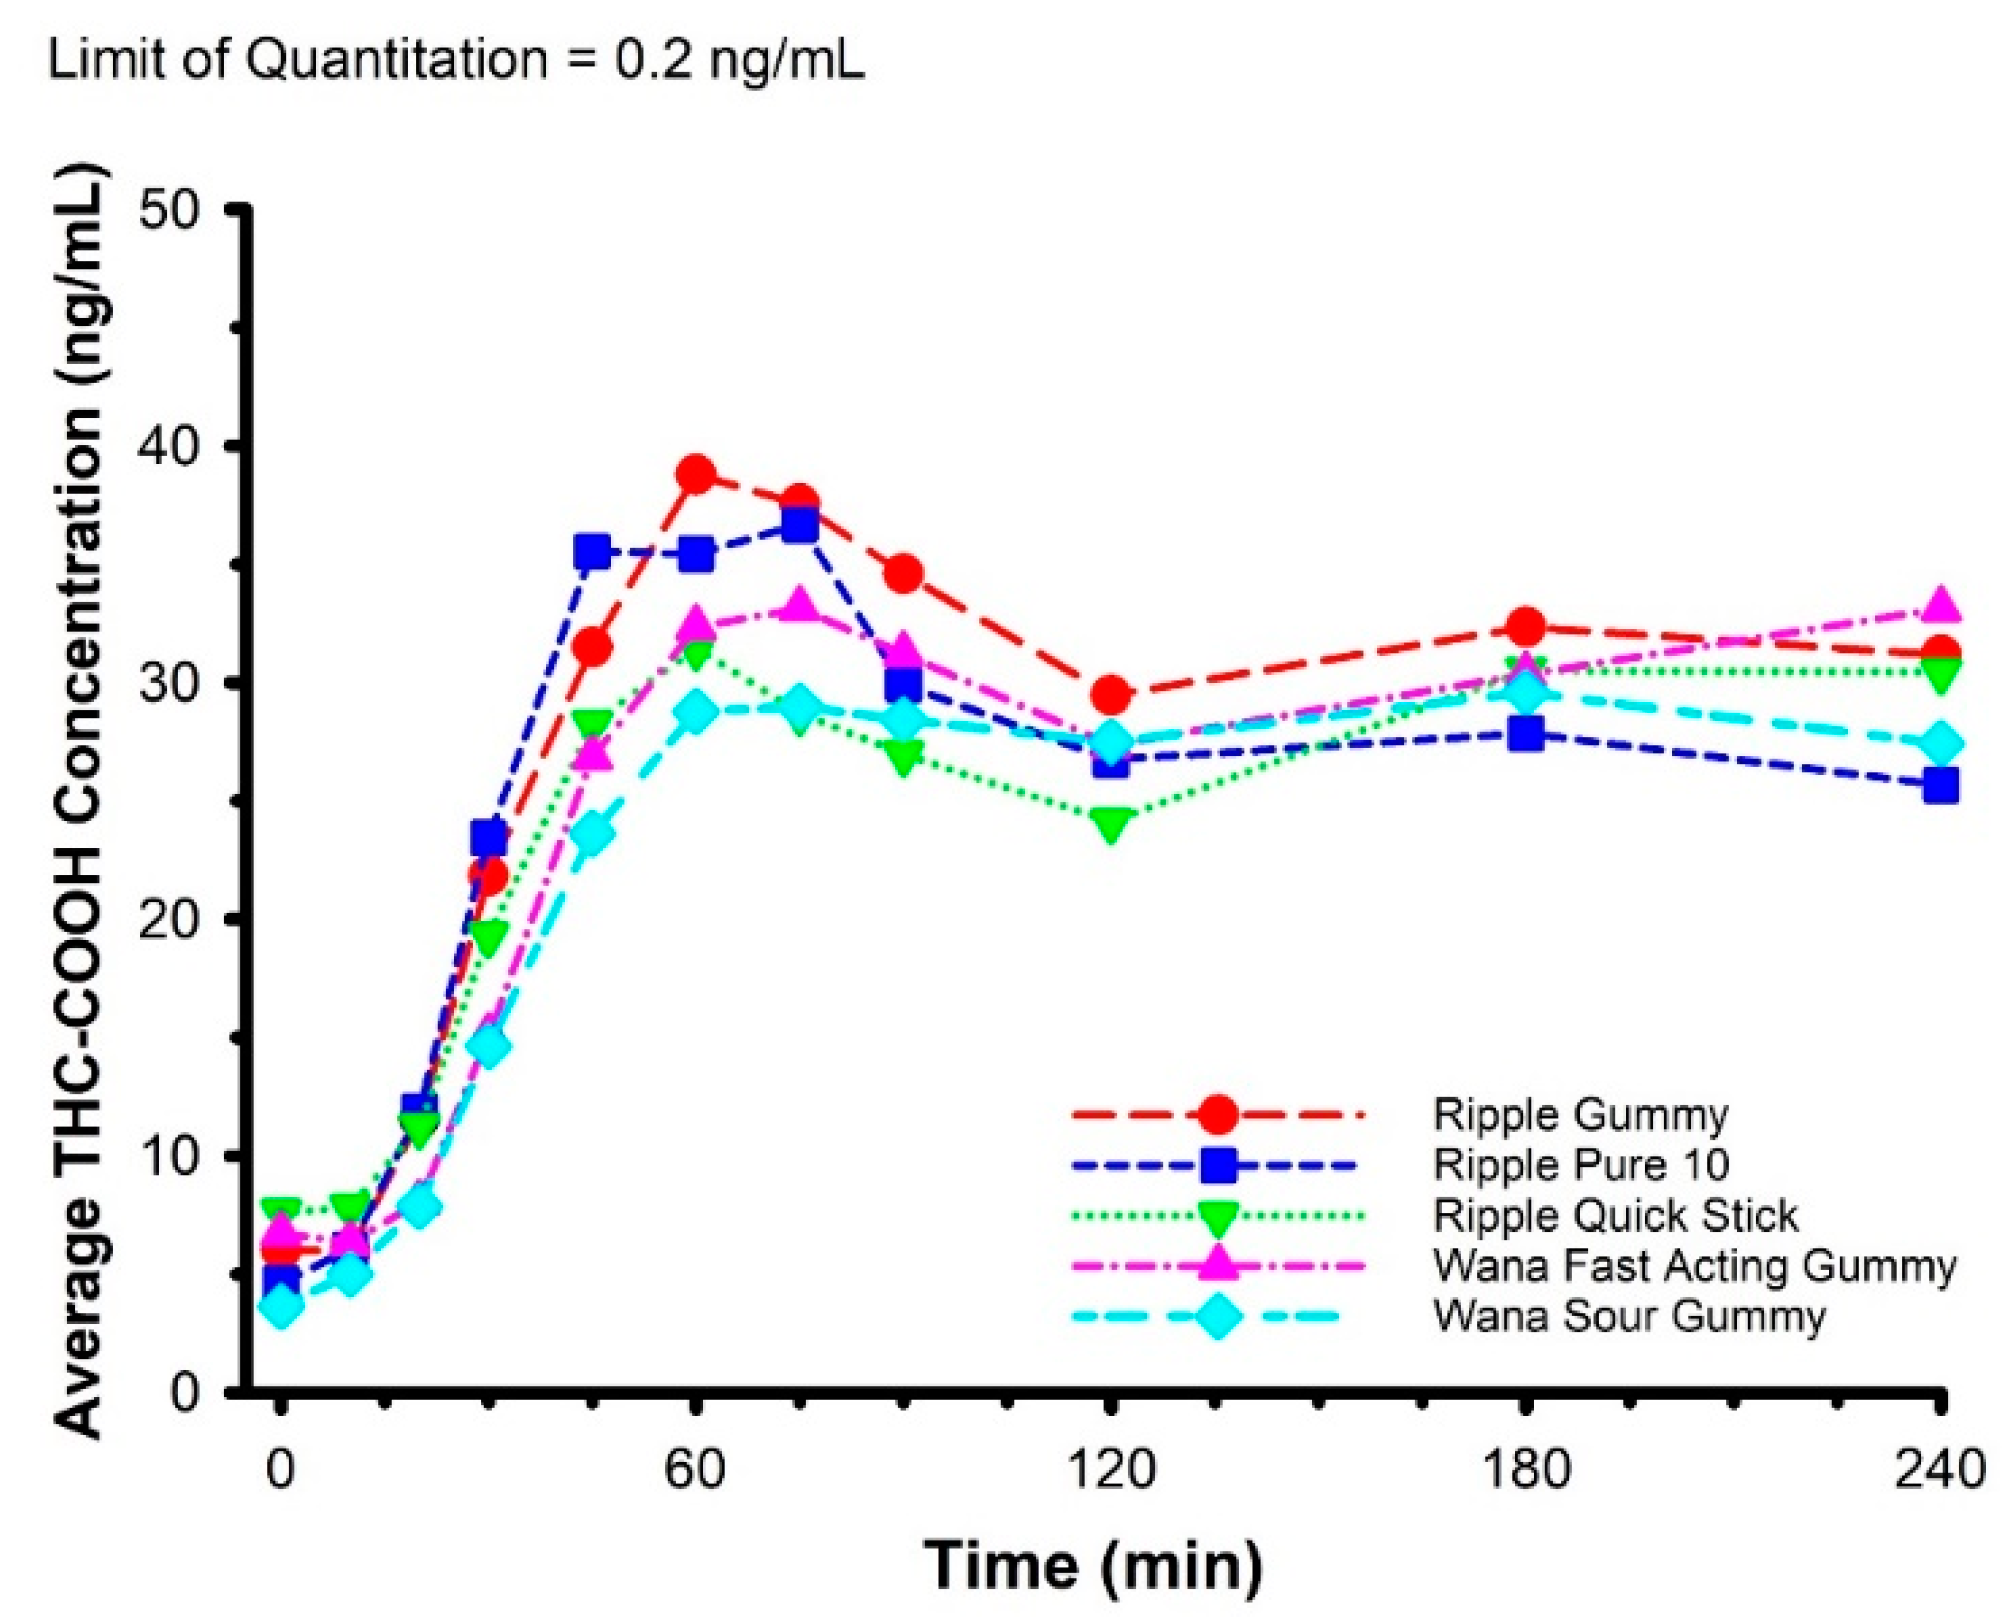
2.2. Pharmacokinetics
2.3. Body Composition
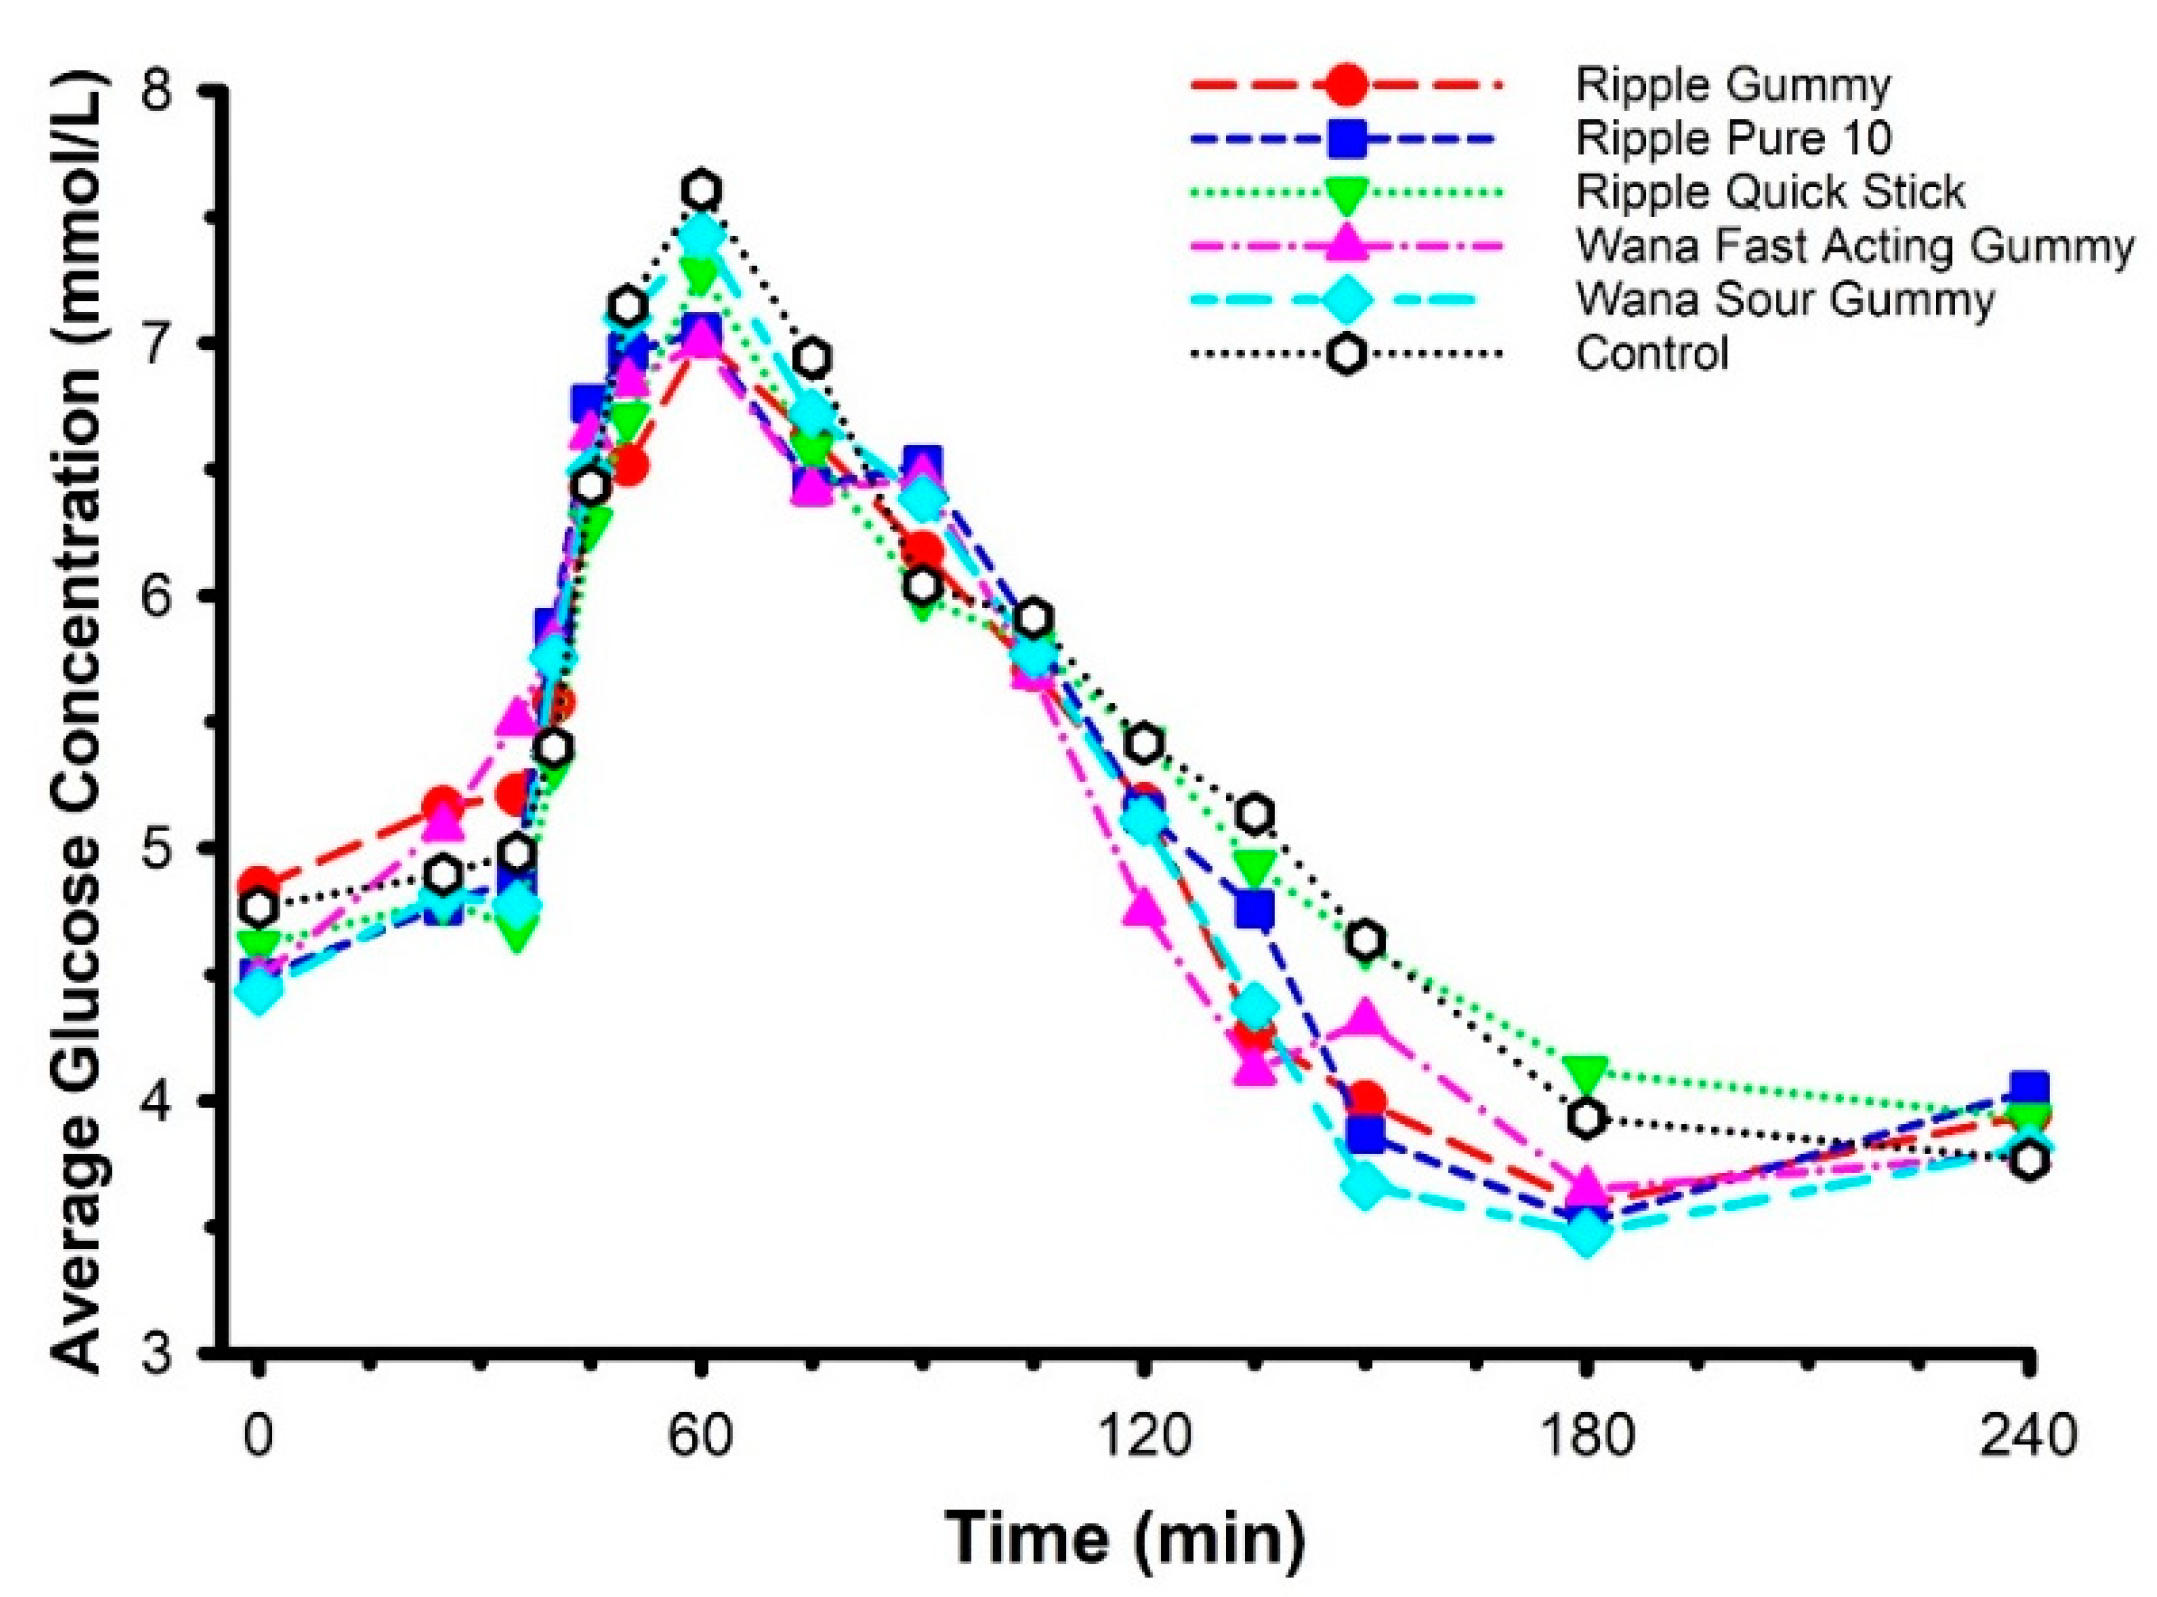
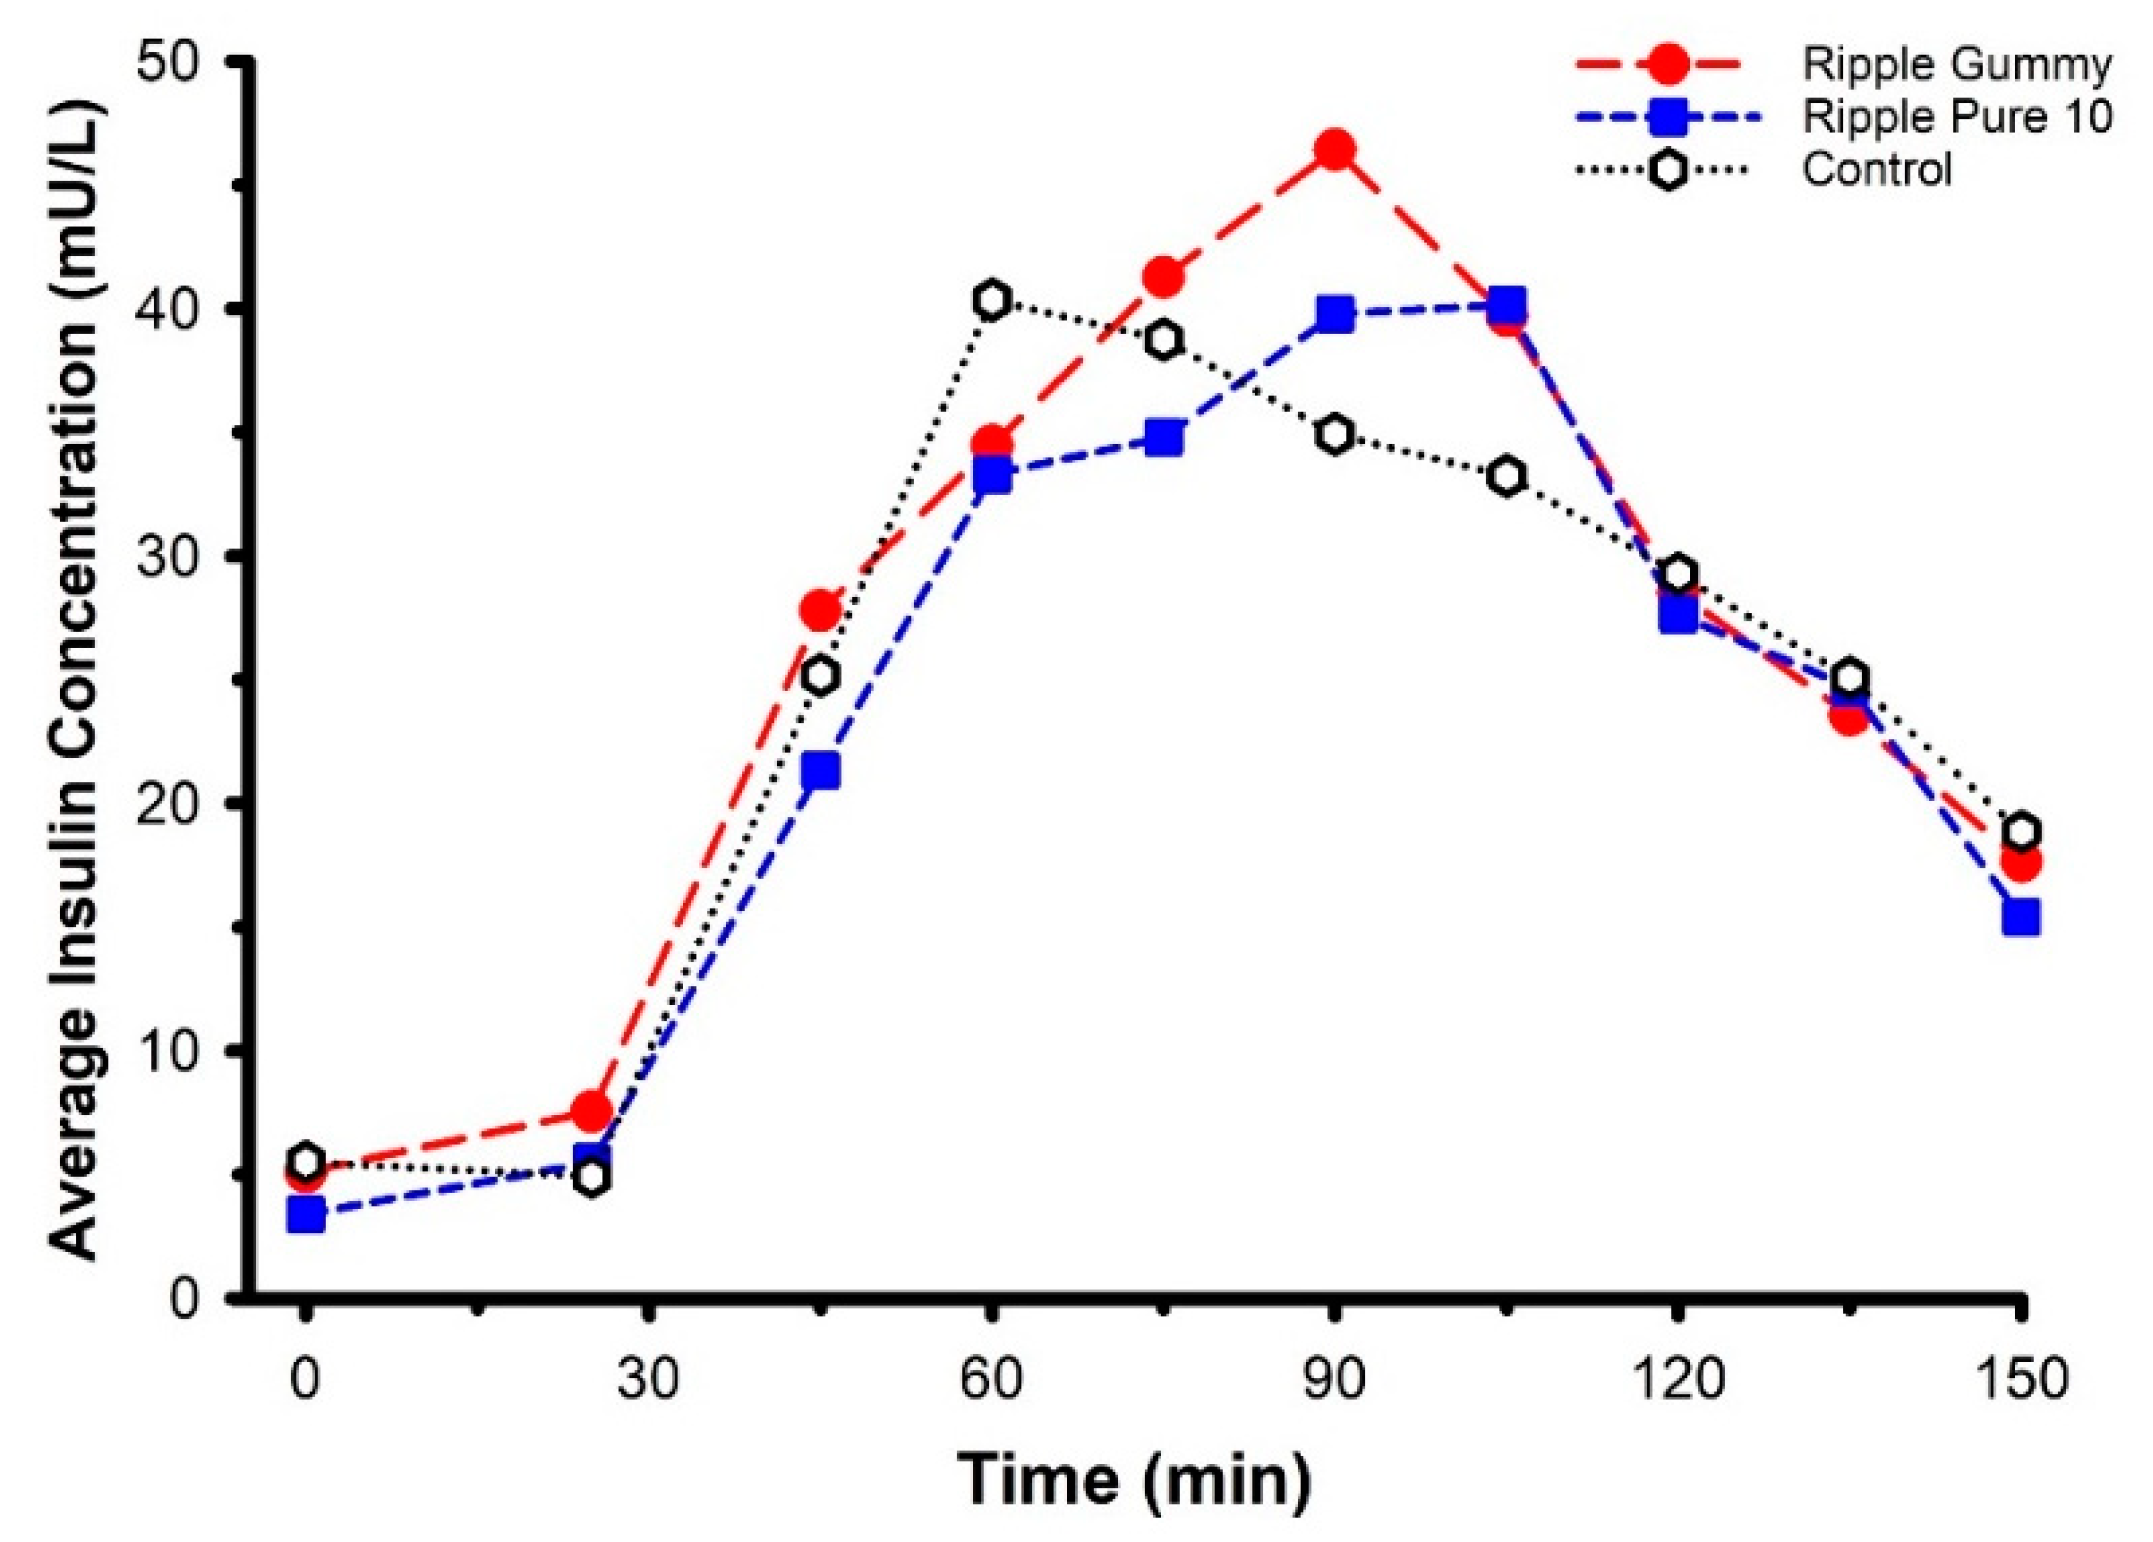
2.4. Oral Glucose Tolerance
3. Discussion
4. Materials and Methods
4.1. Participants
4.2. Protocol Overview
4.3. Procedures
4.4. Commercially Available Edible Marijuana Products
4.5. Reagents and Supplies
4.6. Calibrators, Quality Controls, and Internal Standard Preparation
4.7. Cannabinoid Analysis by LC-MS/MS
4.8. Pharmacokinetic and Oral Glucose Tolerance Test Analysis
4.9. Statistical Analyses
Author Contributions
Funding
Institutional Review Board Statement
Informed Consent Statement
Data Availability Statement
Acknowledgments
Conflicts of Interest
References
- Borodovsky, J.T.; Crosier, B.S.; Lee, D.C.; Sargent, J.D.; Budney, A.J. Smoking, vaping, eating: Is legalization impacting the way people use cannabis? Int. J. Drug Policy 2016, 36, 141–147. [Google Scholar] [CrossRef] [Green Version]
- Knapp, A.A.; Lee, D.C.; Borodovsky, J.T.; Auty, S.G.; Gabrielli, J.; Budney, A.J. Emerging Trends in Cannabis Administration Among Adolescent Cannabis Users. J. Adolesc. Health 2019, 64, 487–493. [Google Scholar] [CrossRef]
- Cao, D.; Srisuma, S.; Bronstein, A.C.; Hoyte, C.O. Characterization of edible marijuana product exposures reported to United States poison centers. Clin. Toxicol. 2016, 54, 840–846. [Google Scholar] [CrossRef]
- Richards, J.R.; Smith, N.E.; Moulin, A.K. Unintentional Cannabis Ingestion in Children: A Systematic Review. J. Pediatr. 2017, 190, 142–152. [Google Scholar] [CrossRef]
- Wang, G.S.; Le Lait, M.C.; Deakyne, S.J.; Bronstein, A.C.; Bajaj, L.; Roosevelt, G. Unintentional Pediatric Exposures to Marijuana in Colorado, 2009–2015. JAMA Pediatr. 2016, 170, e160971. [Google Scholar] [CrossRef] [Green Version]
- White, A.E.; Van Tubbergen, C.; Raymes, B.; Contreras, A.E.; Scallan Walter, E.J. Cannabis-Infused Edible Products in Colorado: Food Safety and Public Health Implications. Am. J. Public Health 2020, 110, 790–795. [Google Scholar] [CrossRef]
- Kaczor, E.E.; Mathews, B.; LaBarge, K.; Chapman, B.P.; Carreiro, S. Cannabis Product Ingestions in Pediatric Patients: Ranges of Exposure, Effects, and Outcomes. J. Med. Toxicol. 2021. [Google Scholar] [CrossRef]
- Newmeyer, M.N.; Swortwood, M.J.; Barnes, A.J.; Abulseoud, O.A.; Scheidweiler, K.B.; Huestis, M.A. Free and Glucuronide Whole Blood Cannabinoids’ Pharmacokinetics after Controlled Smoked, Vaporized, and Oral Cannabis Administration in Frequent and Occasional Cannabis Users: Identification of Recent Cannabis Intake. Clin. Chem. 2016, 62, 1579–1592. [Google Scholar] [CrossRef] [PubMed] [Green Version]
- Schlienz, N.J.; Spindle, T.R.; Cone, E.J.; Herrmann, E.S.; Bigelow, G.E.; Mitchell, J.M.; Flegel, R.; LoDico, C.; Vandrey, R. Pharmacodynamic dose effects of oral cannabis ingestion in healthy adults who infrequently use cannabis. Drug Alcohol. Depend. 2020, 211, 107969. [Google Scholar] [CrossRef]
- Vandrey, R.; Herrmann, E.S.; Mitchell, J.M.; Bigelow, G.E.; Flegel, R.; LoDico, C.; Cone, E.J. Pharmacokinetic Profile of Oral Cannabis in Humans: Blood and Oral Fluid Disposition and Relation to Pharmacodynamic Outcomes. J. Anal. Toxicol. 2017, 41, 83–99. [Google Scholar] [CrossRef] [PubMed]
- Williams, N.N.B.; Ewell, T.R.; Abbotts, K.S.S.; Harms, K.J.; Woelfel, K.A.; Dooley, G.P.; Weir, T.L.; Bell, C. Comparison of Five Oral Cannabidiol Preparations in Adult Humans: Pharmacokinetics, Body Composition, and Heart Rate Variability. Pharmaceuticals 2021, 14, 35. [Google Scholar] [CrossRef]
- Johansson, E.; Noren, K.; Sjovall, J.; Halldin, M.M. Determination of delta 1-tetrahydrocannabinol in human fat biopsies from marihuana users by gas chromatography-mass spectrometry. Biomed. Chromatogr. 1989, 3, 35–38. [Google Scholar] [CrossRef] [PubMed]
- Schlag, A.K.; O’Sullivan, S.E.; Zafar, R.R.; Nutt, D.J. Current controversies in medical cannabis: Recent developments in human clinical applications and potential therapeutics. Neuropharmacology 2021, 191, 108586. [Google Scholar] [CrossRef]
- Breijyeh, Z.; Jubeh, B.; Bufo, S.A.; Karaman, R.; Scrano, L. Cannabis: A Toxin-Producing Plant with Potential Therapeutic Uses. Toxins 2021, 13, 117. [Google Scholar] [CrossRef]
- Cuttler, C.; LaFrance, E.M.; Craft, R.M. A Large-Scale Naturalistic Examination of the Acute Effects of Cannabis on Pain. Cannabis cannabinoid Res. 2020. [Google Scholar] [CrossRef]
- Buckley, M.C.; Kumar, A.; Swaminath, A. Inflammatory Bowel Disease and Cannabis: A Practical Approach for Clinicians. Adv. Ther. 2021. [Google Scholar] [CrossRef]
- Buchanan-Peart, K.R.; Oribhabor, G.I.; Khokale, R.V.; Nelson, M.L.; Cancarevic, I. Cannabis, More Than the Euphoria: Its Therapeutic Use in Drug-Resistant Epilepsy. Cureus 2020, 12, e9299. [Google Scholar] [CrossRef]
- Dell, D.D.; Stein, D.P. Exploring the Use of Medical Marijuana for Supportive Care of Oncology Patients. J. Adv. Pract. Oncol. 2021, 12, 188–201. [Google Scholar] [CrossRef]
- Sidney, S. Marijuana Use and Type 2 Diabetes Mellitus: A Review. Curr. Diabetes Rep. 2016, 16, 117. [Google Scholar] [CrossRef] [PubMed]
- Penner, E.A.; Buettner, H.; Mittleman, M.A. The impact of marijuana use on glucose, insulin, and insulin resistance among US adults. Am. J. Med. 2013, 126, 583–589. [Google Scholar] [CrossRef]
- Ngueta, G.; Ndjaboue, R. Lifetime marijuana use in relation to insulin resistance in lean, overweight, and obese US adults. J. Diabetes 2020, 12, 38–47. [Google Scholar] [CrossRef]
- Imtiaz, S.; Rehm, J. The relationship between cannabis use and diabetes: Results from the National Epidemiologic Survey on Alcohol and Related Conditions III. Drug Alcohol. Rev. 2018, 37, 897–902. [Google Scholar] [CrossRef]
- Barre, T.; Nishimwe, M.L.; Protopopescu, C.; Marcellin, F.; Carrat, F.; Dorival, C.; Delarocque-Astagneau, E.; Larrey, D.; Bourliere, M.; Petrov-Sanchez, V.; et al. Cannabis use is associated with a lower risk of diabetes in chronic hepatitis C-infected patients (ANRS CO22 Hepather cohort). J. Viral. Hepat. 2020, 27, 1473–1483. [Google Scholar] [CrossRef] [PubMed]
- Podolsky, S.; Pattavina, C.G.; Amaral, M.A. Effect of marijuana on the glucose-tolerance test. Ann. N. Y. Acad. Sci. 1971, 191, 54–60. [Google Scholar] [CrossRef]
- Hollister, L.E.; Reaven, G.M. Delta-9-tetrahydrocannabinol and glucose tolerance. Clin. Pharmacol. Ther. 1974, 16, 297–302. [Google Scholar] [CrossRef]
- Permutt, M.A.; Goodwin, D.W.; Schwin, R.; Hill, S.Y. The effect of marijuana on carbohydrate metabolism. Am. J. Psychiatry 1976, 133, 220–224. [Google Scholar]
- Cinnamon Bidwell, L.; YorkWilliams, S.L.; Mueller, R.L.; Bryan, A.D.; Hutchison, K.E. Exploring cannabis concentrates on the legal market: User profiles, product strength, and health-related outcomes. Addict. Behav. Rep. 2018, 8, 102–106. [Google Scholar] [CrossRef] [PubMed]
- Bidwell, L.C.; Ellingson, J.M.; Karoly, H.C.; YorkWilliams, S.L.; Hitchcock, L.N.; Tracy, B.L.; Klawitter, J.; Sempio, C.; Bryan, A.D.; Hutchison, K.E. Association of Naturalistic Administration of Cannabis Flower and Concentrates With Intoxication and Impairment. JAMA Psychiatry 2020, 77, 787–796. [Google Scholar] [CrossRef] [PubMed]
- Stott, C.G.; White, L.; Wright, S.; Wilbraham, D.; Guy, G.W. A phase I study to assess the single and multiple dose pharmacokinetics of THC/CBD oromucosal spray. Eur. J. Clin. Pharmacol. 2013, 69, 1135–1147. [Google Scholar] [CrossRef]
- Feng, J.; Huang, M.; Chai, Z.; Li, C.; Huang, W.; Cui, L.; Li, Y. The influence of oil composition on the transformation, bioaccessibility, and intestinal absorption of curcumin in nanostructured lipid carriers. Food Funct. 2020, 11, 5223–5239. [Google Scholar] [CrossRef] [PubMed]
- Lamsen, M.R.L.; Wang, T.; D’Souza, D.; Dia, V.; Chen, G.; Zhong, Q. Encapsulation of vitamin D3 in gum arabic to enhance bioavailability and stability for beverage applications. J. Food Sci. 2020. [Google Scholar] [CrossRef] [PubMed]
- Jones, P.P.; Davy, K.P.; DeSouza, C.A.; van Pelt, R.E.; Seals, D.R. Absence of age-related decline in total blood volume in physically active females. Am. J. Physiol. 1997, 272, H2534–H2540. [Google Scholar] [CrossRef] [PubMed]
- Davy, K.P.; Seals, D.R. Total blood volume in healthy young and older men. J. Appl. Physiol. 1994, 76, 2059–2062. [Google Scholar] [CrossRef]
- Wong, A.; Montebello, M.E.; Norberg, M.M.; Rooney, K.; Lintzeris, N.; Bruno, R.; Booth, J.; Arnold, J.C.; McGregor, I.S. Exercise increases plasma THC concentrations in regular cannabis users. Drug Alcohol. Depend. 2013, 133, 763–767. [Google Scholar] [CrossRef] [PubMed]
- Wong, A.; Keats, K.; Rooney, K.; Hicks, C.; Allsop, D.J.; Arnold, J.C.; McGregor, I.S. Fasting and exercise increase plasma cannabinoid levels in THC pre-treated rats: An examination of behavioural consequences. Psychopharmacology 2014, 231, 3987–3996. [Google Scholar] [CrossRef]
- Westin, A.A.; Mjones, G.; Burchardt, O.; Fuskevag, O.M.; Slordal, L. Can physical exercise or food deprivation cause release of fat-stored cannabinoids? Basic Clin. Pharmacol. Toxicol. 2014, 115, 467–471. [Google Scholar] [CrossRef]
- Farokhnia, M.; McDiarmid, G.R.; Newmeyer, M.N.; Munjal, V.; Abulseoud, O.A.; Huestis, M.A.; Leggio, L. Effects of oral, smoked, and vaporized cannabis on endocrine pathways related to appetite and metabolism: A randomized, double-blind, placebo-controlled, human laboratory study. Transl. Psychiatry 2020, 10, 71. [Google Scholar] [CrossRef] [Green Version]
- Baggio, M.; Chong, A. Recreational marijuana laws and junk food consumption. Econ. Hum. Biol. 2020, 39, 100922. [Google Scholar] [CrossRef]
- Peltonen, G.L.; Scalzo, R.L.; Schweder, M.M.; Larson, D.G.; Luckasen, G.J.; Irwin, D.; Hamilton, K.L.; Schroeder, T.; Bell, C. Sympathetic inhibition attenuates hypoxia induced insulin resistance in healthy adult humans. J. Physiol. 2012, 590, 2801–2809. [Google Scholar] [CrossRef]
- Oltmanns, K.M.; Gehring, H.; Rudolf, S.; Schultes, B.; Rook, S.; Schweiger, U.; Born, J.; Fehm, H.L.; Peters, A. Hypoxia causes glucose intolerance in humans. Am. J. Respir Crit. Care Med. 2004, 169, 1231–1237. [Google Scholar] [CrossRef] [Green Version]
- Bethel, M.A.; Price, H.C.; Sourij, H.; White, S.; Coleman, R.L.; Ring, A.; Kennedy, I.E.; Tucker, L.; Holman, R.R. Evaluation of a self-administered oral glucose tolerance test. Diabetes Care 2013, 36, 1483–1488. [Google Scholar] [CrossRef] [Green Version]
- Beals, J.W.; Binns, S.E.; Davis, J.L.; Giordano, G.R.; Klochak, A.L.; Paris, H.L.; Schweder, M.M.; Peltonen, G.L.; Scalzo, R.L.; Bell, C. Concurrent Beet Juice and Carbohydrate Ingestion: Influence on Glucose Tolerance in Obese and Nonobese Adults. J. Nutr. Metab. 2017, 2017, 6436783. [Google Scholar] [CrossRef] [PubMed] [Green Version]
- Palomares, B.; Ruiz-Pino, F.; Garrido-Rodriguez, M.; Eugenia Prados, M.; Sanchez-Garrido, M.A.; Velasco, I.; Vazquez, M.J.; Nadal, X.; Ferreiro-Vera, C.; Morrugares, R.; et al. Tetrahydrocannabinolic acid A (THCA-A) reduces adiposity and prevents metabolic disease caused by diet-induced obesity. Biochem. Pharmacol. 2020, 171, 113693. [Google Scholar] [CrossRef]
- Panee, J.; Gerschenson, M.; Chang, L. Associations Between Microbiota, Mitochondrial Function, and Cognition in Chronic Marijuana Users. J. Neuroimmune Pharmacol. 2018, 13, 113–122. [Google Scholar] [CrossRef]
- Berk, K.; Bzdega, W.; Konstantynowicz-Nowicka, K.; Charytoniuk, T.; Zywno, H.; Chabowski, A. Phytocannabinoids-A Green Approach toward Non-Alcoholic Fatty Liver Disease Treatment. J. Clin. Med. 2021, 10, 393. [Google Scholar] [CrossRef]
- Baumeister, S.E.; Nolde, M.; Alayash, Z.; Leitzmann, M.; Baurecht, H.; Meisinger, C. Cannabis use does not impact on type 2 diabetes: A two-sample Mendelian randomization study. Addict. Biol. 2021, e13020. [Google Scholar] [CrossRef]
- Pantoja-Ruiz, C.; Jimenez, P.R.; Castaneda-Cardona, C.; Rosselli, D. Cannabis and pain: A scoping review. Braz. J. Anesthesiol. 2021. [Google Scholar] [CrossRef]
- Kumar, P.; Mahato, D.K.; Kamle, M.; Borah, R.; Sharma, B.; Pandhi, S.; Tripathi, V.; Yadav, H.S.; Devi, S.; Patil, U.; et al. Pharmacological properties, therapeutic potential, and legal status of Cannabis sativa L.: An overview. Phytother. Res. 2021. [Google Scholar] [CrossRef] [PubMed]
- Lorenzo, C.; Haffner, S.M.; Stancakova, A.; Kuusisto, J.; Laakso, M. Fasting and OGTT-derived measures of insulin resistance as compared with the euglycemic-hyperinsulinemic clamp in nondiabetic Finnish offspring of type 2 diabetic individuals. J. Clin. Endocrinol. Metab. 2015, 100, 544–550. [Google Scholar] [CrossRef]
- Faul, F.; Erdfelder, E.; Lang, A.G.; Buchner, A. G*Power 3: A flexible statistical power analysis program for the social, behavioral, and biomedical sciences. Behav. Res. Methods 2007, 39, 175–191. [Google Scholar] [CrossRef]
- Biggs, M.L.; Mukamal, K.J.; Luchsinger, J.A.; Ix, J.H.; Carnethon, M.R.; Newman, A.B.; de Boer, I.H.; Strotmeyer, E.S.; Mozaffarian, D.; Siscovick, D.S. Association between adiposity in midlife and older age and risk of diabetes in older adults. JAMA 2010, 303, 2504–2512. [Google Scholar] [CrossRef] [PubMed] [Green Version]
- Chan, J.M.; Rimm, E.B.; Colditz, G.A.; Stampfer, M.J.; Willett, W.C. Obesity, fat distribution, and weight gain as risk factors for clinical diabetes in men. Diabetes Care 1994, 17, 961–969. [Google Scholar] [CrossRef] [PubMed] [Green Version]
- Matthews, D.R.; Hosker, J.P.; Rudenski, A.S.; Naylor, B.A.; Treacher, D.F.; Turner, R.C. Homeostasis model assessment: Insulin resistance and beta-cell function from fasting plasma glucose and insulin concentrations in man. Diabetologia 1985, 28, 412–419. [Google Scholar] [CrossRef] [PubMed] [Green Version]
- Matsuda, M.; DeFronzo, R.A. Insulin sensitivity indices obtained from oral glucose tolerance testing: Comparison with the euglycemic insulin clamp. Diabetes Care 1999, 22, 1462–1470. [Google Scholar] [CrossRef]


| Characteristic | Mean ± SD | Range |
|---|---|---|
| Sex (M/F) | 4/3 | - |
| Age (years) | 31 ± 5 | 24–39 |
| Height (cm) | 170 ± 11 | 159–193 |
| Body Mass (kg) | 82.3 ± 17.7 | 62.7–113.9 |
| Body Mass Index (kg/m2) | 28.6 ± 6.5 | 23.0–40.8 |
| Fat Mass (kg) | 28.1 ± 13.5 | 16.3–55.6 |
| Body Fat (%) | 33.4 ± 10.1 | 21.2–48.9 |
| Lean Mass (kg) | 52.2 ± 10.0 | 38.1–66.0 |
| Bone Mineral Content (kg) | 2.3 ± 0.4 | 2.0–3.1 |
| Product and Manufacturer | Nutrition | Ingredients |
|---|---|---|
| Ripple Blood Orange Gummies (Stillwater Brands, Commerce City, CO, USA) | 20 kcal per serving: 2 gummies; (Fat 0 g, Total carbohydrate 4 g, Protein 0 g) | Glucose syrup, sugar, water, fruit juice concentrates (Apple, Pear), gelatin, modified food starch, Ripple (water, modified food starch, cannabinoid extracts, MCT oil), contains 2% or less of: natural flavors, malic acid, citric acid, carnauba wax, vegetable juice for color. |
| Ripple Pure 10 (Stillwater Brands, Commerce City, CO, USA) | 0 kcal per serving (Fat 0 g, Total carbohydrate 0 g, Protein 0 g) | Sorbitol, modified food starch, cannabinoid extracts, MCT oil |
| Ripple Quick Sticks Blueberry Pomegranate (Stillwater Brands, Commerce City, CO, USA) | 5 kcal per individual serving (Fat 0 g, Total carbohydrate 1 g, Protein 0 g) | Ripple (Sorbitol, Modified Food Starch, Cannabinoid Extracts, MCT Oil), Sugar, Fructose, Natural Flavors, Citric Acid, Malic Acid |
| Wana Fast Acting Gummies, Pina Colada Indica (Wana Brands, Boulder, CO, USA) | 30 kcal per serving: 2 gummies (Fat 0 g, Total carbohydrate 8 g, Protein 0 g) | Organic Cane Sugar, Organic Tapioca Syrup, Pectin (Pectin, Potassium Sodium Tartrate, Polyphosphate, Sucrose), Citric Acid, Natural Flavoring, Sodium Citrate, Modified Food Starch, Xanthan Gum, THC. |
| Wana Sour Gummies (Wana Brands, Boulder, CO, USA) | 15 kcal per serving (Fat 0 g, Total carbohydrate 4 g, Protein 0 g) | Organic Sugar, Organic Tapioca Syrup, Pectin (Pectin, Potassium Sodium Tartrate, Polyphosphate, Sucrose), Citric Acid, Natural Flavoring and Coloring, Sodium Citrate, Marijuana Concentrate, and Botanical Terpenes for Flavor. |
| Welch’s Fruit Snacks (Park Ridge, NJ, USA) * | 15 kcal per serving (Fat 0 g, Carbohydrate 2 g, Sugar 3 g, Protein 0 g) | Fruit puree (grape, peach, orange, strawberry, and raspberry), corn syrup, sugar, modified corn starch, gelatin, concord grape juice from concentrate, citric acid, lactic acid, natural and artificial flavors, ascorbic acid (vitamin C), alpha tocopherol acetate (vitamin E), vitamin A palmitate, sodium citrate, coconut oil, carnauba wax, annatto (color), turmeric (color), red 40, and blue 1. |
| Product | Tmax (min) | Cmax (ng/mL) | AUC0-240 (min * ng/mL) | Vd (mL) | CL/F0-240 (mL/min) | ke (1/min) | t1/2 (min) | |
|---|---|---|---|---|---|---|---|---|
| Ripple Gummies | n | 7 | 7 | 7 | 7 | 7 | 7 | 7 |
| 35.7 | 5.54 | 533 | 4,534,900 | 19,313 | 0.005 | 268.3 | ||
| σ | 12.1 | 3.10 | 286 | 4,406,250 | 20,443 | 0.003 | 267.0 | |
| 45.0 | 5.22 | 463 | 2,979,599 | 14,131 | 0.00 | 152.7 | ||
| Ripple Pure 10 | n | 7 | 7 | 7 | 6 | 6 | 6 | 6 |
| 40.7 | 4.31 | 447 | 4,397,542 | 23,966 | 0.005 | 152.4 | ||
| σ | 11.3 | 3.01 | 301 | 2,282,851 | 17,028 | 0.002 | 47.1 | |
| 45.0 | 2.37 | 271 | 4,531,448 | 22,193 | 0.000 | 148.6 | ||
| Ripple Quick Sticks | n | 7 | 7 | 7 | 5 | 5 | 5 | 5 |
| 90.7 | 4.56 | 570 | 2,648,627 | 11,844 | 0.006 | 215.5 | ||
| σ | 84.6 | 1.80 | 268 | 1,272,398 | 5691 | 0.004 | 175.0 | |
| 60.0 | 5.17 | 632 | 2,369,956 | 12,915 | 0.000 | 206.3 | ||
| Wana Fast Acting Gummies | n | 7 | 7 | 7 | 6 | 6 | 6 | 6 |
| 51.4 | 4.39 | 455 | 4,989,024 | 19,431 | 0.005 | 158.8 | ||
| σ | 31.1 | 2.91 | 248 | 4,898,405 | 14,590 | 0.002 | 75.5 | |
| 45.0 | 4.29 | 421 | 2,401,279 | 14,491 | 0.010 | 133.5 | ||
| Wana Sour Gummies | n | 7 | 7 | 7 | 6 | 6 | 6 | 6 |
| 62.1 | 3.22 | 406 | 3,960,415 | 16,420 | 0.004 | 180.0 | ||
| σ | 53.0 | 2.04 | 296 | 1,463,937 | 7526 | 0.001 | 68.3 | |
| 45.0 | 2.57 | 305 | 4,462,147 | 15,837 | 0.000 | 165.5 | ||
| P- | 0.548 | 0.110 | 0.210 | 0.468 | 0.446 | 0.697 | 0.684 | |
| F- | 3.061 * | 2.12 | 1.587 | 0.928 | 0.973 | 0.556 | 0.576 |
| Product | Tmax (min) | Cmax (ng/mL) | AUC0-240 (min * ng/mL) | Vd (mL) | CL/F0-240 (mL/min) | ke (1/min) | t1/2 (min) | |
|---|---|---|---|---|---|---|---|---|
| Ripple Gummies | n | 7 | 7 | 7 | 7 | 7 | 7 | 7 |
| 55.7 | 6.60 | 816 | 2,993,411 | 7138 | 0.005 | 512.8 | ||
| σ | 16.7 | 3.42 | 361 | 3,760,404 | 2809 | 0.002 | 989.6 | |
| 45.0 | 7.97 | 950 | 1,284,652 | 7100 | 0.000 | 149.3 | ||
| Ripple Pure 10 | n | 7 | 7 | 7 | 7 | 7 | 7 | 7 |
| 53.6 | 5.05 | 560 | 3,628,286 | 17,124 | 0.005 | 159.4 | ||
| σ | 17.0 | 4.20 | 359 | 2,117,850 | 13,390 | 0.001 | 49.0 | |
| 45.0 | 3.32 | 447 | 3,804,011 | 11,432 | 0.000 | 145.8 | ||
| Ripple Quick Sticks | n | 7 | 7 | 7 | 5 | 5 | 5 | 5 |
| 100.7 | 5.33 | 700 | 3,036,162 | 8389 | 0.003 | 403.7 | ||
| σ | 77.3 | 2.71 | 381 | 1,634,370 | 6850 | 0.003 | 335.4 | |
| 60.0 | 4.62 | 747 | 3,076,976 | 8413 | 0.000 | 267.9 | ||
| Wana Fast Acting Gummies | n | 7 | 7 | 7 | 5 | 5 | 5 | 5 |
| 83.6 | 5.40 | 669 | 1,773,924 | 6703 | 0.005 | 213.1 | ||
| σ | 49.6 | 3.71 | 361 | 783,269 | 2218 | 0.002 | 154.4 | |
| 60.0 | 4.83 | 753 | 1,633,620 | 6014 | 0.000 | 138.8 | ||
| Wana Sour Gummies | n | 7 | 7 | 7 | 6 | 6 | 6 | 6 |
| 72.9 | 4.45 | 626 | 2,141,277 | 8860 | 0.005 | 234.0 | ||
| σ | 48.6 | 2.25 | 310 | 956,697 | 5405 | 0.005 | 199.8 | |
| 60.0 | 4.36 | 544 | 1,811,579 | 7708 | 0.000 | 189.1 | ||
| P- | 0.369 | 0.390 | 0.065 | 0.758 | 0.169 | 0.975 | 0.778 | |
| F- | 4.283 * | 1.076 | 2.553 | 0.468 | 1.808 | 0.117 | 0.440 |
| Product | Tmax (min) | Cmax (ng/mL) | AUC0-240 (min * ng/mL) | Vd (mL) | CL/F0-240 (mL/min) | ke (1/min) | t1/2 (min) | |
|---|---|---|---|---|---|---|---|---|
| Ripple Gummies | n | 7 | 7 | 7 | 4 | 4 | 4 | 4 |
| 105.0 | 44.01 | 7047 | 266,200 | 484 | 0.002 | 365.3 | ||
| σ | 75.0 | 21.32 | 3264 | 140,158 | 147 | 0.000 | 97.3 | |
| 60.0 | 34.28 | 6251 | 241,269 | 514 | 0.000 | 325.7 | ||
| Ripple Pure 10 | n | 7 | 7 | 7 | 6 | 6 | 6 | 6 |
| 87.9 | 40.24 | 6311 | 360,519 | 569 | 0.001 | 846.3 | ||
| σ | 67.9 | 19.44 | 3137 | 194,482 | 420 | 0.001 | 986.7 | |
| 60.0 | 34.15 | 5154 | 299,004 | 568 | 0.000 | 487.8 | ||
| Ripple Quick Sticks | n | 7 | 7 | 7 | 3 | 3 | 3 | 3 |
| 130.7 | 42.25 | 6195 | 288,446 | 802 | 0.003 | 272.2 | ||
| σ | 86.0 | 22.51 | 3667 | 28,675 | 344 | 0.001 | 80.7 | |
| 75.0 | 35.63 | 5870 | 301,043 | 674 | 0.000 | 309.4 | ||
| Wana Fast Acting Gummies | n | 7 | 7 | 7 | 3 | 3 | 3 | 3 |
| 145.7 | 39.36 | 6467 | 312,251 | 363 | 0.001 | 611.4 | ||
| σ | 84.3 | 15.12 | 2798 | 201,295 | 247 | 0.000 | 73.8 | |
| 180.0 | 41.04 | 6203 | 208,977 | 262 | 0.000 | 585.7 | ||
| Wana Sour Gummies | n | 7 | 7 | 7 | 2 | 2 | 2 | 2 |
| 145.7 | 35.78 | 6009 | 297,051 | 758 | 0.003 | 677.6 | ||
| σ | 68.6 | 18.89 | 3324 | 81,970 | 789 | 0.003 | 780.3 | |
| 180.0 | 29.09 | 5119 | 297,051 | 758 | 0.000 | 677.6 | ||
| P- | 0.514 | 0.746 | 0.642 | 0.134 | 0.680 | 0.107 | 0.860 | |
| F- | 3.270 * | 1.943 * | 2.514 * | 2.533 | 0.591 | 2.852 | 0.314 |
| THC-OH/THC | THC-COOH/THC | ||||
|---|---|---|---|---|---|
| Product | Cmax | AUC0-240 | Cmax | AUC0-240 | |
| Ripple Gummies | n | 7 | 7 | 7 | 7 |
| 1.22 | 1.64 | 10.54 | 17.10 | ||
| σ | 0.26 | 0.45 | 7.14 | 12.49 | |
| 1.26 | 1.51 | 6.53 | 11.12 | ||
| Ripple Pure 10 | n | 7 | 7 | 7 | 7 |
| 1.11 | 1.35 | 11.46 | 16.06 | ||
| σ | 0.24 | 0.53 | 5.31 | 5.53 | |
| 1.02 | 1.21 | 10.52 | 14.55 | ||
| Ripple Quick Sticks | n | 7 | 7 | 7 | 7 |
| 1.28 | 2.06 | 10.84 | 11.76 | ||
| σ | 0.58 | 2.35 | 6.63 | 4.58 | |
| 1.21 | 1.33 | 8.83 | 10.81 | ||
| Wana Fast Acting Gummies | n | 7 | 7 | 7 | 7 |
| 1.27 | 1.53 | 13.24 | 17.02 | ||
| σ | 0.29 | 0.44 | 7.99 | 7.24 | |
| 1.17 | 1.57 | 11.52 | 18.05 | ||
| Wana Sour Gummies | n | 7 | 7 | 7 | 7 |
| 1.44 | 1.68 | 12.64 | 16.43 | ||
| σ | 0.25 | 0.51 | 5.19 | 4.32 | |
| 1.46 | 1.82 | 11.37 | 16.77 | ||
| P- | 0.344 | 0.195 | 0.772 | 0.137 | |
| F- | 1.182 | 6.057 * | 0.449 | 6.971 * | |
| Age | Ht | BMC | Fat Mass | Lean Mass | Total Mass | % Fat | BMI | |||
|---|---|---|---|---|---|---|---|---|---|---|
| Tmax | Ripple Gummies | r | 0.61 | 0.54 | 0.65 | 0.22 | 0.90 | 0.71 | −0.24 | 0.42 |
| p | 0.15 | 0.21 | 0.12 | 0.63 | 0.01 | 0.07 | 0.61 | 0.35 | ||
| Ripple Pure 10 | r | −0.16 | 0.91 | 0.87 | −0.63 | 0.66 | −0.08 | −0.90 | −0.54 | |
| p | 0.74 | 0.01 | 0.01 | 0.13 | 0.11 | 0.87 | 0.01 | 0.21 | ||
| Ripple Quick Sticks | r | −0.62 | −0.20 | −0.33 | 0.07 | −0.33 | −0.12 | 0.21 | 0.00 | |
| p | 0.13 | 0.67 | 0.48 | 0.89 | 0.47 | 0.79 | 0.65 | 1.00 | ||
| Wana Fast Acting Gummies | r | 0.50 | 0.01 | 0.03 | 0.09 | 0.33 | 0.13 | −0.14 | 0.10 | |
| p | 0.25 | 0.98 | 0.95 | 0.85 | 0.47 | 0.79 | 0.76 | 0.83 | ||
| Wana Sour Gummies | r | −0.32 | 0.87 | 0.87 | −0.35 | 0.58 | 0.09 | −0.53 | −0.36 | |
| p | 0.47 | 0.01 | 0.01 | 0.45 | 0.17 | 0.85 | 0.22 | 0.43 | ||
| Cmax | Ripple Gummies | r | −0.24 | −0.68 | −0.77 | 0.30 | −0.80 | −0.25 | 0.58 | 0.10 |
| p | 0.61 | 0.09 | 0.04 | 0.51 | 0.03 | 0.58 | 0.17 | 0.82 | ||
| Ripple Pure 10 | r | −0.21 | −0.48 | −0.60 | 0.35 | −0.62 | −0.12 | 0.58 | 0.13 | |
| p | 0.65 | 0.28 | 0.15 | 0.44 | 0.14 | 0.80 | 0.17 | 0.79 | ||
| Ripple Quick Sticks | r | −0.21 | 0.03 | −0.04 | −0.19 | −0.31 | −0.34 | −0.10 | −0.36 | |
| p | 0.65 | 0.95 | 0.93 | 0.68 | 0.50 | 0.45 | 0.84 | 0.43 | ||
| Wana Fast Acting Gummies | r | −0.07 | −0.36 | −0.46 | 0.29 | −0.38 | −0.00 | 0.31 | 0.18 | |
| p | 0.89 | 0.43 | 0.30 | 0.53 | 0.40 | 0.99 | 0.51 | 0.69 | ||
| Wana Sour Gummies | r | 0.21 | −0.63 | −0.66 | 0.73 | −0.42 | 0.29 | 0.84 | 0.60 | |
| p | 0.65 | 0.13 | 0.11 | 0.06 | 0.34 | 0.53 | 0.02 | 0.16 | ||
| AUC0-240 | Ripple Gummies | r | 0.05 | −0.63 | −0.75 | 0.65 | −0.49 | 0.20 | 0.74 | 0.52 |
| p | 0.92 | 0.13 | 0.05 | 0.12 | 0.27 | 0.67 | 0.06 | 0.23 | ||
| Ripple Pure 10 | r | −0.12 | −0.34 | −0.54 | 0.56 | −0.32 | 0.23 | 0.59 | 0.40 | |
| p | 0.80 | 0.46 | 0.21 | 0.19 | 0.49 | 0.62 | 0.17 | 0.38 | ||
| Ripple Quick Sticks | r | −0.17 | −0.06 | −0.23 | 0.03 | −0.25 | −0.13 | 0.04 | −0.10 | |
| p | 0.71 | 0.89 | 0.62 | 0.95 | 0.58 | 0.78 | 0.93 | 0.83 | ||
| Wana Fast Acting Gummies | r | 0.07 | −0.43 | −0.52 | 0.39 | −0.34 | 0.10 | 0.38 | 0.32 | |
| p | 0.88 | 0.34 | 0.24 | 0.39 | 0.46 | 0.83 | 0.40 | 0.49 | ||
| Wana Sour Gummies | r | 0.35 | −0.47 | −0.52 | 0.89 | −0.13 | 0.59 | 0.83 | 0.82 | |
| p | 0.44 | 0.29 | 0.23 | 0.01 | 0.79 | 0.16 | 0.02 | 0.02 |
| Analyte Name | Precursor Ion | Product Ion | Frag (V) | CE (V) | Cell Acc (V) | Polarity |
|---|---|---|---|---|---|---|
| Dansyl-THC-COOH | 343.2 | 532 | 156 | 20 | 4 | Positive |
| Dansyl-THC-COOH | 343.2 | 227 | 156 | 56 | 4 | Positive |
| Dansyl-THC-COOH-D9 | 587.3 | 233 | 156 | 56 | 4 | Positive |
| Dansyl-THC-COOH-D9 | 587.3 | 170 | 156 | 40 | 4 | Positive |
| Dansyl-THC-OH | 564.3 | 241 | 139 | 64 | 4 | Positive |
| Dansyl-THC-OH | 564.3 | 256 | 139 | 36 | 4 | Positive |
| Dansyl-THC-OH-D3 | 567.3 | 241 | 139 | 64 | 4 | Positive |
| Dansyl-THC-OH-D3 | 567.3 | 256 | 139 | 36 | 4 | Positive |
| Dansyl-THC | 548.3 | 171 | 160 | 44 | 4 | Positive |
| Dansyl-THC | 548.3 | 156 | 160 | 80 | 4 | Positive |
| Dansyl-THC-D3 | 551.3 | 171 | 160 | 44 | 4 | Positive |
| Dansyl-THC-D3 | 551.3 | 156 | 160 | 80 | 4 | Positive |
Publisher’s Note: MDPI stays neutral with regard to jurisdictional claims in published maps and institutional affiliations. |
© 2021 by the authors. Licensee MDPI, Basel, Switzerland. This article is an open access article distributed under the terms and conditions of the Creative Commons Attribution (CC BY) license (https://creativecommons.org/licenses/by/4.0/).
Share and Cite
Ewell, T.R.; Abbotts, K.S.S.; Williams, N.N.B.; Butterklee, H.M.; Bomar, M.C.; Harms, K.J.; Rebik, J.D.; Mast, S.M.; Akagi, N.; Dooley, G.P.; et al. Pharmacokinetic Investigation of Commercially Available Edible Marijuana Products in Humans: Potential Influence of Body Composition and Influence on Glucose Control. Pharmaceuticals 2021, 14, 817. https://0-doi-org.brum.beds.ac.uk/10.3390/ph14080817
Ewell TR, Abbotts KSS, Williams NNB, Butterklee HM, Bomar MC, Harms KJ, Rebik JD, Mast SM, Akagi N, Dooley GP, et al. Pharmacokinetic Investigation of Commercially Available Edible Marijuana Products in Humans: Potential Influence of Body Composition and Influence on Glucose Control. Pharmaceuticals. 2021; 14(8):817. https://0-doi-org.brum.beds.ac.uk/10.3390/ph14080817
Chicago/Turabian StyleEwell, Taylor Russell, Kieran Shay Struebin Abbotts, Natasha N. Bondareva Williams, Hannah Michelle Butterklee, Matthew Charles Bomar, Kole Jerel Harms, Jordan Douglas Rebik, Sarah Margaret Mast, Natalie Akagi, Gregory P. Dooley, and et al. 2021. "Pharmacokinetic Investigation of Commercially Available Edible Marijuana Products in Humans: Potential Influence of Body Composition and Influence on Glucose Control" Pharmaceuticals 14, no. 8: 817. https://0-doi-org.brum.beds.ac.uk/10.3390/ph14080817