
Identification of Immune Subtypes of Esophageal Adenocarcinoma to Predict Prognosis and Immunotherapy Response


School of Pharmaceutical Sciences (Shenzhen), Sun Yat-sen University, Shenzhen 518107, China
*
Authors to whom correspondence should be addressed.
Pharmaceuticals 2022, 15(5), 605; https://0-doi-org.brum.beds.ac.uk/10.3390/ph15050605
Submission received: 6 April 2022
/
Revised: 11 May 2022
/
Accepted: 12 May 2022
/
Published: 14 May 2022
(This article belongs to the Special Issue Therapeutic Strategies and Targets to Improve the Efficacy of PD-1/PD-L1 Blockade)
Abstract
:A low response rate limits the application of immune checkpoint inhibitors (ICIs) in the treatment of esophageal adenocarcinoma (EAC), which requires the precise characterization of heterogeneous tumor microenvironments. This study aimed to identify the molecular features and tumor microenvironment compositions of EAC to facilitate patient stratification and provide novel strategies to improve clinical outcomes. Here, we performed consensus molecular subtyping with nonnegative matrix factorization (NMF) using EAC data from the Cancer Genome Atlas (TCGA) and identified two distinct subtypes with significant prognostic differences and differences in tumor microenvironments. The findings were further validated in independent EAC cohorts and potential response to ICI therapy was estimated using Tumor Immune Dysfunction and Exclusion (TIDE) and SubMap methods. Our findings suggest that EAC patients of subtype 2 with low levels of cancer-associated fibroblasts, tumor associated macrophages (TAMs), and MDSCs in the tumor microenvironment may benefit from PD-1 blockade therapy, while patients of subtype 1 are more responsive to chemotherapy or combination therapy. These findings might improve our understanding of immunotherapy efficacy and be useful in the development of new strategies to better guide immunotherapy and targeted therapy in the treatment of EAC.
1. Introduction
Esophageal cancer is the sixth most prevalent cause of cancer-related death, with a 5-year survival rate of 14% [1]. Esophageal adenocarcinoma (EAC) and squamous cell carcinoma (ESCC) are the two main histological types of esophageal cancer. EAC usually occurs in the lower middle of the esophagus [2], and its incidence is increasing in Western countries [3]. Current available treatments for EAC include surgery, perioperative chemotherapy [4,5], neoadjuvant chemoradiotherapy [6], and targeted therapies against growth factors EGFR, VEGFR, HER-2 [7] and DNA methyltransferases [8]. However, esophageal cancer lacks common oncogenic driver mutations [9] and conventional treatments have a limited efficacy with relatively severe adverse effects. So far, only the targeting of HER-2 positive tumors has shown clinical efficacy to a certain extent [8,10], while other therapies targeting oncogenes or related pathways have proven mostly ineffective due to drug resistance [11]. Recent advancements in nanoparticle-based drug delivery systems have provided novel therapeutic approaches for improving cellular targeting, reducing side effects, and combating drug resistance [12,13,14]. Although significant progress has been made in molecularly profiling esophageal cancer to identify patient subgroups who might benefit from targeted therapy [15], overall therapeutic success remains limited. Thus, molecular subtyping of EAC is urgently needed to facilitate patient stratification and pharmaceutical development.
Recently, immunotherapy—especially immune checkpoint inhibitors (ICIs) targeting programmed death receptor 1 (PD-1) and its ligand (PD-L1)—has provided a promising new avenue for treating esophageal cancer [16,17]. With the rise of immunotherapy, the treatment of esophageal cancer has also moved towards the precision medicine era. However, employing PD-1/PD-L1 antibodies alone or in combination with other ICIs to target the immunological microenvironment has yielded inconsistent results. For example, the overall response rate reached 40% in PD-L1-positive EAC patients in the KEYNOTE-028 trial [18]. In contrast, only 5.2% of patients with advanced or metastatic EAC after two standard therapies achieved partial response, and no patients achieved complete response in the phase II KEYNOTE-180 trial [19]. Pembrolizumab showed no overall survival (OS) advantage over chemotherapy for EAC patients [20]. An elucidation of the potential mechanism regulating ICI response and a classification of the most sensitive subpopulations of EAC patients are still lacking. Reliable predictive biomarkers are thus required to identify potential responders to ICIs therapy [21].
It is vital to further develop reliable and predictive biomarkers for prospective ICI response in order to increase the practicability of ICI therapy. There have been many studies on predictive biomarkers, including tumor mutation burden (TMB), microsatellite instability (MSI), and PD-L1 status [22,23]. A previous study classified gastrointestinal adenocarcinomas of the upper (gastroesophagus) and lower digestive tract (colorectal) into subgroups of chromosomal instability, microsatellite instability, and hypermethylation phenotype [24]. A pan-cancer analysis of TCGA also identified six immunogenomic subtypes across 33 cancer types [25]. However, MSI was rarely observed in EAC [26] and the association of TMB with overall survival was not observed after excluding MSI-high patients [27]. Further molecular and immune subtyping is needed to guide clinical treatment for EAC patients. There is mounting evidence that the tumor microenvironment (TME) is closely related to prognosis and therapy response. Studies have also suggested that immunotherapy response is highly dependent on dynamic tumor–immune interactions in the TME [28,29]. A deeper understanding of the TME could provide new opportunities to identify novel therapeutic targets for immunotherapy [30,31].
Since the TME plays a critical role in determining immunotherapy response, we hypothesize that EAC can be further separated into subtypes with distinct immunological states which may provide guidance for individualized patient treatment. In this study, we performed integrated bioinformatic analyses to identify EAC subtypes with distinguished prognoses and therapeutic responses. Specifically, we comprehensively characterized the gene expression patterns, functional annotations, and immune landscapes of the identified EAC subtypes. We then predicted their sensitivity in responding to chemotherapeutic drugs and ICIs. Finally, we constructed and validated a subtype classifier based on molecular and immunological features of EAC subtypes.
2. Results
2.1. Identification of EAC Subtypes
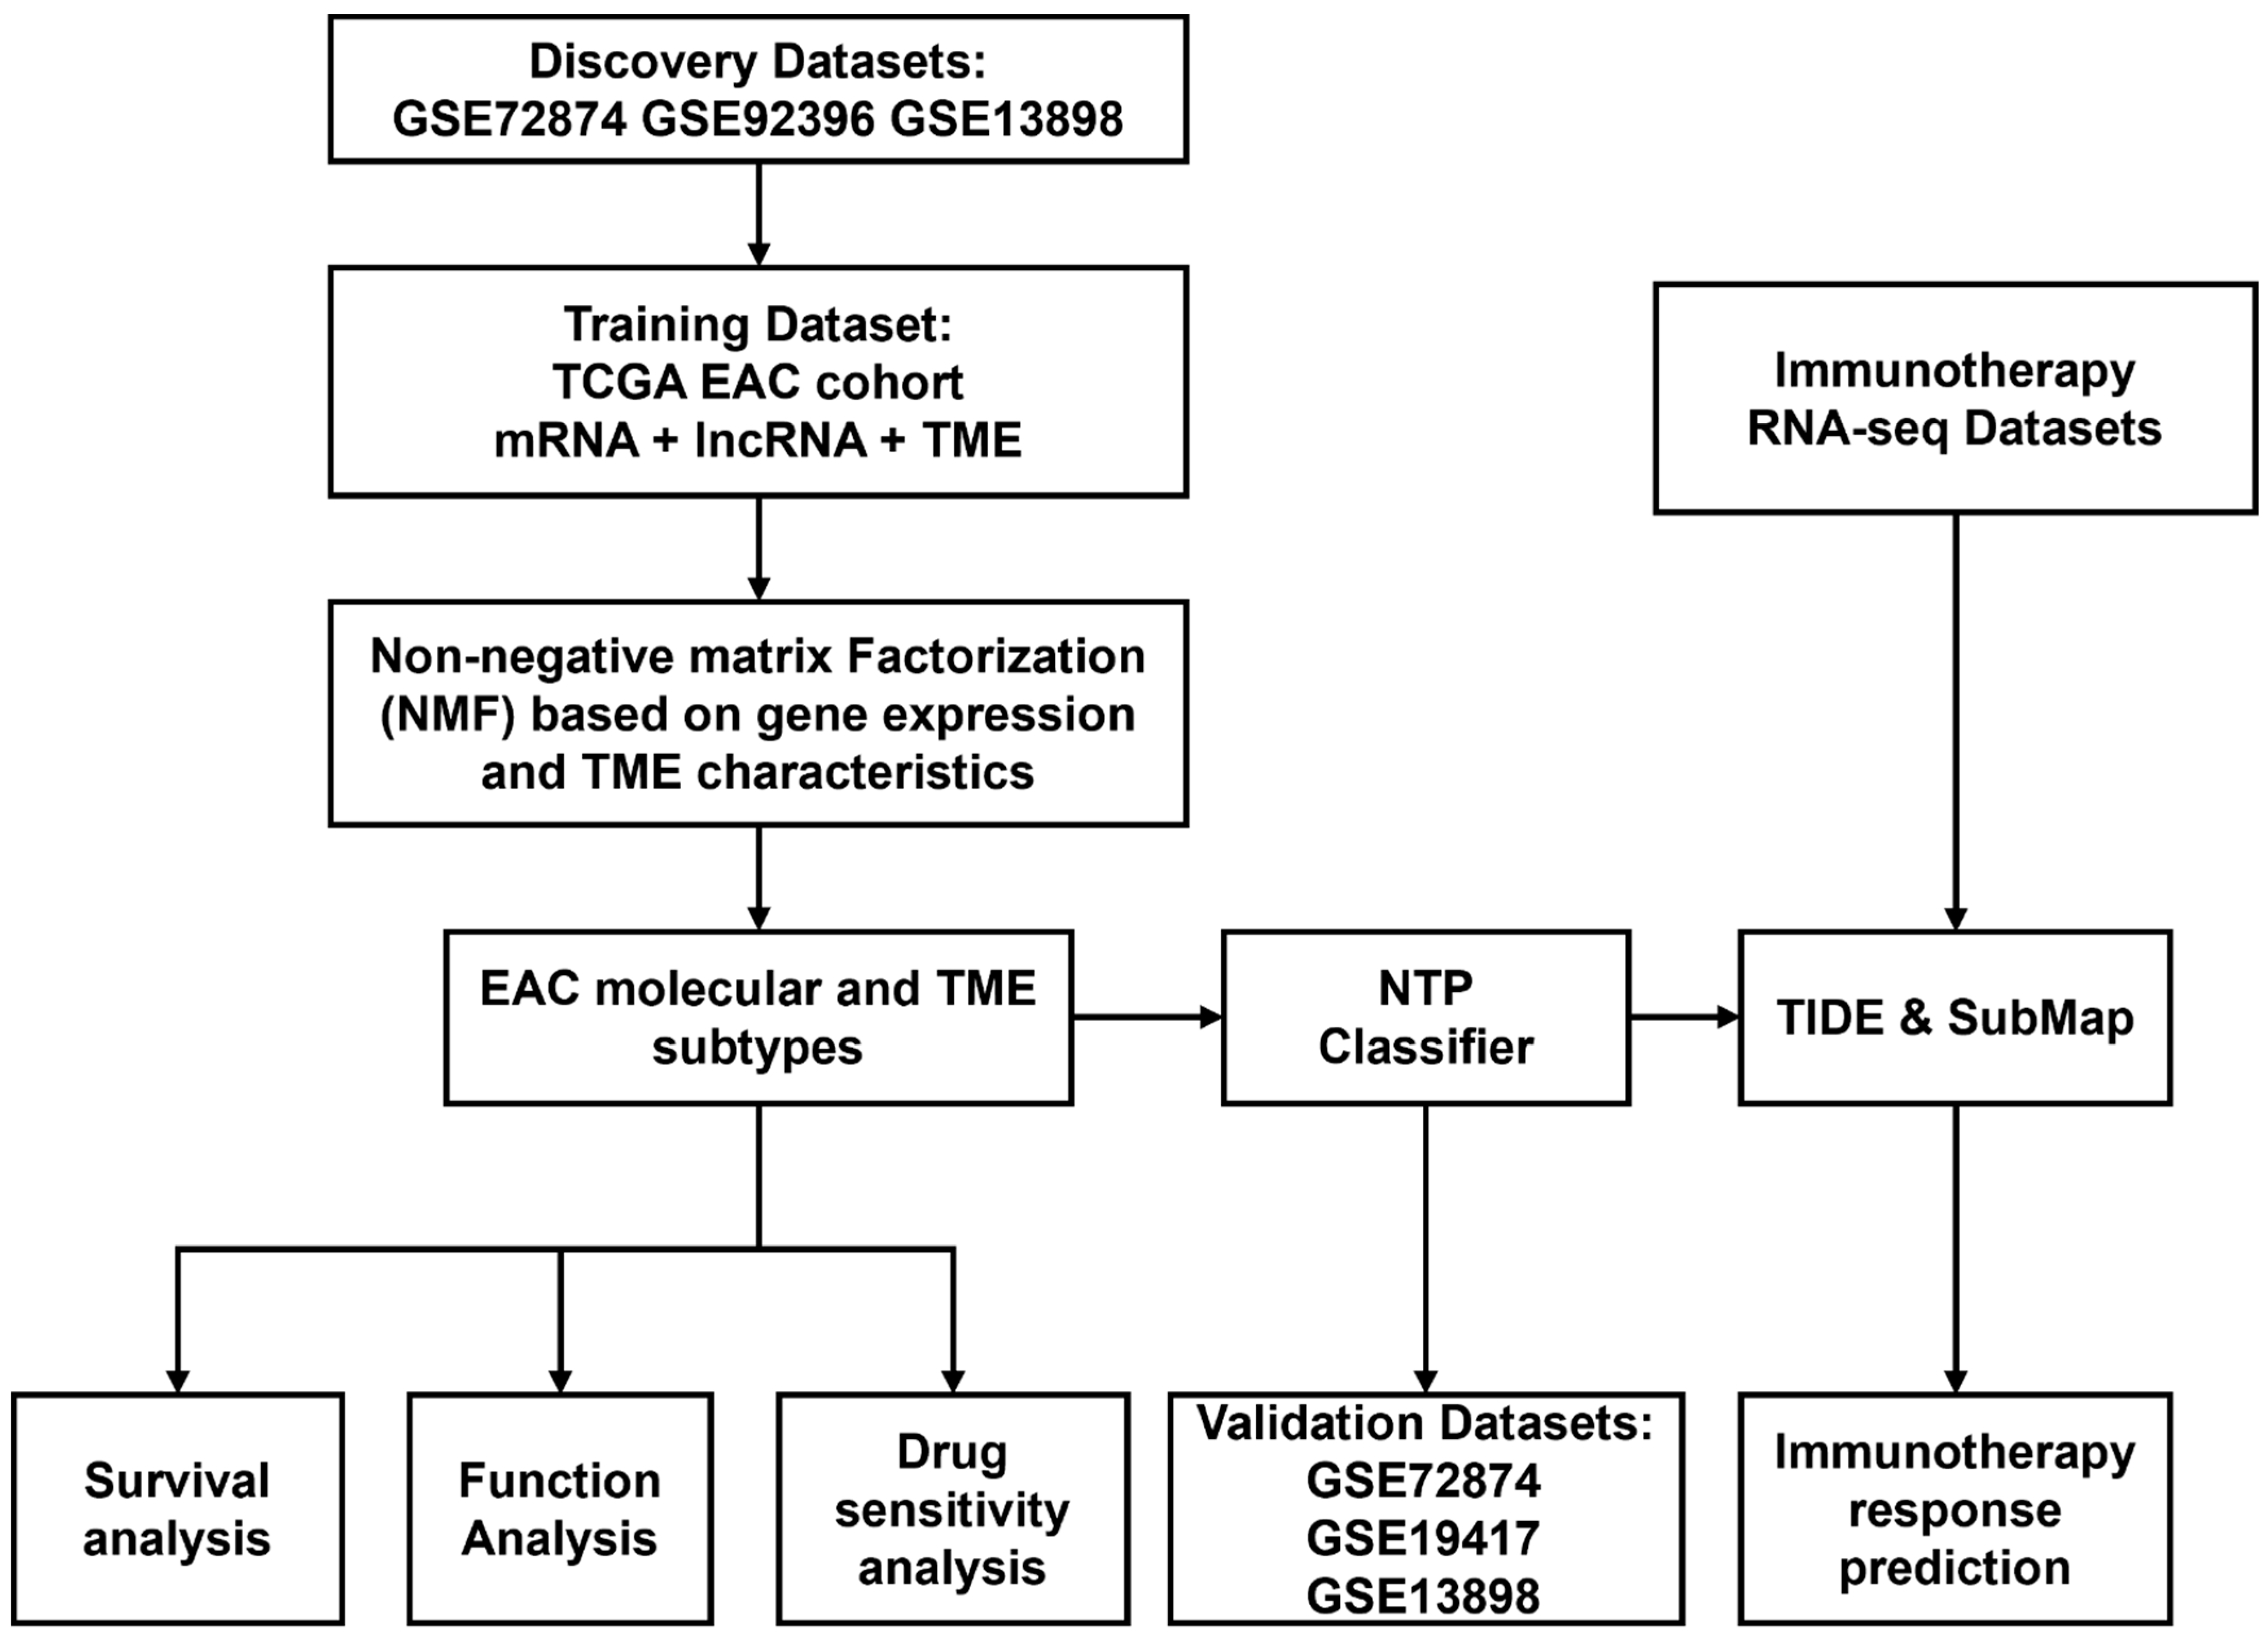
The study’s workflow is shown in Figure 1. Considering the limited size of the TCGA-EAC cohort, we combined a cohort of 189 samples from GSE72874, GSE92396, and GSE13898, including 54 peritumor esophageal samples and 135 esophageal adenocarcinoma samples after removing potential batch effects. In total, 276 protein-coding genes were identified as differentially expressed. They were further combined with DEGs in the TCGA-EAC cohort as candidate genes for identifying subtypes in the following clustering.
We applied eight algorithms to characterize the TME composition of EAC using the R package IOBR. Among them, CIBERSORT is the most widely used method for enumerating 22 immune cell types in TME. TIMER quantifies six tumor-infiltrating immune cell types. ESTEMATE dissects both stromal and immune signatures to determine tumor purity. The quanTIseq method enumerates 10 immune cell types from bulk RNA-seq data. IPS estimates 28 tumor-infiltrating lymphatic cell types, including effector and memory T cells and immunosuppressive cells. MCP-counter estimated eight immune and two stromal cell types. By default, xCell provides a comprehensive view of 64 immune and stromal cell types. By comparing the gene expression profiles of specific cells, EPIC decodes the proportions of immune and cancer cells. In all, 137 TME-related scores were used as candidate features for the following subtype clustering.
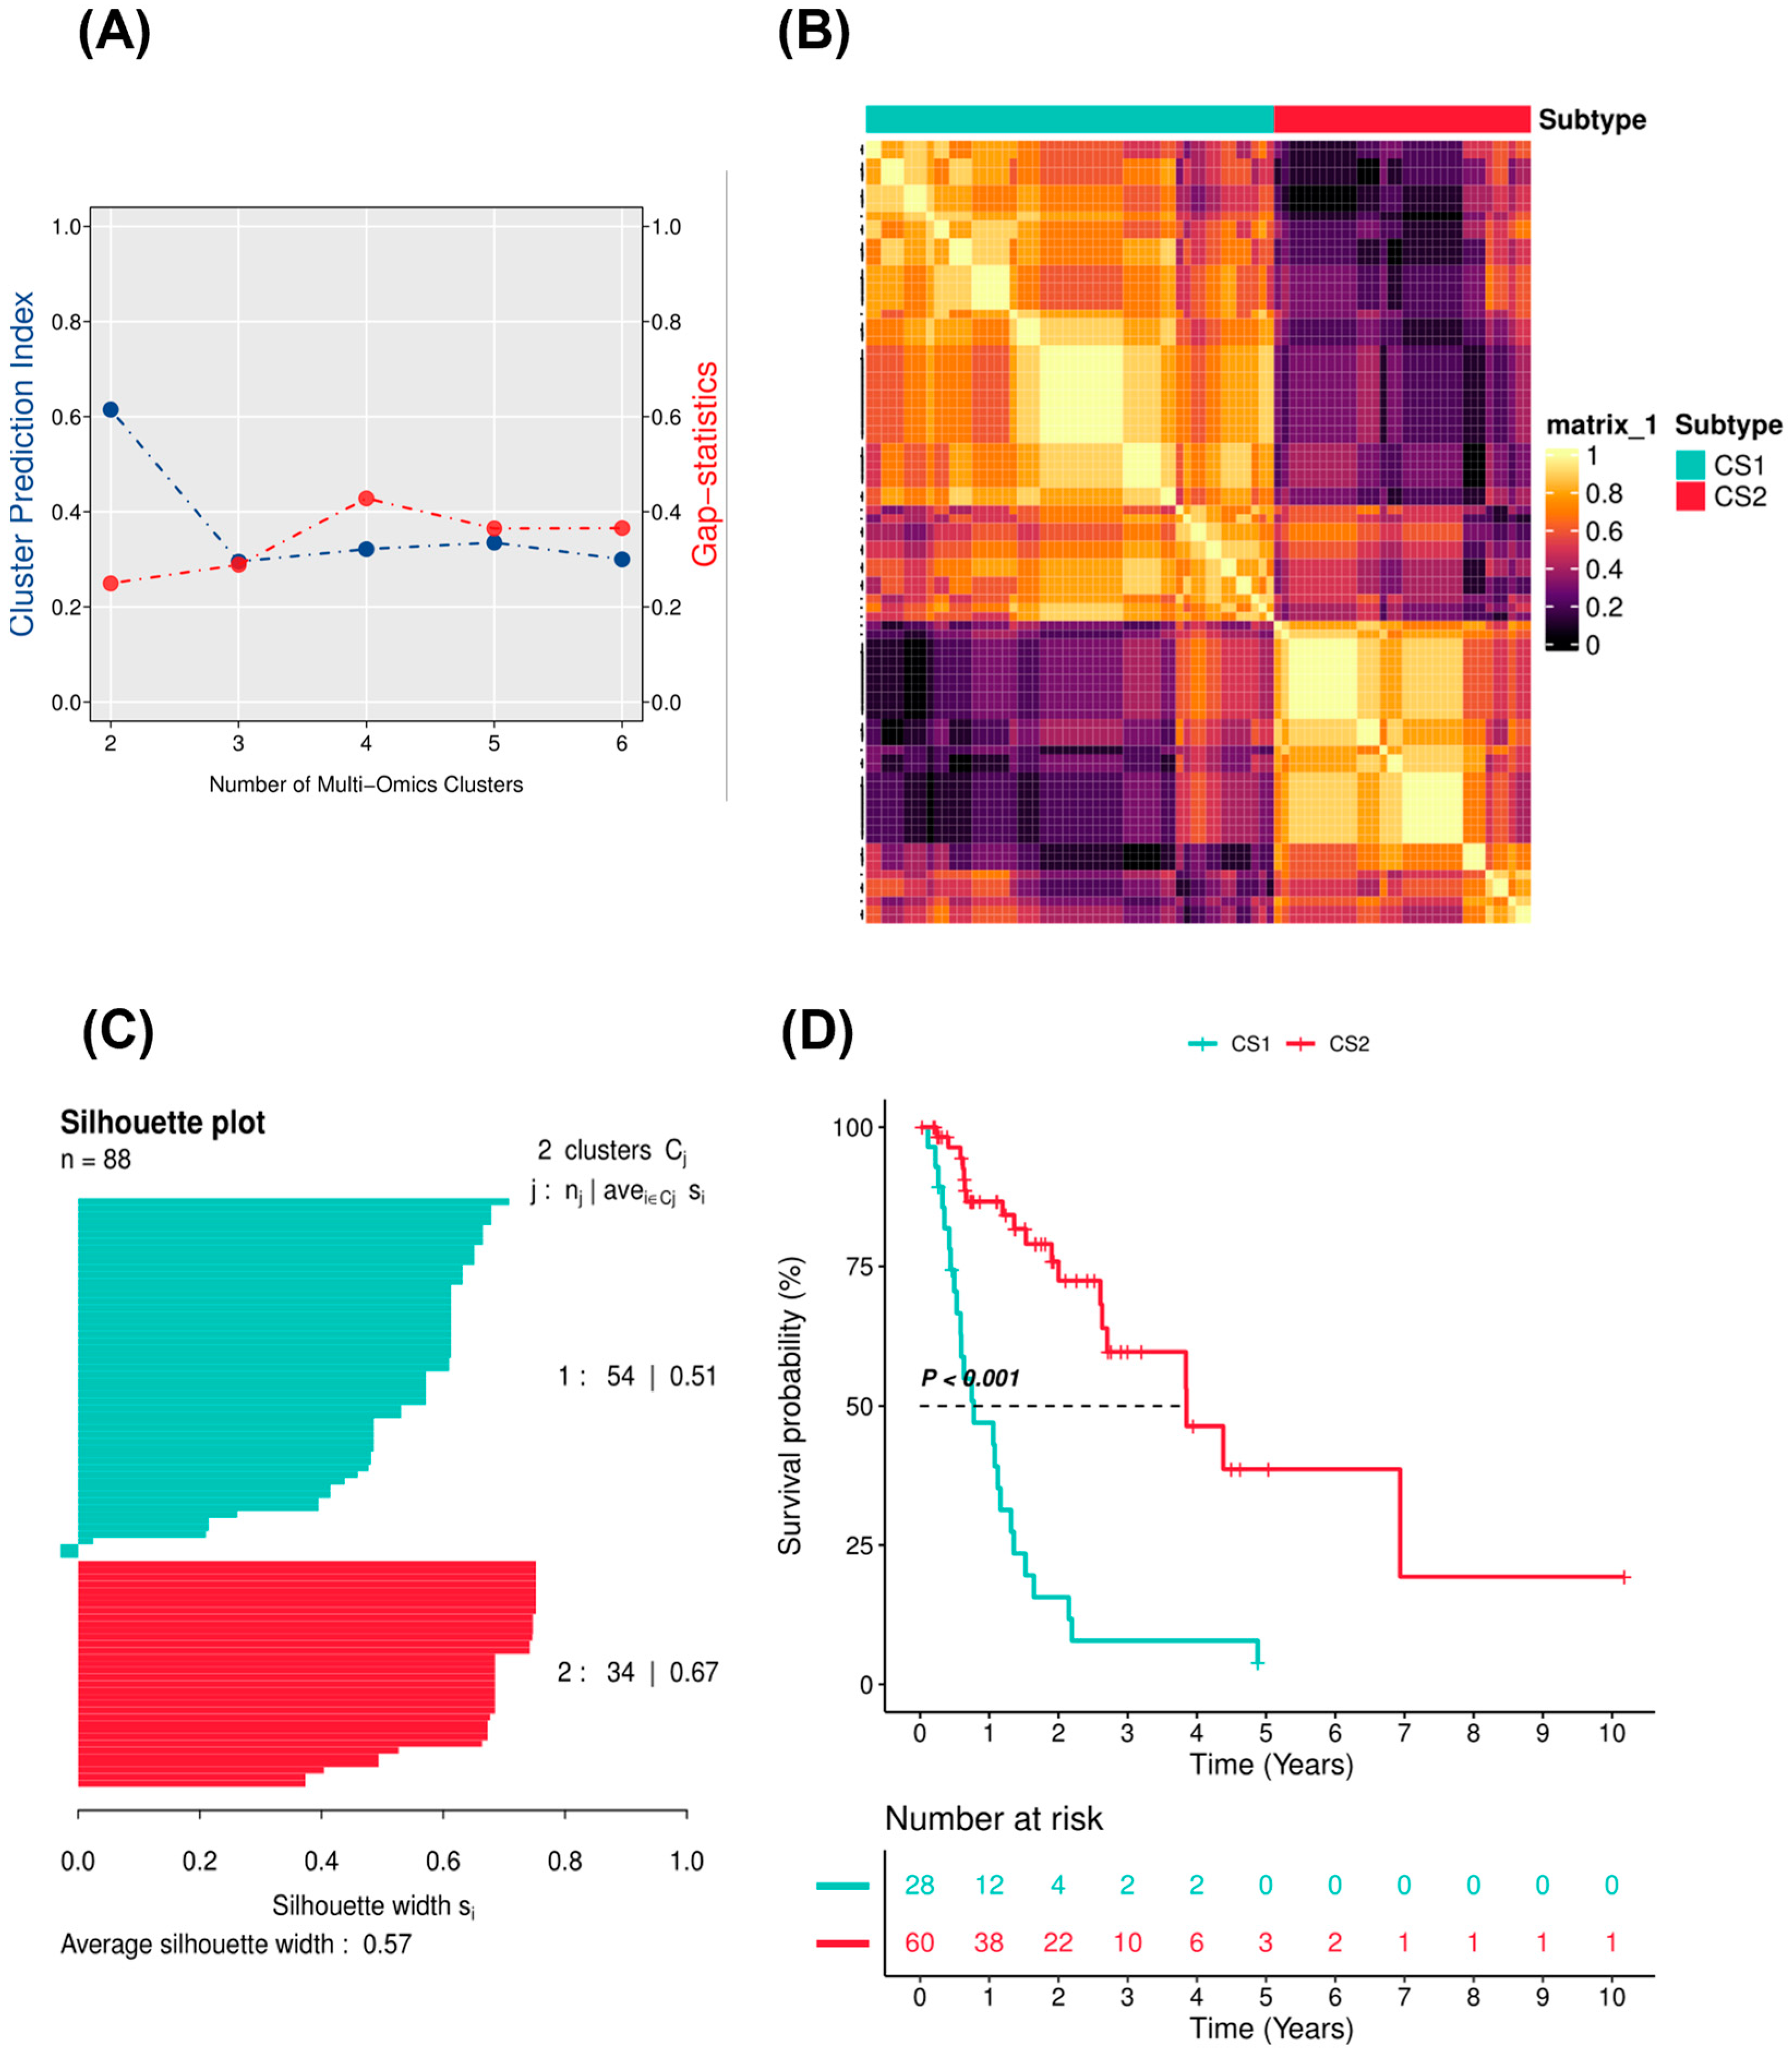
Further filtering procedures were performed on the TCGA EAC cohort before IntNMF clustering using the R package MOVICS. Genes with a significant prognostic value (p < 0.05 according to univariate cox regression) and TME scores with median absolute deviation (MAD) values greater than 0.5 were retained. MAD statistics provided a robust and effective tool with which to filter features for clustering and differential gene expression analysis, even with little information [32]. In the end, the expression profiles of 1537 protein-coding mRNA genes, 463 long non-coding RNA genes, and 30 TME scores were used to identify EAC subtypes. According to the clustering prediction index (Figure 2A), the optimal number of clusters (k) was 2. Gap statistics did not decline too much at a k of 2. Considering the relatively limited cohort size of the training cohort, a k of 2 was chosen as the optimal clustering number for further analyses. In addition, we calculated the consensus matrix by integration of the clustering results derived from another nine algorithms (including SNF, PINSPlus, NEMO, COCA, LRAcluster, ConsensusClustering, iClusterBayes, CIMLR, and MoCluster) to improve clustering robustness. The consensus matrix represented the probability of each sample belonging to the same subtype using different clustering methods. The diagonal rectangle illustrated in the consensus heatmap (Figure 2B) suggested the stability of the two subtypes. Silhouette values were also calculated for each sample to determine the extent of similarity within clusters compared to other clusters. The average silhouette width was 0.57 across all the 10 clustering algorithms, suggesting the robustness of the EAC subtypes (Figure 2C). Survival analysis showed that the prognostic difference between the two subtypes was significant (p < 0.001; Figure 2D). Stratified survival analyses based on the age and clinical stage subgroups indicated the prognostic value of the two EAC subtypes (Supplementary Figure S1).
2.2. Molecular and TME Characteristics of EAC Subtypes
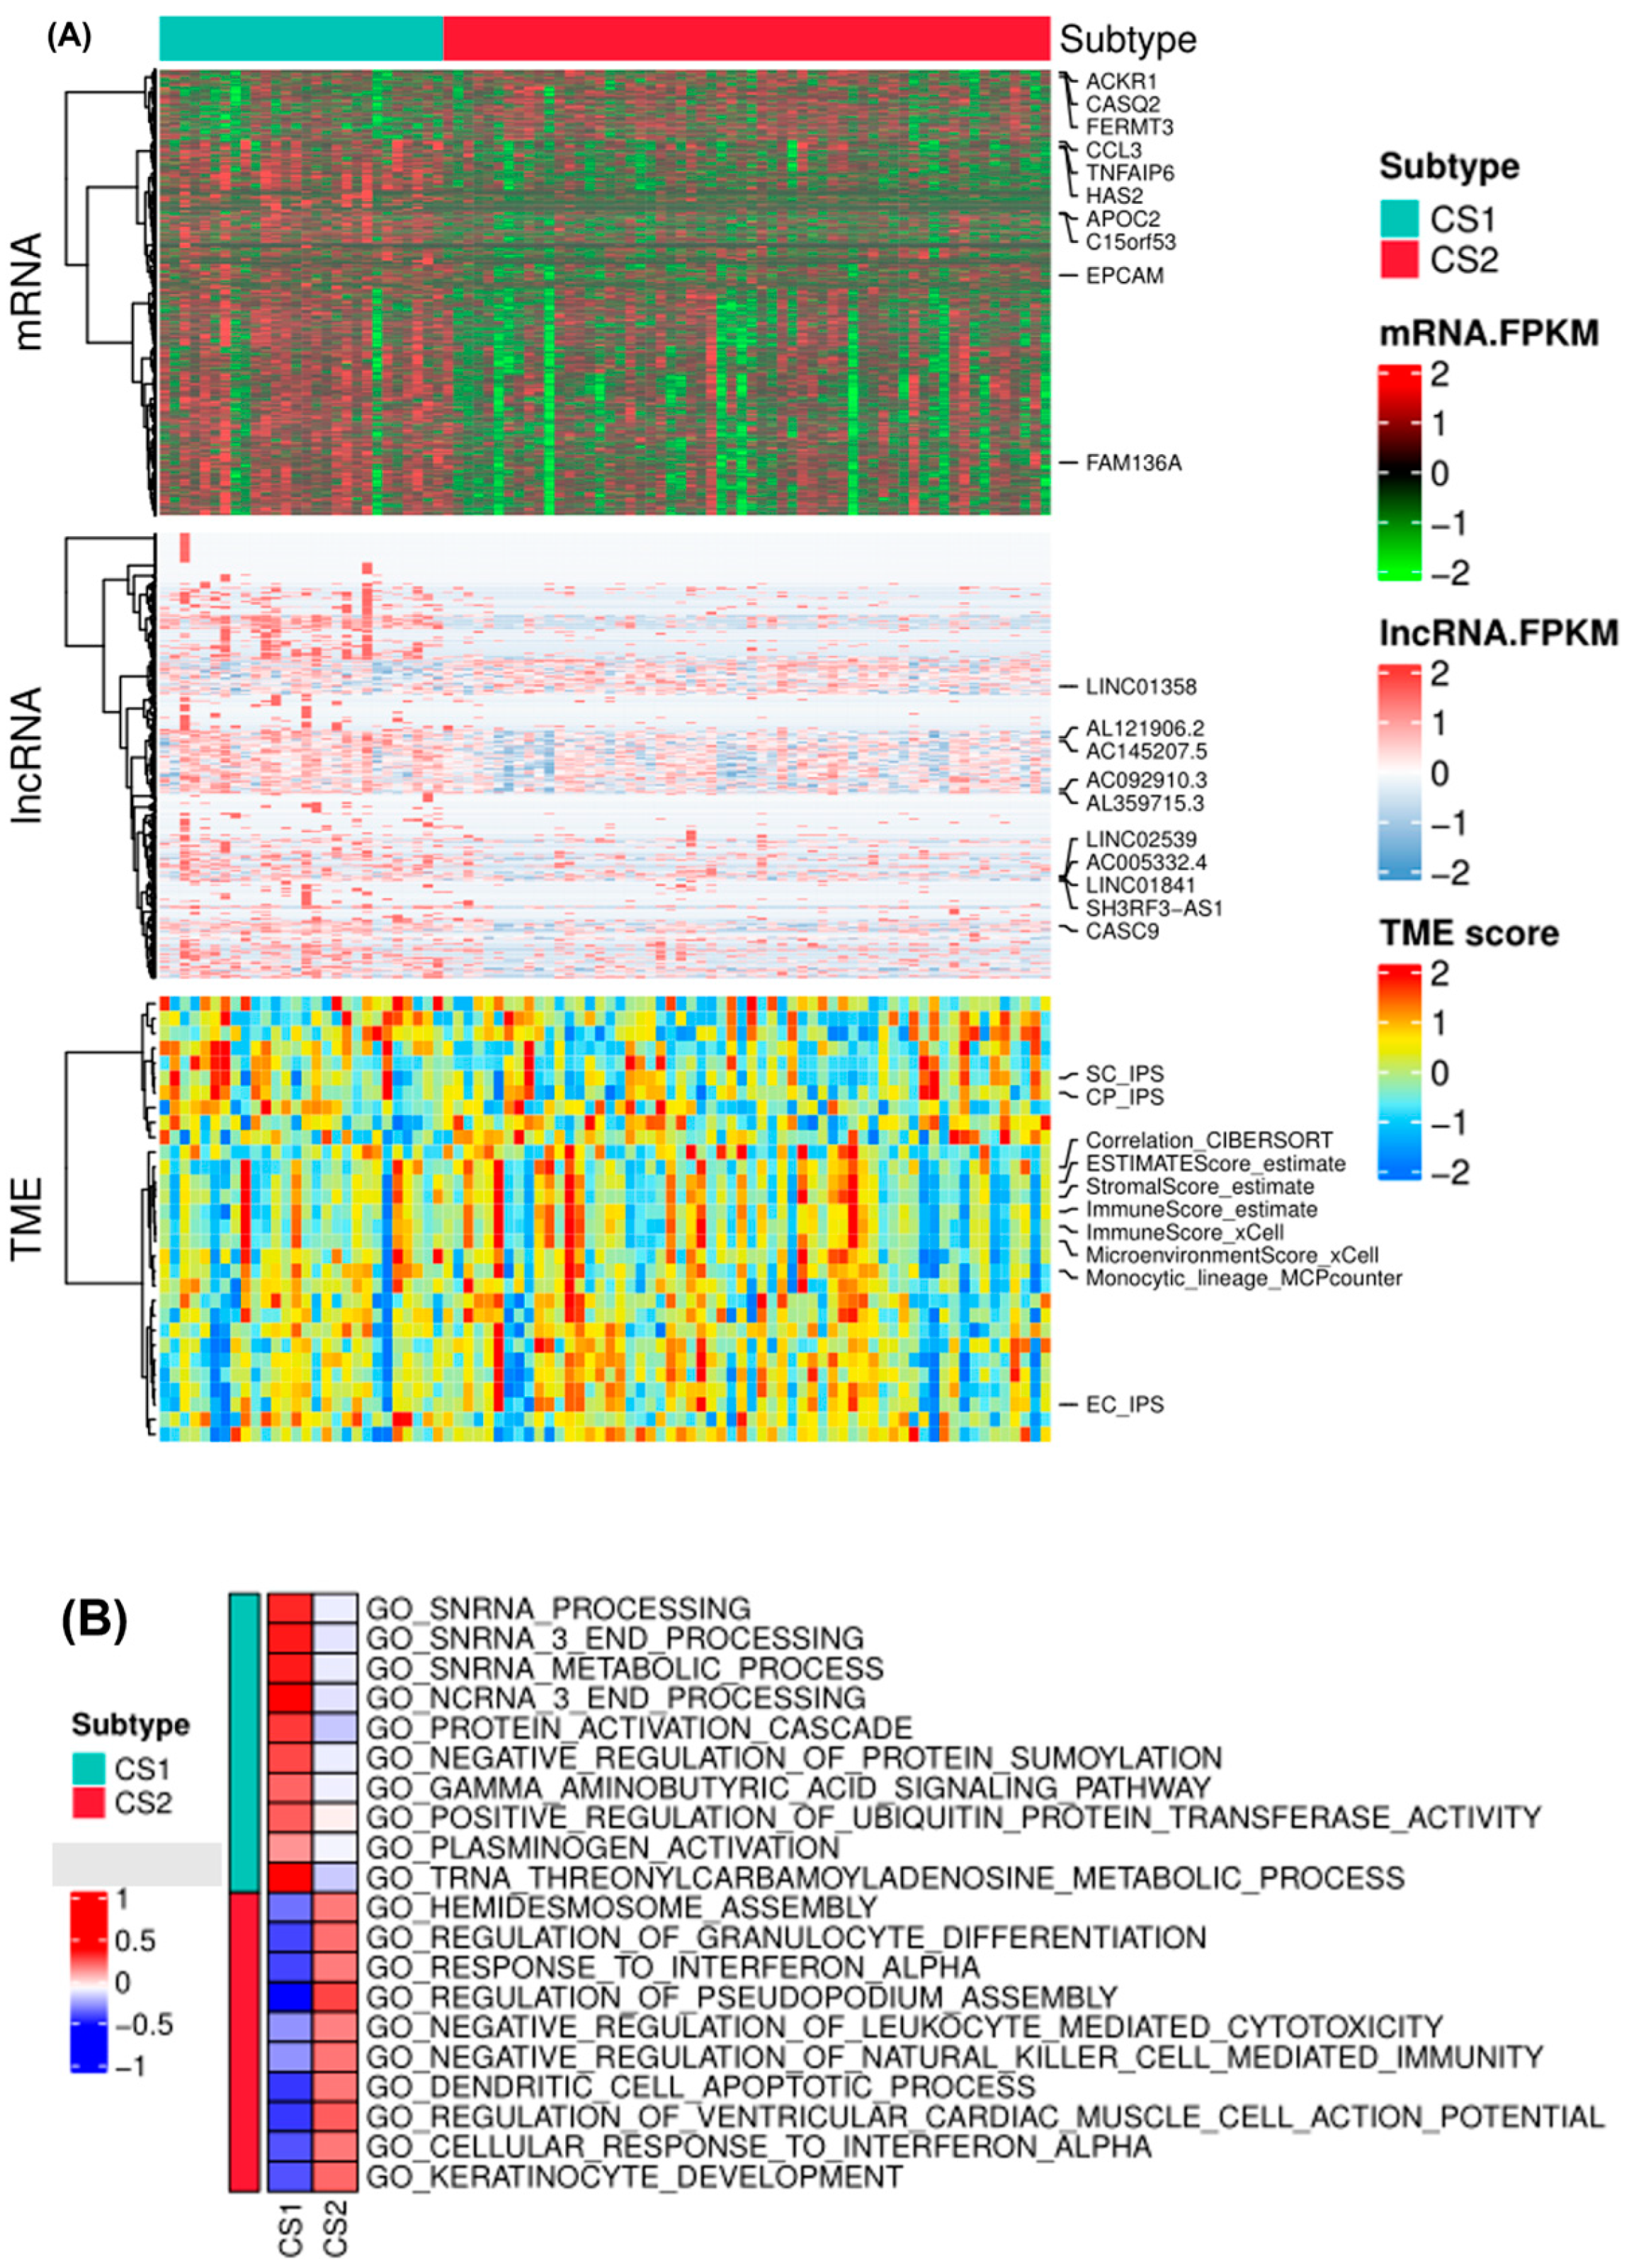
Subtype-specific mRNA, lncRNA, and TME scores were identified with a false discovery rate (FDR) of less than 0.01 and a log2 fold change greater than 1. A total of 938 and 97 features were identified in subtype 1 and subtype 2, respectively. Upregulated differentially expressed protein-coding mRNAs in subtype 2 included ACKR1, CASQ2, FERMT3, EPCAM, among others. DEGs such as CCL3, TNFAIP6, HAS2, and APOC2 were upregulated in EAC subtype 1. Differentially expressed lncRNAs, such as LINC01358, AL121906.2, AC092910.3, AC005332.4, and CASC9, were mostly upregulated in EAC subtype 1. TME scores showed mixed characteristics for the two subtypes. Both subtypes contained high levels of suppressor cells and checkpoint expression (SC_IPS and CP_IPS by immunophenoscores), and some samples showed high stromal scores and immune scores by ESTIMATE and xCell algorithms (Figure 3A).
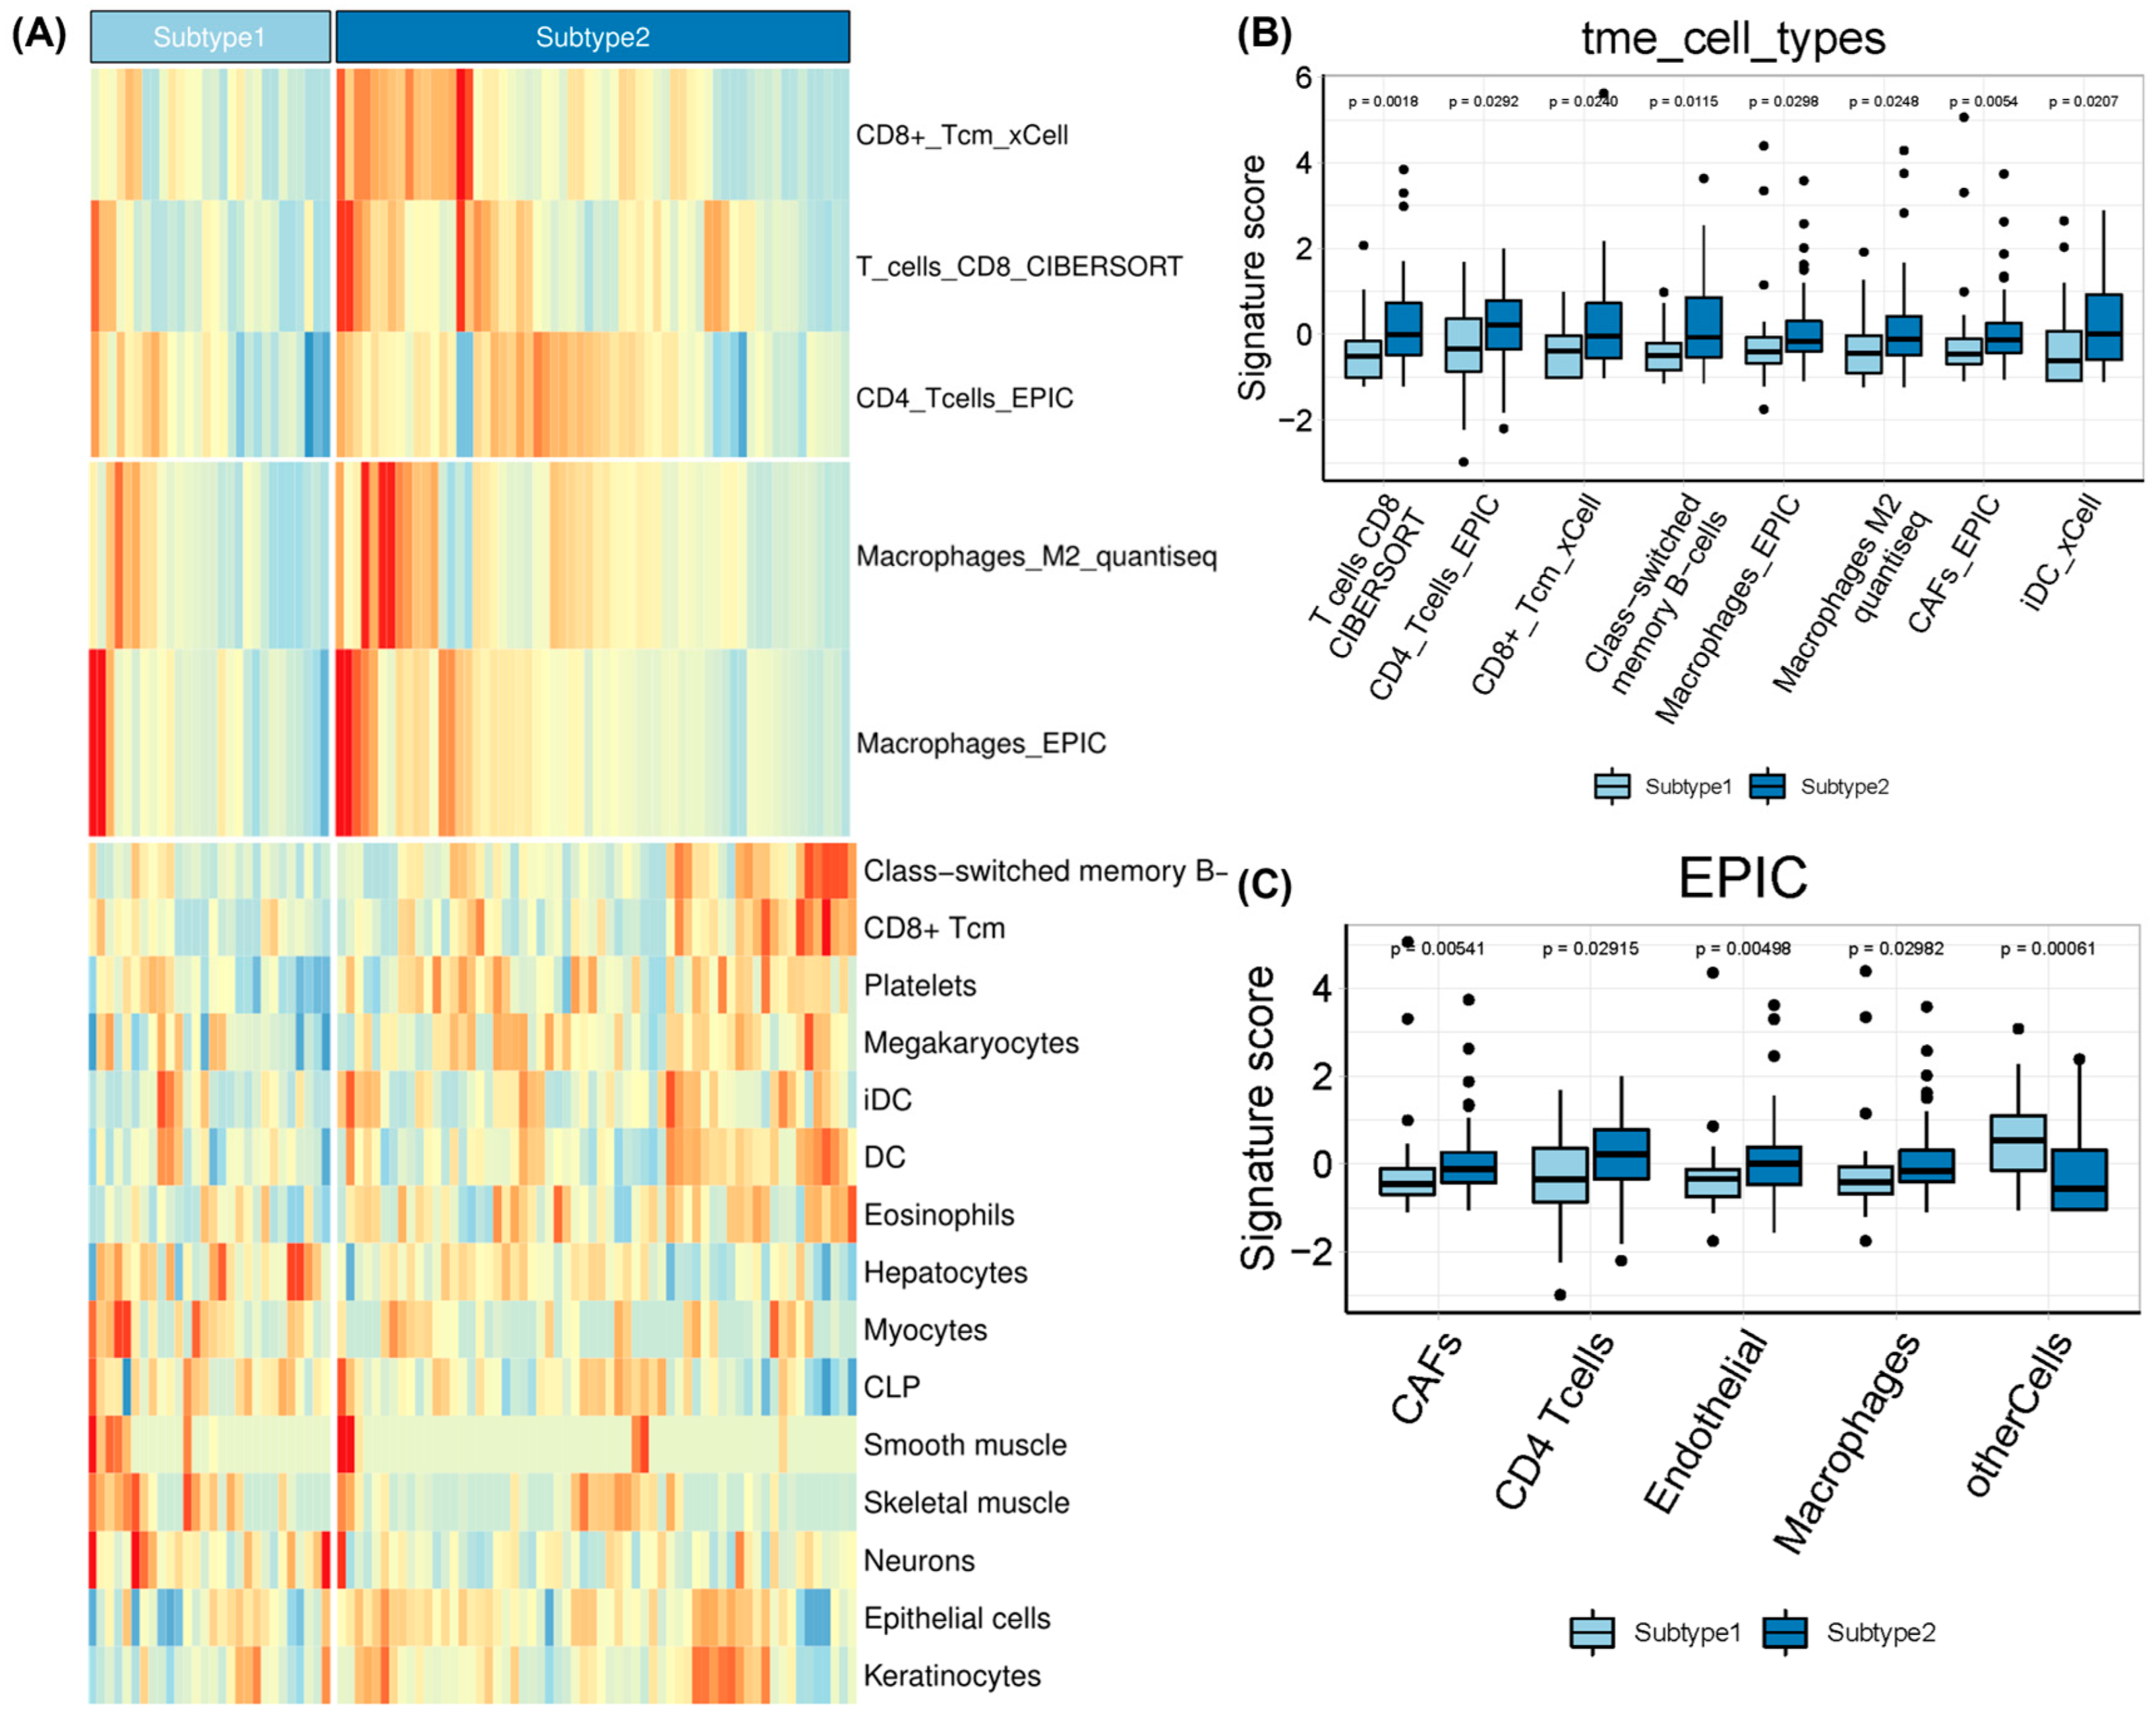
Subsequently, a GO enrichment analysis of biological processes was conducted based on DEGs for the subtypes (Figure 3B). EAC subtype 2 was significantly enriched in the ‘negative regulation of leukocyte mediated cytotoxicity’, ‘negative regulation of natural killing (NK) cell mediated immunity’, ‘hemidesmosome activity’, ‘gamma aminobutyric acid signaling pathway’, and ‘keratinocyte development’ pathways. Gene signatures of EAC subtypes were mainly enriched in immune, metabolic and T cell-related processes, but the enrichment scores showed the opposite according to the relative expression levels of the signature genes. We further calculated the enrichment score of each sample based on a list of genes of interest using gene set variation analysis (Figure 3C). By combining CIBERSORT, EPIC, and quanTIseq algorithms, we identified significantly different TME signatures between the two EAC subtypes and found that EAC subtype 2 had higher levels of CD4+ and CD8+ T cell infiltration as well as M2 macrophages and cancer-associated fibroblasts (Figure 4). Kaplan–Meier survival analyses also revealed prognostic significance for mast cells, eosinophils, megakaryocytes, Th2 cells, and B cells in the TCGA-EAC cohort (Supplementary Figure S2). EAC subtype 2 had significantly increased immune cell infiltration (T cell, B cell, and NK cell function) and antigen-processing activities, while subtype 1 had significantly decreased macrophage function and transporter functions. Collectively, the two EAC subtypes displayed distinct gene expression patterns and immune microenvironments.
2.3. Therapeutic Sensitivity of EAC Subtypes
Recently, studies have found that the ICIs nivolumab (CheckMate 577 and CheckMate 649) and pembrolizumab in combination with chemotherapy (KEYNOTE-590) have achieved revolutionary response rates in esophageal cancer [33]. We therefore applied the TIDE algorithm to predict the probability of response to ICI immunotherapy in EAC patients. TIDE is a computational framework developed to assess the potential of tumor immune escape from gene expression profiles by modeling T cell dysfunction and exclusion in tumors (Figure 5A). Prediction of non-response to ICI immunotherapy was based on a combination of TIDE and IFNG signatures. The results demonstrated that subtype 2 (30%, 18/60) contained more responders compared to subtype 1 (21.4%, 6/28), but the difference was not significant (Fisher’s exact test, p = 0.4). The TIDE prediction score can be interpreted as a z-score; a higher value indicates a higher potential of tumor immune evasion and a lower likelihood of benefitting from anti-PD-1/CTLA-4. High TIDE scores and worse ICI responses were positively correlated with cancer-associated fibroblast (CAF) signatures, M2 subtype TAM signatures, MDSC signatures, and T cell-inflamed signatures (Merck18) [34].
We further used the SubMap algorithm to compare the expression profiles of EAC subtypes with a published dataset containing 47 melanoma patients who responded to immunotherapies [35]. The results indicated that EAC subtype 2 was more likely to respond to anti-PD-1 therapy (Bonferroni-corrected p < 0.001) (Figure 5B).
Considering that chemotherapy and neoadjuvant chemoradiotherapy are the dominant treatment strategies for esophageal cancer, we also assessed the response of EAC subtypes to four commonly used chemo drugs—5-fluorouracil, cisplatin, paclitaxel, and sorafenib. In a previous study, the ridge regression model was trained on the GDSC cell line data and evaluated by 10-fold cross-validation [36]. We observed a significant difference in the estimated IC50 values between subtype 1 and subtype 2 for paclitaxel and sorafenib, whereas subtype 1 showed high sensitivity to commonly administered chemotherapies (p = 0.0013 for paclitaxel and p = 0.031 for sorafenib) (Figure 5C).
2.4. Classifier Construction and Validation
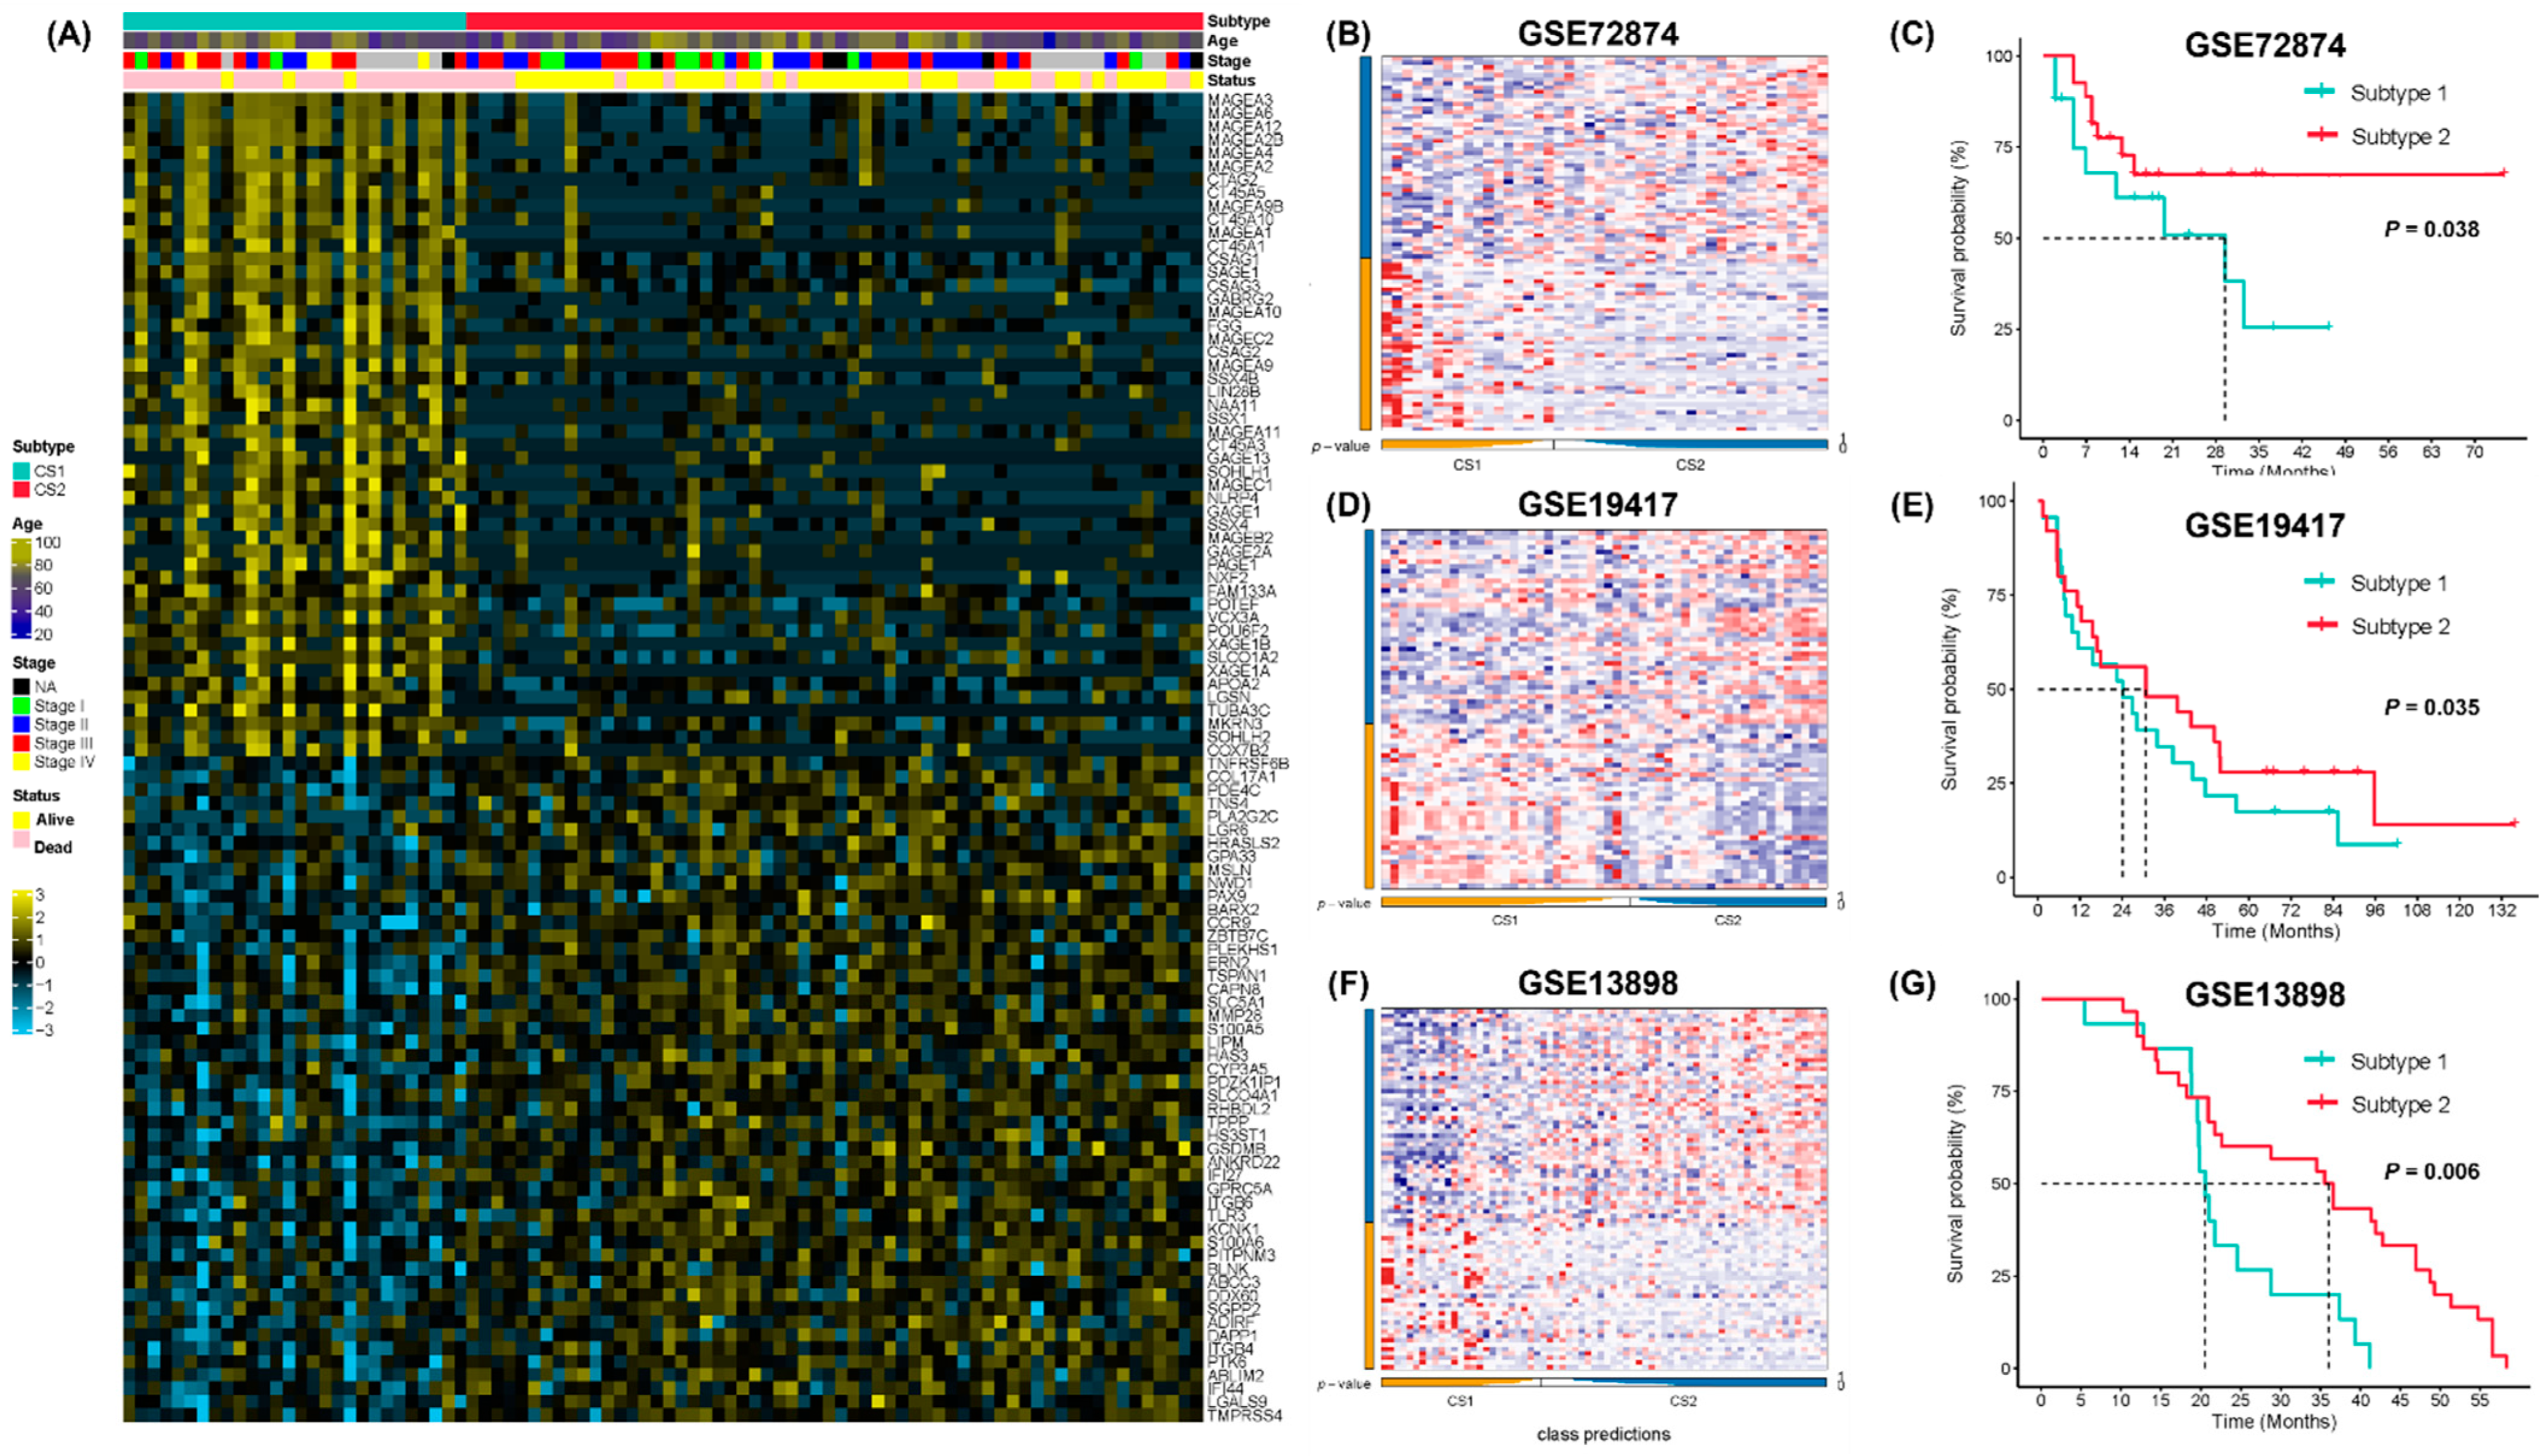
The external validation datasets GSE72874, GSE19417 and GSE13898 included 44, 48 and 45 EAC samples with overall survival information, respectively. Gene expression data and clinical information were then obtained from the GEO database to validate the prognostic value of the two EAC subtypes. The top 50 subtype-specific upregulated signature genes with the largest log2 fold-change values were selected. The NTP algorithm was then used to classify the validation datasets (Figure 6A). In GSE72874, 17 and 27 samples were identified as subtype 1 and subtype 2, respectively (Figure 6B). In GSE19417, 23 and 25 samples were identified as subtype 1 and subtype 2, respectively (Figure 6D). In GSE13898, 15 and 30 samples were identified as subtype 1 and subtype 2, respectively (Figure 6F). We compared the overall survival between the two subtypes in the GSE72874, GSE19417, and GSE13898 datasets and found that subtype 2 showed better survival consistently (log-rank test, p = 0.038, Figure 6C; p = 0.035, Figure 6E; p = 0.006, Figure 6G).
3. Discussion
Studies on the molecular subtyping of EAC have mainly been based on overall expression profiles and somatic mutation information [7,37,38]. The importance of TME in cancer is gaining greater recognition, especially in the context of cancer immunotherapy [39]. It remains necessary to characterize the heterogeneous TME of EAC and reveal its association with therapeutic responses in order to improve clinical treatments. This study, for the first time, identified response-related molecular and TME subtypes of EAC by integrating available public genomic and pharmaceutical data, thus providing new guidance for precise treatment of EAC.
The upregulated differentially expressed protein-coding genes in subtype 2 include atypical chemokine receptor (ACKR1) [40], which functions as a tumor suppressor in several cancers and plays an important role in transporting chemokines across cells to aid leukocyte transmigration [41]. Another upregulated gene, EPCAM, has also been identified as a marker for cancer stem cells [42]. DEGs upregulated in subtype 1 included chemokine CCL3 [43], which is frequently overexpressed in tumor sites, leading to microenvironmental dysfunction. In addition, overexpression of TNFAIP6 was also found to increase with tumor invasion and lymph node metastasis in gastric cancer [44]. Apolipoprotein C2 (APOC2) is a lipoprotein lipase activator involved in fatty acid metabolism [45]. Most differentially expressed lncRNAs, such as AL121906.2 [46], AC092910.3 [47], AC005332.4 [48], and CASC9 [49], were upregulated in EAC subtype 1 and had been previously reported as prognostic biomarkers in multiple tumors. These findings highlighted the intrinsic molecular differences between the two EAC subtypes. Further GO annotation indicated that the two subtypes showed distinct patterns of immunologic profiles.
Although the results of ICI therapy for esophageal cancer are promising, the proportion of patients who are responsive to ICIs is still low. In this study, we characterized EAC patients based on differentially expressed genes and TME signatures relevant to immunotherapy response. Using the unsupervised integrative NMF method, two EAC subtypes with distinct prognoses were identified. EAC subtype 2 showed enriched features of immune cells (CD8+/CD4+ T cells, B cells) and up-regulated immune-related signaling pathways. EAC subtype 2 also had higher levels of macrophages, fibroblast infiltration, and higher enrichment scores for antigen-presenting and metabolism-relevant signatures, suggesting that subtype 2 might be more sensitive to immunotherapy or immune checkpoint inhibition. Interestingly, the most upregulated genes in EAC subtype 1 were from the melanoma antigen gene (MAGE) family (Figure 6A), which have potential value as targets of immunotherapies, since these proteins are also cancer/testis antigens [50]. MAGEs have been reported to promote tumor growth via a variety of pathways, resulting in more aggressive, metastatic tumors with higher risk of recurrence [51]. Further studies on MAGE function may facilitate the development of immunotherapy in EAC [52].
Using a drug-sensitivity database and a drug-response model, we predicted that EAC subtype 1 could be more sensitive to commonly used chemotherapies. The results further implicate that subtype 1 may benefit from a combination of chemotherapy and immunotherapy. Although we did not find any significant differences in the response rate between the two subtypes according to the TIDE scores, the SubMap method suggested that EAC subtype 2 was more likely to respond to anti-PD-1 therapy, in line with the TME characteristics of this subtype.
Briefly, we sought here to provide a comprehensive understanding of the molecular and TME characteristics of EAC to facilitate precise classification and treatment selection. The molecular and TME differences between the EAC subtypes may guide clinical treatment selection. There are, however, some minor limitations to this study. It remains challenging to predict immunotherapy response unless EAC immunotherapy trial data are available. The small sample size also led to difficulties in precisely detecting differences in clinicopathological traits. Moreover, the subtype classifier proposed here requires further verification with clinical samples at the protein level.
4. Materials and Methods
4.1. Data Source and Processing
The publicly available esophageal adenocarcinoma cancer datasets (GSE72874, GSE92396, GSE13898, and GSE19417) were downloaded from the Gene Expression Omnibus database (GEO). These patients did not receive any treatment before surgery. All GEO datasets were log2-transformed, annotated, and quantile-normalized. The probe-level data were converted into gene symbols according to the corresponding annotation file. The maximum value was selected when multiple probes corresponded to the same gene symbol. The potential batch effects between different experiments were removed using the R package sva. Specifically, 54 peritumor esophageal and 135 esophageal adenocarcinoma samples from GSE72874, GSE92396, and GSE13898 were combined to identify differentially expressed genes in EAC.
The RNA-sequencing (RNA-seq) profiles and patient survival information from the pan-cancer data in the TCGA database were downloaded from UCSC-XENA (https://xenabrowser.net/, Accessed on 20 October 2021). Finally, 88 samples diagnosed as “Esophagus Adenocarcinoma” in the TCGA-ESCA cohort were included as a training cohort to filter prognostic related protein-coding and long non-coding RNAs for molecular subtyping. GSE13898, GSE72874, and GSE19417 were retrieved to check the clinical relevance of the identified molecular subtypes. A flow chart to illustrate the study design was shown in Figure 1.
4.2. Selection of Differentially Expressed Genes with Prognostic Value
Based on the discovery GEO cohort of EAC patients, differentially expressed genes (DEGs), including protein-coding and long non-coding RNAs, in 135 esophageal adenocarcinoma and 54 normal esophageal samples were identified using the R package limma (p-value < 0.05, |log2FC| > 2). Since the discovery cohort lacked survival information, 276 DEGs were further screened after overlapping with DEGs identified in the TCGA-EAC tumor samples (n = 88) using univariable Cox proportional hazards regression (p < 0.05). We selected overall survival (OS) as the survival endpoint.
4.3. Estimation of Immune Infiltration
To avoid potential bias and pitfalls of different TME cell deconvolution algorithms [53], we applied 8 deconvolution methods incorporated in the R package IOBR [54] to characterize the TME composition of EAC, including CIBERSORT [55], xCell [56], TIMER [57], MCPCounter [58], EPIC [59], ESTIMATE [60], quanTIseq [61], and immunopheno score (IPS) [62]. The deconvolution results obtained using the above methods were calculated for the TCGA-EAC training cohort as well as the validation datasets GSE72784 and GSE19417. TME scores were used in the following clustering procedure together with gene expression scores to identify EAC subtypes.
4.4. Identification and Validation of EAC Subtypes
Before performing NMF, candidate DEGs and TME scores with absolute median difference (MAD) values less than 0.5 were excluded. We then used selected features to classify EAC samples using an integrative non-negative matrix factorization (NMF) method (IntNMF) [63]. We chose IntNMF since it outperformed other algorithms in a benchmark study on multi-omics data integration [64]. Specifically, the NMF algorithm factorized the gene expression matrix A of N genes and M samples into 2 non-negative matrices, W and H (i.e., ), where the sizes of W and H are N × k and k × M, respectively. The outputs of matrix A were then integrated into k clusters through iterative decomposition. IntNMF considered shared factors across all ‘omics’ datasets (i.e., gene expression and TME scores in this study). IntNMF extended NMF by integrating the multiple data matrix Ai and estimating the common basis matrix W and coefficient matrices Hi such that , where W and Hi are all non-negative The clustering prediction index and gap statistics were used to determine the optimal number of clusters (k). We also applied the other 9 clustering algorithms and calculated a consensus matrix to verify clustering robustness. Silhouette scores were calculated to quantify and visualize similarity among clusters using the R package MOVICS [65]. The top 50 specifically expressed signature genes in each EAC subtype were identified based on differential expression analyses against the other subtype using the R package DESeq2 (Benjamini–Hochberg-adjusted p-value < 0.05, |log2FC| > 2). Nearest template prediction (NTP) classifiers were trained using the TCGA EAC cohort for class predictions for each sample using the top 50 signature genes [66].
4.5. Molecular and TME Characterization between EAC Subtypes
Gene set enrichment analyses (GSEAs) were performed with Gene Ontology (GO) biological process annotation using the R package clusterProfiler. The enrichment scores of molecular pathways were evaluated using single-sample gene set enrichment analysis using the R package GSVA [67].
4.6. Therapeutic Response Prediction
The Tumor Immune Dysfunction and Exclusion (TIDE) algorithm and subclass mapping (SubMap) were used to predict responses to immune checkpoint blockade [68,69]. TIDE scores were calculated for each sample, a score > 0 indicating a lower likelihood of responding to ICIs. Meanwhile, the SubMap algorithm of GenePattern (https://cloud.genepattern.org/, Accessed on 21 December 2021) was applied to predict response to immunotherapy in the identified EAC subtypes (nominal p < 0.05 or Bonferroni correction < 0.05). The immunotherapy response data were log2-transformed NanoString-normalized gene expression data for 47 melanoma patients treated with CTLA-4 and PD-1 checkpoint blockade [35].
We used a ridge regression model in the R package pRRophetic [36] to predict chemotherapeutic responses for the TCGA-EAC cohort and examined differences in drug sensitivity (half-maximal inhibitory concentration (IC50)) among different subtypes. The lower the IC50 value of the drug, the greater the drug’s potency in inhibiting cell growth. This predictive model was trained on mRNA gene expression and drug response data of CCLs in the Genomics of Drug Sensitivity in Cancer (GDSC) and was previously evaluated by 10-fold cross-validation.
4.7. Statistical Analysis
Statistical analyses and visualizations were performed using R (version 4.0.1, R Core Team, Vienna, Austria). We used the R package survminer and survival to perform a univariate Cox regression analysis. A survival analysis was carried out using Kaplan–Meier methods with log-rank tests to determine statistical differences. For all statistical analyses, Fisher’s exact test was used for categorical data, the Mann–Whitney test was used for continuous data, and a two-tailed p-value less than 0.05 was considered statistically significant.
5. Conclusions
Overall, we identified two molecular subtypes of EAC and constructed a classification system that might aid in predicting the prognosis and therapy response of patients, especially those more likely to respond to immunotherapy. We also suggest MAGE family genes as potential targets for those patients who are unlikely to benefit from current immune checkpoint blockade therapy.
Supplementary Materials
The following supporting information can be downloaded at: https://0-www-mdpi-com.brum.beds.ac.uk/article/10.3390/ph15050605/s1, Figure S1: Subgroup analyses revealed by Kaplan-Meier survival curve; Figure S2: Kaplan-Meier survival curve of TME scores in the TCGA-EAC cohort.
Author Contributions
Y.G. and X.S. designed and supervised the study. Y.G., X.S. and C.L. created the study methodology. C.L., X.Z. and X.S. collected the data and conducted all the analyses. X.S. and Y.G. wrote the manuscript and obtained funding. All authors have read and agreed to the published version of the manuscript.
Funding
National Natural Science Foundation of China (nos. 81901687, U20A20369), Science, Technology and Innovation Commission of Shenzhen Municipality (JCYJ20190807154819245), and the Key Incubation Fund of SYSU (19ykzd29).
Institutional Review Board Statement
Not applicable.
Informed Consent Statement
Not applicable.
Data Availability Statement
All datasets utilized in this study are publicly available and were accessed from several repositories. The bulk microarray gene expression and subject data are available in the Gene Expression Omnibus (GEO). The bulk RNA-seq gene expression and subject data from the TCGA ESCA project are available through the Genomic Data Commons: https://gdc.cancer.gov/access-data/, accessed on 30 October 2021.
Conflicts of Interest
The authors declare no conflict of interest.
Abbreviations
| EAC | Esophageal adenocarcinoma |
| ESCC | Esophageal squamous cell carcinoma |
| CCL | Cancer cell lines |
| TCGA | The Cancer Genome Atlas |
| GEO | Gene Expression Omnibus dataset |
| DEG | Differentially expressed gene |
| GDSC | Genomics of Drug Sensitivity in Cancer |
| TIDE | Tumor Immune Dysfunction and Exclusion |
References
- Collaboration GBoDC. Global, Regional, and National Cancer Incidence, Mortality, Years of Life Lost, Years Lived With Disability, and Disability-Adjusted Life-Years for 29 Cancer Groups, 1990 to 2017: A Systematic Analysis for the Global Burden of Disease Study. JAMA Oncol. 2019, 5, 1749–1768. [Google Scholar] [CrossRef] [Green Version]
- Huang, F.-L.; Yu, S.-J. Esophageal cancer: Risk factors, genetic association, and treatment. Asian J. Surg. 2018, 41, 210–215. [Google Scholar] [CrossRef]
- Offman, J.; Pesola, F.; Sasieni, P. Trends and projections in adenocarcinoma and squamous cell carcinoma of the oesophagus in England from 1971 to 2037. Br. J. Cancer 2018, 118, 1391–1398. [Google Scholar] [CrossRef]
- Eyck, B.M.; van Lanschot, J.J.B.; Hulshof, M.C.C.M.; van der Wilk, B.J.; Shapiro, J.; van Hagen, P.; Henegouwen, M.I.V.B.; Wijnhoven, B.P.L.; van Laarhoven, H.W.M.; Nieuwenhuijzen, G.A.P.; et al. Ten-Year Outcome of Neoadjuvant Chemoradiotherapy Plus Surgery for Esophageal Cancer: The Randomized Controlled CROSS Trial. J. Clin. Oncol. 2021, 39, 1995–2004. [Google Scholar] [CrossRef]
- Bang, Y.-J.; Van Cutsem, E.; Fuchs, C.S.; Ohtsu, A.; Tabernero, J.; Ilson, D.H.; Hyung, W.J.; Strong, V.E.; Goetze, T.O.; Yoshikawa, T.; et al. KEYNOTE-585: Phase III study of perioperative chemotherapy with or without pembrolizumab for gastric cancer. Futur. Oncol. 2019, 15, 943–952. [Google Scholar] [CrossRef]
- Luo, Y.; Mao, Q.; Wang, X.; Yu, J.; Li, M. Radiotherapy for esophageal carcinoma: Dose, response and survival. Cancer Manag. Res. 2017, 10, 13–21. [Google Scholar] [CrossRef] [Green Version]
- Yang, Y.-M.; Hong, P.; Xu, W.W.; He, Q.-Y.; Li, B. Advances in targeted therapy for esophageal cancer. Signal Transduct. Target. Ther. 2020, 5, 229. [Google Scholar] [CrossRef]
- Schneider, B.J.; Shah, M.A.; Klute, K.; Ocean, A.; Popa, E.; Altorki, N.; Lieberman, M.; Schreiner, A.; Yantiss, R.; Christos, P.J.; et al. Phase I Study of Epigenetic Priming with Azacitidine Prior to Standard Neoadjuvant Chemotherapy for Patients with Resectable Gastric and Esophageal Adenocarcinoma: Evidence of Tumor Hypomethylation as an Indicator of Major Histopathologic Response. Clin. Cancer Res. 2016, 23, 2673–2680. [Google Scholar] [CrossRef] [Green Version]
- Kim, J.; Bowlby, R.; Mungall, A.J.; Robertson, A.G.; Odze, R.D.; Cherniack, A.D. Integrated genomic characterization of oesophageal carcinoma. Nature 2017, 541, 169–175. [Google Scholar]
- Waddell, T.; Chau, I.; Cunningham, D.; Gonzalez, D.; Okines, A.F.C.; Wotherspoon, A.; Saffery, C.; Middleton, G.; Wadsley, J.; Ferry, D.; et al. Epirubicin, oxaliplatin, and capecitabine with or without panitumumab for patients with previously untreated advanced oesophagogastric cancer (REAL3): A randomised, open-label phase 3 trial. Lancet Oncol. 2013, 14, 481–489. [Google Scholar] [CrossRef] [Green Version]
- Chong, C.R.; Jänne, P.A. The quest to overcome resistance to EGFR-targeted therapies in cancer. Nat. Med. 2013, 19, 1389–1400. [Google Scholar] [CrossRef] [Green Version]
- Hassan, S.; Awasthi, N.; Li, J.; Williams, F.; Schwarz, M.A.; Schwarz, R.E.; von Holzen, U. Superior Therapeutic Efficacy of Nanoparticle Albumin Bound Paclitaxel Over Cremophor-Bound Paclitaxel in Experimental Esophageal Adenocarcinoma. Transl. Oncol. 2018, 11, 426–435. [Google Scholar] [CrossRef]
- Zhan, W.; Li, H.; Guo, Y.; Du, G.; Wu, Y.; Zhang, D. Construction of Biocompatible Dual-Drug Loaded Complicated Nanoparticles for in vivo Improvement of Synergistic Chemotherapy in Esophageal Cancer. Front. Oncol. 2020, 10, 662. [Google Scholar] [CrossRef]
- Fu, Q.; Wang, J.; Liu, H. Chemo-immune synergetic therapy of esophageal carcinoma: Trastuzumab modified, cisplatin and fluorouracil co-delivered lipid–polymer hybrid nanoparticles. Drug Deliv. 2020, 27, 1535–1543. [Google Scholar] [CrossRef]
- Contino, G.; Vaughan, T.L.; Whiteman, D.; Fitzgerald, R.C. The Evolving Genomic Landscape of Barrett’s Esophagus and Esophageal Adenocarcinoma. Gastroenterology 2017, 153, 657–673. [Google Scholar] [CrossRef]
- Pardoll, D.M. The blockade of immune checkpoints in cancer immunotherapy. Nat. Rev. Cancer 2012, 12, 252–264. [Google Scholar] [CrossRef] [Green Version]
- Kelly, R.J. The emerging role of immunotherapy for esophageal cancer. Curr. Opin. Gastroenterol. 2019, 35, 337–343. [Google Scholar] [CrossRef]
- Doi, T.; Piha-Paul, S.A.; Jalal, S.I.; Saraf, S.; Lunceford, J.; Koshiji, M.; Bennouna, J. Safety and Antitumor Activity of the Anti–Programmed Death-1 Antibody Pembrolizumab in Patients With Advanced Esophageal Carcinoma. J. Clin. Oncol. 2018, 36, 61–67. [Google Scholar] [CrossRef]
- Shah, M.A.; Kojima, T.; Hochhauser, D.; Enzinger, P.; Raimbourg, J.; Hollebecque, A.; Kato, K. Efficacy and Safety of Pembrolizumab for Heavily Pretreated Patients with Advanced, Metastatic Adenocarcinoma or Squamous Cell Carcinoma of the Esophagus: The Phase 2 KEYNOTE-180 Study. JAMA Oncol. 2019, 5, 546–550. [Google Scholar] [CrossRef] [Green Version]
- Kojima, T.; Muro, K.; Francois, E.; Hsu, C.-H.; Moriwaki, T.; Kim, S.-B.; Lee, S.-H.; Bennouna, J.; Kato, K.; Lin, S.; et al. Pembrolizumab versus chemotherapy as second-line therapy for advanced esophageal cancer: Phase III KEYNOTE-181 study. J. Clin. Oncol. 2019, 37 (Suppl. S4), 2. [Google Scholar] [CrossRef]
- Fuchs, C.S.; Doi, T.; Jang, R.W.; Muro, K.; Satoh, T.; Machado, M.; Yoon, H.H. Safety and Efficacy of Pembrolizumab Monotherapy in Patients With Previously Treated Advanced Gastric and Gastroesophageal Junction Cancer: Phase 2 Clinical KEYNOTE-059 Trial. JAMA Oncol. 2018, 4, e180013. [Google Scholar] [CrossRef]
- Samstein, R.M.; Lee, C.-H.; Shoushtari, A.N.; Hellmann, M.D.; Shen, R.; Janjigian, Y.Y.; Barron, D.A.; Zehir, A.; Jordan, E.J.; Omuro, A.; et al. Tumor mutational load predicts survival after immunotherapy across multiple cancer types. Nat. Genet. 2019, 51, 202–206. [Google Scholar] [CrossRef]
- Doroshow, D.B.; Bhalla, S.; Beasley, M.B.; Sholl, L.M.; Kerr, K.M.; Gnjatic, S.; Wistuba, I.I.; Rimm, D.L.; Tsao, M.S.; Hirsch, F.R. PD-L1 as a biomarker of response to immune-checkpoint inhibitors. Nat. Rev. Clin. Oncol. 2021, 18, 345–362. [Google Scholar] [CrossRef]
- Liu, Y.; Sethi, N.S.; Hinoue, T.; Schneider, B.G.; Cherniack, A.D.; Sanchez-Vega, F.; Seoane, J.A.; Farshidfar, F.; Bowlby, R.; Islam, M.; et al. Comparative Molecular Analysis of Gastrointestinal Adenocarcinomas. Cancer Cell 2018, 33, 721–735.e8. [Google Scholar] [CrossRef] [Green Version]
- Thorsson, V.; Gibbs, D.L.; Brown, S.D.; Wolf, D.; Bortone, D.S.; Ou Yang, T.-H.; Porta-Pardo, E.; Gao, G.F.; Plaisier, C.L.; Eddy, J.A.; et al. The Immune Landscape of Cancer. Immunity 2018, 48, 812–830.e14. [Google Scholar] [CrossRef] [Green Version]
- Imamura, Y.; Watanabe, M.; Toihata, T.; Takamatsu, M.; Kawachi, H.; Haraguchi, I.; Ogata, Y.; Yoshida, N.; Saeki, H.; Oki, E.; et al. Recent Incidence Trend of Surgically Resected Esophagogastric Junction Adenocarcinoma and Microsatellite Instability Status in Japanese Patients. Digestion 2018, 99, 6–13. [Google Scholar] [CrossRef]
- Greally, M.; Chou, J.F.; Chatila, W.K.; Margolis, M.; Capanu, M.; Hechtman, J.F.; Tuvy, Y.; Kundra, R.; Daian, F.; Ladanyi, M.; et al. Clinical and Molecular Predictors of Response to Immune Checkpoint Inhibitors in Patients with Advanced Esophagogastric Cancer. Clin. Cancer Res. 2019, 25, 6160–6169. [Google Scholar] [CrossRef]
- Wu, T.; Dai, Y. Tumor microenvironment and therapeutic response. Cancer Lett. 2016, 387, 61–68. [Google Scholar] [CrossRef]
- Binnewies, M.; Roberts, E.W.; Kersten, K.; Chan, V.; Fearon, D.F.; Merad, M.; Coussens, L.M.; Gabrilovich, D.I.; Ostrand-Rosenberg, S.; Hedrick, C.C.; et al. Understanding the tumor immune microenvironment (TIME) for effective therapy. Nat. Med. 2018, 24, 541–550. [Google Scholar] [CrossRef]
- Lambrechts, D.; Wauters, E.; Boeckx, B.; Aibar, S.; Nittner, D.; Burton, O.; Bassez, A.; Decaluwé, H.; Pircher, A.; Van den Eynde, K.; et al. Phenotype molding of stromal cells in the lung tumor microenvironment. Nat. Med. 2018, 24, 1277–1289. [Google Scholar] [CrossRef]
- Combes, A.J.; Samad, B.; Tsui, J.; Chew, N.W.; Yan, P.; Reeder, G.C.; Kushnoor, D.; Shen, A.; Davidson, B.; Barczak, A.J.; et al. Discovering dominant tumor immune archetypes in a pan-cancer census. Cell 2021, 185, 184–203.e19. [Google Scholar] [CrossRef]
- Ho, J.W.; Stefani, M.; Dos Remedios, C.G.; Charleston, M.A. Differential variability analysis of gene expression and its application to human diseases. Bioinformatics 2008, 24, i390–i398. [Google Scholar] [CrossRef] [Green Version]
- Janjigian, Y.Y.; Shitara, K.; Moehler, M.; Garrido, M.; Salman, P.; Shen, L.; Wyrwicz, L.; Yamaguchi, K.; Skoczylas, T.; Bragagnoli, A.C.; et al. First-line nivolumab plus chemotherapy versus chemotherapy alone for advanced gastric, gastro-oesophageal junction, and oesophageal adenocarcinoma (CheckMate 649): A randomised, open-label, phase 3 trial. Lancet 2021, 398, 27–40. [Google Scholar] [CrossRef]
- Ayers, M.; Lunceford, J.; Nebozhyn, M.; Murphy, E.; Loboda, A.; Kaufman, D.R.; Albright, A.; Cheng, J.D.; Kang, S.P.; Shankaran, V.; et al. IFN-γ-related mRNA profile predicts clinical response to PD-1 blockade. J. Clin. Investig. 2017, 127, 2930–2940. [Google Scholar] [CrossRef]
- Roh, W.; Chen, P.-L.; Reuben, A.; Spencer, C.N.; Prieto, P.A.; Miller, J.P.; Gopalakrishnan, V.; Wang, F.; Cooper, Z.A.; Reddy, S.M.; et al. Integrated molecular analysis of tumor biopsies on sequential CTLA-4 and PD-1 blockade reveals markers of response and resistance. Sci. Transl. Med. 2017, 9, eaah3560. [Google Scholar] [CrossRef] [Green Version]
- Geeleher, P.; Cox, N.J.; Huang, R.S. Clinical drug response can be predicted using baseline gene expression levels and in vitrodrug sensitivity in cell lines. Genome Biol. 2014, 15, R47. [Google Scholar] [CrossRef] [Green Version]
- Testa, U.; Castelli, G.; Pelosi, E. Esophageal Cancer: Genomic and Molecular Characterization, Stem Cell Compartment and Clonal Evolution. Medicines 2017, 4, 67. [Google Scholar] [CrossRef] [Green Version]
- Smyth, E.C.; Lagergren, J.; Fitzgerald, R.C.; Lordick, F.; Shah, M.A.; Lagergren, P.; Cunningham, D. Oesophageal cancer. Nat. Rev. Dis. Primers 2017, 3, 17048. [Google Scholar] [CrossRef]
- Huang, T.-X.; Fu, L. The immune landscape of esophageal cancer. Cancer Commun. 2019, 39, 1–13. [Google Scholar] [CrossRef] [Green Version]
- Lokeshwar, B.L.; Kallifatidis, G.; Hoy, J.J. Chapter One—Atypical chemokine receptors in tumor cell growth and metastasis. In Advances in Cancer Research; Shukla, A.K., Ed.; Academic Press: Cambridge, MA, USA, 2020; pp. 1–27. [Google Scholar]
- Pruenster, M.; Mudde, L.; Bombosi, P.; Dimitrova, S.; Zsak, M.; Middleton, J.; Richmond, A.; Graham, G.J.; Segerer, S.; Nibbs, R.J.; et al. The Duffy antigen receptor for chemokines transports chemokines and supports their promigratory activity. Nat. Immunol. 2009, 10, 101–108. [Google Scholar] [CrossRef]
- Gaiser, M.R.; Lämmermann, T.; Feng, X.; Igyarto, B.Z.; Kaplan, D.H.; Tessarollo, L.; Germain, R.N.; Udey, M.C. Cancer-associated epithelial cell adhesion molecule (EpCAM; CD326) enables epidermal Langerhans cell motility and migration in vivo. Proc. Natl. Acad. Sci. USA 2012, 109, E889–E897. [Google Scholar] [CrossRef] [PubMed] [Green Version]
- Staversky, R.J.; Byun, D.K.; Georger, M.A.; Zaffuto, B.J.; Goodman, A.; Becker, M.W.; Calvi, L.M.; Frisch, B.J. The Chemokine CCL3 Regulates Myeloid Differentiation and Hematopoietic Stem Cell Numbers. Sci. Rep. 2018, 8, 14691. [Google Scholar] [CrossRef] [PubMed]
- Chan, T.-C.; Li, C.-F.; Ke, H.-L.; Wei, Y.-C.; Shiue, Y.-L.; Li, C.-C.; Yeh, H.-C.; Lee, H.-Y.; Huang, S.-K.; Wu, W.-J.; et al. High TNFAIP6 level is associated with poor prognosis of urothelial carcinomas. Urol. Oncol. Semin. Orig. Investig. 2018, 37, e11–e24. [Google Scholar] [CrossRef] [PubMed]
- Wang, C.; Yang, Z.; Xu, E.; Shen, X.; Wang, X.; Li, Z.; Yu, H.; Chen, K.; Hu, Q.; Xia, X.; et al. Apolipoprotein C-II induces EMT to promote gastric cancer peritoneal metastasis via PI3K/AKT/mTOR pathway. Clin. Transl. Med. 2021, 11, e522. [Google Scholar] [CrossRef] [PubMed]
- Jiang, Y.; Chen, J.; Ling, J.; Zhu, X.; Jiang, P.; Tang, X.; Zhou, H.; Li, R. Construction of a Glycolysis-related long noncoding RNA signature for predicting survival in endometrial cancer. J. Cancer 2021, 12, 1431–1444. [Google Scholar] [CrossRef]
- Xue, S.-T.; Zheng, B.; Cao, S.-Q.; Ding, J.-C.; Hu, G.-S.; Liu, W.; Chen, C. Long non-coding RNA LINC00680 functions as a ceRNA to promote esophageal squamous cell carcinoma progression through the miR-423-5p/PAK6 axis. Mol. Cancer 2022, 21, 69. [Google Scholar] [CrossRef]
- Xu, M.; Zhang, R.; Qiu, J. A four immune-related long noncoding RNAs signature as predictors for cervical cancer. Hum. Cell 2021, 35, 348–359. [Google Scholar] [CrossRef]
- Zhang, X.; Lian, T.; Fan, W.; Zhang, G.; Chen, Z.; Gou, X.; Jha, R.K. Long-Noncoding RNA CASC9 Promotes Progression of Non-Small Cell Lung Cancer by Promoting the Expression of CDC6 Through Binding to HuR. Cancer Manag. Res. 2020, 12, 9033–9043. [Google Scholar] [CrossRef]
- Li, X.-F.; Ren, P.; Shen, W.-Z.; Jin, X.; Zhang, J. The expression, modulation and use of cancer-testis antigens as potential biomarkers for cancer immunotherapy. Am. J. Transl. Res. 2020, 12, 7002–7019. [Google Scholar]
- Mohsenzadegan, M.; Razmi, M.; Vafaei, S.; Abolhasani, M.; Madjd, Z.; Saeednejad Zanjani, L.; Sharifi, L. Co-expression of cancer-testis antigens of MAGE-A6 and MAGE-A11 is associated with tumor aggressiveness in patients with bladder cancer. Sci. Rep. 2022, 12, 599. [Google Scholar] [CrossRef]
- Weon, J.; Potts, P.R. The MAGE protein family and cancer. Curr. Opin. Cell Biol. 2015, 37, 1–8. [Google Scholar] [CrossRef] [PubMed] [Green Version]
- Avila Cobos, F.; Alquicira-Hernandez, J.; Powell, J.E.; Mestdagh, P.; De Preter, K. Benchmarking of cell type deconvolution pipelines for transcriptomics data. Nat. Commun. 2020, 11, 5650. [Google Scholar] [CrossRef] [PubMed]
- Zeng, D.; Ye, Z.; Shen, R.; Yu, G.; Wu, J.; Xiong, Y.; Zhou, R.; Qiu, W.; Huang, N.; Sun, L.; et al. IOBR: Multi-Omics Immuno-Oncology Biological Research to Decode Tumor Microenvironment and Signatures. Front. Immunol. 2021, 12, 687975. [Google Scholar] [CrossRef] [PubMed]
- Newman, A.M.; Liu, C.L.; Green, M.R.; Gentles, A.J.; Feng, W.; Xu, Y.; Hoang, C.D.; Diehn, M.; Alizadeh, A.A. Robust enumeration of cell subsets from tissue expression profiles. Nat. Methods 2015, 12, 453–457. [Google Scholar] [CrossRef] [Green Version]
- Aran, D.; Hu, Z.; Butte, A.J. xCell: Digitally portraying the tissue cellular heterogeneity landscape. Genome Biol. 2017, 18, 220. [Google Scholar] [CrossRef] [Green Version]
- Li, B.; Severson, E.; Pignon, J.-C.; Zhao, H.; Li, T.; Novak, J.; Jiang, P.; Shen, H.; Aster, J.C.; Rodig, S.; et al. Comprehensive analyses of tumor immunity: Implications for cancer immunotherapy. Genome Biol. 2016, 17, 174. [Google Scholar] [CrossRef] [Green Version]
- Becht, E.; Giraldo, N.A.; Lacroix, L.; Buttard, B.; Elarouci, N.; Petitprez, F.; Selves, J.; Laurent-Puig, P.; Sautes-Fridman, C.; Fridman, W.H.; et al. Estimating the population abundance of tissue-infiltrating immune and stromal cell populations using gene expression. Genome Biol. 2016, 17, 218. [Google Scholar] [CrossRef]
- Racle, J.; De Jonge, K.; Baumgaertner, P.; Speiser, D.E.; Gfeller, D. Simultaneous enumeration of cancer and immune cell types from bulk tumor gene expression data. eLife 2017, 6, e26476. [Google Scholar] [CrossRef]
- Yoshihara, K.; Shahmoradgoli, M.; Martínez, E.; Vegesna, R.; Kim, H.; Torres-Garcia, W.; Trevino, V.; Shen, H.; Laird, P.W.; Levine, D.A.; et al. Inferring tumour purity and stromal and immune cell admixture from expression data. Nat. Commun. 2013, 4, 2612. [Google Scholar] [CrossRef]
- Finotello, F.; Mayer, C.; Plattner, C.; Laschober, G.; Rieder, D.; Hackl, H.; Trajanoski, Z. Molecular and pharmacological modulators of the tumor immune contexture revealed by deconvolution of RNA-seq data. Genome Med. 2019, 11, 1–20. [Google Scholar]
- Charoentong, P.; Finotello, F.; Angelova, M.; Mayer, C.; Efremova, M.; Rieder, D.; Hackl, H.; Trajanoski, Z. Pan-cancer Immunogenomic Analyses Reveal Genotype-Immunophenotype Relationships and Predictors of Response to Checkpoint Blockade. Cell Rep. 2017, 18, 248–262. [Google Scholar] [CrossRef] [PubMed] [Green Version]
- Chalise, P.; Fridley, B.L. Integrative clustering of multi-level ‘omic data based on non-negative matrix factorization algorithm. PLoS ONE 2017, 12, e0176278. [Google Scholar] [CrossRef] [PubMed] [Green Version]
- Cantini, L.; Zakeri, P.; Hernandez, C.; Naldi, A.; Thieffry, D.; Remy, E.; Baudot, A. Benchmarking joint multi-omics dimensionality reduction approaches for the study of cancer. Nat. Commun. 2021, 12, 124. [Google Scholar] [CrossRef]
- Lu, X.; Meng, J.; Zhou, Y.; Jiang, L.; Yan, F. MOVICS: An R package for multi-omics integration and visualization in cancer subtyping. Bioinformatics 2020, 36, 5539–5541. [Google Scholar] [CrossRef]
- Hoshida, Y. Nearest Template Prediction: A Single-Sample-Based Flexible Class Prediction with Confidence Assessment. PLoS ONE 2010, 5, e15543. [Google Scholar] [CrossRef]
- Hänzelmann, S.; Castelo, R.; Guinney, J. GSVA: Gene set variation analysis for microarray and RNA-Seq data. BMC Bioinform. 2013, 14, 7. [Google Scholar] [CrossRef] [PubMed] [Green Version]
- Jiang, P.; Gu, S.; Pan, D.; Fu, J.; Sahu, A.; Hu, X.; Li, Z.; Traugh, N.; Bu, X.; Li, B.; et al. Signatures of T cell dysfunction and exclusion predict cancer immunotherapy response. Nat. Med. 2018, 24, 1550–1558. [Google Scholar] [CrossRef] [PubMed]
- Hoshida, Y.; Brunet, J.-P.; Tamayo, P.; Golub, T.R.; Mesirov, J.P. Subclass Mapping: Identifying Common Subtypes in Independent Disease Data Sets. PLoS ONE 2007, 2, e1195. [Google Scholar] [CrossRef] [Green Version]
Figure 1.
Flow chart of this study.

Figure 2.
Identification of EAC subtypes using IntNMF and consensus clustering. (A) Identification of optimal cluster numbers by calculating CPIs (blue line) and gap statistics (red line) in TCGA-EAC. (B) Consensus heatmap based on results from 10 multi-omics integrative clustering algorithms with a cluster number of 2. (C) Quantification of sample similarity using silhouette scores based on consensus ensemble results. (D) Kaplan–Meier survival curve of EAC subtypes in TCGA-EAC.

Figure 3.
Molecular and TME characteristics and enrichment pathways of EAC subtypes with clinicopathological annotations. (A) Heat map for mRNAs, lncRNAs, and TME scores for the EAC subtypes with clinical characteristics. (B) GO enrichment analyses of upregulated genes differentially expressed in the EAC subtypes of the TCGA-EAC cohort. SC_IPS: suppressor cell score in IPS (immunophenoscores); CP_IPS: checkpoint or immunomodulator score in IPS; EC_IPS: effector cell score in IPS. (C) Heatmap of enrichment scores of the gene set of interest for EAC subtypes in the TCGA-EAC cohort.


Figure 4.
The tumor microenvironment landscape of EAC subtypes. (A) Heatmap of significantly different TME cell types between the two EAC subtypes. (B) Boxplot of TME cell type signature scores obtained using CIBERSORT, EPIC, xCell, and quanTIseq methods. (C) TME signature scores estimated by EPIC.
Figure 4.
The tumor microenvironment landscape of EAC subtypes. (A) Heatmap of significantly different TME cell types between the two EAC subtypes. (B) Boxplot of TME cell type signature scores obtained using CIBERSORT, EPIC, xCell, and quanTIseq methods. (C) TME signature scores estimated by EPIC.

Figure 5.
Differential immunotherapeutic and chemotherapeutic responses of EAC subtypes. (A) A waterfall plot of TIDE prediction scores across 88 TCGA-EAC tumor samples and a heatmap of TIDE reported signature scores. Dysfunction: T cell dysfunction potential of the tumor; Exclusion: T cell exclusion potential of the tumor; CAF: Pearson correlation between input expression profiles and FAP+ cancer associated fibroblast (CAF) signatures; TAM.M2: Pearson correlation between input expression profiles and TAM (M2 subtype) signatures; CTL.flag: Tumor category defined by the level of CTL (Cytotoxic T Lymphocyte)—high: True or low: False; Merck18: T cell-inflamed siganture (PMID: 28650338); MSI Expr Sig: MSI prediction model trained from TCGA STAD Cancer through Ridge Regression; MDSC: Pearson correlation between input expression profiles and MDSC signatures. (B) SubMap analysis manifested that the EAC subtype 2 could be more sensitive to the PD1 inhibitor (Bonferroni-corrected p < 0.001). (C) The boxplots of the estimated IC50 values for 5-Fluorouracil, Cisplatin, Paclitaxel, and Sorafenib are shown.

Figure 6.
Validation of EAC subtyping using external datasets GSE72874, GSE19417, and GSE13898. (A) Heatmap of subtype-specific signature genes for identified subtypes in TCGA-EAC. (B) Heatmap of subtype-specific signature genes in GSE72874. (C) Kaplan–Meier survival curve of the EAC subtypes in GSE72874. (D) Heatmap of subtype-specific signature genes in GSE19417. (E) Kaplan–Meier survival curve of the EAC subtypes in GSE19417. (F) Heatmap of subtype-specific signature genes in GSE13898. (G) Kaplan–Meier survival curve of the EAC subtypes in GSE13898.

Publisher’s Note: MDPI stays neutral with regard to jurisdictional claims in published maps and institutional affiliations. |
© 2022 by the authors. Licensee MDPI, Basel, Switzerland. This article is an open access article distributed under the terms and conditions of the Creative Commons Attribution (CC BY) license (https://creativecommons.org/licenses/by/4.0/).
Share and Cite
MDPI and ACS Style
Ling, C.; Zhou, X.; Gao, Y.; Sui, X. Identification of Immune Subtypes of Esophageal Adenocarcinoma to Predict Prognosis and Immunotherapy Response. Pharmaceuticals 2022, 15, 605. https://0-doi-org.brum.beds.ac.uk/10.3390/ph15050605
AMA Style
Ling C, Zhou X, Gao Y, Sui X. Identification of Immune Subtypes of Esophageal Adenocarcinoma to Predict Prognosis and Immunotherapy Response. Pharmaceuticals. 2022; 15(5):605. https://0-doi-org.brum.beds.ac.uk/10.3390/ph15050605
Chicago/Turabian StyleLing, Chen, Xiuman Zhou, Yanfeng Gao, and Xinghua Sui. 2022. "Identification of Immune Subtypes of Esophageal Adenocarcinoma to Predict Prognosis and Immunotherapy Response" Pharmaceuticals 15, no. 5: 605. https://0-doi-org.brum.beds.ac.uk/10.3390/ph15050605
Note that from the first issue of 2016, this journal uses article numbers instead of page numbers. See further details here.