
Antifungal Drug Plasma Exposures: A Possible Contribution of Vitamin D-Related Gene Variants

 , , , , , ,
 ,
,  and
and
Abstract
:1. Introduction
2. Results
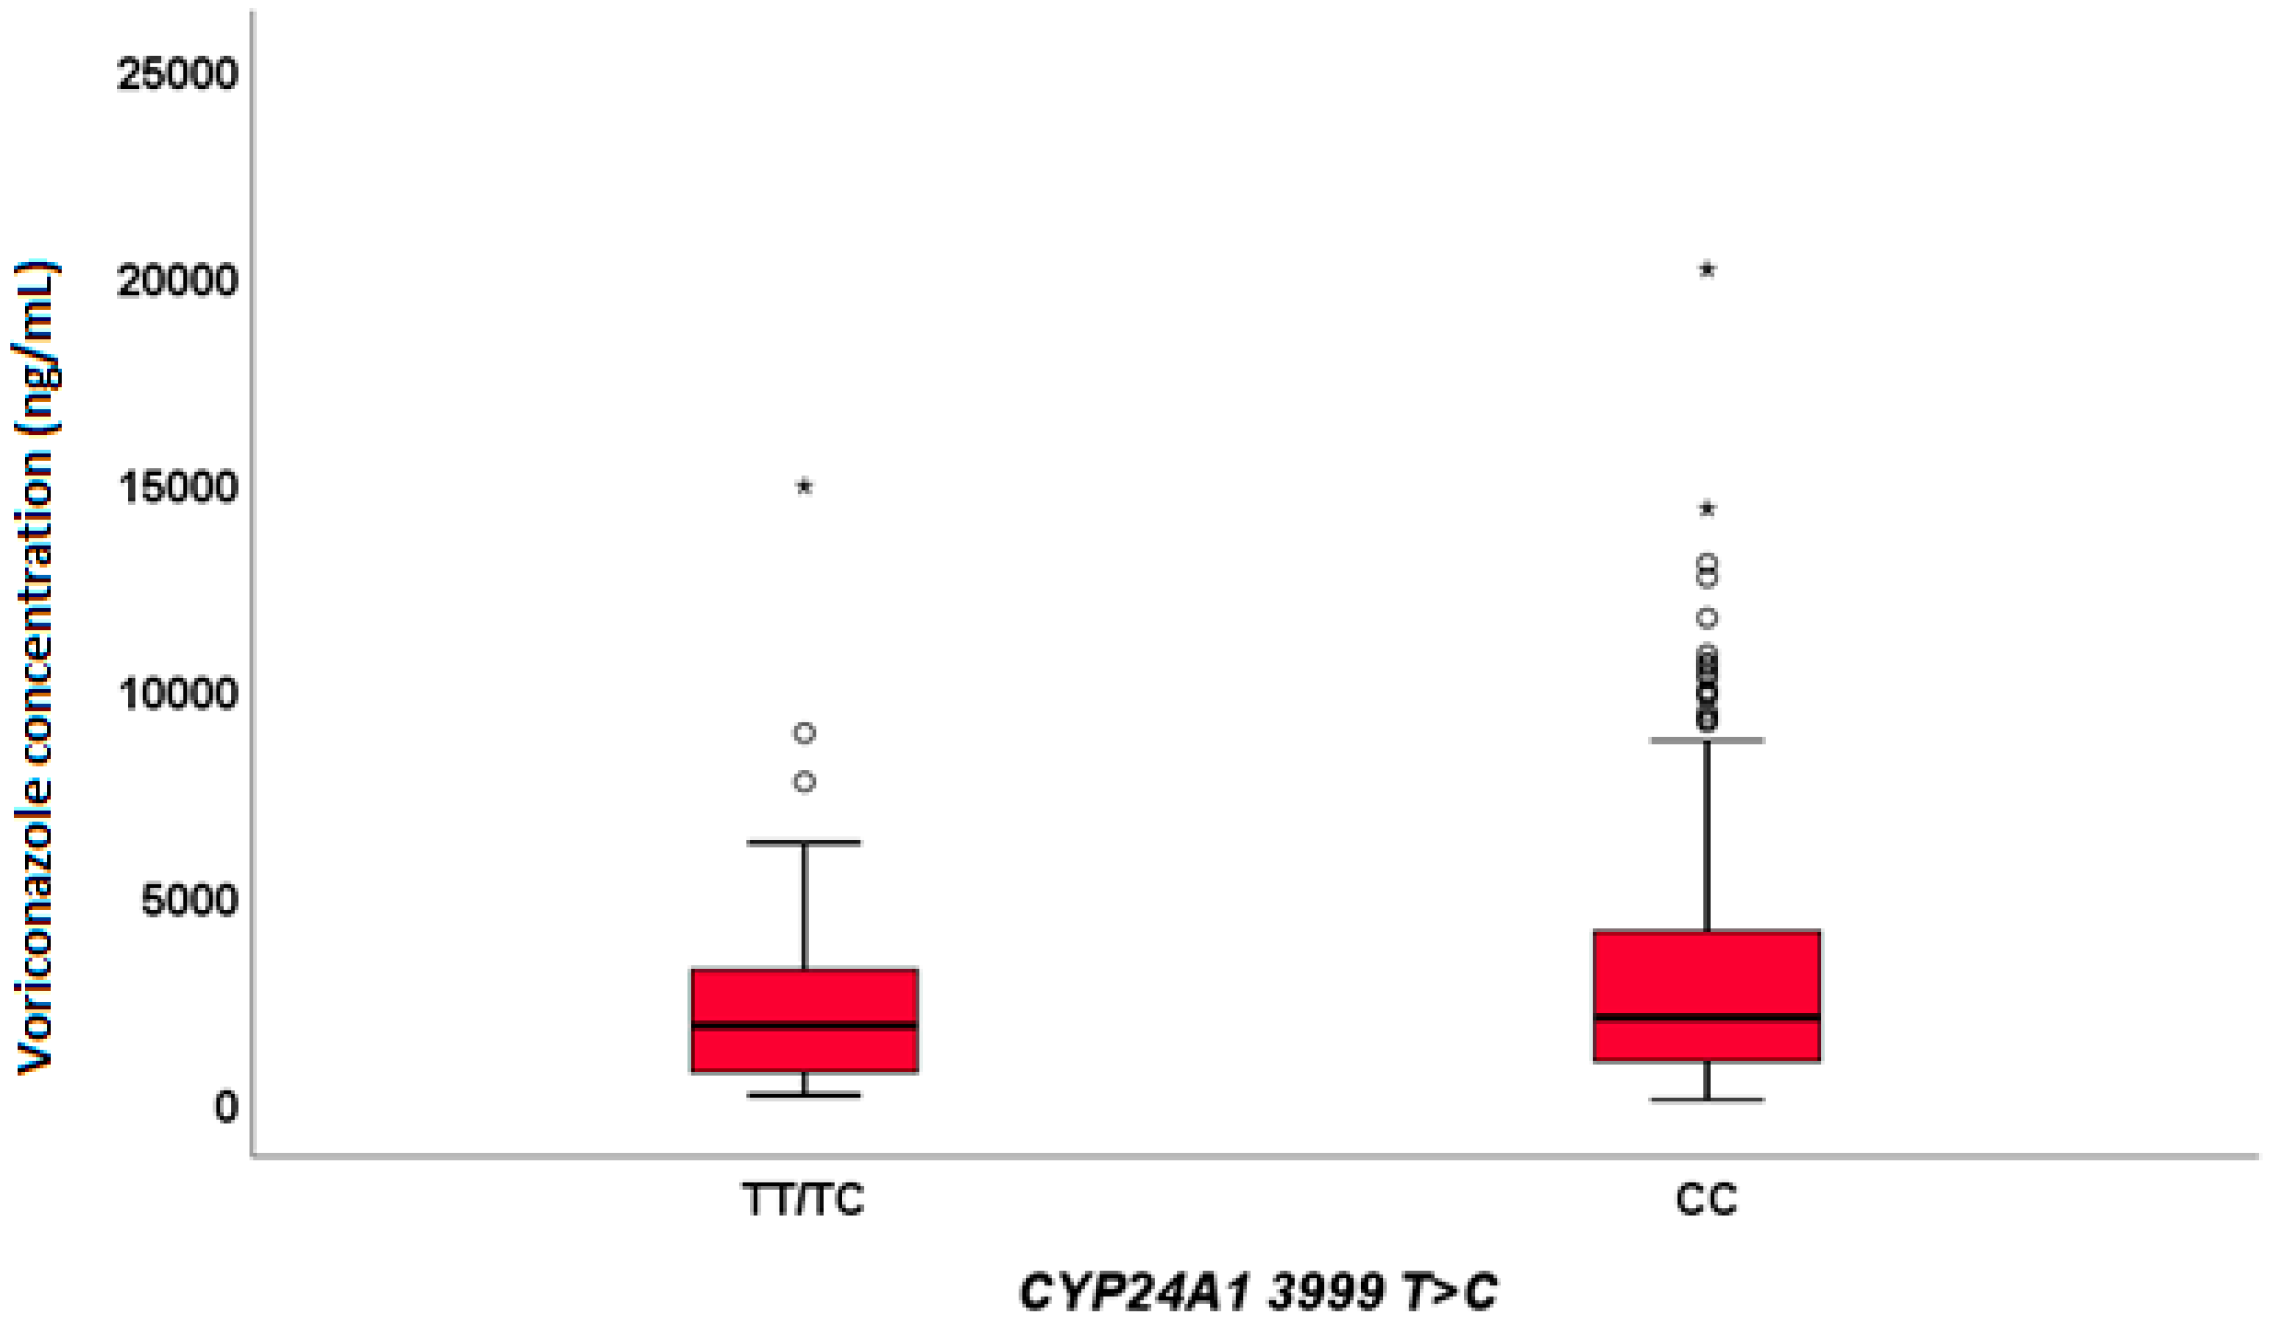
2.1. Voriconazole
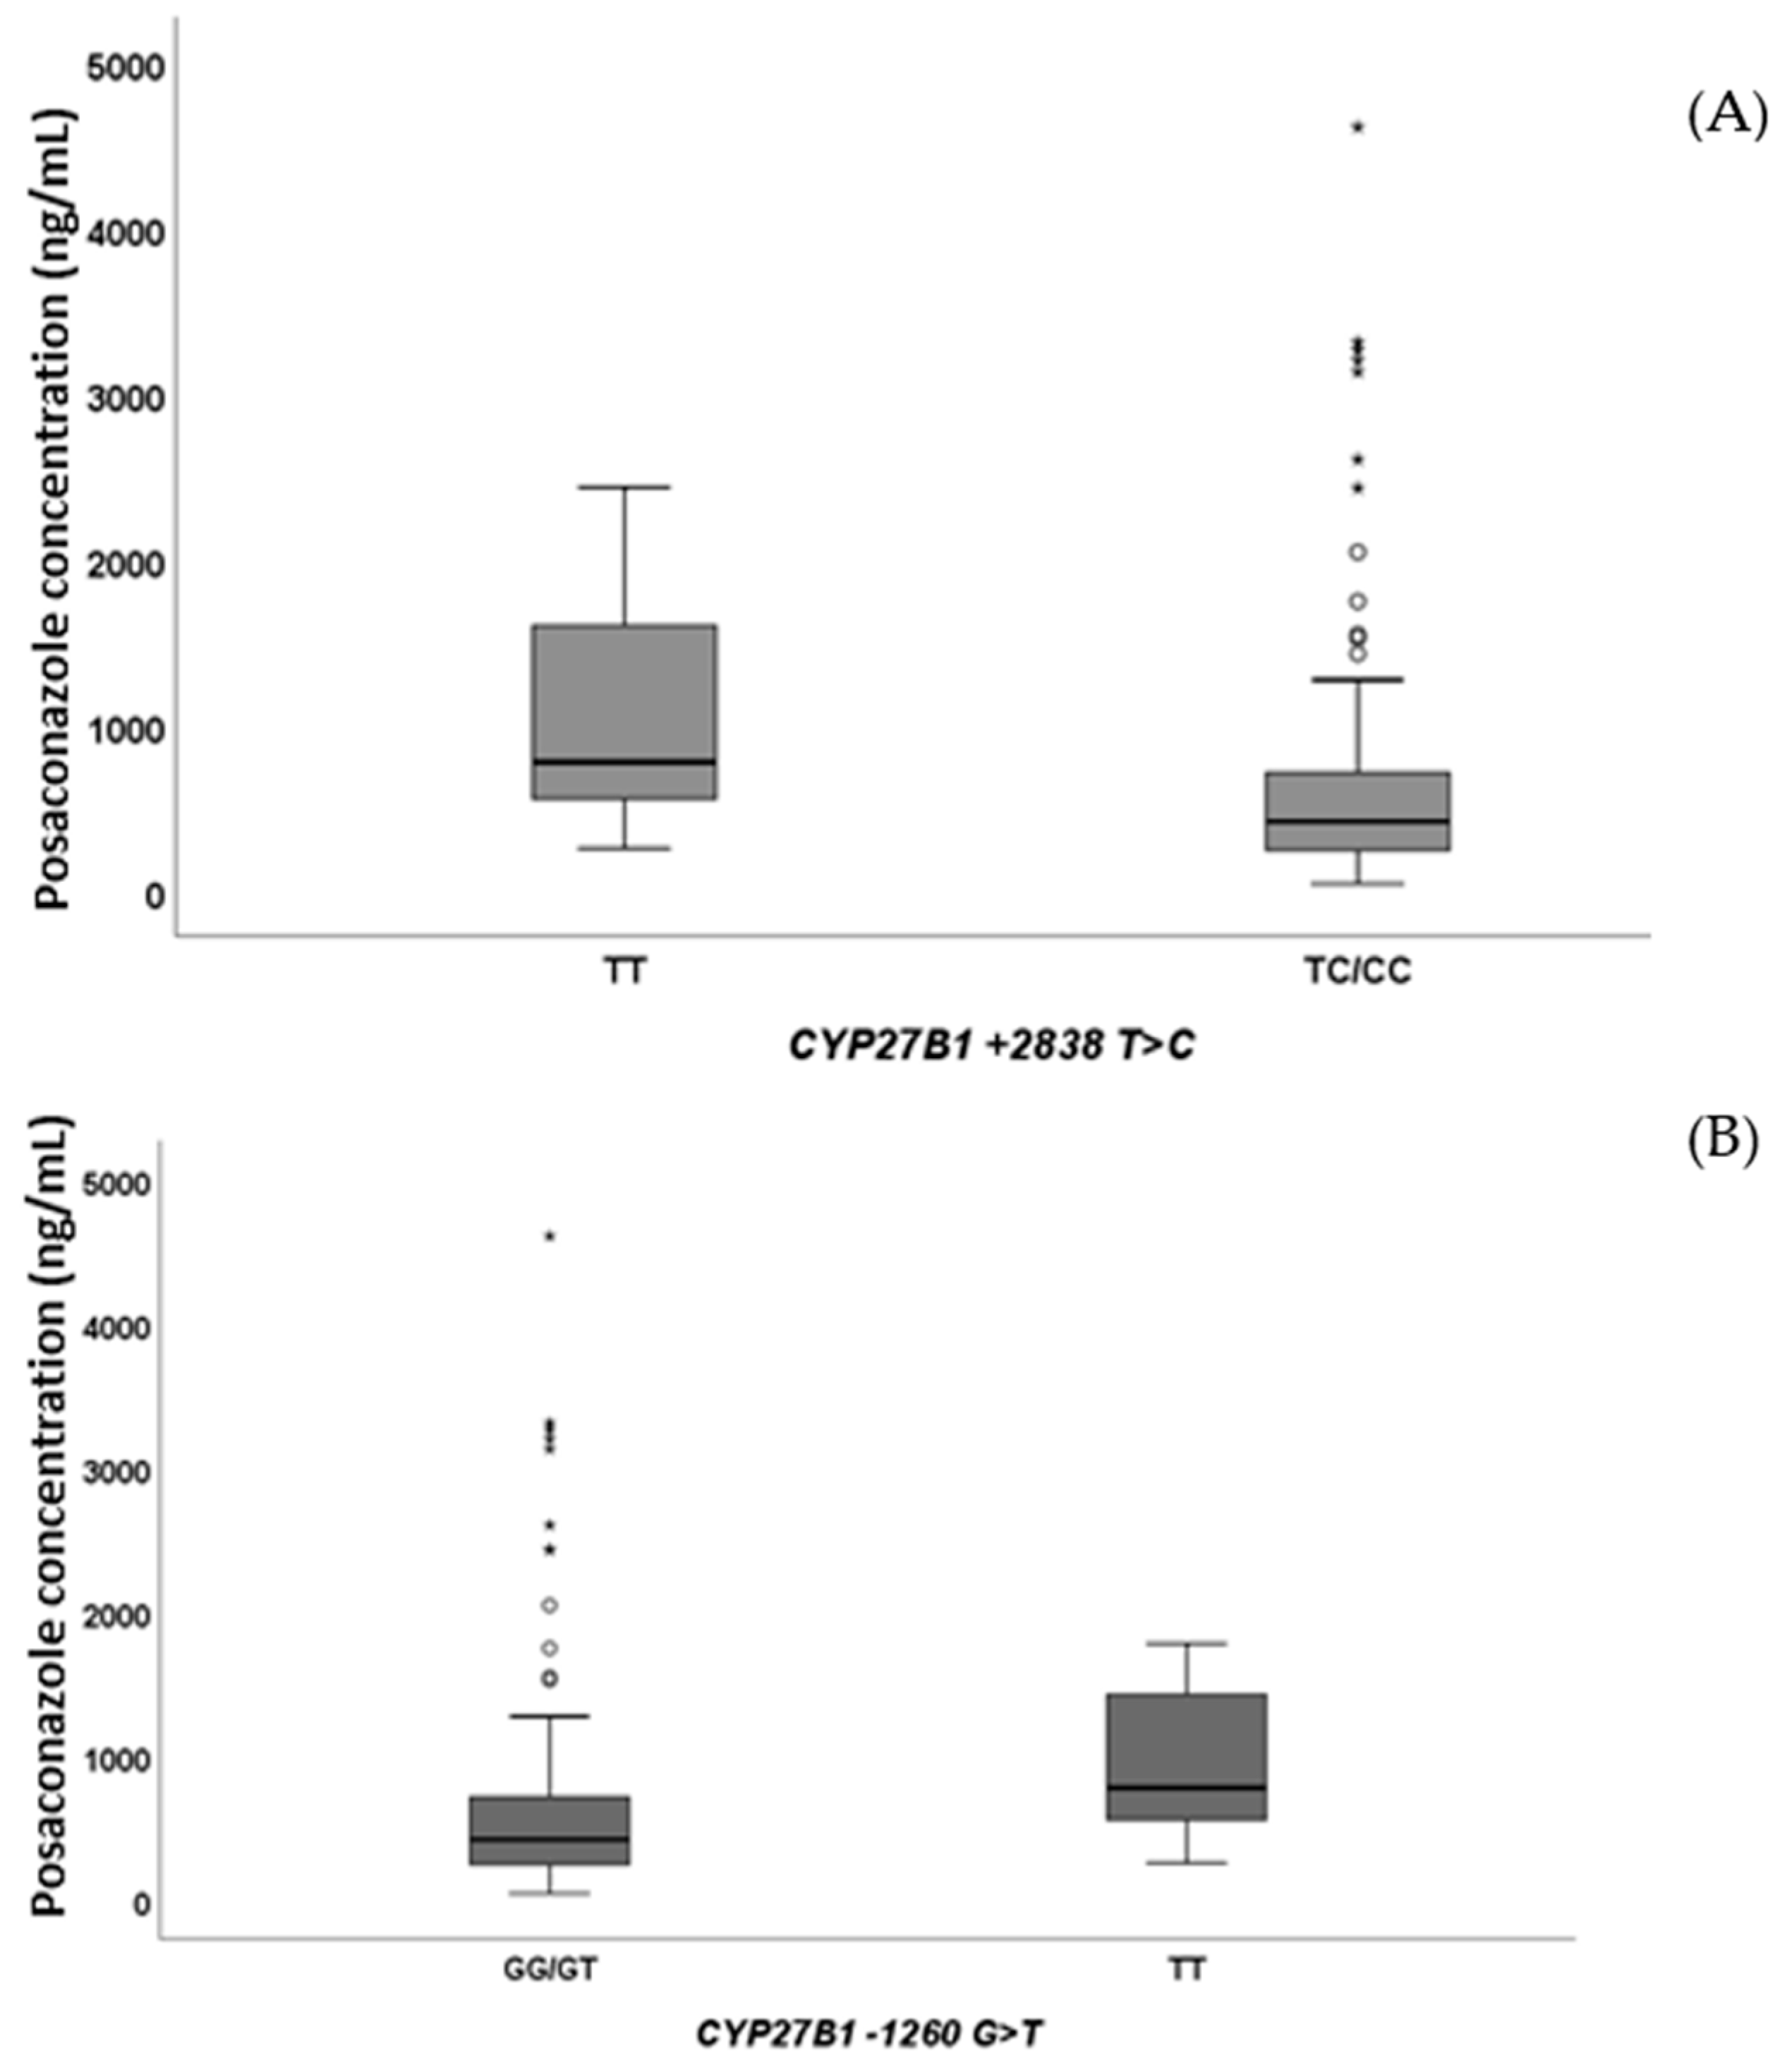
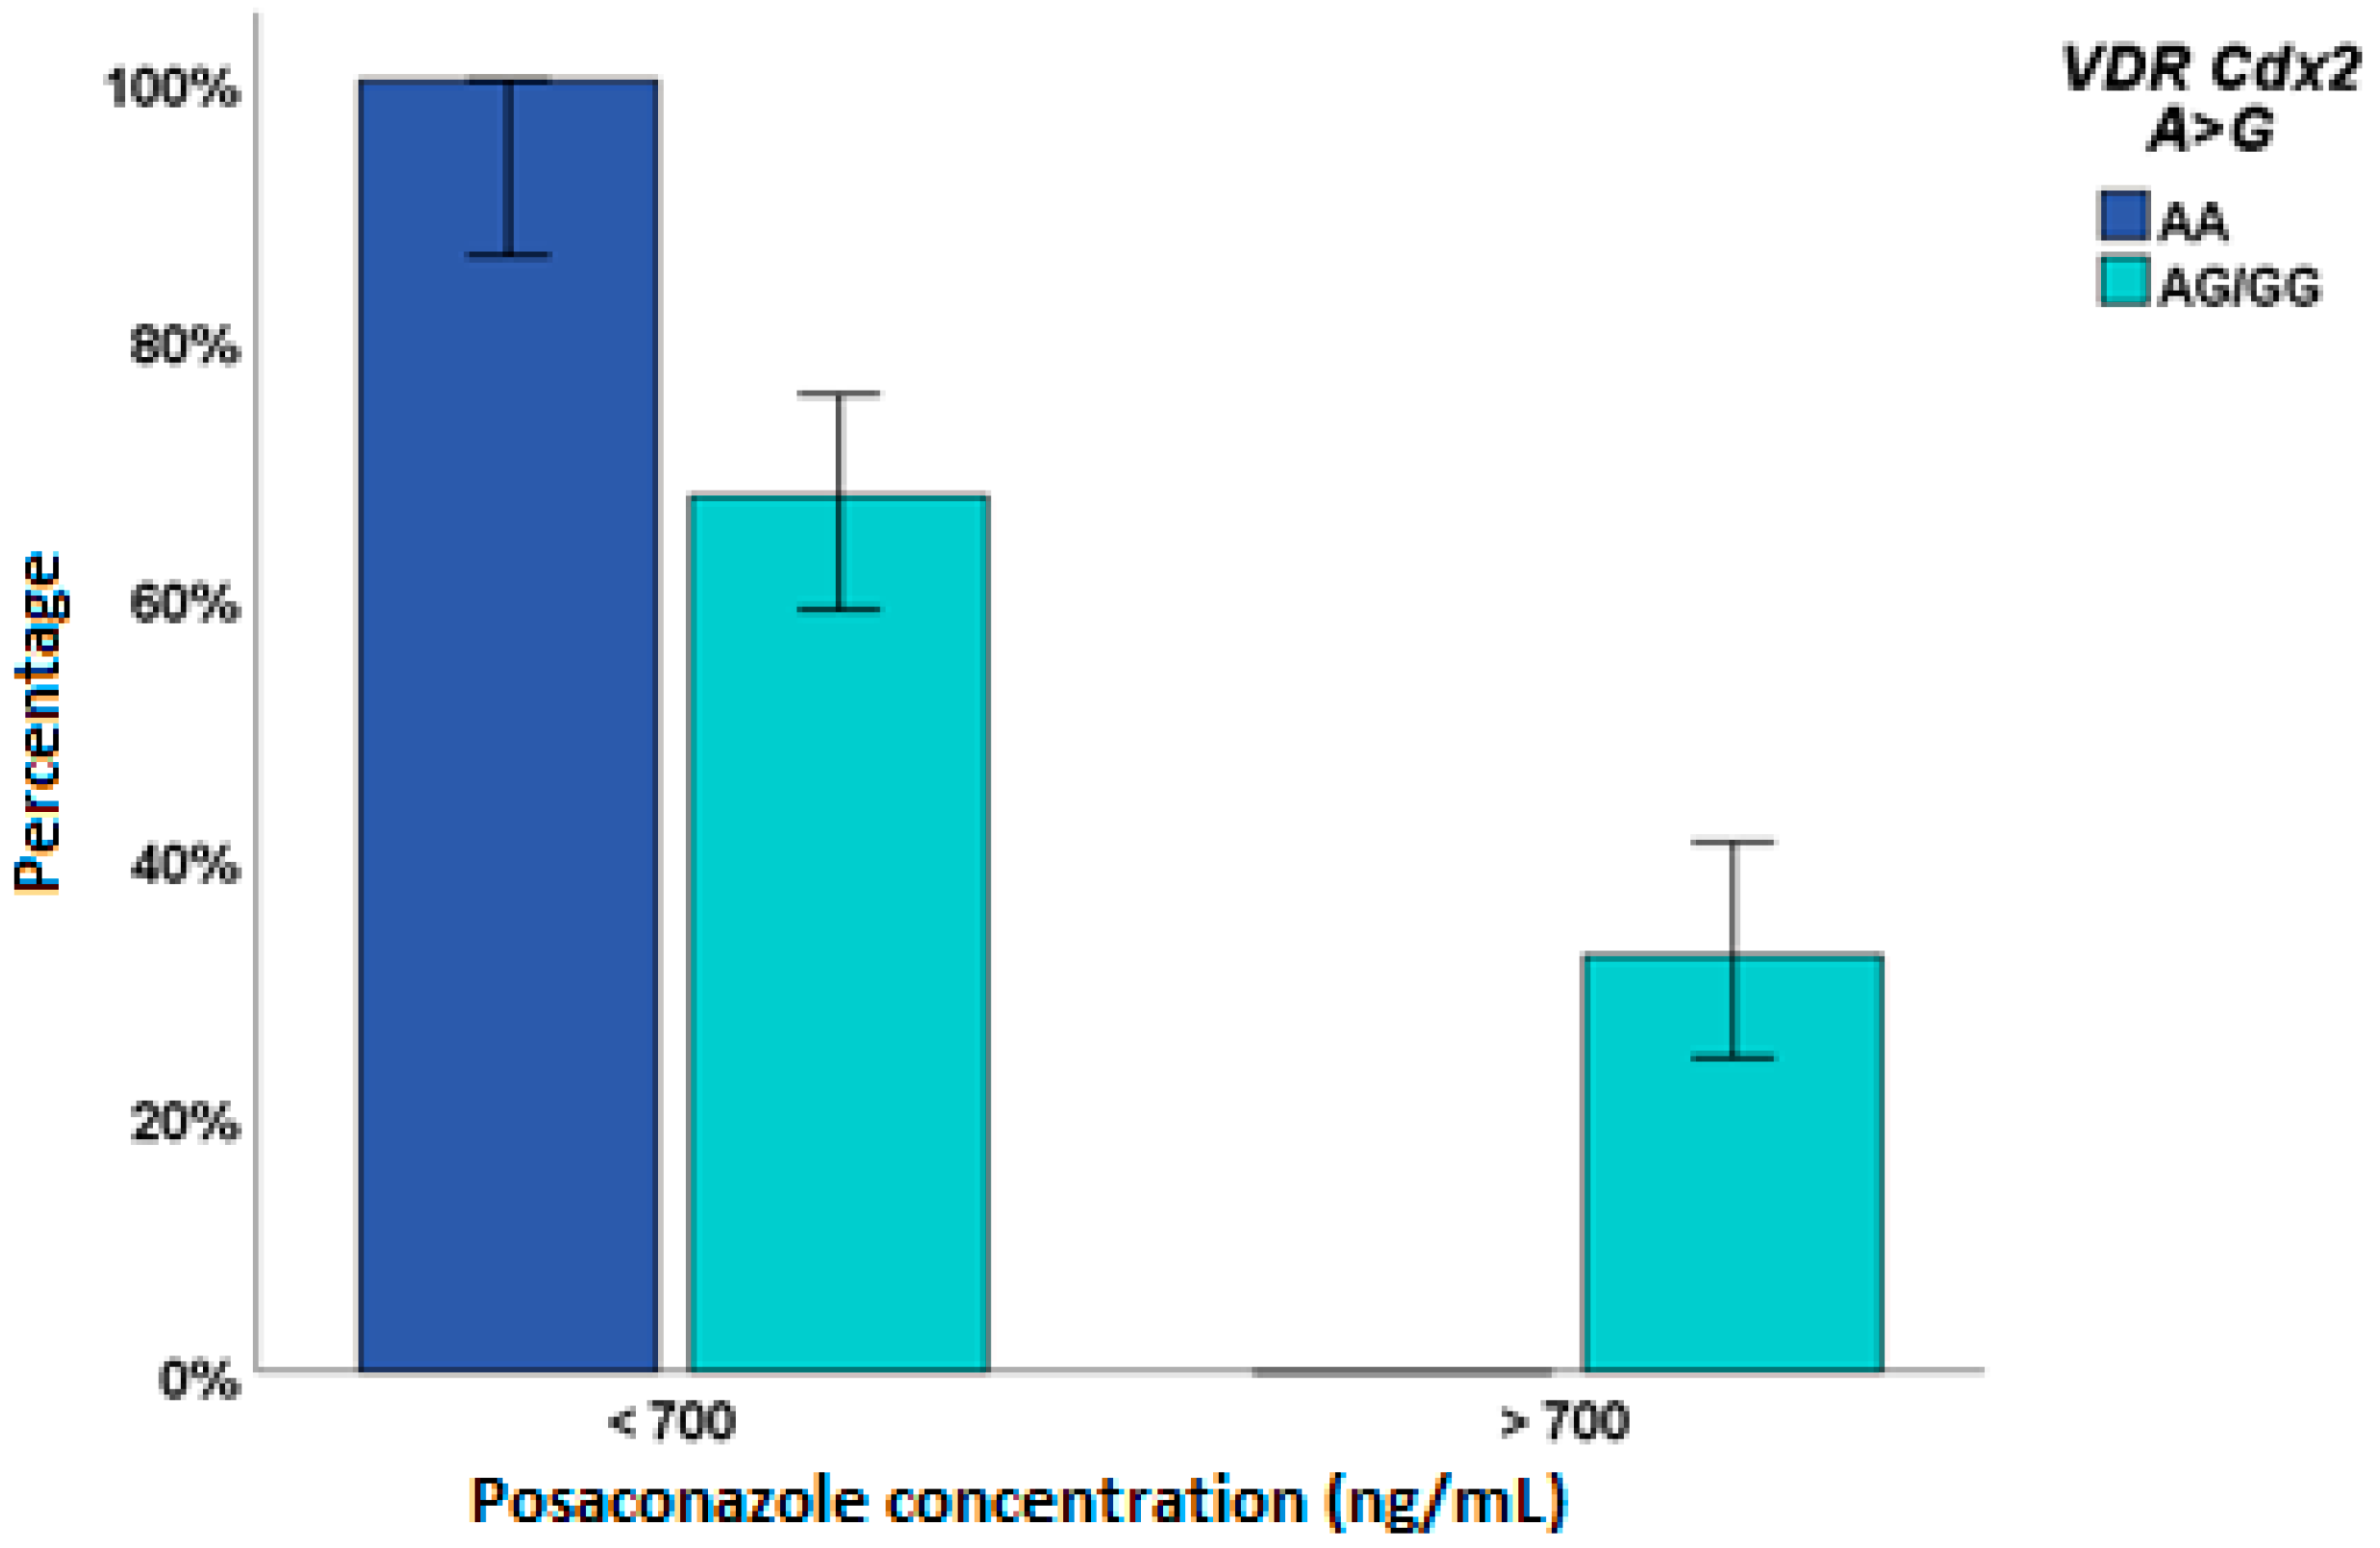
2.2. Posaconazole
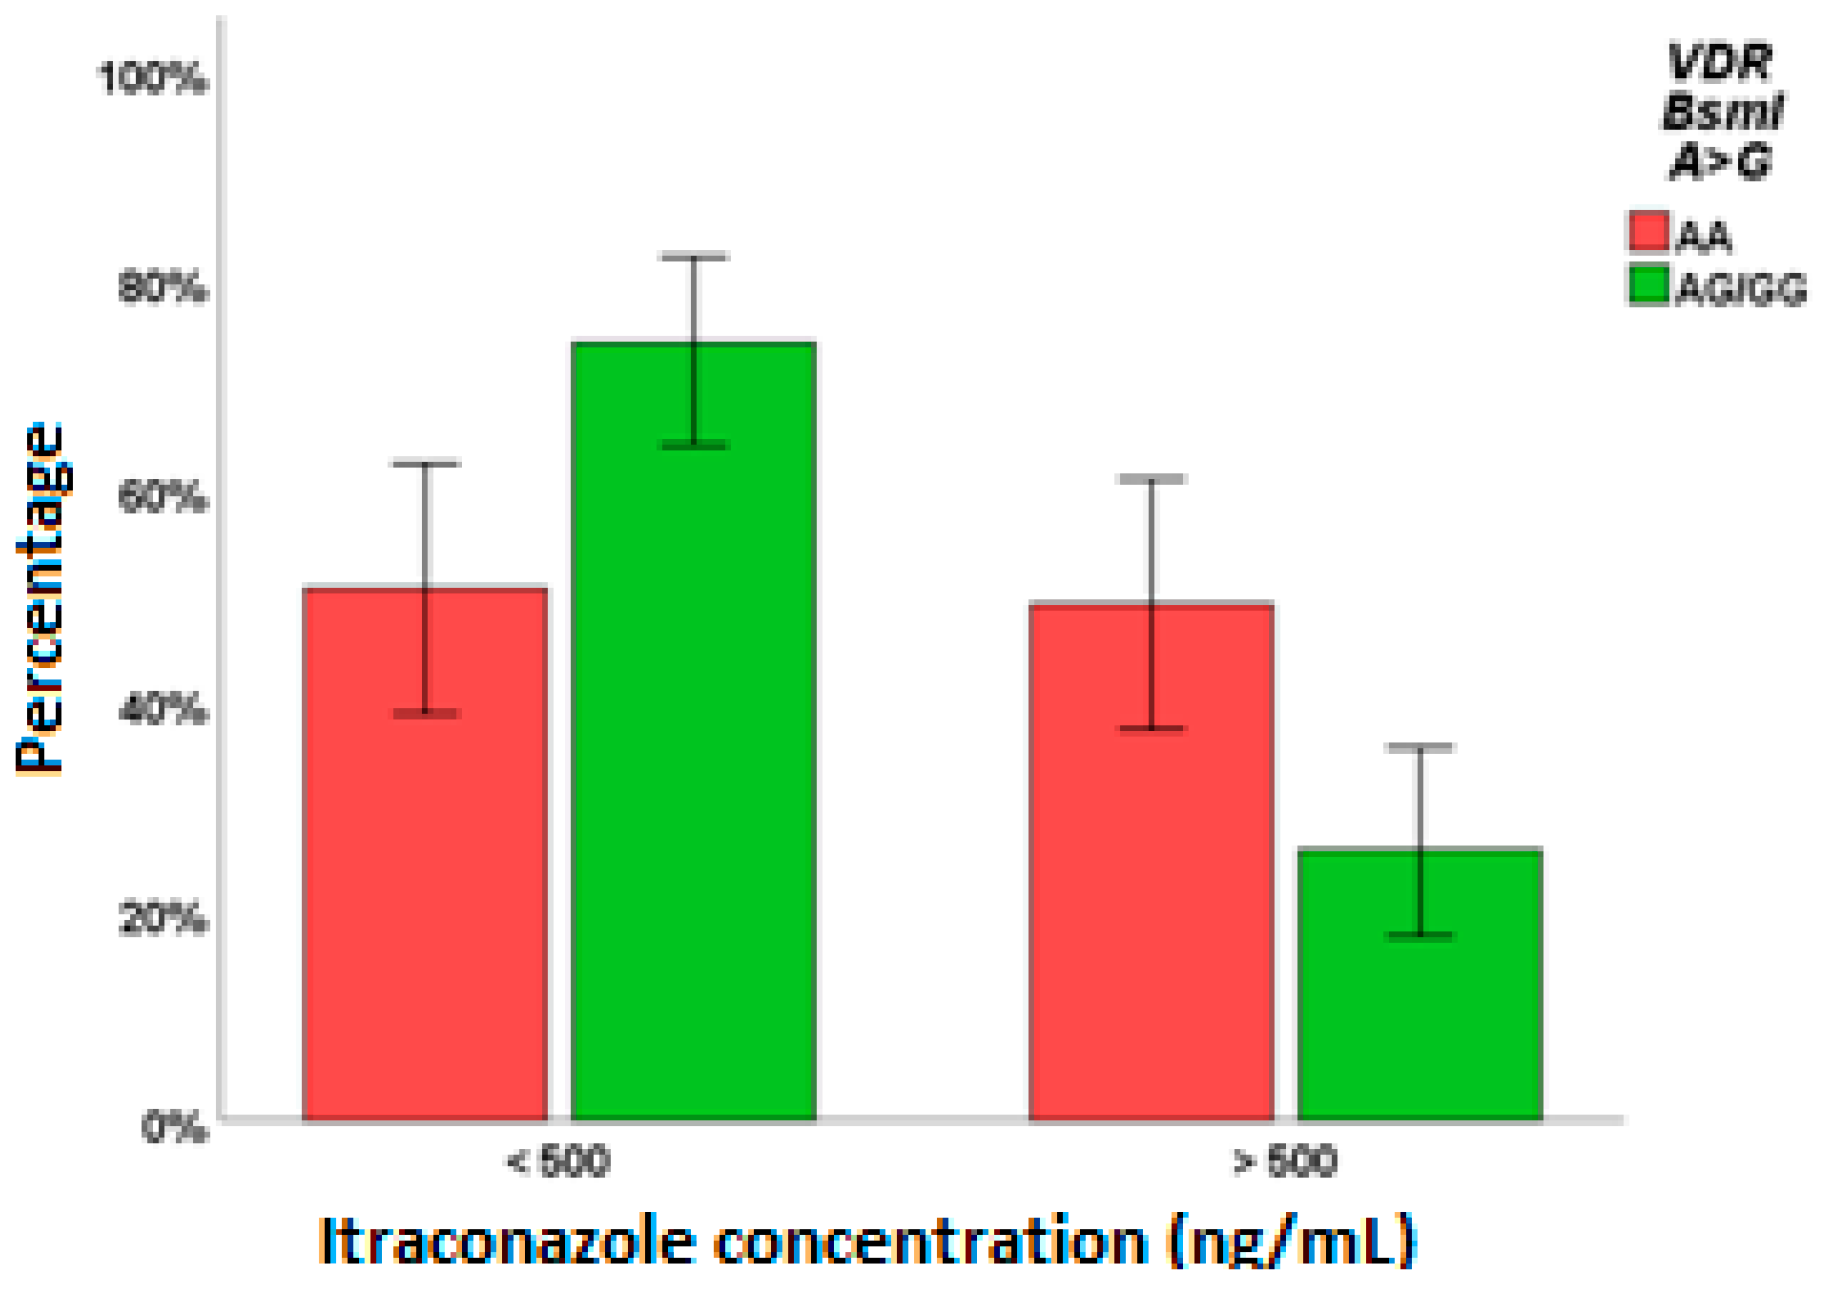
2.3. Itraconazole
3. Discussion
4. Materials and Methods
4.1. Characteristics of Enrolled Patients
4.2. Pharmacogenetic Analyses
4.3. Pharmacokinetic Analyses
4.4. Statistical Analyses
5. Conclusions
Author Contributions
Funding
Institutional Review Board Statement
Informed Consent Statement
Data Availability Statement
Acknowledgments
Conflicts of Interest
References
- Odds, F.C.; Brown, A.J.; Gow, N.A. Antifungal agents: Mechanisms of action. Trends Microbiol. 2003, 11, 272–279. [Google Scholar] [CrossRef]
- Egbuta, C.; Lo, J.; Ghosh, D. Mechanism of inhibition of estrogen biosynthesis by azole fungicides. Endocrinology 2014, 155, 4622–4628. [Google Scholar] [CrossRef] [PubMed]
- Theuretzbacher, U.; Ihle, F.; Derendorf, H. Pharmacokinetic/pharmacodynamic profile of voriconazole. Clin. Pharm. 2006, 45, 649–663. [Google Scholar] [CrossRef] [PubMed]
- Hope, W.W. Population pharmacokinetics of voriconazole in adults. Antimicrob. Agents Chemother. 2012, 56, 526–531. [Google Scholar] [CrossRef] [PubMed] [Green Version]
- Wang, T.; Chen, S.; Sun, J.; Cai, J.; Cheng, X.; Dong, H.; Wang, X.; Xing, J.; Dong, W.; Yao, H.; et al. Identification of factors influencing the pharmacokinetics of voriconazole and the optimization of dosage regimens based on monte carlo simulation in patients with invasive fungal infections. J. Antimicrob. Chemother. 2014, 69, 463–470. [Google Scholar] [CrossRef] [PubMed] [Green Version]
- Lindh, J.D.; Andersson, M.L.; Eliasson, E.; Bjorkhem-Bergman, L. Seasonal variation in blood drug concentrations and a potential relationship to vitamin D. Drug Metab. Dispos. 2011, 39, 933–937. [Google Scholar] [CrossRef] [PubMed] [Green Version]
- Moan, J.; Juzeniene, A. Solar radiation and human health. J. Photochem. Photobiol. B 2011, 101, 109–110. [Google Scholar] [CrossRef] [Green Version]
- Cusato, J.; Mula, J.; Palermiti, A.; Manca, A.; Antonucci, M.; Avataneo, V.; De Vivo, E.D.; Ianniello, A.; Calcagno, A.; Di Perri, G.; et al. Seasonal Variation of Antiretroviral Drug Exposure during the Year: The Experience of 10 Years of Therapeutic Drug Monitoring. Biomedicines 2021, 9, 1202. [Google Scholar] [CrossRef]
- Lindh, J.D.; Bjorkhem-Bergman, L.; Eliasson, E. Vitamin d and drug-metabolising enzymes. Photochem. Photobiol. Sci. 2012, 11, 1797–1801. [Google Scholar] [CrossRef] [PubMed]
- Andes, D.; Pascual, A.; Marchetti, O. Antifungal therapeutic drug monitoring: Established and emerging indications. Antimicrob. Agents Chemother. 2009, 53, 24–34. [Google Scholar] [CrossRef] [PubMed] [Green Version]
- Allegra, S.; Fatiguso, G.; Francia, S.; Pirro, E.; Carcieri, C.; Cusato, J.; Nicolo, A.; Avataneo, V.; Perri, G.D.; D’Avolio, A. Pharmacogenetic of voriconazole antifungal agent in pediatric patients. Pharmacogenomics 2018, 19, 913–925. [Google Scholar] [CrossRef] [PubMed]
- Ramasamy, A.; Trabzuni, D.; Forabosco, P.; Smith, C.; Walker, R.; Dillman, A.; Sveinbjornsdottir, S.; Hardy, J.; Weale, M.E.; Ryten, M. Genetic evidence for a pathogenic role for the vitamin d3 metabolizing enzyme cyp24a1 in multiple sclerosis. Mult. Scler. Relat. Disord 2014, 3, 211–219. [Google Scholar] [CrossRef] [PubMed] [Green Version]
- Yin, K.; Agrawal, D.K. Vitamin d and inflammatory diseases. J. Inflamm. Res. 2014, 7, 69–87. [Google Scholar] [PubMed] [Green Version]
- Ramos-Lopez, E.; Bruck, P.; Jansen, T.; Pfeilschifter, J.M.; Radeke, H.H.; Badenhoop, K. Cyp2r1-, cyp27b1- and cyp24-mrna expression in german type 1 diabetes patients. J. Steroid. Biochem. Mol. Biol. 2007, 103, 807–810. [Google Scholar] [CrossRef] [PubMed]
- Carpenter, T.O.; Zhang, J.H.; Parra, E.; Ellis, B.K.; Simpson, C.; Lee, W.M.; Balko, J.; Fu, L.; Wong, B.Y.; Cole, D.E. Vitamin d binding protein is a key determinant of 25-hydroxyvitamin d levels in infants and toddlers. J. Bone Miner. Res. 2013, 28, 213–221. [Google Scholar] [CrossRef] [PubMed]
- Malik, S.; Fu, L.; Juras, D.J.; Karmali, M.; Wong, B.Y.; Gozdzik, A.; Cole, D.E. Common variants of the vitamin d binding protein gene and adverse health outcomes. Crit. Rev. Clin. Lab. Sci. 2013, 50, 1–22. [Google Scholar] [CrossRef] [PubMed] [Green Version]
- Rahmadhani, R.; Zaharan, N.L.; Mohamed, Z.; Moy, F.M.; Jalaludin, M.Y. The associations between vdr bsmi polymorphisms and risk of vitamin d deficiency, obesity and insulin resistance in adolescents residing in a tropical country. PLoS ONE 2017, 12, e0178695. [Google Scholar] [CrossRef] [PubMed] [Green Version]
- Yu, D.; Shang, Y.; Luo, S.; Hao, L. The taqi gene polymorphisms of vdr and the circulating 1,25-dihydroxyvitamin d levels confer the risk for the keloid scarring in chinese cohorts. Cell. Physiol. Biochem. 2013, 32, 39–45. [Google Scholar] [CrossRef] [PubMed]
- Soldin, O.P.; Mattison, D.R. Sex differences in pharmacokinetics and pharmacodynamics. Clin. Pharm. 2009, 48, 143–157. [Google Scholar] [CrossRef] [PubMed] [Green Version]
- Cheng, L.; Xiang, R.; Liu, F.; Li, Y.; Chen, H.; Yao, P.; Sun, F.; Xia, P. Therapeutic drug monitoring and safety of voriconazole in elderly patients. Int. Immunopharmacol. 2020, 78, 106078. [Google Scholar] [CrossRef] [PubMed]
- Fatiguso, G.; Favata, F.; Zedda, I.; Nicolò, A.D.; Cusato, J.; Avataneo, V.; Allegra, S.; Pensi, D.; Perri, G.D.; D’Avolio, A. Development and full validation of a hplc-ms method for quantification of novel isavuconazole and four other antifungal drugs in human plasma sample. In Proceedings of the 4th Annual European Congress of Clinical Mass Spectometry (MSACL), Salzburg, Austria, 10–14 September 2017. [Google Scholar]


| Voriconazole | Posaconazole | Itraconazole | |
|---|---|---|---|
| No. of patients | 357 | 136 | 143 |
| Caucasians, n (%) | 300 (84%) | 125 (91.9%) | 84 (58.7%) |
| Sex (female), n (%) | 235 (66.2%) | 66 (48.5%) | 87 (56.9%) |
| Age,average ± SD | 42.51 ± 25.01 | 46.70 ± 19.92 | 8.78 ± 4.70 |
| BMI, average ± SD | 21.98 ± 5.29 | 24.50 ± 4.52 | 17.13 ± 5.22 |
| Posology, n (%) | 200 BID 184(54.6%) 300 BID 41 (12.2%) 250 BID 14 (4.2%) 150 BID 14 (4.2%) 400 BID 12 (3.6%) 100 BID 10 (3%) others 82 (18.2%) | 200 TID 67 (51.5%) 200 BID 23 (17.7%) 400 BID 22 (16.9%) others 24 (13.9) | 50 BID 27 (21.8%) 100 BID 23 (18.5%) 200 BID 11 (8.9%) 40 BID 10 (0.1%) others 72 (50.7) |
| Administration, n (%) | Oral 192 (53.9%) Endovenous 164 (46.1%) | Oral: 134 (98.5%) Endovenous: 2 (1.5%) | Oral: 137 (95.8%) Endovenous: 6 (4.2%) |
| Sepsis, n (%) | 8 (2.2%) | 0 | 0 |
| HIV, n (%) | 4 (1.1%) | 0 | 0 |
| Altered liver function, n (%) | 53 (14.9%) | 11 (8.1%) | 8 (5.6%) |
| Altered kidney function, n (%) | 13 (3.7%) | 8 (5.9%) | 5 (3.5%) |
| Creatinin, average ± SD | 0.85 ± 0.67 | 0.76 ± 0.39 | 0.48 ± 0.47 |
| Voriconazole Plasma Concentration > 1000 ng/mL | Voriconazole Plasma Concentration > 5000 ng/mL | |||||||
|---|---|---|---|---|---|---|---|---|
| Univariate | Multivariate | Univariate | Multivariate | |||||
| p-Value | aOR (95% IC) | p-Value | aOR (95% IC) | p-Value | aOR (95% IC) | p-Value | aOR (95% IC) | |
| Caucasian | 0.002 | 2.52 [1.40; 4.5] | 0.020 | 2.06 [1.12; 3.80] | 0.118 | 2.037 [0.834; 4.976] | 0.112 | 2.086 [0.842; 5.465] |
| years > 50 years old | 0.015 | 1.81 [1.12; 2.92] | 0.519 | 1.197 [0.693; 2.066] | ||||
| BMI > 25 kg/m2 | 0.270 | 1.37 [0.78; 2.41] | 0.750 | 0.902 [0.651; 1.743] | ||||
| Sex (Female) | 0.185 | 0.72 [0.44; 1.17] | 0.055 | 0.542 [0.290; 1.014] | 0.069 | 0.555 [0.294; 1.047] | ||
| VDR FokI TC/CC | 0.087 | 1.70 [0.93; 3.12] | ||||||
| VDR FokI CC | 0.101 | 1.580 [0.0915; 2.727] | ||||||
| VDR Cdx2 AG/GG | 0.407 | 0.62 [0.21; 1.90] | ||||||
| VDR Cdx2GG | 0.642 | 0.879 [0.511–1.513] | ||||||
| VDR BsmI GA/AA | 0.142 | 1.43 [0.89; 2.30] | ||||||
| VDR BsmI AA | 0.099 | 1.771 [0.897; 3.496] | ||||||
| VDR ApaI AA | 0.644 | 0.89 [0.53; 1.47] | 0.957 | 1.016 [0.562; 1.838] | ||||
| VDR TaqI CC | 0.898 | 1.04 [0.56; 1.95] | 0.819 | 0.819 [0.474; 1.415] | ||||
| CYP24A1 22776 TT | 0.451 | 1.31 [0.65; 2.60] | 0.335 | 0.659 [0.283; 1.536] | ||||
| CYP24A1 8620 GG | 0.553 | 1.18 [0.68; 2.07] | 0.406 | 1.295 [0.704; 2.380] | ||||
| CYP24A1 3999 CC | 0.023 | 1.95 [1.10;3.47] | 0.034 | 1.89 [1.05; 3.40] | ||||
| CYP24A1 3999 TC/CC | 0.102 | 2.010 [0.871; 4.636] | ||||||
| CYP27B1 + 2838 TT | 0.005 | 1.99 [1.24; 3.22] | 0.013 | 1.87 [1.14; 3.06] | 0.513 | 1.189 [0.697; 2.063] | ||
| CYP27B1 − 1260 TT | 0.601 | 0.82 [0.39; 1.74] | 0.247 | 1.612 [0.718; 3.618] | ||||
| GC 1296 AC/CC | 0.352 | 0.70 [0.42;1.36] | 0.045 | 2.239 [1.019; 4.921] | 0.037 | 2.349 [1.054; 5.236] | ||
| Endovenus administration | 0.615 | 1.13 [0.71; 1.81] | 0.073 | 1.647 [0.955; 2.842] | 0.033 | 1.833 [1.049; 3.202] | ||
| Posaconazole Plasma Concentrations > 700 ng/mL | ||||
|---|---|---|---|---|
| Univariate | Multivariate | |||
| p-Value | aOR (95% IC) | p-Value | aOR (95% IC) | |
| Caucasian | 0.193 | 0.435 [0.124; 1.522] | ||
| Age > 50 years | 0.577 | 0.806 [0.378; 1.720] | ||
| BMI > 25 kg/m2 | 0.794 | 1.106 [0.519; 2.354] | ||
| Sex (Female) | 0.074 | 0.498 [0.232; 1.070] | ||
| VDRFokI CC | 0.750 | 1.130 [0.533; 2.398] | ||
| VDRCdx2 AG/GG | NC | NC | ||
| VDRBsmI AA | 0.550 | 0.697 [0.214; 2.271] | ||
| VDRApaI AA | 0.966 | 0.983 [0.439; 2.201] | ||
| VDRTaqI CC | 0.281 | 1.765 [0.629; 4.959] | ||
| CYP24A122776 CT/TT | 0.350 | 0.673 [0.294; 1.542] | ||
| CYP24A18620 GG | 0.147 | 2.170 [0.761; 6.186] | ||
| CYP24A13999 CC | 0.178 | 1.705 [0.784; 3.709] | ||
| CYP27B1 + 2838 CT/TT | 0.022 | 0.139 [0.026; 0.751] | ||
| CYP27B1 − 1260 GT/TT | 0.022 | 7.197 [1.332; 38.886] | 0.009 | 15.479 [1.961;122.197] |
| GC1296 CC | 0.050 | 0.355 [0.126; 1.001] | 0.036 | 0.286 [0.088; 0.922] |
| Endovenous administration | NC | NC | ||
| Itraconazole Plasma Concentrations > 500 ng/mL (A) | Itraconazole Plasma Concentrations > 1000 ng/mL (B) | |||||||
|---|---|---|---|---|---|---|---|---|
| Univariate | Multivariate | Univariate | Multivariate | |||||
| p-Value | aOR (95% IC) | p-Value | aOR (95% IC) | p-Value | aOR (95% IC) | p-Value | aOR (95% IC) | |
| Caucasian | 0.022 | 0.443 [0.221; 0.889] | 0.072 | 0.412 [0.157; 1.083] | ||||
| years > 50 years old | 0.322 | 1.424 [0.708; 2.866] | ||||||
| years < 9 years old | 0.848 | 1.099 [0.419; 4.179] | ||||||
| BMI > 25 kg/m2 | 0.820 | 0.865 [2.217; 3.023] | 0.561 | 0.536 [0.065; 4.394] | ||||
| Sex (Female) | 0.079 | 1.860 [0.930; 3.721] | 0.006 | 4.469 [1.526; 13.094] | 0.007 | 4.720 [1.531; 14.552] | ||
| VDR FokI CC | 0.136 | 0.546 [0.246; 1.209] | ||||||
| VDR FokI TT/CC | 0.032 | 0.318 [0.112; 0.906] | ||||||
| VDR Cdx2 GG | 0.873 | 0.946 [0.476; 1.880] | 0.519 | 0.732 [0.284; 1.888] | ||||
| VDR BsmI GA/AA | 0.003 | 0.350 [0.173; 0.707] | 0.002 | 0.333 [0.164; 0.678] | 0.041 | 0.357 [0.133; 0.957] | ||
| VDR ApaI CA/AA | 0.188 | 0.594 [0.273; 1.290] | ||||||
| VDR ApaI AA | 0.050 | 2.618 [1.001; 6.847] | ||||||
| VDR TaqI TC/CC | 0.263 | 0.675 [0.339; 1.334] | 0.177 | 2.082 [0.717; 6.041] | 0.034 | 4.050 [1.114; 14.717] | ||
| CYP24A1 22776 TT | 0.487 | 1.359 [0.572; 3.231] | 0.691 | 0.767 [0.207; 2.839] | ||||
| CYP24A1 8620 AG/GG | 0.071 | 0.517 [2.552; 1.258] | ||||||
| CYP24A1 8620 GG | 0.296 | 0.502 [0.138; 1.826] | ||||||
| CYP24A1 3999 CC | 0.157 | 1.702 [0.815; 3.555] | 0.947 | 1.036 [0.369; 2.908] | ||||
| CYP27B1 + 2838 CT/TT | NC | |||||||
| CYP27B1 + 2838 TT | 0.093 | 2.507 [0.058; 7.239] | ||||||
| CYP27B1 − 1260 GT/TT | 0.063 | 0.519 [0.260; 1.035] | 0.022 | 0.304 [0.109; 0.843] | 0.008 | 0.194 [0.058; 0.650] | ||
| GC 1296 AC/CC | 0.161 | 0.545 [0.234; 1.273] | ||||||
| GC 1296 CC | 0.290 | 1.768 [0.615; 6.078] | ||||||
| Endovenusadministration | 0.984 | 1.796 [0.349; 9.240] | 0.847 | 1.242 [0.137; 11.221] | ||||
Publisher’s Note: MDPI stays neutral with regard to jurisdictional claims in published maps and institutional affiliations. |
© 2022 by the authors. Licensee MDPI, Basel, Switzerland. This article is an open access article distributed under the terms and conditions of the Creative Commons Attribution (CC BY) license (https://creativecommons.org/licenses/by/4.0/).
Share and Cite
Cusato, J.; Palermiti, A.; Manca, A.; Mula, J.; Antonucci, M.; De Nicolò, A.; Allegra, S.; De Francia, S.; Chiara, F.; Di Perri, G.; et al. Antifungal Drug Plasma Exposures: A Possible Contribution of Vitamin D-Related Gene Variants. Pharmaceuticals 2022, 15, 630. https://0-doi-org.brum.beds.ac.uk/10.3390/ph15050630
Cusato J, Palermiti A, Manca A, Mula J, Antonucci M, De Nicolò A, Allegra S, De Francia S, Chiara F, Di Perri G, et al. Antifungal Drug Plasma Exposures: A Possible Contribution of Vitamin D-Related Gene Variants. Pharmaceuticals. 2022; 15(5):630. https://0-doi-org.brum.beds.ac.uk/10.3390/ph15050630
Chicago/Turabian StyleCusato, Jessica, Alice Palermiti, Alessandra Manca, Jacopo Mula, Miriam Antonucci, Amedeo De Nicolò, Sarah Allegra, Silvia De Francia, Francesco Chiara, Giovanni Di Perri, and et al. 2022. "Antifungal Drug Plasma Exposures: A Possible Contribution of Vitamin D-Related Gene Variants" Pharmaceuticals 15, no. 5: 630. https://0-doi-org.brum.beds.ac.uk/10.3390/ph15050630